
5
Funding
The majority of astronomical research in the United States is funded directly from the astronomy budgets of the NSF and the Office of Space Science (OSS) at NASA. Lesser amounts come from a variety of other sources such as those described in Appendix E.
The direct funding from NASA and NSF falls into four broad categories:
-
Operations. This includes operations funding for NASA astronomy missions and for the ground-based observatories of NSF and NASA. NASA funding for these activities is generally the mission operations part of the MO&DA budget.
-
Instrumentation. This includes support for instrumentation, both advanced technology instrumentation and facility instrumentation, plus technology development at both NSF and NASA.
-
Science and Analysis Support. This includes support for the observations, data analysis, and astronomical theory programs at NASA and for the individual investigator grants program of NSF. At NASA, funding for this category comes both from the data analysis (DA) part of MO&DA and from NASA's R&A budget.
-
Construction. This includes major facility or mission design, development, and construction, such as the construction of AXAF/Chandra by NASA and the Very Long Baseline Array (VLBA) facility, the Gemini telescopes, and the Green Bank Telescope (GBT) by NSF. At NSF, major construction is included in the major research equipment (MRE) program line.
Figure 2.2 in Chapter 2 provides a broad overview of astronomy funding since 1981 with program plan projections for FY 1999. The following sections deal with more detailed aspects of the NSF and NASA budgets. For NSF, the committee considers the Division of Astronomical Sciences (AST) budget in total and comments only briefly on extradivisional funding for the construction of facilities. NSF funding for MRE construction is decided at the agency level and not in the divisions. For NASA, only the R&A budget is considered, not the capital budgets for mission design, development, construction, and launch. NASA technology development funding is also mentioned briefly.
5.1
THE NSF BUDGET
Astronomy at the National Science Foundation is funded primarily in the AST or in the Mathematics and Physical Sciences (MPS) Directorate. Figure 5.1 and Table 5.1 show the trends in research and related activities (R&RA) funding for NSF as a whole, for the MPS Directorate, and for the AST. Based on figures from the American Association for the Advancement of Science (AAAS), total NSF R&RA funding has grown significantly faster than inflation over the past decade, nonconstruction MPS funding has increased slightly with respect to inflation, and nonconstruction AST funding has fallen behind.
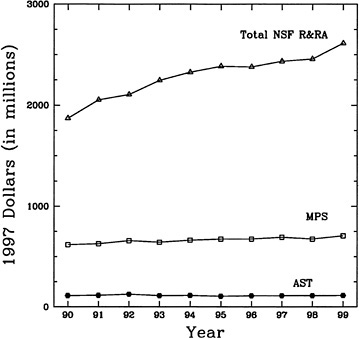
FIGURE 5.1 Total NSF, MPS, and AST funding, FY 1990-1999, in 1997 dollars. Top curve is the total NSF R&RA budget (R. Konkel, from NSF Congressional Budget Summary) and does not include construction. Lower curves are for the MPS Directorate and the AST, also excluding construction (MRE) funding; these lines represent the essential “operating” budgets of the Mathematics and Physical Sciences Directorate and the Division of Astronomical Sciences.
Comparing the last three years of the reporting period to the first three years, NSF R&RA increased approximately 15 percent relative to inflation, the MPS line (without MRE) increased 9 percent, and AST decreased 5 percent. Part of this relative change is due to small increments to the AST budget early in the decade for infrastructure, and a large part is due to the creation of new R&RA programs and new priorities at NSF including the MRE construction line, which is separate from MPS or AST. Note that some funding for astrophysics, particularly for theory, atomic and molecular physics, submillimeter and IR astronomy at the South Pole, and solar physics, comes from outside the AST budget (primarily from the NSF MPS, OPP (Office of Polar Programs), and ATM (Division of Atmospheric Sciences). Table 5.2 shows the detailed funding of these other areas. Astronomy as a whole at the NSF has benefited significantly from the MRE program as detailed below, but the base NSF “operating” budget for astronomy has declined, relative to other components of the NSF.
TABLE 5.1 NSF Budget Totals in Millions of 1997 Dollars, 1990 to 1999
|
Year |
AST |
AST+MREa |
Other NSFb |
MPS |
MPS+MRE |
NSF R&D |
|||||
|
Budget |
% |
Budget |
% |
Budget |
TA%c |
Budget |
% |
Budget |
% |
||
|
1990 |
112.85 |
(5.4) |
125.72 |
(6.0) |
18.87 |
(7.5) |
618.64 |
(29.7) |
623.947 |
(30.0) |
2,080.626 |
|
1991 |
115.21 |
(5.3) |
212.33 |
(9.7) |
21.90 |
(10.7) |
627.61 |
(28.6) |
653.766 |
(29.8) |
2,193.511 |
|
1992 |
126.69 |
(5.7) |
150.00 |
(6.8) |
23.32 |
(7.8) |
658.06 |
(29.6) |
700.788 |
(31.6) |
2,220.720 |
|
1993 |
112.23 |
(5.1) |
127.68 |
(5.8) |
23.99 |
(6.9) |
643.10 |
(29.1) |
680.461 |
(30.8) |
2,210.757 |
|
1994 |
114.00 |
(4.7) |
132.25 |
(5.5) |
25.34 |
(6.5) |
662.96 |
(27.5) |
681.223 |
(28.3) |
2,406.653 |
|
1995 |
106.77 |
(4.3) |
149.66 |
(6.0) |
25.15 |
(7.0) |
674.94 |
(26.9) |
806.695 |
(32.2) |
2,506.276 |
|
1996 |
110.74 |
(4.5) |
110.74 |
(4.5) |
28.40 |
(5.7) |
675.37 |
(27.6) |
746.932 |
(30.6) |
2,444.785 |
|
1997 |
112.73 |
(4.7) |
112.73 |
(4.7) |
27.77 |
(5.8) |
693.45 |
(28.6) |
748.500 |
(30.9) |
2,424.000 |
|
1998 |
111.62 |
(4.6) |
125.47 |
(5.1) |
29.73 |
(6.3) |
675.09 |
(27.5) |
731.400 |
(29.0) |
2,456.778 |
|
1999d |
114.15 |
(4.4) |
122.81 |
(4.7) |
26.34 |
(5.7) |
706.83 |
(27.1) |
736.670 |
(28.2) |
2,612.127 |
|
NOTE: Acronyms are defined in Appendix H. a These numbers include VLBA construction, which was authorized before the MRE account was created in 1991, and the GBT, a special construction project authorized in full in 1991. They do not include LIGO, which was motivated primarily by the physics community. b Other NSF funding for astronomy from the MPS Directorate, OPP, and OMA. c Total astronomy percent. d 1999 numbers are as planned for the program. |
|||||||||||
TABLE 5.2 Other NSF Astronomy and Astrophysics Support in Millions of 1997 Dollars, 1990 to 1999
|
Year |
Physics |
OPP |
OMA |
ATM |
Total Other a |
PHY MRE+OC b |
LIGO OPS c |
|
1990 |
9.39 |
0.70 |
0.00 |
8.78 |
18.87 |
0.00 |
0.00 |
|
1991 |
9.44 |
3.60 |
0.00 |
8.86 |
21.90 |
80.56 |
0.00 |
|
1992 |
9.59 |
4.48 |
0.00 |
9.25 |
23.32 |
17.91 |
0.00 |
|
1993 |
9.77 |
4.58 |
0.00 |
9.64 |
23.99 |
21.95 |
0.00 |
|
1994 |
9.98 |
5.23 |
0.00 |
10.13 |
25.34 |
0.00 |
0.00 |
|
1995 |
10.17 |
5.13 |
0.00 |
9.85 |
25.15 |
88.91 |
0.00 |
|
1996 |
10.39 |
5.17 |
3.06 |
9.78 |
28.40 |
71.58 |
0.00 |
|
1997 |
10.62 |
5.24 |
1.90 |
10.01 |
27.77 |
55.00 |
0.30 |
|
1998 |
10.64 |
5.16 |
3.86 |
10.07 |
29.73 |
25.54 |
7.43 |
|
1999 |
9.77 |
5.58 |
0.87 |
10.12 |
26.34 |
0.00 |
21.61 |
|
NOTE: Acronyms are defined in Appendix H. a Does not include LIGO or LIGO operations. b Physics MRE (LIGO) plus GBT construction. c LIGO operations. |
|||||||
5.1.1
Total NSF R&RA Budget and AST and MPS Fractions
Table 5.1 compares the AST and AST + MRE and the MPS and MPS + MRE budgets to the total NSF R&D budget for 1990 to 1999. The total NSF R&D budget is taken from the AAAS summary and includes NSF R&RA plus MRE construction funding (hence, the R&D label); the AST and MPS budgetary figures are from those NSF units. The number in parentheses is the fraction of the total NSF R&RA budget that the figure given represents for each year. Funding for astronomy and astrophysics from outside the AST line is also included. The level of non-AST (and nonconstruction) NSF funding for astronomy averaged around 20 percent of the AST budget level over the past decade, except for an increase in the last two years associated with the start of LIGO operations.
The NSF AST line, not including MRE construction funding, averaged 5.5 percent of the NSF budget in the first three years of the decade and only 4.6 percent in the last three, a relative decrease of approximately 20 percent. Including the highly variable MRE funding (but not LIGO), AST + MRE represented approximately 7.7 percent of the NSF budget in the first three years and 4.8 percent in the last three, a relative decrease of approximately 30 percent. Including the NSF funding of astronomy and astrophysics outside AST and neglecting the year in which $80 million was provided for the GBT, the average for three of the first four years of the decade was 7.3 percent of the NSF R&D budget, and 5.9 percent for the last three. Similarly, MPS and MPS + MRE averaged 29.3 and 30.5 percent of the NSF budget at the beginning of the decade, and 27.7 and 29.4 percent at the end, relative decreases of only approximately 6 and 4 percent, respectively.
A further breakdown of the overall NSF budget for astronomy is given in Table 5.3 in current-year dollars and in Table 5.4 in 1997 dollars. Other sources of the budget for astrophysics at NSF are detailed in Table 5.5 in current-year dollars and in Table 5.6 in 1997 dollars. The deflators used to convert into 1997 dollars are given in Appendix E. The budget figures for FY 1999 are estimates. Most astronomy research funded by the NSF is contained in the AST budget.
Overall funding for astronomy at the NSF through the AST has not kept pace with inflation even when adjustments are made for infrastructure additions to the National Radio Astronomy Observatory (NRAO) budget in the early 1990s (see below).
TABLE 5.3 NSF Division of Astronomical Sciences Budget for FY 1990 to FY 1999 in Thousands of Current-Year Dollars
|
1990 |
1991 |
1992 |
1993 |
1994 |
1995 |
1996 |
1997 |
1998 |
1999 |
|
|
ATI |
6,315 |
6,820 |
8,572 |
7,883 |
8,702 |
8,066 |
7,100 |
7,980 |
5,938 |
|
|
MRI |
— |
— |
— |
— |
— |
— |
— |
— |
1,355 |
|
|
Facility |
‗ |
‗ |
‗ |
‗ |
‗ |
‗ |
2,450 |
208 |
617 |
____ |
|
Total instrumentation |
6,315 |
6,820 |
8,572 |
7,883 |
8,702 |
8,066 |
9,550 |
8,188 |
7,910 |
7,300 |
|
Extragalactic |
6,318 |
6,748 |
7,319 |
6,673 |
8,462 |
7,117 |
6,625 |
7,237 |
7,775 |
|
|
Galactic |
3,558 |
3,695 |
3,834 |
3,683 |
3,990 |
3,557 |
3,560 |
4,115 |
3,800 |
|
|
Planetary |
1,137 |
1,058 |
1,068 |
537 |
1,461 |
1,499 |
1,280 |
1,812 |
1,718 |
|
|
Particle |
— |
— |
— |
— |
— |
— |
— |
— |
5 |
|
|
Stellar |
5,161 |
5,512 |
6,020 |
6,213 |
6,278 |
6,381 |
5,999 |
6,145 |
6,417 |
|
|
STC |
2,058 |
2,050 |
2,300 |
2,442 |
2,544 |
2,540 |
2,540 |
2,540 |
2,108 |
|
|
CDP |
1,052 |
— |
— |
— |
— |
— |
— |
— |
— |
|
|
ESPa |
— |
— |
— |
— |
1,993 |
1,937 |
2,388 |
3,316 |
4,139 |
|
|
KDI |
— |
— |
— |
— |
— |
— |
— |
— |
448 |
|
|
LEXEN |
‗ |
‗ |
‗ |
‗ |
‗ |
‗ |
‗ |
580 |
‗ |
____ |
|
Total research |
19,284 |
19,062 |
20,541 |
19,547 |
24,728 |
23,031 |
22,392 |
25,745 |
26,410 |
26,000 |
|
University radio |
7,001 |
7,634 |
8,038 |
8,538 |
7,270 |
7,055 |
7,055 |
7,440 |
7,000 |
|
|
NRAO |
30,204 |
31,108 |
34,465 |
29,215 |
29,021 |
29,370 |
30,005 |
30,000 |
30,513 |
31,840 |
|
NAIC |
6,219 |
8,532 |
10,903 |
9,475 |
8,640 |
7,709 |
8,292 |
8,265 |
8,265 |
8,950 |
|
RSM |
100 |
98 |
118 |
95 |
82 |
90 |
89 |
93 |
197 |
|
|
NOAO |
24,402 |
25,524 |
28,386 |
27,461 |
27,740 |
26,700 |
270,182 |
27,630 |
27,891 |
29,000 |
|
Gemini operations |
‗ |
‗ |
‗ |
‗ |
‗ |
‗ |
3,600 |
5,100 |
6,250 |
7,130 |
|
Total operations |
67,926 |
72,896 |
81,910 |
74,784 |
72,753 |
70,924 |
76,059 |
78,528 |
80,116 |
84,600 |
|
Undistributedb |
249 |
644 |
1,477 |
31 |
60 |
50 |
302 |
266 |
294 |
700 |
|
AST total |
93,774 |
99,422 |
112,500 |
102,245 |
106,243 |
102,071 |
108,303 |
112,727 |
114,730 |
118,600 |
|
VLBA |
10,700 |
10,300 |
8,700 |
— |
— |
— |
— |
— |
— |
— |
|
Gemini |
— |
4,000 |
12,000 |
14,070 |
17,013 |
41,000 |
— |
— |
4,000 |
— |
|
ALMA design and development |
— |
— |
— |
— |
— |
— |
— |
— |
9,000 |
9,000 |
|
GBT |
‗ |
69,520 |
‗ |
‗ |
‗ |
‗ |
‗ |
‗ |
‗ |
‗ |
|
Total construction |
10,700 |
83,820 |
20,700 |
14,070 |
17,013 |
41,000 |
— |
— |
13,000 |
9,000 |
|
NOTE: Acronyms are defined in Appendix H. a Includes CAREER, PECASE, and POWRE awards. b Includes undistributed funds and special programs reserve. |
||||||||||
TABLE 5.4 NSF Division of Astronomical Sciences Budget for FY 1990 to FY 1999 in Thousands of 1997 Dollars
|
1990 |
1991 |
1992 |
1993 |
1994 |
1995 |
1996 |
1997 |
1998 |
1999 |
|
|
ATI |
7,599 |
7,903 |
9,653 |
8,653 |
9,337 |
8,437 |
7,260 |
7,980 |
5,833 |
|
|
MRI |
— |
— |
— |
— |
— |
— |
— |
— |
1,331 |
|
|
Facility |
‗ |
‗ |
‗ |
‗ |
‗ |
‗ |
2,505 |
208 |
606 |
____ |
|
Total instrumentation |
7,599 |
7,903 |
9,693 |
8,653 |
9,337 |
8,437 |
9,765 |
8,188 |
7,770 |
7,026 |
|
Extragalactic |
7,603 |
7,818 |
8,242 |
7,324 |
9,079 |
7,445 |
6,774 |
7,237 |
7,638 |
|
|
Galactic |
4,282 |
4,282 |
4,318 |
4,043 |
4,281 |
3,721 |
3,640 |
4,115 |
3,733 |
|
|
Planetary |
1,368 |
1,226 |
1,203 |
589 |
1,569 |
1,568 |
1,309 |
1,812 |
1,688 |
|
|
Particle |
— |
— |
— |
— |
— |
— |
— |
— |
5 |
|
|
Stellar |
6,211 |
6,387 |
6,779 |
6,820 |
6,736 |
6,675 |
6,134 |
6,145 |
6,304 |
|
|
STC |
2,477 |
2,375 |
2,590 |
2,681 |
2,730 |
2,657 |
2,597 |
2,540 |
2,071 |
|
|
CDP |
1,266 |
— |
— |
— |
— |
— |
— |
— |
— |
|
|
ESPa |
— |
— |
— |
— |
2,138 |
2,026 |
2,442 |
3,316 |
4,066 |
|
|
KDI |
— |
— |
— |
— |
— |
— |
— |
— |
440 |
|
|
LEXEN |
‗ |
‗ |
‗ |
‗ |
‗ |
‗ |
‗ |
580 |
‗ |
____ |
|
Total research |
23,206 |
22,088 |
23,132 |
21,457 |
26,532 |
24,091 |
22,896 |
25,745 |
25,943 |
25,024 |
|
University radio |
8,425 |
8,846 |
9,052 |
9,372 |
7,800 |
7,380 |
7,214 |
7,440 |
6,876 |
|
|
NRAO |
36,347 |
36,046 |
38,812 |
32,069 |
31,138 |
30,722 |
30,680 |
30,000 |
29,973 |
30,645 |
|
NAIC |
7,484 |
9,886 |
12,278 |
10,401 |
9,270 |
8,064 |
8,479 |
8,265 |
8,119 |
8,614 |
|
RSM |
120 |
114 |
133 |
104 |
88 |
94 |
91 |
93 |
194 |
|
|
NOAO |
29,365 |
29,576 |
31,966 |
30,144 |
29,764 |
27,928 |
27,625 |
27,630 |
27,398 |
27,911 |
|
Gemini operations |
‗ |
‗ |
‗ |
‗ |
‗ |
‗ |
3,681 |
5,100 |
6,139 |
6,862 |
|
Total operations |
81,740 |
84,468 |
92,241 |
82,090 |
78,061 |
74,188 |
77,770 |
78,528 |
78,699 |
81,424 |
|
Undistributedb |
300 |
746 |
1,663 |
34 |
64 |
52 |
309 |
266 |
289 |
674 |
|
AST total |
112,845 |
115,205 |
126,689 |
112,234 |
113,995 |
106,769 |
110,739 |
112,727 |
112,701 |
114,148 |
|
VLBA |
12,876 |
11,935 |
9,797 |
— |
— |
— |
— |
— |
— |
— |
|
Gemini |
— |
4,635 |
13,514 |
15,445 |
18,254 |
42,887 |
— |
— |
3,929 |
— |
|
ALMA design and development |
— |
— |
— |
— |
— |
— |
— |
— |
8,841 |
8,662 |
|
GBT |
‗ |
80,556 |
‗ |
‗ |
‗ |
‗ |
‗ |
‗ |
‗ |
‗ |
|
Total construction |
12,876 |
17,135 |
14,311 |
14,070 |
18,254 |
42,887 |
— |
— |
12,770 |
8,662 |
|
NOTE: Acronyms are defined in Appendix H. a Includes CAREER, PECASE, and POWRE awards. b Includes undistributed funds and special programs reserve. |
||||||||||
TABLE 5.5 NSF Other Astrophysics Budget for FY 1990 to FY 1999 in Thousands of Current-Year Dollars
|
1990 |
1991 |
1992 |
1993 |
1994 |
1995 |
1996 |
1997 |
1998 |
1999 |
|
|
MPS Astronomy |
7,800 |
8,150 |
8,520 |
8,900 |
9,300 |
9,720 |
10,160 |
10,620 |
11,100 |
11,400 |
|
OPP |
580 |
3,110 |
3,980 |
4,170 |
4,870 |
4,900 |
5,060 |
5,240 |
5,250 |
5,800 |
|
OMA |
— |
— |
— |
— |
— |
— |
2,990 |
1,900 |
3,930 |
900 |
|
ATM |
7,300 |
7,650 |
8,210 |
8,780 |
9,440 |
9,420 |
9,560 |
10,010 |
10,250 |
10,510 |
|
Total other |
15,680 |
18,910 |
20,710 |
21,850 |
23,610 |
24,040 |
27,770 |
27,770 |
30,530 |
28,610 |
|
LIGO operations |
‗ |
‗ |
‗ |
‗ |
‗ |
‗ |
‗ |
300 |
7,300 |
20,800 |
|
LIGO |
‗ |
‗ |
15,900 |
20,000 |
‗ |
85,000 |
70,000 |
55,000 |
26,000 |
‗ |
|
Total other construction |
— |
— |
15,900 |
20,000 |
— |
85,000 |
70,000 |
55,000 |
26,000 |
— |
|
NOTES: Acronyms are defined in Appendix H. LIGO operations have been ramping up since 1997 (figures from the LIGO project). |
||||||||||
TABLE 5.6 NSF Other Astrophysics Budget for FY 1990 to FY 1999 in Thousands of 1997 Dollars
|
1990 |
1991 |
1992 |
1993 |
1994 |
1995 |
1996 |
1997 |
1998 |
1999 |
|
|
MPS Astronomy |
9,390 |
9,440 |
9,590 |
9,770 |
9,980 |
10,170 |
10,390 |
10,620 |
10,639 |
9,769 |
|
OPP |
700 |
3,600 |
4,480 |
4,580 |
5,230 |
5,130 |
5,170 |
5,240 |
5,160 |
5,580 |
|
OMA |
— |
— |
— |
— |
— |
— |
3,060 |
1,900 |
3,860 |
870 |
|
ATM |
8,780 |
8,860 |
9,250 |
9,640 |
10,130 |
9,850 |
9,780 |
10,010 |
10,070 |
10,120 |
|
Total other |
18,870 |
21,900 |
23,320 |
23,990 |
25,340 |
25,150 |
28,400 |
27,770 |
29,729 |
26,339 |
|
LIGO operations |
‗ |
‗ |
‗ |
‗ |
‗ |
‗ |
‗ |
300 |
7,431 |
21,611 |
|
LIGO |
‗ |
‗ |
17,905 |
21,954 |
‗ |
88,912 |
71,575 |
55,000 |
25,540 |
‗ |
|
Total other construction |
— |
— |
17,905 |
21,954 |
— |
88,912 |
71,575 |
55,000 |
25,540 |
— |
|
NOTE: Acronyms are defined in Appendix H. |
||||||||||
5.1.2
NSF AST Overview
Figure 5.2 is the graphic representation of the NSF AST budget since 1990, broken into the three major nonconstruction categories. Shown is the total AST budget, not including the MRE capital funding for Gemini, the GBT, or the MMA/ALMA, as well as the budgets for operations, instrumentation, and research. Major construction is not currently part of the NSF AST budget but rather falls in the NSF MRE budget. It is included at the end of Table 5.3 and Table 5.4. The university-operated radio facilities were included in the scientific discipline grants programs before 1994, but these amounts have been moved from the research grants to the facilities line for consistency.
In 1997 dollars, the NSF AST budget was relatively flat over the decade, except for the infrastructure enhancement in 1992. Declines occurred during the middle of the decade in operations support for the national radio and optical observatories and the university radio observatories, although the downward trend of the first five years of the decade was reversed in the last four. The slight bump in the operations budgets in 1992 was due to funds provided to NRAO and the National Astronomy and
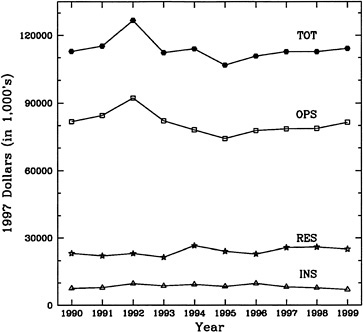
FIGURE 5.2 NSF Division of Astronomical Sciences budget in 1997 dollars. The top curve is the total AST budget. Lower curves are for total operations (OPS), research grants (RES), and instrumentation grants (INS) expenditures. Operation of private radio facilities is included in the operations line. The AST budget line does not include major construction funding under the MRE program. SOURCE: NSF.
Atmospheric Center (NAIC) for infrastructure as recommended in the 1991 Decadal Report. Instrumentation funding was flat or slightly declining, and the individual grants program saw a modest 10 to 12 percent increase over inflation during the same period. This can be tracked to the current inclusion in the AST budget of the Presidential Young Investigator (PYI; now CAREER) awards program. Even with the inclusion of these programs, research grants to individual investigators accounted for less than 22 percent of the NSF astronomy budget.
NSF funding for instrumentation was basically flat in 1997 dollars during the 1990s, with the exception of a one-year increment in 1996 for the facility instrumentation program. Gains in funding through that program and through the Major Research Instrumentation (MRI) program were offset by losses in the long-running Advanced Technology and Instrumentation (ATI) program, despite the strong recommendation of the 1995 NRC report A Strategy for Ground-Based Optical and Infrared Astronomy to increase instrumentation funding to properly utilize the significant increases in telescope collecting area available as the result of new, large-telescope construction from 1993 to 2003.
NSF's AST has four primary “field” subdivisions: extragalactic, galactic, planetary, and stellar. Within these fields, there has been a modest decrease in funding for galactic research, and an increase for planetary, while stellar and extragalactic have remained relatively flat (see Table 5.4 ).
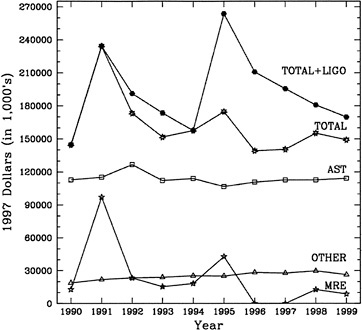
FIGURE 5.3 Total NSF budget for astronomy and astrophysics in 1997 dollars, 1990 to 1999. The top curve is the total of the budget for AST, MRE, other, and LIGO. LIGO support is included in this total, but not in astronomy-related MRE, since this is primarily a physics program. The next curve down is the total of AST, MRE, and other budget, without LIGO. Lower curves show the breakouts for AST; astronomy-related MRE, including the VLBA, GBT, Gemini, and ALMA but not LIGO; and other support for astronomy and astrophysics from MPS, OPP, ATM, and OMA. SOURCE: NSF.
In the operations budget, various lumps in the funding histories of the national observatories are associated with intermediate to small construction projects. For example, the large excess for NRAO in 1990 was the funding to repair the telescope tracks, and in the NAIC budget in and around 1992, funding for the Arecibo upgrade. The NSF budget has separate line items for the construction for Gemini, the GBT, and now ALMA. The U.S. share of operations support for Gemini as a separate line item was one of the major recommendations of the 1995 OIR strategy report. A reasonable fraction of the Gemini operations line is dedicated to instrumentation development, but the access and administrative costs for U.S. astronomers (telescope time allocations, U.S. science oversight, etc.) are contained in the NOAO budget.
Note that, including operations for the national and university radio observatories and grants funding, slightly less than half of the NSF AST budget during the 1990s was used to support ground-based radio astronomy.
Figure 5.3 recapitulates total NSF funding for astronomy and astrophysics from 1990 to 1999, including both AST MRE and MPS MRE (specifically LIGO) and the additional astronomy- and astrophysics-related funding from MPS, OPP, ATM, and the NSF Office of Multidisciplinary Affairs
(OMA). The spikes in the total funding in 1991 and 1995 are associated with major increments for the construction of the GBT (a lump sum in one year) and LIGO.
5.1.3
Major Research Equipment
In the period under study, three major facilities or telescopes have been funded through the NSF MRE program line and an additional large telescope, the GBT, as a special appropriation. The VLBA, which is described in more detail below, is operated by NRAO, and its construction was funded at the end of last decade and the beginning of this. The U.S. contribution to the twin Gemini 8-meter telescopes and part of their initial instrument complement, $88 million, was funded primarily over five years in the middle of the decade. The initial design and development funding for ALMA, to be operated by NRAO, was obtained in the last few years. Operations support for the VLBA, Gemini, and ALMA is included or to be included in the AST budget.
5.1.4
Grants Program
As part of its study of the NSF grants program for astronomy, the committee assigned categories, similar to those used for the publication and demographic analyses in Section 4.2, to the 1,709 NSF grants in the Division of Astronomical Sciences that were active during FY 1986 to FY 1997. The grant amounts were over the durations of the grants, typically three years, so that the time period covered was not well defined; the funding period on some grants preceded FY 1986 by a few years and, on others, extended beyond FY 1997 by a few years. The results are shown by field in Table 5.7 and by discipline in Table 5.8.
The disciplines listing includes separate entries for the Center for Particle Astrophysics and the university radio observatories. The Center for Particle Astrophysics funded a combination of theoretical, experimental, and observational research. The national observing facilities have been categorized under administrative. The NSF also funds university radio facilities (Haystack, Owens Valley [OVRO], Caltech Submillimeter Observatory [CSO], Five College Radio Astronomy Observatory [FCRAO], the Berkeley-Illinois-Maryland Array [BIMA]), and these are in a separate category. It is clear that the dominant components of NSF funding are directed to ground-based optical and radio observing. Wavelength regions that are best observed from space are funded primarily by NASA. The results indicate that theory is a small part of the NSF AST funding profile, although it is a more substantial part of the funding for individual investigator grants, and a significant amount of theory funding for astrophysics is included in the MPS Physics Division budget.
In the categorization by field, grants were assigned to a topic unless the range of activities in the grant did not allow this. This resulted in an additional category for education, which included general Research Experience for Undergraduates (REU) programs, and one for meetings, which included support for broad meetings. The Center for Particle Astrophysics was assigned to the cosmology category and makes up a significant part of it. With the categorization used here, the instrumentation and stellar fields are the dominant ones.
Note that in Table 5.7, “grants” includes the grant funding for operations at both national and privately run observatories.
TABLE 5.7 Integrated NSF Division of Astronomical Sciences Grants by Field, FY 1986 to FY 1997
|
Description |
Number of Awards |
Percentage of Total Awards |
All-Year Value (dollars) |
Percentage of All-Year Total |
Percentage of Total, Excluding Operations |
|
Active galactic nuclei |
122 |
7.1 |
28,185,072 |
1.9 |
7.2 |
|
Cosmology |
84 |
4.9 |
48,986,209 |
3.4 |
12.5 |
|
Education |
18 |
1.1 |
2,209,949 |
0.2 |
0.6 |
|
Experimental particles and fields |
14 |
0.8 |
2,373,144 |
0.2 |
0.6 |
|
Galaxies and clusters |
253 |
14.8 |
54,425,745 |
3.7 |
13.9 |
|
Interstellar medium |
179 |
10.5 |
42,099,982 |
2.9 |
10.8 |
|
Instrumentation |
207 |
12.1 |
84,893,288 |
5.8 |
21.7 |
|
Meetings |
28 |
1.6 |
4,117,071 |
0.3 |
1.1 |
|
Not applicable |
4 |
0.2 |
1,027,993 |
0.1 |
0.3 |
|
Operations |
54 |
3.2 |
1,064,334,988 |
73.1 |
— |
|
Planetary |
129 |
7.5 |
17,376,983 |
1.2 |
4.4 |
|
Star formation |
57 |
3.3 |
10,330,071 |
0.7 |
2.6 |
|
Solar |
54 |
3.2 |
8,283,322 |
0.6 |
2.1 |
|
Stellar |
506 |
29.6 |
86,820,969 |
6.0 |
22.2 |
|
Total |
1,709 |
100.0 |
1,455,464,786 |
100.0 |
100.0 |
TABLE 5.8 Integrated NSF Astronomy Grants, FY 1986 to FY 1997
|
Description |
Number of Awards |
Percentage of Total Awards |
All Year Value (dollars) |
Percentage of All Year Total |
Percentage of Total, Individual Investigator |
|
National observatories |
7 |
0.4 |
975,883,736 |
67.0 |
|
|
University radio observatories |
43 |
2.5 |
117,189,441 |
8.1 |
|
|
Center for Particle Astrophysics |
2 |
0.1 |
23,910,919 |
1.6 |
|
|
Administrative, computers, meetings |
111 |
6.5 |
15,221,893 |
1.0 |
|
|
Lab or experimental astrophysics |
36 |
2.1 |
6,627,461 |
0.5 |
2.1 |
|
Experimental particles and fields |
6 |
0.4 |
1,177,622 |
0.1 |
0.4 |
|
X-ray and gamma ray |
18 |
1.1 |
3,293,955 |
0.2 |
1.0 |
|
Observational IR |
29 |
1.7 |
6,436,037 |
0.4 |
2.0 |
|
Observational optical |
839 |
49.1 |
182,489,676 |
12.5 |
56.5 |
|
Observational radio |
217 |
12.7 |
46,690,576 |
3.2 |
14.4 |
|
Observational UV |
1 |
0.1 |
195,000 |
0.0 |
0.1 |
|
Theory |
400 |
23.4 |
76,348,470 |
5.2 |
23.6 |
|
Total |
1,709 |
100.0 |
1,455,464,786 |
100.0 |
100.0 |
|
NOTE: Acronyms are defined in Appendix H. |
|||||
5.1.5
Oversubscription in the NSF Grants Program
Over the past decade, NSF saw a steady increase in proposal pressure and a constant average grant size (on an annualized basis) when allowance is made for inflation. Working into relatively constant resources, the result has been a deteriorating success rate. These trends are shown in the next four figures. Figure 5.4 shows the overall number of proposals funded versus the number received by NSF's AST.
Figure 5.5 shows the number of successful proposals for AST as a whole and individually for the five main programs (Advanced Technology and Instrumentation, Extragalactic and Cosmology, Galactic Astronomy, Stellar Astronomy and Astrophysics, and Planetary). Although subject to the usual small-number fluctuations, the trends in the number of funded proposals are quite flat.
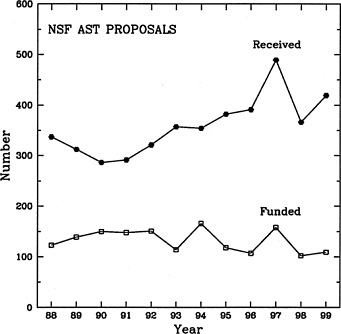
FIGURE 5.4 Overall number of proposals received and funded by NSF AST during the 11-year period from 1988 to 1999. SOURCE: NSF Division of Astronomical Sciences.
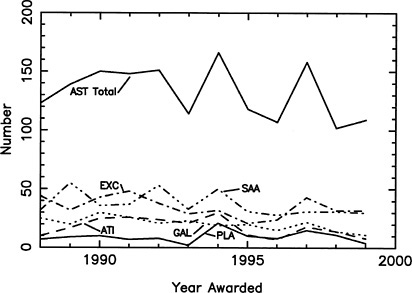
FIGURE 5.5 Number of awards made by NSF AST during the 11-year period. Also shown are the numbers by program: Extragalactic and Cosmology (EXC), Stellar Astronomy and Astrophysics (SAA), Galactic Astronomy (GAL), Advanced Technology and Instrumentation (ATI), and Planetary (PLA). SOURCE: NSF Division of Astronomical Sciences.
Figure 5.6 shows the funding rate given as the number of awards and the proposal success rate for the AST and its research programs. Taken together, Figure 5.4 Figure 5.5 through Figure 5.6 show that the overall success rate in the NSF AST has declined in recent years to approximately 28 percent of the grant proposals submitted, which is below the NSF average of about 33 percent. In some individual programs, the results have been even less favorable. The deterioration in the rate of success is evident, both on the division level and almost without exception in each of the programs. Despite the growth of the field, the number of awards has fallen slightly since the beginning of the decade. This trend is not the result of increases in the average grant size. Figure 5.7 shows the (annualized) median size of each grant. Overall, inflation-adjusted grant sizes remained fairly constant.
Finally, Figure 5.8 shows the average fraction of successful proposals for research and instrumentation grants in the AST compared to the NSF average for competitive grants. Note that there are large statistical fluctuations in the fraction of accepted grants in the AST, which are driven both by relatively small numbers of proposals and by funding cycles that oscillate across fiscal year boundaries. For the AST, two- or three-year averages are appropriate. Early in the decade, the AST average was well above the mean, but it fell below the NSF mean acceptance ratio in two of the last four years.
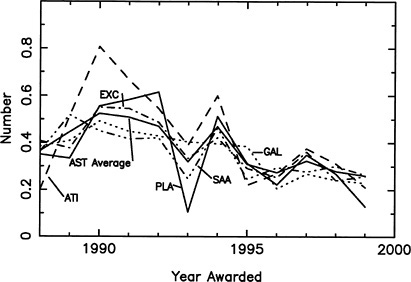
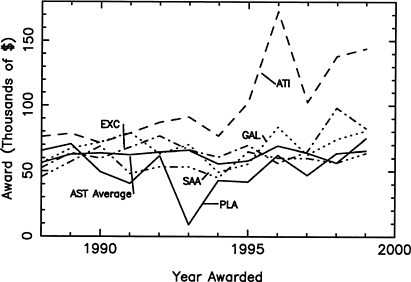
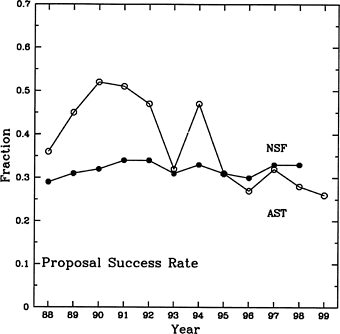
FIGURE 5.8 Fraction of successful proposals in NSF AST (open symbols) compared to the overall success rate for NSF competitive proposals (filled symbols). SOURCE: NSF Division of Astronomical Sciences and NSF Experimental Program to Stimulate Competitive Research (EPSCoR) National Almanac, online database, available at <http://www.ehr.nsf.gov/ehr/epscor/per/start.htm>.
Modest amounts of guest investigator funding are sometimes supplied with grants of observing time at some of the NSF-supported facilities. These typically cover travel and publication costs and are described below in the context of observing time oversubscriptions.
To summarize, NSF support for astronomical research declined by about 10 percent (in inflation-corrected dollars) over the past decade. Approximately one-third of this funding supported individual research grants, with the balance supporting major ground-based facilities. The net result has been an increasing pressure on the grants programs, with oversubscription rates of nearly 4:1 in most programs for grants of $65,000 per year.
5.2
THE NASA R&A BUDGET
A detailed breakdown by field and discipline for NASA grants was difficult to obtain due to changing budgeting procedures. The committee is able to provide a snapshot for one year, 1993, and can reliably describe overall R&A funding as a function of time.
Given the variety of programs offered, the observing programs are considered separately from the rest. The numbers are summarized in Table 5.9, where for the satellites the specific proposal cycle is listed, while for the others (mostly theory) the annualized totals for (often) multiyear grants are provided for 1993. For the satellites, oversubscription by a factor of 2.2 is the average across the board, but there is a clear difference among satellites, with the factor reaching 3.5 for HST. Average grants in the satellite program range from $11,600 (Advanced Satellite for Cosmology and Astrophysics [ASCA]) to $74,000 (HST). Overall, grants averaged $25,900.
The theory and archival data programs typically were oversubscribed by a factor of 2.6, with the Theory Program reaching 3.7 (although these numbers represent reports from different years, as summarized in Table 5.9 ). Average grants amounted to $74,800 but varied widely, from an average for theory of $130,000 to an average in NASA's Astrophysics Data Program (ADP) of $37,500.
Table 5.10 compares the total funding of NASA R&A and DA programs between 1989 and 1999. The most striking trend is a 50 percent increase in total support over the decade, from about $60 million to $90 million, which can be compared to the NSF total research grants program support of $26.4 million in 1998 (Table 5.3 ). This comparison perhaps more than any other underscores the increasing dominance of NASA over the past decade. Table 5.7 also shows that a single space mission, Hubble, accounts for more than one-third of all NASA support ($31.6 million), which by itself exceeds the total NSF grants program and also exceeds the total NASA astronomy R&A program. Put another way, the sudden loss of HST funding would have a substantially greater impact on astronomy, in terms of total dollars, than the termination of all NSF grant support for astronomy. The operating Chandra X-ray Observatory and the future SIRTF will also have major impacts on astronomy research funding.
5.2.1
NASA Theory Program
The NASA Theory Program was initiated in 1984 in response to a recommendation of the 1982 decadal survey (National Research Council, Astronomy and Astrophysics for the 1980's. Volume I: Report of the Astronomy Survey Committee, National Academy Press, Washington, D.C. 1982) that the federal agencies establish theory programs. The first NASA Research Announcement for theory solicited proposals from theory groups. Funding was provided for three years beginning in 1985, leading to a second announcement in 1987. After the third announcement in 1990, there were more individual investigators in the program. During 1993 and 1994 there was a gap in the program. The program resumed in 1994 with some changes: it became an annual rather than a triennial program, and theory components of three wavelength-specific programs (high energy, UV/optical, and IR) were folded into the Astrophysical Theory Program (ATP). The grants moved from these other programs were generally small. In 1997, the theory component of the cosmic ray program became part of the ATP. This program has become a major source of funding for theorists; it rivals the funding for theorists provided by the NSF Astronomy Division.
TABLE 5.9 NASA Grants–FY 1993 Award Snapshot
|
Proposals |
Grants |
Funding Awarded (dollars) |
||
|
Observing Programs |
||||
|
ASCA Cycle 1 |
248 |
70 |
1,021,863 |
|
|
EUVE Cycle 1 |
141 |
81 |
2,267,878 |
|
|
CGRO Cycle 3 |
251 |
149 |
4,645,683 |
|
|
HST Cycle 2 |
427 |
123 |
9,104,225 |
|
|
IUE Cycle 16 |
242 |
128 |
143,000 |
|
|
ROSAT Cycle 4 |
371 |
231 |
3,697,373 |
|
|
1,680 |
782 |
20,880,022 |
||
|
Non-observing Programs (Multiyear) |
||||
|
ADP FY 1993 |
101 |
3,787,700 |
||
|
LTSA FY 1993 |
57 |
6,215,563 |
||
|
Theory FY 1993 |
33 |
4,296,406 |
||
|
191 |
14,299,669 |
|||
|
Grand Total |
997 |
35,179,691 |
||
|
NOTES: Acronyms are defined in Appendix H. Number of investigators listed on proposals: 577 principal investigators; 1,307 coinvestigators (1,524 distinct persons). |
||||
TABLE 5.10 Funding of NASA's R&A and DA Programs in Millions of 1997 Dollars, FY 1989 and FY 1999
|
FY 1989 |
FY 1999 |
||
|
MO&DA Program |
|||
|
HST DA |
12.3 |
HST DA |
31.6 |
|
IR/radio |
5.4 |
CGRO MO&DA |
1.4 |
|
UV/optical |
4.3 |
Other missions |
11.2 |
|
High energy |
2.9 |
Multidisciplinary programs |
14.8 |
|
Miscellaneous(LTS A, data) |
5.4 |
||
|
30.3 |
59.0 |
||
|
R&A Program |
|||
|
UV/optical |
8.3 |
UV/optical |
9.0 |
|
IR/radio |
3.9 |
IR/radio |
6.6 |
|
High energy |
10.3 |
High energy |
9.5 |
|
ATP |
3.6 |
ATP |
6.2 |
|
Airborne |
2.5 |
Airborne |
‗ |
|
28.6 |
31.3 |
||
|
Total |
58.9 |
90.3 |
|
NOTE: Acronyms are defined in Appendix H.
The funding history of the Theory Program is shown in Table 5.11 and Table 5.12. Table 5.11 shows the funding history of the Theory Program alone. There was an increment in the funding in 1994 to take into account the grants moved from other NASA programs. However, this funding increment does not appear to have been sustained in subsequent years. As measured by oversubscription by number, there has been a steady erosion of the success rate of the program. Table 5.12 gives the integrated theory funding, including funding for theoretical projects in other NASA R&A programs. In looking at averages in two-to three-year intervals to smooth year-to-year discontinuities (since not all programs are competed every year), there has been a decline of about 20 percent in NASA funding for theoretical astrophysics since the beginning of the decade.
TABLE 5.11 NASA Theory Program Funding History, 1987 to 1997
|
Year |
No. of Proposals |
Total Budget Requested per Year (thousands of dollars) |
Total Budget Approved per Year (thousands of current dollars) |
Oversubscription |
Total Budget Approved per Year (thousands of 1997 dollars) |
||
|
Requested |
Accepted |
By No. |
By Funds |
||||
|
1987 |
45 |
15 |
2,100 |
3.0 |
2,846 |
||
|
1990 |
118 |
33 |
15,233 |
3,959 |
3.6 |
3.8 |
4,764 |
|
1994 |
212 |
58 |
22,600 |
5,400 |
3.7 |
4.2 |
5,794 |
|
1995 |
180 |
45 |
17,700 |
3,000 |
4.0 |
5.9 |
3,138 |
|
1996 |
137 |
32 |
17,631 |
2,421 |
4.3 |
7.3 |
2,475 |
|
1997 |
179 |
37 |
16,054 |
3,065 |
4.8 |
5.2 |
3,065 |
TABLE 5.12 Theory Funding (millions of dollars) at NASA, Integrated Over All Programs, 1987 to 1999
|
Year |
Total Budget |
1997 Dollars |
|
1987 |
5.10 |
6.90 |
|
1988 |
5.20 |
6.80 |
|
1989 |
5.30 |
6.65 |
|
1990 |
6.96 |
8.37 |
|
1991 |
7.05 |
8.16 |
|
1992 |
6.21 |
6.49 |
|
1993 |
4.89 |
5.36 |
|
1994 |
4.59 |
4.92 |
|
1995 |
5.95 |
6.22 |
|
1996 |
6.17 |
6.30 |
|
1997 |
6.49 |
6.49 |
|
1998 |
5.89 |
5.78 |
|
1999 |
6.39 |
6.14 |
5.3
FACILITIES OVERSUBSCRIPTION
This section describes the facilities that are available to the astronomical community through public funding from NSF or NASA. The list of facilities is limited to those that run periodic solicitations for proposals (i.e., NASA principal investigator (PI) missions are not included except in cases where some of the observing time is distributed through an open guest observer (GO) program). The value of the resources available is assessed in terms of two quantities, observing time and funding for support. For observing time, the committee discusses the amount of time available for U.S. astronomers and the typical oversubscription rates. For the funding for support, it discusses the specific items supported (e.g., travel, page charges, summer salary) and the average and total funds distributed. For funding, the discussion is limited to programs specifically tied to successful proposals for observing time or to GO proposals.
5.3.1
NSF Facilities
The NSF's Division of Astronomical Sciences operates three centers, the National Optical Astronomy Observatories, the National Radio Astronomy Observatory, and the National Astronomy and Ionosphere Center. In addition, the U.S. share of the international Gemini telescopes will be available through NOAO. The NSF also provides some operating funds for four private radio observatories: Owens Valley Radio Observatory, Caltech Submillimeter Observatory, Five College Radio Astronomy Observatory, and the Berkeley-Illinois-Maryland Array.
National Optical Astronomy Observatories
NOAO operates telescopes at three sites: Kitt Peak, near Tucson, Arizona; Cerro Tololo, near La Serena, Chile; and Sacramento Peak, near Cloudcroft, New Mexico. The Sacramento Peak telescopes and two of the Kitt Peak telescopes are solar facilities; the Cerro Tololo telescopes and the remaining Kitt Peak telescopes are nighttime facilities.
The nighttime facilities include two 4.0-meter general-purpose OIR telescopes, two medium-size (2.1-meter and 1.5-meter) telescopes, and two 0.9-meter telescopes. In addition, there are several shared facilities on these sites. These include the 3.5-meter WIYN telescope (40 percent of the time is available generally to the astronomical community), the 0.6-meter Curtis Schmidt telescope (66 percent of the time is available), the 1.0-meter YALO (Yale, Association of Universities for Research in Astronomy [AURA], University of Lisbon, and Ohio State) telescope (10 percent of the time is available), and the 4-meter SOAR telescope (project currently in design phase; 30 percent of the time will be available to U.S. astronomers). For all the telescopes at Cerro Tololo, 10 percent of the time is guaranteed to proposers from Chilean institutions.
The NSF-supported facilities in Chile and Arizona represent the main access to optical facilities for the average U.S. astronomer. Over the past decade, smaller telescopes at both locations have been closed and new, larger (notably the WIYN 3.5-meter in Arizona) facilities opened. Oversubscription is a useful gauge of proposal and observing time pressure for this period.
Approximate average oversubscription rates are 2 to 3 for the 3.5-and 4.0-meter telescopes in recent years, and 1.5 to 2 for the medium-size telescopes. Oversubscription is a strong function of instrumental availability, lunar phase, and time of year. Time is allocated on a semiannual basis, with success rates published on a consistent and systematic basis.
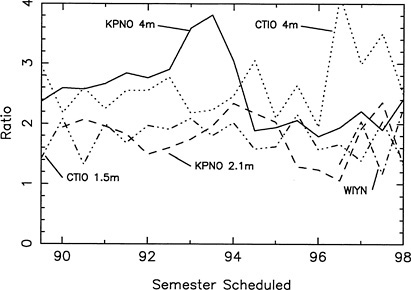
FIGURE 5.9 Oversubscription for NOAO facilities.
Figure 5.9 shows oversubscription rates in terms of time requested versus time available, over the past decade. The demand for the large telescopes shows structure, mostly associated with the introduction of new instruments and the fact that the WIYN telescope is only now in full operation. As illustrated, there has been little reduction in pressure for observing time, even with the increase in aperture-hours. The smaller telescopes are routinely oversubscribed by factors of 1.5 to 2, whereas the large instruments seldom have oversubscription by less than a factor of 2. Optical ground-based facilities available to U.S. astronomers are under continuing heavy demand.
NOAO also provides access to a number of other nighttime facilities through various NSF programs. The U.S. community will have access to 47.6 percent of the time on the two Gemini 8.0-meter telescopes, becoming available in mid-2000 (Gemini-North) and mid-2001 (Gemini-South). Through the NSF facility instrumentation program, approximately 7 percent of the time on the Hobby-Eberly telescope and 7 percent of the time on the upgraded (6.5-meter) Multiple Mirror Telescope (MMT) will be available to the community through NOAO for a period of six years beginning in 1999.
The solar facilities include three telescopes at Sacramento Peak, New Mexico, and three telescopes at Kitt Peak, Arizona. Solar telescopes are run in a somewhat different manner from nighttime telescopes, with some fraction of the time used for synoptic observations carried out by the observatory staff. In the remaining time, visitors use the telescope with their own instrumentation or with observatory instrumentation. A recent compilation of user statistics states that over the 3.75 years from October 1, 1993, through June 30, 1997, 99,176 hours of observing were scheduled on the six facilities. This included 851 separate observing runs representing 343 unique science projects and serving a total of 299 individual users (not counting National Solar Observatory (NSO) staff scientists). For the three most popular facilities, the McMath-Pierce Telescope, the Sacramento Peak Vacuum Tower Telescope, and the Evans Facility, the visitor use fractions were about 0.7, 0.5, and 0.3, respectively.
In the past, NOAO provided travel funds and page charge support for observers, but these were discontinued more than ten years ago. Currently, NOAO travel support is limited to graduate students working on Ph.D. theses. There is no publication support. NOAO administers an NSF fund that supports travel by U.S. astronomers to foreign observatories. This fund totals about $30,000 per year.
National Radio Astronomy Observatory
NRAO operates three facilities, the Very Large Array (VLA) near Socorro, New Mexico; the Very Long Baseline Array; and the 12-meter telescope on Kitt Peak near Tucson, Arizona. In addition, the 100-meter Green Bank Telescope will begin operation in 2000. All of the time on these facilities is available to the astronomical community through a peer-review process.
The VLA consists of 27 25-meter telescopes in a Y-shaped array, with a maximum dimension of 36 km. It operates at wavelengths from 0.7 to 90 cm. The oversubscription of the VLA is typically in the range of a factor of 2 to 3. Over the two (four-month) cycles in 1998, the VLA time requested was slightly more than twice the time allocated, and slightly less than two-thirds of observing proposals were accepted.
The VLBA is an array of 25-meter telescopes at ten sites extending over a maximum baseline of 5,000 miles. It can be used at wavelengths from 0.7 to 90 cm. The VLBA is typically oversubscribed by a factor of 2. Over two (four-month) cycles in 1998, the VLBA time requested was about 1.7 times the amount allocated, and about three-quarters of observing proposals were accepted.
The 12-meter telescope at Kitt Peak is a millimeter-wave telescope operating in all atmospheric windows from 68 to 300 GHz. It is typically oversubscribed by a factor of 1.5. NRAO pays 50 percent of page charges for papers that substantially incorporate original data from NRAO telescopes. NRAO supports travel to make observations or reduce data at NRAO facilities—one trip of each type per program.
National Astronomy and Ionospheric Center
NAIC operates the 305-meter radio telescope near Arecibo, Puerto Rico, which is the primary instrument for radio and radar astronomy as well as ionospheric studies. It has just resumed partial operations after a nearly three-year shutdown for a major upgrade, which included a substantially improved groundscreen and a Gregorian feed system that improves sensitivity and frequency range. Before the upgrade, proposals were accepted at any time and worthy proposals were kept in the queue until completed. Since the upgrade, a semester-based proposal cycle has been instituted, but the telescope has not been in full operation long enough to judge the proposal pressure. Preliminary numbers for the limited access time starting on February 1, 1999, show, even with only the longer-wavelength receivers available, oversubscription by a factor of at least 1.7.
Before the upgrade, about 80 percent of the schedulable time was used for radio astronomy, 3 percent for radar astronomy, and 17 percent for atmospheric research.
University-owned Radio Observatories
The NSF provides a fraction of the funds needed to operate four university-owned radio observatories: OVRO, CSO, FCRAO, and BIMA.
OVRO is not mandated to give time to external proposers by its agreement with the NSF but gives on average about 50 percent of its observing time to external (non-Caltech) proposers. The typical oversubscription factor is about 2 for proposals to work at 3 mm and 4 to 5 for proposals to work at
1 mm. OVRO supplies some funding for external observers on an informal basis to cover lodging and food at the observatory and, occasionally, for data reduction trips. About $10,000 per year is provided in this way.
CSO awards 50 percent (by agreement with the NSF) of its time to external proposers. The oversubscription factor is about 2. Funding support provided to external observers includes paying for accommodations at the site (Mauna Kea) and limited travel. The total value of the funding supplied to external observers is about $75,000 per year.
The oversubscription for FCRAO and BIMA is not considered in this report.
5.3.2
NASA Ground-based Facilities
NASA provides funding to supply U.S. astronomers with a number of different types of observational capabilities. These range from ground-based facilities such as the Infrared Telescope Facility (IRTF; mostly NASA supported and operated through a contract with the University of Hawaii) and the Keck telescopes (NASA Planetary, a one-sixth partner), to space missions, many of which have GO programs. NASA also supports programs such as the HST archive and the Astrophysics Data Program that provide funding to analyze and interpret data previously obtained through either GO or PI observations.
The IRTF is a 3.0-meter telescope on Mauna Kea, Hawaii. NASA funds its operations through a contract with the University of Hawaii. Facility instrumentation comes from NSF funding. Seventy-five percent of the time on the IRTF is available to the community, and half of this must be used for solar system research. Oversubscription by a factor of 2 for solar system time and 3 to 3.5 for non-solar system time is typical. IRTF pays for accommodations and meals for visiting observers and up to 50 percent of the page charges for papers presenting IRTF data.
NASA has bought one-sixth of the time on the two Keck 10-meter telescopes on Mauna Kea. This time is available to the community but is limited to searches for extrasolar planets, studies of the origin and nature of planetary systems, and investigations of our own solar system. The typical oversubscription rate on this time is 2 to 2.5. This program does not make any funding available to proposers.
NASA funds a number of space missions with GO programs. These include both “Great Observatory” class missions (HST, AXAF/Chandra, CGRO, and SIRTF) and more modest Explorer-class missions, some of which have limited GO programs. The smaller missions included in this report are Japan's Advanced Satellite for Cosmology and Astrophysics (ASCA), the Extreme Ultraviolet Explorer (EUVE), ROSAT, the Rossi X-ray Timing Experiment (RXTE), the European Infrared Space Observatory (ISO), FUSE, and SOFIA.
5.3.3
NASA Missions with Guest Observer Programs
Hubble Space Telescope
The Hubble Space Telescope GO program is now in its seventh cycle. Calls for proposals are issued approximately once per year. Oversubscription has averaged about a factor of 3 for the past three cycles, but it has ranged from 2.1 to 4.8 during this time. Estimates are somewhat complicated. Time is given out in “cycles” that do not in general coincide with an annual cycle. Comparisons are further
complicated by the initial mirror problems, corrected in time for Cycle 4 (1994) but involving additional lost orbits. More recently there were problems associated with the reduced lifetime of the Near Infrared Camera and Multi Object Spectrograph (NICMOS) cryogens and the subsequent readvertisement for proposals specifically for this instrument.
Figure 5.10 (plotted as though cycles corresponded exactly to years) shows the trends since 1993 (Cycle 2) in oversubscription both for proposals and for observing time (orbits). Oversubscription during Cycles 2 and 3 was high, about a factor of 4. However, with the focus problems, each successful program in general has required extra orbits; the number of accepted programs has thereby been reduced, and the number of orbits scheduled per proposal has increased.
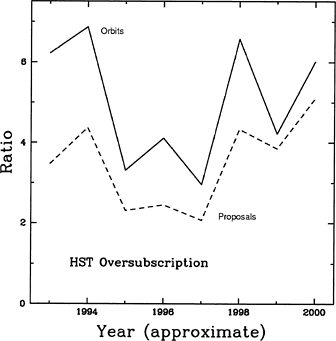
FIGURE 5.10 Oversubscription on proposals and observing time for HST.
After the servicing mission, Cycles 4, 5, and 6 show the effects of the greatly improved throughput, with proposal oversubscription dropping to a factor of approximately 2.5. Cycle 7, anticipating the NICMOS and Space Telescope Imaging Spectrometer (STIS) instruments, showed proposals peaking at about 1,300, albeit for a period in excess of a year; proposal oversubscription rising to a factor of 4.3; and the orbits requested exceeding those available by more than a factor of 6. HST remains heavily oversubscribed.
Chandra
The recent delay of the AXAF/Chandra launch highlights one of the problems faced by the research community. It is estimated that delay of the launch from fall 1998 to summer 1999 cost NASA approximately an additional $40 million. This funding is not currently in the NASA hardware or MO&DA budgets. NASA has “borrowed” the required extra funding over and above the existing small contingency to be paid back from future AXAF/Chandra operations and data analysis funds, including guest observer funding. Unless other funding is made available, NASA's current recovery plan as described to the committee by A. Bunner (November 10, 1998) calls for a decrease of 10 to 20 percent in basic research support over the first five years of operations, a substantial tax on individual investigators.
Compton Gamma Ray Observatory
The Compton Gamma Ray Observatory was launched in April 1991. Cycle 8 of the GO program began at the start of 1999. CGRO has four instruments, BATSE (Burst and Transient Source Experiment), EGRET (Energetic Gamma Ray Experiment Telescope), OSSE (Oriented Scintillation Spectrometer Experiment), and COMPTEL (Imaging Compton Telescope). The GO program is open to the international community with no preallocations. Oversubscription is about a factor of 4 for the three instruments that make pointed observations and about 5 for BATSE, which is an all-sky monitor. The average GO grant is currently about $11,000, a decrease from about $50,000 in the early cycles. Grant funds go mostly for salaries and for support of postdoctoral fellows and graduate students. Travel, computer equipment, and page charges are all allowed.
Far Ultraviolet Spectrographic Explorer
The Far Ultraviolet Spectrographic Explorer mission was launched on June 24, 1999. FUSE will provide a high-resolution (R = 30,000) ultraviolet spectrographic capability over the wavelength range from 905 to 1187 Å. The primary science goals include (1) a study of the deuterium-hydrogen (D/H) ratio and its dependence on the chemical evolution of the interstellar gas in the Milky Way and intergalactic gas in the low-redshift universe and (2) a study of the origins and properties of hot interstellar gas in the Milky Way and Magellanic Clouds as traced through O VI (O+6) absorption and emission. The FUSE program experienced two launch delays. The most recent delay was due to defective gyroscopes. If the full cost implications of the delays are passed on to the FUSE mission operations and scientific data analysis program, the impact on the ability of the PI team and FUSE guest observers to pursue the science goals of the mission will be substantial.
Kuiper Airborne Observatory and Stratospheric Observatory for Infrared Astronomy
Airborne astronomy has been a significant part of infrared astronomical research for the last 30 years. For much of the last decade, the Kuiper Airborne Observatory (KAO), a 0.9-meter IR telescope mounted on a C141 aircraft, was managed by Ames Research Center. For 1986 and 1989 through 1995, the funding in 1997 dollars was $8.3 million ($3.5 million), $10.1 million ($3.7 million), $10.6 million ($3.7 million), $11.1 million ($3.6 million), $11.3 million ($3.7 million), $11.7 million ($3.6 million), $11.2 million ($3.6 M), and $10.6 million ($4 million), where the number in parentheses is the amount for user grants and the first number is everything else (e.g., operations, aircraft maintenance).
There were about 12 to 14 PI teams at any one time, including on average 5 to 10 scientists per team (counting graduate students and postdoctoral fellows); thus, there were about 100 active scientists
in any given year. There were on the order of 25 to 30 guest investigator programs with two to three scientists per team, again including graduate students and postdocs. Thus, approximately 175 scientists were using the KAO or associated with it in any year. In addition, there were about 70 support personnel. The fraction of solar system observations ranged from a high of about 30 percent to a low of about 15 percent toward the end of the program, with the remainder being galactic or extragalactic observations. Funding during the last year of KAO operations in 1995 included approximately $2 million for instruments, $1.2 million for observations and data analysis for galactic studies of the ISM, $0.3 million for extragalactic studies, and $0.5 million for other astronomical research such as solar system studies.
With the decommisioning of the KAO in late 1995, most of the funding for airborne work is now in the SOFIA budget. SOFIA is a 2.5-meter telescope that will operate in a modified Boeing 747SP. Development of SOFIA is under way and should be completed by 2001. Roughly $40 million to $50 million was spent in development in calendar year 1997. The budget for the four-year development is about $55 million per year. Of this, about $4.5 million per year has been set aside for science instrument development. The first such awards were not made until September 1996, so only about $2 million was spent in FY 1997. A total of three facility instruments and four PI-class instruments are currently under development. There is also a near-IR camera for checkout of the optical performance of the telescope that will be useful as an eighth science instrument at first light. Observations are to start in early 2002. SOFIA will be accessible to a much wider range of astronomers than was KAO. The scientific usage is expected to be roughly 50 percent for star formation studies, 30 percent for extragalactic astronomy and cosmology, 10 percent for planetary science, and 10 percent for other studies. The data are to be archived for the community.
5.3.4
Instrumentation for Ground-based Telescopes
Over the next several years, U.S. ground-based optical and infrared astronomers will see a very large increase in the collecting area of ground-based optical and IR telescopes, with apertures exceeding 5 meters (see Table 5.13 ). These telescopes will have a profound effect on the ability of ground-based astronomers to pursue a wide range of fundamental astronomical problems. In fact, counting telescopes of diameter >2 meters, in 1990 the total collecting area available to U.S. astronomers was only about 110 square meters. By 2003, this number will have risen to nearly 600 square meters, more than a factor-of-5 increase (see Table 2 of the 1995 NRC report A Strategy for Ground-Based Optical and Infrared Astronomy and the partial update for large telescopes given in Table 5.13 ).
Much of the large increase in telescope collecting area has and will come as the result of support from private foundations and both state and private U.S. academic institutions. Private money and academic institution money will also help support the operation of many of these major astronomical facilities. However, to realize the full potential of this large gain in light-collecting ability, it is necessary to instrument these new telescopes properly.
Although some funds to instrument large telescopes have recently come from NASA, the NSF will have to take on the primary responsibility for creating a vigorous optical and infrared instrumentation program for these new facilities as discussed in A Strategy for Ground-Based Optical and Infrared Astronomy. In that strategy a vigorous facility instrumentation program was recommended to the NSF. This program was intended for the independent observatories with large telescopes. Instrumentation grants are awarded on the basis of scientific merit but are tied to the provision of access to the astronomical community at large. The committee recently reviewed the cost-sharing and community access aspects of the above report and agreed that this important element of the program should be continued, but with a modification in the cost-sharing formula such that the NSF would have
more flexibility in trading facility instrument funds for telescope access. (See “On the National Science Foundation's Revised Facility Instrumentation Program,” June 2, 1999, provided to AURA and NSF.) This modified payback scheme would allow the NSF to more fairly recognize and award independent observatories for their successes in obtaining private and state funds for construction and operation.
TABLE 5.13 Optical/IR Telescopes of Aperture >5 Meters Currently Accessible to U.S. Astronomers or Under Construction
|
Name |
% U.S. |
Year |
Aperture(m) |
Capital Cost (millions of dollars)a |
Instrumentation (millions of dollars)a |
|
Keck I |
100 |
1993 |
10 |
94 |
13.5 |
|
Keck II |
100 |
1996 |
10 |
78 |
28.1 |
|
HET |
90 |
1998 |
9 |
17 |
3.6 |
|
MMTb |
100 |
2000 |
6.5 |
23 |
26 |
|
Gemini-Northc |
52 |
1999 |
8 |
86 |
11.2 |
|
Gemini-Southc |
42 |
2001 |
8 |
86 |
7.6 |
|
Magellan I |
90 |
2000 |
6.5 |
38 |
9 |
|
Magellan II |
90 |
2002 |
6.5 |
36 |
9 |
|
LBT |
50 |
2002 |
2×8.4 |
77 |
13 |
|
SALT |
12 |
2002 |
10 |
17 |
|
|
NOTE: Acronyms are defined in Appendix H. a Costs are the total construction and current integrated instrumentation budgets, including the U.S. share. b The MMT capital cost is for the conversion from 4.5-meter only. c Gemini instrumentation costs are those included in the original capital construction budget. Gemini has a separate line for new instrumentation that is included in its annual operations budget. |
|||||


