
Appendix D
The Mathematical Sciences Since 1998
The nature of higher education in the mathematical sciences is not static. Identifying the impact of the National Science Foundations (NSF’s) Grants for the Vertical Integration of Research and Education in the Mathematical Sciences (VIGRE) program is made more difficult because this nature continued to evolve during the lifetime of the VIGRE program. This appendix looks briefly at how the field has changed since the VIGRE program began.
Federal funding in mathematics, both by the National Science Foundation and by federal agencies in general, continued to grow from 1999 through 2005, the most recent year for which data are available. The NSF’s share of federal funding to academic institutions has oscillated, as shown in Table D-1, but it remains the dominant source of funding for the mathematical sciences.
Although the overall amount of federal funding has grown, NSF’s fraction of the total federal obligations to institutions is similar during the VIGRE period and the period prior to the program (see Figure D-1). Note that the NSF’s responsibility for graduate student support has gone up from the pre-VIGRE period to the VIGRE period (VIGRE was established in 1998), as shown in the figure.
The average percentage of support provided by NSF to full-time graduate students in mathematics and statistics at doctorate-granting institutions from 1980 to 1998 was 34 percent of all federal funding. During the 1999 to 2006 period it was 55 percent.
Considering the mechanisms of support that NSF uses with respect to graduate students, there is some growing reliance on teaching assistantships. Comparing Table D-2 with Table 2-3 in Chapter 2, one sees that the percentage of graduate students supported by NSF research assistantships has declined somewhat in the years since the establishment of the VIGRE program, while the fraction of students supported by NSF-sponsored teaching assistantships has increased. Of course, most teaching assistantships are provided by universities, so looking at NSF support gives only a partial picture.
Turning from funding to an assessment of the number of students in mathematics and statistics, the committee is pleased to see that the number of full-time graduate students has grown during the VIGRE period, after falling somewhat from 1992 to 1998, and that the number of students is now higher than at any time since 1980. Figure D-2 shows the reversal.
TABLE D-1 National Science Foundation (NSF) Share of Federal Funding to Universities and Colleges for Research in the Mathematical Sciences, 1999-2005 (in thousands of dollars)
|
Year |
NSF Share |
Total |
Percent |
|
1999 |
84,975 |
131,264 |
65 |
|
2000 |
99,625 |
211,490 |
47 |
|
2001 |
105,251 |
169,702 |
62 |
|
2002 |
142,298 |
200,758 |
71 |
|
2003 |
162,546 |
230,156 |
71 |
|
2004 |
184,037 |
322,989 |
57 |
|
2005 |
185,390 |
365,756 |
51 |
|
NOTE: Data are collected by NSF from NSF’s “Survey of Federal Funds for Research and Development.” Data contained in the survey are provided by agencies. SOURCE: National Science Foundation-National Institutes of Health, “Survey of Graduate Students and Postdoctorates in S&E,” accessed via WebCASPAR, http://webcaspar.nsf.gov. |
|||
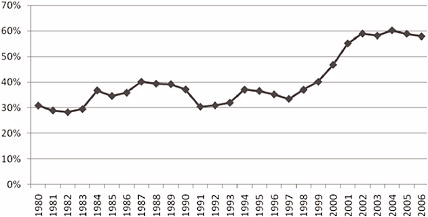
FIGURE D-1 National Science Foundation support to full-time graduate students in mathematics and statistics at doctorate-granting institutions as a percentage of federal support, 1980-2006. SOURCE: National Science Foundation-National Institutes of Health, “Survey of Graduate Students and Postdoctorates in S&E,” accessed via WebCASPAR, http://webcaspar.nsf.gov.
Data from the American Mathematical Society also show a rise in graduate students over the more recent period, as shown in Figure D-3.
As Figure D-4 shows, the percentage of graduate students in mathematics and statistics who are U.S. citizens or permanent residents has unfortunately not rebounded, although more and more graduate students fall into this category from 2000 to 2006. The percentage of female graduate students, which had been rising between 1980 and 1998, appears to have leveled off. The same is true for underrepresented minorities. This is of concern, and additional research could be directed toward a deeper understanding of changes in the composition of the graduate student body in the mathematical sciences.
TABLE D-2 Percentage of National Science Foundation Support for Full-Time Graduate Students in Mathematics and Statistics, 1999-2006, by Mechanism of Support
|
Year |
Fellowships |
Traineeships |
Research Assistantships |
Teaching Assistantships |
Other Mechanisms of Support |
|
1999 |
24 |
4 |
68 |
2 |
2 |
|
2000 |
37 |
6 |
54 |
3 |
1 |
|
2001 |
37 |
5 |
54 |
4 |
0 |
|
2002 |
33 |
4 |
59 |
3 |
1 |
|
2003 |
30 |
3 |
62 |
5 |
1 |
|
2004 |
26 |
4 |
65 |
5 |
0 |
|
2005 |
26 |
1 |
63 |
9 |
1 |
|
2006 |
28 |
3 |
60 |
8 |
1 |
|
SOURCE: National Science Foundation-National Institutes of Health, “Survey of Graduate Students and Postdoctorates in S&E,” accessed via WebCASPAR, http://webcaspar.nsf.gov. |
|||||
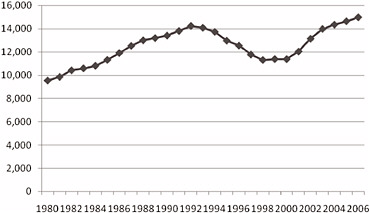
FIGURE D-2 Full-time graduate students in mathematics and statistics at doctorate-granting institutions in the United States, 1980-2006. SOURCE: National Science Foundation-National Institutes of Health, “Survey of Graduate Students and Postdoctorates in S&E,” accessed via WebCASPAR, http://webcaspar.nsf.gov.
AMS data show similar results. The percentage of U.S. citizens among total full-time graduate students in mathematics dropped from 55 percent in 1998 to 49 percent in 2001, then rose to 56 percent in 2007. The percentage of females has remained flat, ranging between 29 and 32 percent between 1998 and 2007. The percentage of underrepresented minorities has also remained flat—at about 10 percent—from 2003 to 2007 (Phipps et al., 2008b).
Digging a bit deeper into data on graduate study, the committee notes that the median time to degree seems not to have changed much during the first 5 years of the VIGRE program, as noted in Table D-3.
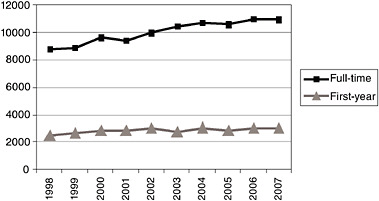
FIGURE D-3 Full-time and first-year graduate students in Groups I, II, III, and Va (departments granting degrees in applied mathematics), fall 1998 to fall 2007. SOURCE: Phipps et al. (2008b).
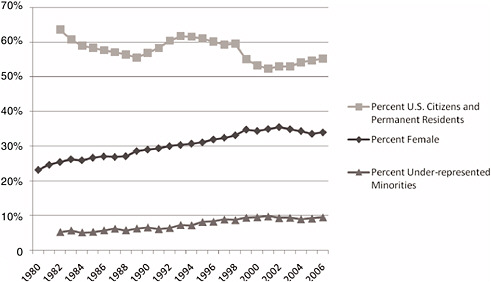
FIGURE D-4 Percentage of full-time graduate students in mathematics and statistics at doctorate-granting institutions in the United States who are U.S. citizens/permanent residents, underrepresented minorities, or female, 1980-2006. SOURCE: National Science Foundation-National Institutes of Health, “Survey of Graduate Students and Postdoctorates in S&E,” accessed via WebCASPAR, http://webcaspar.nsf.gov.
TABLE D-3 Median Years Elapsed from Bachelor’s to Doctoral Degree in Mathematics, 1999-2003
|
Year |
Median Years |
|
1999 |
8.0 |
|
2000 |
7.6 |
|
2001 |
8.0 |
|
2002 |
7.6 |
|
2003 |
7.7 |
|
SOURCE: Adapted from NSB (2006), Appendix Table 2-34. |
|
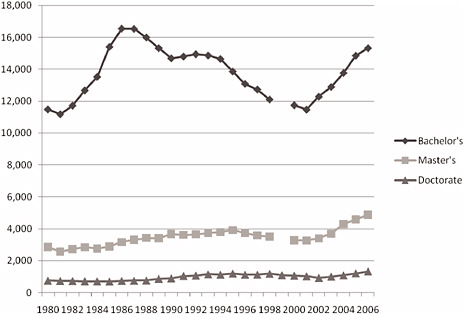
FIGURE D-5 Number of degrees awarded in the mathematical sciences in the United States, 1980-2006, by degree level. SOURCE: Adapted from NSF, Division of Science Resources Statistics (2008), Table 35.
Figure D-5 looks at degree production in the mathematical sciences. The falling number of bachelor’s degrees awarded from 1980 to 1998 has been reversed since 2001 and is almost back to the peak of degrees awarded in the mid-1980s. Likewise, the number of master’s degrees and PhDs awarded has also grown during the VIGRE period.
Turning to doctorates, the committee notes that the percentage of doctorates awarded to U.S. citizens and permanent residents, although rising during the early 1990s, is declining overall, as shown in Figure D-6. By contrast, the percentage of female and underrepresented minorities who received doctorates has generally been growing.
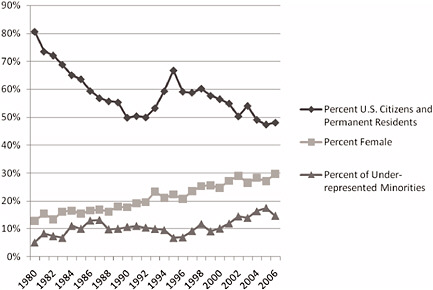
FIGURE D-6 Percentage of mathematics and statistics doctorates in the United States, by gender, race, and citizenship, 1980-2006. NOTE: The percentage female is the number of females divided by the number of females plus the number of males. In some cases gender was unknown. The same is true for citizenship. Underrepresented minorities include black, non-Hispanic; American Indian or Alaska Native; and Hispanic. The percentage of underrepresented minorities is divided by total doctorates, which include some people for whom race/ethnicity is “other/unknown.” SOURCE: National Science Foundation, “Survey of Earned Doctorates/Doctorate Records File,” accessed via WebCASPAR, http://webcaspar.nsf.gov.
Looking at recent doctorates and where they were planning to go after receiving their doctorate, the committee sees similar trends during the VIGRE program (Table D-4) and the earlier period represented in Table 2-5 in Chapter 2. For all years, about one-third of new PhDs in mathematics planned to go directly into a postdoctoral appointment. (Because the total number of PhDs is rising, this translates into more postdoctorals.)
As might be expected given the goals of the VIGRE program, the number of postdoctoral fellows in mathematics and statistics has risen quite a bit since the VIGRE program started, as shown in Figure D-7.
Finally, the committee collected some information on VIGRE-like activities taking place in recent years in departments that did not receive a VIGRE award. Those data are presented in Table D-5.
All of the trends discussed above need to be considered as background or context when assessing the impact of the VIGRE program.
TABLE D-4 New Doctorate Recipients with Definite Commitments to Postdoctoral Study or Research, by Broad Field of Doctorate, 1999-2005
|
Field of Doctorate |
1999 |
2000 |
2001 |
2002 |
2003 |
2004 |
2005 |
|
|
Number |
||||||
|
Total recipients with commitments, all fields |
25,975 |
26,711 |
26,889 |
25,984 |
26,167 |
26,280 |
27,383 |
|
Total planning postdoctoral study |
7,090 |
6,978 |
7,109 |
7,195 |
7,784 |
8,210 |
8,786 |
|
Science and engineering, total |
6,485 |
6,386 |
6,346 |
6,445 |
6,988 |
7,405 |
7,952 |
|
Mathematics |
215 |
213 |
217 |
239 |
258 |
269 |
298 |
|
|
Percentage |
||||||
|
Total planning postdoctoral study |
27 |
26 |
26 |
28 |
30 |
31 |
32 |
|
Science and engineering, total |
39 |
38 |
37 |
40 |
43 |
45 |
45 |
|
Mathematics |
30 |
29 |
31 |
36 |
37 |
36 |
36 |
|
SOURCE: National Science Foundation, Science and Engineering Doctorate Awards, Arlington, Va., various years. |
|||||||
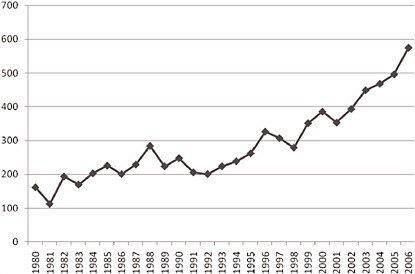
FIGURE D-7 Number of postdoctoral fellows in mathematics and statistics at doctorate-granting institutions in the United States, 1980-2006. SOURCE: National Science Foundation-National Institutes of Health, “Survey of Graduate Students and Postdoctorates in S&E,” accessed via WebCASPAR, http://webcaspar.nsf.gov.
TABLE D-5 “VIGRE-like” Activities of Departments That Did Not Receive a VIGRE Award
|
Topic |
Number |
|
Outreach to K-12 students |
40 |
|
Outreach to K-12 teachers |
53 |
|
Summer camps in mathematics/statistics |
30 |
|
Postdoctoral fellowships |
44 |
|
Graduate traineeships |
57 |
|
Undergraduate research experiences |
71 |
|
Mentoring by faculty |
95 |
|
Mentoring of students by postdoctorals or graduates |
31 |
|
Teaching collaborations with other departments outside of mathematics or statistics |
67 |
|
Research collaboration with other departments outside of mathematics or statistics |
92 |
|
Group activities that include undergraduates, graduates, postdoctorals, and faculty |
50 |
|
Other activities |
11 |
|
SOURCE: Committee request for information. Total number of departments responding was 122. |
|


