
2
Background of the VIGRE Program
In the 1980s and 1990s, there was concern within the mathematical sciences community that postsecondary education in the mathematical sciences was in trouble. A series of challenges was identified in several important national reports, many of which provided the intellectual framework for the National Science Foundation’s (NSF’s) Grants for Vertical Integration of Research and Education in the Mathematical Sciences (VIGRE) program. Prominent among these reports were the following:
-
Renewing U.S. Mathematics: Critical Resources for the Future, also known as the David Report after the chair of the committee, former Presidential Science Advisor Edward David (NRC, 1984);
-
Its successor report, prepared by a committee also chaired by Edward David (and hence sometimes referred to as David II), Renewing U.S. Mathematics: A Plan for the 1990s (NRC, 1990);
-
Educating Mathematical Scientists: Doctoral Study and the Postdoctoral Experience in the United States, also known as the Douglas Report after committee chair Ronald Douglas (NRC, 1992);
-
A study, Graduate Education and Postdoctoral Training in the Mathematical and Physical Sciences, by a panel convened in June 1995 by the Mathematics and Physical Sciences Directorate of the National Science Foundation (NSF, 1996); and
-
The report of an international panel convened by NSF, Report of the Senior Assessment Panel for the International Assessment of the U.S. Mathematical Sciences, also known as the Odom Report after panel chair General William Odom, former head of the National Security Agency (NSF, 1998).
Together, these reports painted a picture for the mathematical sciences that focused on three major challenges: inadequate funding, insufficient numbers of students interested in mathematics, and shortcomings in the shape and direction of postsecondary mathematics education. This chapter reviews the state of education in the mathematical sciences in the 1980s and 1990s, as perceived by NSF, in order to understand the deficiencies that VIGRE was intended to ameliorate.
FUNDING FOR MATHEMATICAL SCIENCES IN THE 1980s AND 1990s
Federal support in the mathematical sciences is provided largely by NSF, and to a lesser extent by the Department of Defense (DOD) through the Office of Naval Research (ONR), the Army Research Office (ARO), and the Air Force Office of Scientific Research (AFOSR). Additionally, some funding is provided by the Department of Energy (DOE), the National Security Agency, and the National Institutes of Health (NIH), and minor amounts come from other federal agencies. In the 1990s, funding from NIH rose to match that provided by DOE. As the Odom Report noted and as is illustrated in Table 2-1: “The NSF provides the majority of support for mathematical research in U.S. universities and institutions” (NSF, 1998, p. 38).
The reports mentioned above raised three concerns about funding for the mathematical sciences: (1) federal funding was perceived as inadequate to sustain and grow the field, (2) funding was too heavily dependent on NSF, and (3) the modes of support and the targets of funding were imbalanced, with too much emphasis on investigators and not enough on graduate students and postdoctoral researchers, and with graduate support focused heavily on research assistantships with little allocated to fellowships and traineeships that would help professional development in other ways.1
The David Report, which presented a “state of the field” in the early 1980s, cogently made the case for a higher level of funding for the mathematical sciences. In drawing its conclusions, the report focused on federal support for mathematical research in universities, federal support for students, and the budgets of federal agencies. Overall, the report found the following:
-
Federal support for the mathematical sciences research enterprise stood in 1982 at less than two-thirds its 1968 level (in constant dollars);
-
the principal reduction occurred during the period 1968-73;
-
it was followed by nearly a decade of zero real growth in support;
-
these budgetary events occurred during the peak in growth of the field—growth in the range and depth of uses of mathematics, with a concomitant doubling of the number of mathematical scientists productively engaged in research (NRC, 1984, p. 36).
The follow-up to the David Report, released in 1990, indicated that there had been some improvement in the funding situation. David II noted: “NSF support of mathematical sciences research nearly doubled (almost 50% real growth compared to 29% for total NSF R&D) over the six years from FY 1983 to FY 1989” (NRC, 1990, p. 22). Likewise, “The Department of Energy (DOE) doubled its support for the mathematical sciences over the period from FY 1984 to FY 1988” (ibid., p. 26). The picture at DOD was more complex: although support had increased, much of it was “because two new mathematical sciences research programs were created, one at the Defense Advanced Research Projects Agency (DARPA) and the other at the National Security Agency (NSA)” (ibid., p. 24). While noting this progress, David II also pointed out that the increases were far from meeting the goals laid out in the David Report. The Odom Report noted that “students of these [mathematical sciences] programs are provided substantially less federal funding than are students of the other sciences” (NSF, 1998, p. 31). Figure 2-1 shows that total academic research and development (R&D) expenditures at universities in mathematics and statistics had been rising over the 1980s and 1990s, although the percentage coming from federal sources had been declining.
TABLE 2-1 Federal Obligations to U.S. Universities and Colleges for Research in Mathematical Sciences, 1980-1998 (in thousands of current dollars)
|
Year |
USDA |
DOD |
DOE |
DHHS—NIH |
DHHS—Other |
NASA |
NSF |
Total |
Percentage NSF |
|
1980 |
282 |
16,121 |
2,921 |
3,671 |
0 |
1,344 |
24,686 |
49,025 |
50 |
|
1981 |
1,492 |
20,991 |
3,350 |
3,975 |
0 |
862 |
28,815 |
59,485 |
48 |
|
1982 |
1,107 |
24,362 |
3,163 |
4,079 |
0 |
937 |
30,630 |
64,278 |
48 |
|
1983 |
1,051 |
27,493 |
3,972 |
4,074 |
0 |
834 |
34,869 |
72,293 |
48 |
|
1984 |
1,032 |
30,181 |
3,393 |
5,251 |
0 |
416 |
38,133 |
78,406 |
49 |
|
1985 |
973 |
32,239 |
11,384 |
3,733 |
0 |
833 |
47,816 |
96,978 |
49 |
|
1986 |
833 |
35,066 |
12,812 |
4,615 |
0 |
761 |
51,079 |
105,166 |
49 |
|
1987 |
704 |
32,526 |
17,051 |
4,520 |
0 |
953 |
55,784 |
111,538 |
50 |
|
1988 |
615 |
33,152 |
15,958 |
5,759 |
0 |
1,115 |
61,199 |
117,798 |
52 |
|
1989 |
497 |
32,165 |
13,727 |
4,666 |
0 |
998 |
63,155 |
115,208 |
55 |
|
1990 |
353 |
36,551 |
17,155 |
5,642 |
0 |
989 |
68,501 |
129,191 |
53 |
|
1991 |
867 |
25,829 |
16,280 |
6,477 |
0 |
623 |
71,834 |
121,910 |
59 |
|
1992 |
678 |
39,961 |
15,122 |
5,299 |
467 |
873 |
88,045 |
150,445 |
59 |
|
1993 |
632 |
39,716 |
7,575 |
6,473 |
456 |
684 |
80,351 |
135,887 |
59 |
|
1994 |
466 |
48,030 |
9,070 |
7,433 |
353 |
689 |
74,997 |
141,038 |
53 |
|
1995 |
567 |
35,190 |
0 |
19,984 |
128 |
917 |
76,368 |
133,154 |
57 |
|
1996 |
297 |
35,019 |
0 |
24,290 |
7 |
641 |
75,716 |
135,970 |
56 |
|
1997 |
203 |
20,263 |
7,297 |
9,320 |
381 |
841 |
79,862 |
118,167 |
68 |
|
1998 |
610 |
29,183 |
7,280 |
9,993 |
308 |
816 |
84,326 |
132,516 |
64 |
|
NOTE: Acronyms are defined in Appendix F. SOURCE: National Science Foundation, “Survey of Federal Funds for Research and Development,” accessed via WebCASPAR, http://webcaspar.nsf.gov. |
|||||||||
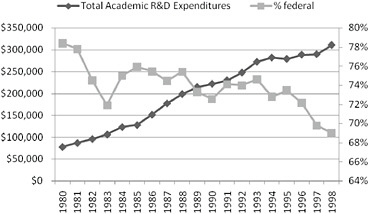
FIGURE 2-1 Total academic research and development (R&D) expenditures and percentage of the federally financed R&D expenditures in mathematics and statistics in the United States, 1980-1998. SOURCE: National Science Foundation, “Survey of Federal Funds for Research and Development,” accessed via WebCASPAR, http://webcaspar.nsf.gov.
The second concern raised by the four important national studies cited was the concentration of funding. The Odom Report suggested that NSF had a high level of responsibility for the stewardship of the mathematical sciences (NSF, 1998, p. 38). This is clear from Table 2-1, which shows support for the mathematical sciences from several federal agencies. The David Report put it somewhat differently, suggesting that NSF might inadvertently have had too much control over policies that should be made by, or with, the broader research community. NSF’s proportion of federal support for graduate students rose from 30 percent in 1980 to about 37 percent in 1998, with most of this occurring between 1984 and 1985, and irregularly otherwise (see Figure D-1 in Appendix D, “The Mathematical Sciences Since 1998,” in this report).
The third point of concern was that federal funding in the mathematical sciences was imbalanced in major ways that hindered the support for and development of young people. As Figure 2-2 shows, most graduate students were supported by nonfederal sources of funding (about 70 percent), followed by self-support (about 20 percent). Federal sources only supported about 10 percent of full-time graduate students in mathematics and statistics during the 1980s and 1990s, and that support was relatively flat as a proportion of total support (although the number of graduate students changed over this time, as noted in Table B-4 in Appendix B, “The Mathematical Sciences in the 1980s and 1990s,” in this report).
The Odom Report noted: “Despite the excellence of the U.S. graduate programs in the mathematical sciences, the students of these programs are provided substantially less federal funding than are students of the other sciences. They depend almost entirely on teaching assistants stipends and on their own resources” (NSF, 1998, p. 31). As Figure 2-3 shows, most students who received support relied on teaching assistantships (TAs) or other mechanisms of support. These mechanisms tend to lengthen the time to degree.
In terms of support mechanisms, federal sources rarely funded full-time graduate students through teaching assistantships—99 percent or more of TAs were funded by nonfederal sources such as state
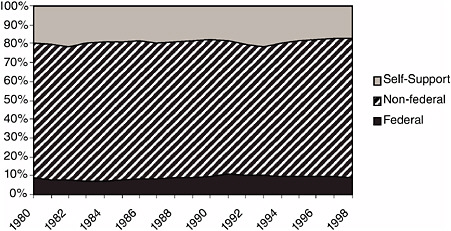
FIGURE 2-2 Sources of support to full-time graduate students in mathematics and statistics in the United States, 1980-1998. SOURCE: National Science Foundation-National Institutes of Health, “Survey of Graduate Students and Postdoctorates in S&E,” accessed via WebCASPAR, http://webcaspar.nsf.gov.
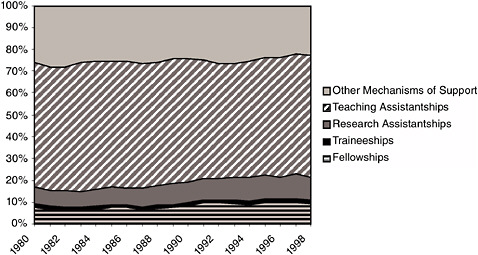
FIGURE 2-3 Mechanisms of support for full-time graduate students in mathematics and statistics in the United States, 1980-1998. SOURCE: National Science Foundation-National Institutes of Health, “Survey of Graduate Students and Postdoctorates in S&E,” accessed via WebCASPAR, http://webcaspar.nsf.gov.
university funds. On the other hand, about half of research assistantships were funded through federal sources, as indicated in Table 2-2.
The NSF (1996) report noted that the funding approach had helped to create an imbalanced focus on research.
Since the main criterion for judging grant applications has traditionally been the quality of the research to be performed, along with the success of past research, this is necessarily where the attention of grant applicants must be focused. Not only does this affect the principal investigators, who may believe they are expected to give lower priority to other aspects of the education of their students in order to keep the funding pipeline open, but it affects graduate and postdoctoral students themselves, who perform most of the labor involved in such research and who are often effectively discouraged from spending time on other educational pursuits not directly involved in their advisor’s research project. [Moreover,] [t]he current funding mechanism (where graduate students are supported primarily by Research Assistantships) also has the effect of allowing a lengthening of the time to obtain a Ph.D. Successful researchers are understandably unwilling to lose graduate students when they have finally become highly productive, and these students may, in turn, prefer the protected, known world of the university over a usually unknown “outside” world. (NSF, 1996, pp. xi, xii)
Table 2-3 shows, for instance, that NSF had used research assistantships most often in supporting graduate students.
Postdoctoral researchers and investigators also faced funding issues in the 1980s and 1990s. According to the Odom Report:
TABLE 2-2 Percentage of Each Mechanism of Support for Full-Time Graduate Students in Mathematics and Statistics in the United States That Comes from Federal Sources, 1980-1998
|
Year |
Fellowships |
Research Assistantships |
Teaching Assistantships |
Traineeships |
Other Mechanisms of Support |
|
1980 |
17 |
54 |
0 |
15 |
10 |
|
1981 |
12 |
45 |
1 |
13 |
11 |
|
1982 |
12 |
45 |
0 |
14 |
10 |
|
1983 |
17 |
44 |
0 |
18 |
9 |
|
1984 |
13 |
47 |
0 |
6 |
8 |
|
1985 |
14 |
48 |
0 |
8 |
10 |
|
1986 |
14 |
52 |
0 |
13 |
10 |
|
1987 |
17 |
57 |
0 |
10 |
8 |
|
1988 |
18 |
54 |
0 |
5 |
10 |
|
1989 |
25 |
51 |
0 |
18 |
7 |
|
1990 |
35 |
46 |
1 |
29 |
7 |
|
1991 |
37 |
47 |
0 |
36 |
7 |
|
1992 |
32 |
49 |
0 |
43 |
6 |
|
1993 |
29 |
51 |
1 |
32 |
6 |
|
1994 |
25 |
48 |
1 |
28 |
7 |
|
1995 |
23 |
45 |
1 |
32 |
7 |
|
1996 |
22 |
47 |
1 |
34 |
7 |
|
1997 |
19 |
45 |
1 |
27 |
8 |
|
1998 |
20 |
45 |
1 |
33 |
7 |
|
SOURCE: National Science Foundation-National Institutes of Health, “Survey of Graduate Students and Postdoctorates in S&E,” accessed via WebCASPAR, http://websacpar.nsf.gov. |
|||||
Lack of financial support thwarts the careers of many young mathematical scientists. Not only is there a lack of sufficient postdoctoral fellowships for new doctorates in the mathematical sciences, but few young researchers are successful in obtaining research grants. With only 35% of academic research mathematical scientists receiving such grants, it is exceedingly difficult for young researchers to pursue careers in research. This lack of support, especially when compared with support for young researchers in the physical, biological, and engineering sciences, discourages young mathematicians, many of whom have left academia for Wall Street and other nonacademic fields. This loss of young researchers has the potential to undermine future U.S. strength in the mathematical sciences (NSF, 1998, p. 28).
As Table 2-4 illustrates, during the 1980s and 1990s about two-thirds of postdoctorates were supported by federal sources, which mainly provide research funds.
Figure 2-4, on the other hand, shows little progress in federal support for academic mathematics doctorate holders through 1999. The proposal success rate—one of several criteria used by NSF to determine adequacy of support—was in the same range as for other fields within NSF’s Mathematics and Physical Sciences Directorate (MPS).
These trends led the 1995 NSF workshop to recommend changing the mix of funding:
Currently, the bulk of graduate student support provided by the Foundation is in the form of awards to individual investigators, who use these funds in part to support graduate students. Many participants agreed that this often has had the unintended consequence of limiting the areas in which students take courses and acquire experience. The Workshop recommended that MPS experiment with means to increase gradu-
TABLE 2-3 Mechanisms of Support by the National Science Foundation for Full-Time Graduate Students in Mathematics and Statistics in the United States, 1980-1998
|
Year |
Percentage of Support Provided by: |
Number of Students Supported |
||||
|
Fellowships |
Traineeships |
Research Assistantships |
Teaching Assistantships |
Other Mechanisms of Support |
||
|
1980 |
37 |
2 |
57 |
2 |
2 |
262 |
|
1981 |
27 |
4 |
67 |
1 |
1 |
227 |
|
1982 |
24 |
4 |
69 |
0 |
2 |
228 |
|
1983 |
36 |
4 |
59 |
0 |
1 |
223 |
|
1984 |
27 |
0 |
69 |
0 |
3 |
279 |
|
1985 |
26 |
2 |
69 |
0 |
2 |
321 |
|
1986 |
26 |
0 |
71 |
1 |
2 |
357 |
|
1987 |
24 |
0 |
73 |
1 |
2 |
436 |
|
1988 |
25 |
0 |
73 |
0 |
2 |
463 |
|
1989 |
27 |
0 |
71 |
1 |
1 |
475 |
|
1990 |
28 |
0 |
68 |
3 |
0 |
491 |
|
1991 |
31 |
0 |
67 |
1 |
1 |
452 |
|
1992 |
26 |
0 |
71 |
2 |
0 |
457 |
|
1993 |
24 |
1 |
71 |
4 |
0 |
470 |
|
1994 |
25 |
4 |
67 |
3 |
0 |
518 |
|
1995 |
27 |
4 |
61 |
6 |
2 |
474 |
|
1996 |
29 |
5 |
59 |
6 |
1 |
435 |
|
1997 |
25 |
5 |
66 |
3 |
1 |
386 |
|
1998 |
23 |
6 |
68 |
1 |
2 |
384 |
|
SOURCE: National Science Foundation-National Institutes of Health, “Survey of Graduate Students and Postdoctorates in S&E,” accessed via WebCASPAR, http://webcaspar.nsf.gov. |
||||||
ally the fraction of graduate students supported on fellowships and traineeships. Further, it recommended that NSF should encourage members of the MPS community in academia to propose new institutional, “thematic” funding mechanisms for graduate student training and support that would involve collective responsibility for groups of students. Funds could be awarded to entire departments, to combinations of departments, or to theme-oriented entities that would allocate resources to students themselves. This would have the effect of allowing departments, or other groups, to take greater ownership of the overall quality of graduate education. The criteria for making awards would have to guarantee that special, new efforts would be made to achieve the desired educational improvements. In addition, NSF could reward and encourage such “collective proposals” that exhibit success in the recruitment and retention of students from underrepresented groups, including women, minorities, and, where applicable, domestic students (NSF, 1996, pp. xiv-xv).
Overall the funding situation in the 1980s and 1990s was characterized by the following:
-
Rising funding overall, but federal funding declining as a share of total funding (from Figure 2-1);
-
Funding for the mathematical sciences being increasingly dependent on NSF (from Table 2-1);
-
Graduate students relying primarily on teaching assistantships and other support mechanisms (from Table 2-3); and
TABLE 2-4 Number of Postdoctorates Supported in Mathematics and Statistics in the United States, 1980-1998, by Mechanism of Support
|
Year |
Federal |
Nonfederal |
Total |
Percentage Federal |
||
|
Fellowships |
Traineeships |
Research Grants |
||||
|
1980 |
23 |
3 |
31 |
105 |
162 |
35 |
|
1981 |
20 |
3 |
41 |
49 |
113 |
57 |
|
1982 |
22 |
4 |
20 |
148 |
194 |
24 |
|
1983 |
27 |
3 |
53 |
87 |
170 |
49 |
|
1984 |
46 |
3 |
83 |
71 |
203 |
65 |
|
1985 |
35 |
6 |
79 |
106 |
226 |
53 |
|
1986 |
39 |
5 |
70 |
87 |
201 |
57 |
|
1987 |
42 |
6 |
81 |
100 |
229 |
56 |
|
1988 |
44 |
5 |
139 |
96 |
284 |
66 |
|
1989 |
38 |
4 |
99 |
84 |
225 |
63 |
|
1990 |
41 |
1 |
116 |
91 |
249 |
63 |
|
1991 |
27 |
3 |
113 |
63 |
206 |
69 |
|
1992 |
23 |
6 |
114 |
58 |
201 |
71 |
|
1993 |
34 |
8 |
124 |
58 |
224 |
74 |
|
1994 |
37 |
7 |
113 |
82 |
239 |
66 |
|
1995 |
39 |
5 |
130 |
88 |
262 |
66 |
|
1996 |
54 |
4 |
164 |
104 |
326 |
68 |
|
1997 |
49 |
2 |
146 |
111 |
308 |
64 |
|
1998 |
41 |
2 |
136 |
100 |
279 |
64 |
|
SOURCE: National Science Foundation-National Institutes of Health, “Survey of Graduate Students and Postdoctorates in S&E,” accessed via WebCASPAR, http://webcaspar.nsf.gov. |
||||||
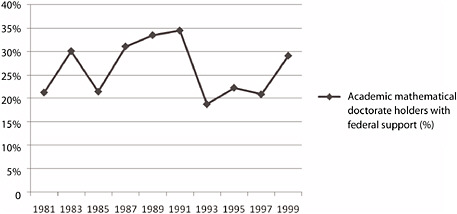
FIGURE 2-4 Percentage of academic doctorate holders in mathematics in the United States with federal support, 1981-1999. NOTE: Data from 1985, 1993, 1995, and 1997 are not comparable to the other years and understate the degree of federal support because a survey question asked whether work performed during the week of April 15 was supported by the government. In other years, this question pertained to work conducted over the course of a year. SOURCE: Adapted from National Science Board (NSB, 2004), Appendix Tables 5-26 and 5-32.
-
Federal graduate student support being overly concentrated in the form of research assistantships rather than in a broader array of professional development mechanisms (from Odom Report [NSF, 1998] extract, above).
STUDENTS IN THE MATHEMATICAL SCIENCES
During the 1980s and 1990s, the mathematical sciences community (as evidenced, for instance, by the David Reports [NRC, 1984, 1990] and the Odom Report [NSF, 1998], was concerned about four major issues with respect to students: (1) the number of students receiving degrees, (2) the lack of racial and gender diversity among the mathematics graduate student body, (3) the declining fraction of U.S. citizens receiving advanced degrees in mathematics, and (4) the lack of sufficient postdoctoral fellowships for new doctorates. As Figure 2-5 shows, during the period from 1980 through 1998, graduate enrollments in mathematics and statistics peaked in the early 1990s and then began to decline through 1998.
While the numbers of graduate students had been changing over time, so too had the demographic characteristics of students in the mathematical sciences. Much has been written about the rising number of foreign students in mathematics higher education as in the sciences and engineering more generally, as well as about the challenges facing the mathematical sciences in attracting, retaining, and advancing a more diverse group of students and scholars. In looking at this group of full-time students, Figure 2-6 shows three demographic trends over the period 1980-1998:
-
The percentage of U.S. citizens and permanent residents among full-time graduate students in mathematics and statistics remained level or declined,
-
The percentage of female full-time graduate students in mathematics and statistics rose, and
-
The percentage of underrepresented minorities among full-time graduate students in mathematics and statistics rose somewhat, but only by a few percent.
Figure 2-7 shows that the number of bachelor’s degrees awarded in the mathematical sciences from 1980 through 1998 rose and then declined. The apparent flatness in the number of master’s and doctor’s degrees is an artifact of the graph. In fact they increased by about 30 percent and 50 percent respectively during the period shown.
Focusing just on doctorates over the same period, Figure 2-8 shows the following:
-
The percentage of doctorates awarded to U.S. citizens and permanent residents declined,
-
The percentage of doctorates awarded to women doubled, and
-
The percentage of doctorates awarded to underrepresented minorities rose by a small amount.
Table 2-5 provides information about the postdoctoral plans of new doctorates between 1982 and 1998. The number of mathematics doctorates with definite plans to move into a postdoctoral appointment had grown somewhat, comparing the early 1980s to the 1990s. At the end of the 1990s, about one in three new doctorate recipients had such commitments.
As Figure 2-9 shows, the number of postdoctorals grew from 1980 to 1988 but then dipped and rose, ending up in 1998 at about where it was for 1988.
The envisioned role of postdoctoral fellowships in completing the training of new PhDs is well stated in the Douglas Report: “The number of postdoctoral fellowships in the mathematical sciences should be greatly increased so that such positions can be viewed as a logical next step after completion
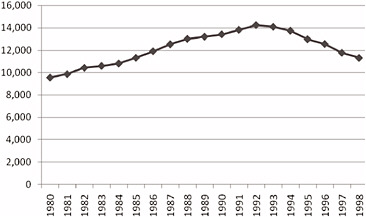
FIGURE 2-5 Full-time graduate students in mathematics and statistics at doctorate-granting institutions in the United States, 1980-1998. SOURCE: National Science Foundation-National Institutes of Health, “Survey of Graduate Students and Postdoctorates in S&E,” accessed via WebCASPAR, http://webcaspar.nsf.gov.
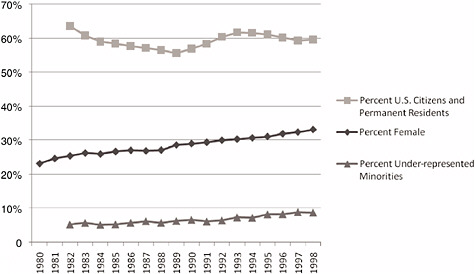
FIGURE 2-6 Percentage of full-time graduate students in mathematics and statistics in the United States who are U.S. citizens and permanent residents, underrepresented minorities, or female, 1980-1998. NOTE: Citizenship and gender are known. “Underrepresented minorities” includes blacks, non-Hispanics; American Indians or Alaska Natives; and Hispanics. Race/ethnicity data include other/unknown in the denominator. Race/ethnicity is only known for U.S. citizens and permanent residents. SOURCE: National Science Foundation-National Institutes of Health, “Survey of Graduate Students and Postdoctorates in S&E,” accessed via WebCASPAR, http://webcaspar.nsf.gov.
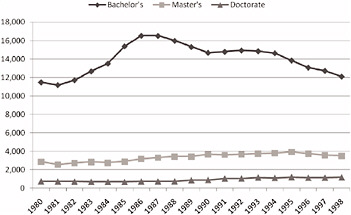
FIGURE 2-7 Number of degrees awarded in the mathematical sciences in the United States, 1980-1998, by degree level. SOURCE: Adapted from NSF, Division of Science Resources Statistics (2008), Table 35.
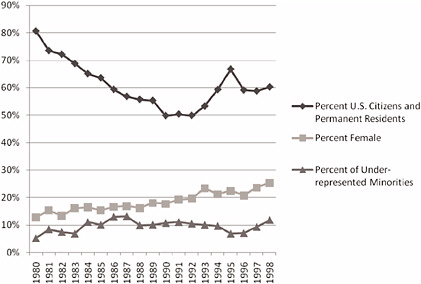
FIGURE 2-8 Percentage of mathematics and statistics doctorates awarded in the United States, by gender, race, and citizenship, 1980-1998. NOTE: The percentage of females is the number of females divided by the number of (females plus males). In some cases gender was unknown. The same is true for citizenship. “Underrepresented minorities” includes blacks, non-Hispanics; American Indians or Alaska Natives; and Hispanics. The percentage of underrepresented minorities is divided by total doctorates, which include some people for whom race/ethnicity is “other/unknown.” SOURCE: National Science Foundation, “Survey of Earned Doctorates/Doctorate Records File,” accessed via WebCASPAR, http://webcaspar.nsf.gov.
TABLE 2-5 New Doctorate Recipients with Definite Commitments to Postdoctoral Study or Research, by Broad Field of Doctorate: 1982, 1993-1998
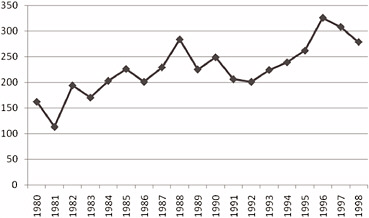
FIGURE 2-9 Number of postdoctorates in mathematics and statistics at doctorate-granting institutions in the United States, 1980-1998. SOURCE: National Science Foundation-National Institutes of Health, “Survey of Graduate Students and Postdoctorates in S&E,” accessed via WebCASPAR, http://webcaspar.nsf.gov.
of the doctorate for the good student, not as a highly competitive prize for a select few” (NRC, 1992, p. 3). In contrast to labor-intensive laboratory sciences in which many research projects require a team of people with differing levels of research experience, there is not a lot of reliance on postdoctorates in the mathematical sciences. Therefore, postdoctoral appointments have never been a common element of career training. In statistics, where there has long been a strong demand for new PhDs in industry, there is scant interest in postdoctoral appointments. And in mathematics, with its tradition of solitary
research, it is not always obvious how to parcel out tasks from a research project to people at different levels of experience. But many in the field recognize the value of a postdoctoral appointment as an opportunity to build research expertise and to develop a track record without the competing demands felt by a junior faculty member. Some see the value of such fellowships as allowing a broadening of training, with “applied, interdisciplinary, or pedagogical components” (NRC, 1992). The 1980s and early 1990s were also a time during which it was difficult to attain a tenure-track faculty appointment, and a number of new PhDs had to make do with “research professorships” or “visiting professorships.”
The David II Report (NRC, 1990) went farther in emphasizing educational issues by entitling a section of its recommendations “Improve the Mathematical Sciences Career Path.” Recognizing, as did the David Report (NRC, 1984), that “the rate at which young people enter the mathematical sciences remains inadequate to renew the field” (NRC, 1990, p. 5), the report made several specific recommendations. Beyond the need for more funding, it advocated that 10 percent of the new funding should “support coherent programs that directly encourage young people to enter and remain in mathematical science careers. Recruitment of women and minorities into the mathematical sciences is a high priority” (ibid., p. 1). The NSF and other federal agencies “should solicit research proposals for programs that will improve the career path. Such proposals may combine research opportunities for students, postdoctorals and young faculty with increased support for senior researchers who can act as mentors” (ibid., p. 7). Another recommendation was for a change in the reward structure of academic departments, which “should give increased recognition to faculty who act as mentors for students and junior colleagues, who contribute to education, and who interact with collaborators from other disciplines” (ibid., p. 7).
REDEFINING MATHEMATICAL SCIENCES PROGRAMS
Four key issues were discussed in the Douglas (NRC, 1992) and Odom (NSF, 1998) Reports: (1) the need for increased breadth of training for students, including greater emphasis on interdisciplinarity, applied mathematics, and off-campus experiences (e.g., internships); (2) providing a better balance of education and research; (3) decreasing time to degree for students; and (4) creating positive learning environments.
Concerning the first issue, breadth of skills and knowledge, the 1995 workshop on graduate education and postdoctoral training noted: “The skills and knowledge acquired by new Ph.D.’s are too narrowly focused, and are not adequately applicable to the diverse business and industry environments in which most Ph.D. scientists actually work” (NSF, 1996, p. x).
The Odom Report, in addition to recommendations about funding, devoted much of its emphasis to the changing nature of the discipline and the implications of those changes for training mathematicians. Its recommendations to NSF addressed the second issue, improving the balance of education and research: “[E]ncourage activities that connect mathematics to other areas of science, technology, business, finance and government, strengthen the connections between ‘pure’ and ‘applied’ mathematics, broaden the exposure of professional and student mathematicians to problems in other fields, and maintain and strengthen abstract mathematics” (NSF, 1998, p. 43). In particular, NSF should “encourage activities aimed at broadening undergraduate and graduate curricula, with the objective of widening the range of curricular choices, raising the attractiveness of mathematical careers to students, and increasing the vocational flexibility of future mathematicians” (ibid., p. 45).
As noted above, time to degree is negatively impacted by the reliance of many students on teaching assistantships and self-support; it could be offset by increasing the number who instead are supported by fellowships. This issue arose because time to degree was growing during the 1980s and 1990s and was raised as a concern in the various reports noted above. As NSF noted in 1997: “In the last decade, the time to degree for a Ph.D. in the Mathematical Sciences has significantly increased from four to
TABLE 2-6 Median Years from Bachelor’s Degree to Doctoral Degree in Mathematics in the United States, 1980-1998
|
Year |
Years Elapsed (median years) |
Years Enrolled (median years) |
|
1980 |
7.0 |
6.0 |
|
1981 |
7.0 |
6.0 |
|
1982 |
7.1 |
6.0 |
|
1983 |
7.3 |
6.3 |
|
1984 |
8.0 |
6.2 |
|
1985 |
8.0 |
6.4 |
|
1986 |
7.3 |
6.1 |
|
1987 |
8.0 |
6.5 |
|
1988 |
8.1 |
6.4 |
|
1989 |
8.0 |
6.3 |
|
1990 |
8.0 |
6.7 |
|
1991 |
8.3 |
6.7 |
|
1992 |
8.9 |
7.0 |
|
1993 |
8.6 |
7.0 |
|
1994 |
8.9 |
6.9 |
|
1995 |
8.6 |
6.9 |
|
1996 |
8.3 |
6.8 |
|
1997 |
8.7 |
7.0 |
|
1998 |
8.0 |
6.8 |
|
SOURCE: Adapted from NSF, Division of Science Resources Statistics (2004), Appendix Table 2-29. |
||
seven years. This partially reflects that entering students, especially native-born students, are less well prepared than before. But also involved is the heavy dependence by the Mathematical Sciences graduate students and postdoctorates on time consuming teaching assignments for financial support” (NSF, 1997). Table 2-6 shows the median years elapsed from bachelor’s to doctoral degree in mathematics during the 1980s and 1990s. The data in this table are inconsistent with NSF’s quoted observations. The committee was unable to determine how NSF arrived at this conclusion and has no additional data to draw other conclusions; however, these observations by NSF played a role in VIGRE’s original design.
The fourth issue common to the Douglas (NRC, 1992) and Odom (NSF, 1998) reports had to do with the culture of mathematics departments. The Douglas Report (NRC, 1992) studied a number of departments in an attempt to find out what makes for successful graduate and postdoctoral programs in mathematics. It found that there was considerable variation in explaining such success, and the report broadly classified these variations as the standard model, the subdisciplinary model, the interdisciplinary model, the problem-based model, and the college-teachers model. Within this varied landscape, the report distilled three common characteristics of all the successful programs that it encountered: a focused, realistic mission; a positive learning environment; and relevant professional development. The report highlighted the importance of active recruitment, especially for recruiting women and underrepresented minorities. A detailed description is given of what it means to have a positive learning environment; and communication and cooperation, effective advising, and early research experience are emphasized. It was also emphasized that “a positive learning environment is important to all doctoral students but is crucial for women and underrepresented minorities” (NRC, 1992, p. 3). The report stressed: “Clustering faculty, postdoctoral associates and doctoral students together in research areas is a major factor in creating a positive learning environment” (ibid., p. 3). The importance of broadening the training of doctoral and postdoctoral students was underscored, as was the importance of teaching and communication skills.


