

CHAPTER 3
Capacity Concepts and Analysis Methods: Passenger-Only Ferries
The following sections outline key concepts and procedures for assessing and planning passenger-only ferry system capacity. This chapter builds on the capacity concepts in Chapter 2 and the terminal sizing and capacity planning guidance for ferries and other transit modes presented in the TCQSM (Ryus et al. 2013) by focusing on how vessel and terminal design can minimize dwell time and on how service schedules and operations can most efficiently use capital assets to maximize system capacity and quality of service for users. Quantitative procedures outlined in this chapter include those presented in the discussions of Equation 1: Calculating operating margin and Equation 2: Passenger boarding station throughput.
Optimizing the Service Schedule
While many factors, such as preferred sailing times for customers and integration with connecting transit, influence schedule planning decisions, the schedule planning component with the largest impact on route capacity is service frequency. The frequency of service depends on the quantity of sailings that can be made throughout the day, as described in the Maximizing Sailing Frequency section of Chapter 2. In order to design a service schedule that maximizes the frequency of service, planning must take into account both the time to complete the trip and the time needed to make the schedule and desired level of on-time performance achievable. Depending on the type of route and service, this additional time may be accounted for by the inclusion of an operating margin, which is the time built into the schedule to account for longer-than-average dwell times or transit times to decrease the risk of the ferry running behind schedule.
This section presents best practices for schedule planning and guidance on how to calculate an operating margin.
Schedule Planning Considerations
Ferry service schedules can be designed to meet various goals, such as maximizing sailing frequency and passenger throughput and focusing on providing sailings at specific times to meet customer needs. Operators that participated in this research study provided feedback on how they have optimized their schedules to get the most capacity.
Best practices identified from responses to the operator questionnaire and review of planning documents are summarized in Table 8.
Operating Margin
The operating margin required for each ferry system will be unique so that it can meet that system’s needs. Ferry operators typically build in extra dwell time or transit time to account for
Table 8. Passenger-only ferry schedule planning best practices.
| Best Practice | Opportunity | Challenges |
|---|---|---|
| Clock-face scheduling | Planning service to run in consistent intervals (e.g., departures every 30 minutes) make the schedule more user-friendly and facilitate multimodal connections and schedule coordination. | Some reduction in system capacity may occur if service frequency is not maximized. |
| Collection and regular review of detailed ridership and vessel utilization data to inform schedule planning | Detailed understanding of ridership trends can support ferry operators in designing service schedules. | Data collection and tracking require investment in technology and staff resources. |
| Maximize scheduled trips within the peak commute windows | Maximizing the frequency of scheduled trips during peak periods focuses system capacity and resources where demand is highest. | On-time schedules may be difficult to maintain during the peak periods, requiring time built into the schedule after the peak period to allow vessels to catch up. |
| Schedule and capacity coordination with connecting transit | For ferry services with lower frequencies of service, matching schedules with land-based transit supports walk-on ridership. Because ferries often have more passenger capacity than connecting transit modes, capacity must also be coordinated to avoid creating wait times for multimodal connections. | Schedule coordination typically requires interagency coordination (often far in advance of schedule changes) and real-time communication. |
trips that take longer than average during the service schedule. Factors that may contribute to longer-than-average time underway include above-normal maneuvering due to conditions around the terminal, weather-related factors such as high seas and fog, excessive debris, and waterway traffic.
Developing an understanding of operating margin needs can support schedule planning, system performance, and operating efficiencies through:
- Comparison of operating margin to on-time performance to assess potential efficiencies (if there is too much time built into the schedule) or the need for additional operating margin (to make the schedule achievable), and
- Assessment of which sailings or sets of sailings have round-trip times that are above or below the average, including potential schedule adjustments for peak/off-peak sailings or periods.
A method for understanding the time needed to account for typical delays and longer-than-average dwell times is presented in Equation 1 and its discussion. To apply the equation to their service, operators must gather data related to arrival, departure, and dwell times over a given period of time.
Equation 1. Calculating operating margin.
Om = TT – (Tr + Mt + Dt)
where
| Om |
= average operating margin (minutes). |
| TT |
= scheduled total trip time of a set of sailings over a designated period of time (minutes). Trip time could include a trip segment, one-directional trip, or round trip. |
| Tr |
= average transit time of a set of sailings (minutes). |
| Mt |
= average maneuvering time required for vessel approach and departure for a set of sailings (minutes). |
| Dt |
= average time required to complete passenger loading/unloading and necessary vessel functions of a set of sailings (minutes). |
Implementing an operating margin requires policy decisions regarding the importance of maintaining on-time departures for each sailing (requiring operating margin assessment for each trip) or the level of tolerance for some late departures during peak periods. The same amount of operating margin may not be applied uniformly over every departure and can be added to targeted sailings or sets of sailings when routes face higher risk of running behind schedule. Additionally, the ways in which operating margin can be accounted for vary by service.
The operator questionnaire asked how and when operating margin is included in service schedules and whether there are instances of extra or layover time built into schedules to allow vessels that are running late to get back on time. Based on the questionnaire results, best practices to account for an operating margin include those discussed in the following:
- While extra time is not built into the schedule specifically to allow vessels that are running late to catch up to the schedule, dwell times on many routes are varied to make the schedule achievable. Factors considered in varying dwell times include ridership patterns (time of day, day of week, season), navigational requirements (wake, maneuvering, marine traffic), crew changes, and vessel logistics (pumping, fueling).
- On a route with frequent late departures, crews can make up time during the crossing by increasing vessel speeds or during the next vessel dwell time if lower passenger or vehicle volumes occur.
- Additional dwell time is scheduled for crew changes and can be used to make up time when needed.
- Some schedules have time built in to allow for longer dwell times to accommodate larger volumes of traffic. Major route schedules may be developed assuming less than full vessel operating speed, which provides some ability to make up time in the schedule.
Passenger Facility Capacity Planning and Minimizing Dwell Time
Designing Passenger Facilities to a Level of Service
Chapter 10, Station Capacity, of the TCQSM (Ryus et al. 2013) includes guidance and methods for estimating capacity requirements of passenger terminal spaces, as noted in Table 9.
Table 9. Terminal capacity planning references from the TCQSM (Ryus et al. 2013).
| Item Description | Reference | Page Number |
|---|---|---|
| Illustration of walkway level of service | Exhibit 10-4 | 10-14 |
| Illustration of queuing (waiting) area level of service | Exhibit 10-5 | 10-14 |
| Relationship between walking speed and pedestrian space | Exhibit 10-10 | 10-21 |
| Relationships between pedestrian flow rate and pedestrian space | Exhibit 10-11 | 10-22 |
| Doorway capacity | Exhibit 10-26 | 10-40 |
| Fare control passenger headways and capacity | Exhibit 10-27 | 10-42 |
| Relationship between walkway width and pedestrian flow rate | Equations 10-2, 10-3 | 10-43 |
| Pedestrian level of service on walkways | Exhibit 10-28 | 10-44 |
| Queuing (waiting) area level of service | Exhibit 10-32 | 10-55 |
| Platform (waiting area) sizing procedure | Not applicable | 10-56 |
Additional guidance and best practices have been developed by operators and agencies. Table 10 presents guidance for sizing specific passenger spaces for terminals based on LOS from the TCQSM (Ryus et al. 2013), along with example guidance from the 2016 WSF Terminal Design Manual (Washington State Department of Transportation Ferries Division 2016), and the 2019 Auckland Transport Design Manual: Ferry Terminal Design (Auckland Transport 2019). All three sources use the pedestrian LOS descriptions for space requirements for walking and queuing from those categorized in Fruin (1971). Pedestrian LOS does not have to be consistent throughout terminal elements. (For example, a level of service with lower pedestrian density can be planned for stairs than for walkways.)
Capacity planning for passenger spaces should include some dedicated space for seating. Recommendations for planning of seating requirements are included in Habib et al. (1980), based on the following intervals:
- Fifteen minutes appears to be the maximum tolerable waiting time for passengers in terminal facilities with minimal seating.
- Intervals of 15 to 20 minutes indicate a need for seating for 20% to 40% of passengers.
- For passenger comfort, wait times of over 20 minutes require more seating.
Optimizing Capacity by Improving Passenger Movement
Passenger-only ferry operations include the passenger flow between the terminal entrance and the vessel. Passenger flow through the terminal and operational elements of ferry loading and unloading are discussed in more detail in the TCQSM (Ryus et al. 2013) and Habib et al. (1980).
Terminal elements, including passenger walkways, queuing space, fare collection and passenger counting, and multimodal connections, all contribute to dwell time. The following sections provide best practices and guidance for terminal design and operating considerations for reducing dwell time. The considerations discussed include those related to fare collection and passenger counting, passenger throughput, queuing space planning and management, bicycle management for passenger-only ferries, and multimodal connections.
Fare Collection and Passenger Counting
For most ferry services, fare collection represents the limiting factor (the slowest point) in passenger throughput through the terminal and onto the vessel. The relationship of fare collection to dwell time has been documented for various transit modes.
Table 10. LOS guidance for sizing passenger terminal spaces.
| Terminal Element | TCQSM | WSF Terminal Design Manual | Auckland Transport Design Manual |
|---|---|---|---|
| Holding space | Plan LOS based on how long passengers are anticipated to wait (LOS C to D or better) | LOS C | LOS C |
| Walkways | Size walkway width for peak-period passenger flows to operate at LOS C or above | LOS C | LOS D (one-way) or LOS C (two-way) |
| Number of ticket kiosks or windows | Calculate number of ticket vending machines (Equation 10-1) | Maximum queue of six people with a maximum wait of 3 minutes | Maximum queue of six people |
| Waiting area amenities and seating | Base seating requirements on maximum number of people who would choose to sit and average waiting time | Assume 50 to 100 square feet for amenities; assume a minimum of 24 seats in passenger waiting areas | Minimum seating varies depending on terminal type |
Unlike other transportation modes, ferry service in the United States must adhere to the Coast Guard requirement for accurate passenger counts for each sailing, including the assurance that the passenger count of each sailing does not exceed the maximum number of passengers specified on the vessel COI. Different approaches to fare collection may be used by different types of service based on the terminal layout (type of queuing or passenger holding area, distance between holding and vessel boarding, staff or crew availability, and operating costs). It is common for fare collection to be completed by one or more staff or crew members near the point where passengers board the vessel.
Fare types: Decisions regarding which types of fare media will be used may be based on policy, staffing/crewing considerations for ticket sales and validation, capital costs of new technology, risk of fare evasion, or ease of use for users or crew. The optimal fare collection types for each system are dependent on the operations and users of that system. Electronic fare options can support integration with other transit options to support multimodal trips and may encourage ferry ridership. While offering more options for fare payment may make the service easier to use for more passengers, the use of multiple fare payment systems may complicate operations and require more staff or dwell time. Fare collection options commonly used by ferry operators include those discussed in the following:
- Cash: Time required to accept cash and provide change may influence dwell time. Safe cash handling requires staff/crew time.
- Fare cards: Fare cards provide the opportunity for integration with other modes and easy transfers. They are scanned by handheld or stationary readers.
- Mobile tickets: Mobile tickets are scanned by handheld or stationary readers.
- Paper tickets: Paper tickets are sold by ticket vending machines or terminal staff.
- Proof-of-fare system: Passengers are required to purchase a ticket or scan a pass at a validation machine on entering the terminal. Instead of checking all passengers as they enter a fare control zone or board the vessel, the operator requires that each passenger purchase a fare using the honor system. Some operators may enforce fare payment using random spot checks and issuing fines for passengers without proof of fare.
- Reservations: Online reservations allow for prepayment of fares and can provide boarding information to users. Passengers can typically be processed at a faster rate than when fare payment transactions are involved at the terminal. For example, the Woods Hole, Martha’s Vineyard, and Nantucket Steamship Authority uses reservations for its high-speed passenger-only ferry service and reports that the system manages dwell time efficiently but may require more time than systems using other forms of fare prepayment.
Location of fare collection: The location of fare collection or validation in relation to queuing and vessel boarding determines whether fare collection becomes the limiting factor in passenger throughput. Fare collection can occur on board the vessel, at the point where passengers board the vessel, or in the terminal before passengers enter a prepaid holding area.
Table 11 provides a high-level summary of the different fare location options, along with fare processing rates, presented in the TCQSM (Ryus et al. 2013). The processing rates apply to a single fare collection point and would be multiplied by the number of collection points when calculating facility throughput. The accuracy of these rates depends on the technologies and procedures used by each operator, as well as the types of ridership served, and may vary by system.
Passenger Throughput
The rate at which passengers move to and from the vessel through the terminal, or passenger throughput, is a key consideration for planning system capacity. Ferry terminals may require longer distances between passenger holding or queuing and vessel boarding than other transit
Table 11. Fare location options.
| Fare Collection Location | Considerations | Fare Collection Type | Processing Rate (Per Station or Staff) (Passengers/Minute) |
|---|---|---|---|
| On board vessel | Can be challenging to complete on short crossings or medium/large vessels | Manual collection of cash or tickets | 14–15 |
| Scan of fare card | 21–26 | ||
| Scan of mobile ticket | 15–201 | ||
| At the dock or boarding ramp | Fare collection occurs during embarking or disembarking process and becomes the limiting factor on throughput/dwell time | Manual collection of cash or tickets | 14–15 |
| Scan of fare card | 21–26 | ||
| Scan of mobile ticket | 15–201 | ||
| Terminal | Minimizes dwell time by completing fare transactions outside of dwell time | Barrier and holding area | Varies |
1 Source: Observations by NYC Ferry.
modes, and circulation paths may be more limited due to security considerations or the constraints of a waterfront site. The longer paths of travel can increase dwell time.
This research involved observing passenger throughput for three passenger-only ferry systems. (Data and findings are provided in Appendix B.) The research team observed the following related to passenger throughput:
- Shorter paths of travel for passengers allow passengers to board faster. Of the ferry systems observed, bow-loading vessels had shorter passenger circulation paths than side-loading vessels, which resulted in a 25%–30% increase in passenger throughput.
- Ramp or gangway slopes are not critical to the speed of passenger travel.
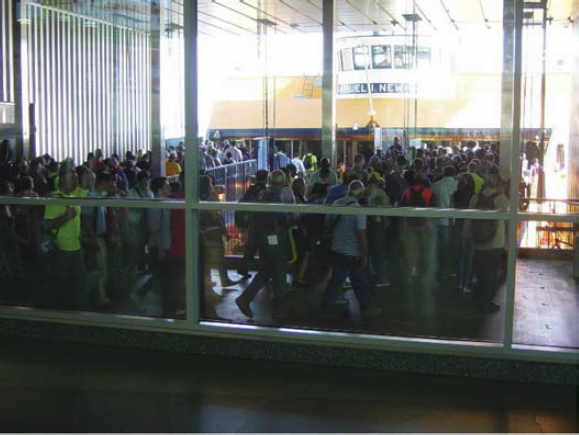
The Staten Island Ferry carries the most passengers of any ferry system in the United States and is mandated to provide consistent, reliable service between Manhattan and Staten Island. Achieving reliable service requires moving high volumes of passengers disembarking and embarking the vessel in a short duration of time. To do this, the Staten Island Ferry has two boarding aprons (shown in Figure 4) that are 12 feet wide, allowing for the movement of just over 400 passengers per minute (identified in an unpublished ferry operational impact analysis).
Best practices identified from responses to the operator questionnaire and review of planning documents are summarized in Table 12.
Queuing Space Planning and Management
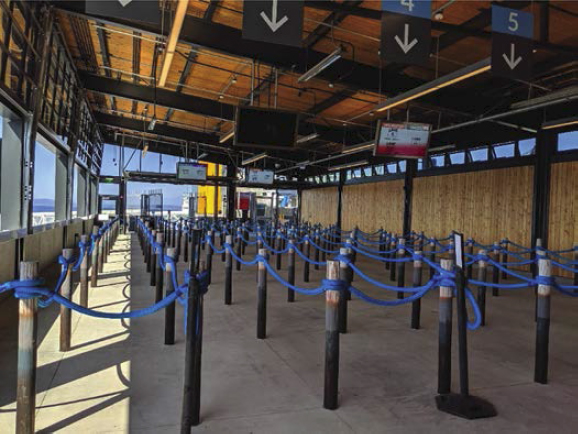
Existing ferry and transit research provides guidance for sizing and calculating capacity of queuing and holding areas, as discussed earlier in this chapter in the Designing Passenger Facilities to a Level of Service section. Queuing spaces can be designed for linear queuing (where lanes are one person wide) or bunched queuing (where lanes may be several people wide). Figure 5 shows an example of linear queuing at the Pier 50 passenger facility in Seattle, WA.
Queuing type selection may depend on various factors, including:
- How efficiently the passenger space must be used based on available space and the number of people that must be accommodated. (Linear queuing requires more square footage to queue the same number of people.)
- How quickly passengers need to move through the space to maintain planned dwell times.
- The number of routes served by the terminal, which affects how many separate queue lanes are required.
- The importance of the order of passenger arrival and the ability to process passengers one at a time.
Table 12. Vessel–terminal interface design best practices.
| Best Practice | Opportunity | Challenges |
|---|---|---|
| Bikes load and unload separately from all other passengers | Speed up embarking and disembarking process by separating pedestrians from bicycles, avoiding bicycle/pedestrian conflicts and bottlenecks on ramps or on the vessel. | Communication of policy. Since bicyclists move faster than pedestrians do outside of the terminal, they want to unload first to avoid the conflict of passing the pedestrians at a later point in time. Order of loading and unloading may depend on factors such as queuing design and where bicycles are stored on the vessel. |
| Consider movement of bicycles, strollers, luggage, and personal mobility devices in design of passenger walkways | Minimize impacts to passenger throughput from bicycles, strollers, luggage, and personal mobility devices by incorporating their movement into design. | Passenger facility design may require additional space or features to facilitate movement. |
| Implement a reservation system | Online reservations allow for prepayment of fares and can provide boarding information to users. Passengers can typically be processed at a faster rate than when fare payment transactions are involved at the terminal. For example, the Woods Hole, Martha’s Vineyard, and Nantucket Steamship Authority uses reservations for its high-speed passenger-only ferry service and reports that the system manages dwell time efficiently. |
Expensive to implement and manage the reservation technology Possible challenges with user acceptance for routes serving commuters or a mixture of island residents and tourists May require space at terminal for additional queuing lanes or verification of reservations |
| Provide added terminal staff during periods of high volume | Adding terminal staff during special events or peak weekend periods to assist with higher volumes and questions from first-time ferry users can help reduce bottlenecks in the terminal and minimize dwell times. | Increased operating costs |
| Wayfinding improvements | Improved signage can help new users understand how to pay their fares and make their way through the terminal and onto the vessel, reducing bottlenecks and questions to staff. | Requires signage program development as well as associated costs to implement |
Successful design and operation of passenger queuing focus on minimizing dwell time by queuing passengers as close to the vessel as possible and facilitating efficient movement. Table 13 summarizes best practices for queuing space design and management used by various passenger-only ferry operators, as gathered from the operator questionnaire and review of planning documents and operator guidance.
Bicycle Management for Passenger-Only Ferries
Considerations for accommodating and managing bicycles on passenger-only ferries include minimizing dwell time impacts from bicycles loading and unloading over gangways and ramps that may be narrow or steep, and storage space on the vessel, which may be limited.
- Loading and unloading: Passenger-only ferry operators use different approaches for how they manage loading and unloading of bicycles, depending on the typical bicycle demand as well as the size and layout of the vessel and terminal infrastructure. Depending on the space
Table 13. Best practices for queuing space design.
| Best Practice | Opportunity | Challenges |
|---|---|---|
| Provide adequate queuing based on full capacity of all vessels that may depart in the same window of time | Minimize dwell time by queuing passengers as close to vessel as possible. Minimize risk of passengers overflowing onto sidewalks and affecting connecting sidewalks and communities | Terminals can have considerable space requirements, and waterfront sites are often constrained. |
| Queue passengers as close to the vessel as possible | Minimize required walk time to reduce dwell time | Requires fare collection located upstream of a holding area. Providing ramps and floats with adequate space for queuing may require additional capital costs, overwater coverage, and safety considerations. |
| Use outdoor spaces for waiting/queuing | Ability to increase capacity during typically peak summer months | Exposure to weather |
| Use fixed queuing lanes for each route | Passengers know where to queue for their route. Passenger flows are directed to the vessel. | Lack of operational flexibility, which may increase terminal space requirements |
- Storage on the vessel: In most cases, bicycle storage on the vessel requires racks or designated space. If feasible, bicycle storage on the vessel should provide protection from weather and water spray. The location of the storage area affects the decision about when to load and unload bicycles relative to other passengers. Planned bicycle capacity may require a policy decision at the time of vessel design.
available in passenger facilities, potential pedestrian/bicycle conflicts may occur when loaded and unloaded together, such as extra time and space needed for maneuvering bicycles and injuries from pedals.
Examples of how different passenger-only ferry systems manage bicycles are summarized in Table 14.
Multimodal Connections
Since ferry terminals are located at the shoreline, they are adjacent to but not central to supportive land uses and dense activity centers. As a result, ferry passengers rely on other connections to expand their access. Planning considerations for multimodal connections include the quality (directness to major destinations, comfort, and cost) and quantity (frequency, capacity, and number of options) to provide this access. Typically, the opportunity for integration with multimodal connections is greatest for terminals located in urban areas with an existing transit network. Payne et al. (2013) provide an overview of how well various ferry operations are integrated with land-based transit and how that coordination occurs. Integration is achieved through operations and facility design.
Operations.
Successful integration with multimodal connections requires coordination with connecting agencies both in planning stages and during ongoing operations.
- Capacity coordination: Generally, ferries have a much higher passenger capacity than connecting transit modes such as buses. Because ferries unload in large surges of passengers, connecting transit vehicles may need to be scheduled to arrive at ferry terminals in bunches rather than spaced out evenly, as is preferred for other types of transit stops.
Table 14. Bicycle management examples – passenger-only ferries.
| Service | Bicycle Loading | Storage on the Vessel |
|---|---|---|
| King County Water Taxi | Loading and unloading procedures for passengers with bicycles are the same as for those without bicycles. |
Stored either on the stern of the vessel or in the vessel’s interior (depending on the vessel) in bike racks Only bicycles less than 73 inches in length, 15 inches in width, and with a tire diameter less than 2.5 inches are accepted aboard. |
| NYC Ferry | Loading and unloading procedures for passengers with bicycles are the same as for those without bicycles. |
Passengers store their bicycles on racks at the rear of the vessel. Capacity is limited to 8 to 10 bicycles per ferry. |
| San Francisco Bay Ferry | Bikes and scooters board at the same time as everyone else. On arrival on weekend days, riders with bikes must wait for the rest of the passengers to disembark first, while during the week, bikes and scooters offload first. | All bikes, including folding bikes, are stored in the bike rack area on the aft deck. |
| Steamship Authority (high-speed passenger-only route) | Bicycles are loaded and stored prior to passenger loading. | Stored in the luggage compartment |
- Fare integration: Facilitating passenger connections through integrated fare payment options (such as the Clipper card used by 24 transit agencies, including the San Francisco Bay Ferry and Golden Gate Ferry) and transfers can reduce fare processing times and support increased ridership.
- Schedule coordination: Synching arrival and departure times of connecting transit with ferries to allow passengers to directly connect with other modes improves the passenger experience and can lead to increased ridership. Coordination with other agencies may require significant planning time.
- Wayfinding and travel information: Interagency coordination of travel information such as routes, schedules, and real-time travel data can improve passenger experience and terminal throughput.
Terminal Design.
Types of multimodal connections and their considerations for terminal design are summarized in the following:
-
Bicycle: Capacity planning considerations for bicycle connections include access (how bicycles get to and from the terminal) and storage.
- Bicycle access and exit lanes: Dedicated bicycle lanes, separated from vehicle and pedestrian traffic, provide the safest and highest-capacity connection for bicycles. The WSF Terminal Design Manual recommends a minimum bike lane width of 4 feet and lanes that are separated from motorized traffic (Washington State Department of Transportation Ferries Division 2016).
- Charging for e-bikes: Providing charging equipment for electric bicycles can support multimodal connections and can be considered depending on demand and space availability.
- Storage at the terminal: To support bicycle use as a multimodal connection for walk-on passengers, storage for bicycles should be provided at the terminal. The most common storage option is bike racks, which have minimal space and maintenance requirements but do not provide security or weather protection. As an alternative, bike lockers or bike stations can be provided, although this option increases cost and space requirements and may involve ongoing staffing or administrative support to manage user access, security, and payments (if required).
- Bus and train: Locating transit pick-up/drop-off spaces, including bus pullouts and turnarounds, as close to the vessel as possible reduces the walking distance for passengers to transit connections and increases terminal throughput.
- Micromobility: Micromobility services, including those that rent electric scooters and bicycles, can collect equipment at terminals since passengers use the scooters and bicycles to travel to and from the ferry. Planning a designated curb space for micromobility drop-off may reduce instances of rentals blocking pedestrian walkways. Operators can also coordinate with micromobility service providers to site stations close to terminals.
- Parking/park and ride: Insufficient parking capacity may limit ridership unless transit connections are adequate to connect people to the terminal.
-
Pedestrian: Design of pedestrian connections to the terminal should take into account both the capacity and the ease of access.
- Distance: Pedestrian terminal entrances should be located as close as possible to trail, sidewalk, or transit connections.
- Grade: The quality of pedestrian connections depends on the distance to transit connections and destinations as well as the ease of the walk.
- Pedestrian bridges: In situations where a terminal is located near a busy roadway or railroad crossing, a pedestrian bridge can provide safe pedestrian access with free-flow pedestrian movement to and from the terminal.
- Safety and comfort: Lighting along walkways, amenities such as benches, and barriers separating passengers from vehicle and bicycle lanes all contribute to the safety and comfort of pedestrians using the terminal.
- Rideshare and microtransit: Providing designated rideshare zones and curb pullouts can reduce traffic backups near the terminal.
Minimizing Dwell Time Through Vessel and Terminal Design
The design of shoreside facilities can affect dwell time, service reliability, and capacity. For many passenger-only ferry systems, especially those with shorter routes or high-speed vessels, minimizing dwell time provides the greatest opportunity to increase schedule capacity.
The following sections focus on elements of passenger-only ferry system assets (vessels and terminals) that affect overall system capacity. Discussed are best practices and procedures for the vessel–terminal interface, vessel design, and how sizing and siting terminal elements affect the rate at which passengers move through the terminal. Optimal vessel and vessel–terminal interface design varies by operator and terminal and depends on factors such as the layout of terminal facilities and in-water space available for vessel maneuvering, conditions near the terminal, and operating or schedule requirements. Additionally, operators with an existing fleet benefit from standardization of vessel types.
Vessel–Terminal Interface
The vessel–terminal interface includes terminal elements such as gangways, floats, and ramps that connect passengers to and from the vessel. Design and capacity requirements for the facility components that connect the vessel and terminal are influenced by vessel size, passenger demand, terminal context, and environmental considerations.
Best practices for vessel–terminal interface design identified from responses to the operator questionnaire and review of planning documents are summarized in Table 15.
Table 15. Vessel–terminal interface design best practices.
| Best Practice | Opportunity | Challenges |
|---|---|---|
| Gangway and ramp capacity | Size for two-way passenger flow (including multiple lanes in each direction, depending on passenger volumes) to minimize dwell time by allowing passengers to queue closer to the vessel before loading | Increased capital costs and overwater coverage for wider gangways |
| Gangway and ramp slope | Avoid gradients steeper than 1:12 to 1:14 across shorter distances. Include impacts of tidal range where applicable. | Longer ramp lengths may be required to avoid steep gradients and achieve ADA compliance. |
| Vessel design | Vessel design should take into consideration how the vessel interfaces with terminal infrastructure and associated impacts to dwell time. For example, bow-loading vessels that push into the dock (using engine thrust to hold the vessel against the platform during embarking and disembarking) may require less time for vessel maneuvering and mooring. Additionally, providing a similar freeboard between vessel and ramp or platform provides an easy walking surface from vessel to platform. | Vessel design must be compatible with existing terminal design, or improvements to the terminal may be required to accommodate the vessel. Vessel design must also account for considerations such as route operating conditions and emissions reduction goals. For example, bow-loading vessels require additional engine power to secure the vessel to the mooring facility. Using more fuel adds emissions to the environment, and using more electrical energy may reduce the cycle between charging periods for an electric powered vessel. |
The TransLink SeaBus, a passenger ferry that connects downtown Vancouver to North Vancouver crossing the Burrard Inlet, provides a unique example of highly efficient dwell time achieved through vessel–terminal interface design. Vessels land in a U-shaped dock, which allows passengers to load and unload through subway-style doors on either side of the vessel simultaneously. There are multimodal transit connections nearby. The SeaBus carried an average of almost 20,000 passengers on weekdays in 2019. The SeaBus system is discussed in detail by Habib et al. (1980), Payne et al. (2013), and Ryus et al. (2013).
Vessel Boarding Station Width
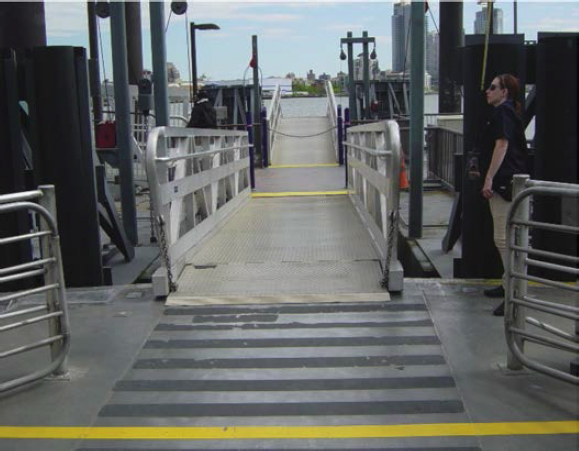
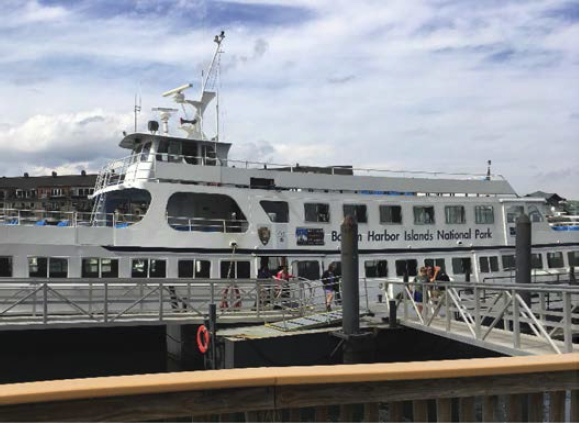
For some ferry systems, vessel boarding may be the point in the passenger path of travel where queues occur. Understanding the rate at which passengers load and unload the vessel supports capacity and schedule planning and can support analysis of capacity improvements. For example, if an operator is planning a new vessel construction, design of the boarding station width can consider the required passenger throughput needed to meet planned dwell times. Examples of boarding stations for bow-loading vessels and side-loading vessels are shown in Figures 6 and 7.
The design and number of vessel boarding stations, or vessel doors through which passengers board and deboard the vessel, affect the passenger flow rate and the total time needed for passenger embarking and disembarking. Assuming that the corresponding gangways and ramps support a comparable or faster passenger flow rate, operators can reduce dwell time by increasing the rate of passenger throughput at the vessel boarding station.
As part of this research, boarding station widths were observed for three passenger-only ferry systems. Based on the observations and calculations, the research team determined that doubling the width of boarding doors can increase passenger throughput, but marginal increases in door width from about 5 feet to 7 feet have minimal impact on passenger throughput.
A procedure for calculating the passenger throughput of a given vessel boarding station (assuming that the boarding process does not include fare collection or validation) is represented in Equation 2 and its discussion.
Equation 2. Passenger boarding station throughput.
Rpfm = (N ÷ S) ÷ W
where
| Rpfm |
= rate of passenger throughput of a given vessel doorway. |
| N |
= number of passengers embarking and disembarking. |
| S |
= speed of embarking and disembarking time. |
| W |
= width of vessel boarding station. |
This equation is intended to provide a framework for understanding the relationship between variables. Because of the differences between each ferry system, operators must determine the values for each variable in order to calculate a value specific to their system.
This procedure does not account for passenger circulation on the vessel or the ramp passengers use to unload and connect to the terminal. Additional research on how different vessel or ramp designs contribute to the amount of time passengers require to unload would help define other factors that contribute to dwell time.


