

CHAPTER 5
Example Capacity Procedures Use
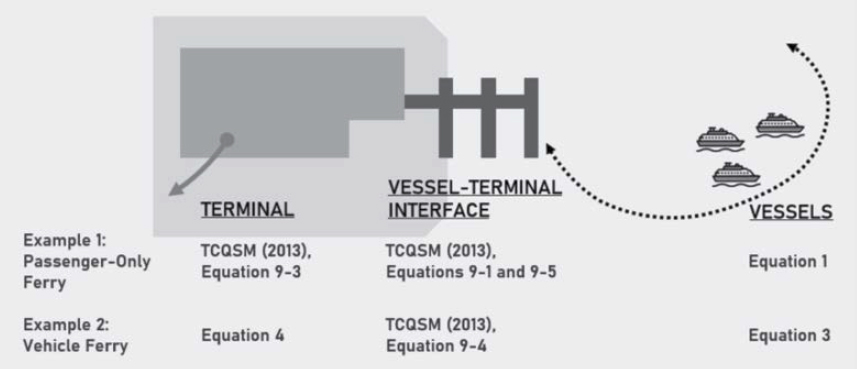
The following sections outline hypothetical scenarios that will be used to demonstrate the process of assessing a capacity problem and developing potential solutions. The scenarios include application of the capacity concepts, quantitative procedures, and best practices outlined in this report, as well as equations and guidance from previous reports. Figure 9 shows the equations used in the two example capacity procedures under the terminal element where they are applied. In addition to the quantitative procedures, the examples also contain qualitative discussions of the interrelated ferry service elements that could be affected by a change in capacity, as well as different options that the hypothetical operators may have to address their capacity challenges.
Example 1: Passenger-Only Ferry
A passenger-only ferry operator with multiple vessels on multiple routes connecting to one urban terminal is exploring how to increase capacity to service growing demand during the commute periods. The operator needs to understand whether a busy hub terminal currently serving two routes can support additional service during the 3-hour peak morning and evening commute windows, and needs to plan operational and capital improvements to increase capacity. The analysis encompasses assessing the use and capacity of the existing terminal facilities, and, if necessary, identifying operational changes or additional capital improvements to provide additional capacity. The steps that follow outline how the operator can assess the capacity of the terminal to serve vessels and passengers and can identify potential limiting factors and improvements.
Step 1: Evaluate Current Berthing Capacity
First, the operator must evaluate the hub terminal’s berthing capacity to understand whether additional vessel landings can be accommodated. In this example, ridership demand is greatest during peak commute times; therefore, the operator will base its evaluation on the peak demand periods. Using Equations 9-1 and 9-5 of the TCQSM (Ryus et al. 2013) and the current average scheduled dwell time, the operator estimates that four vessel landings per hour can be accommodated at each of the facility’s two berths, meaning that the facility can accommodate a maximum of eight vessel landings per hour.
The operator then compares the estimated maximum number of vessel landings per hour (eight) to the current number of landings in the peak hour (six), resulting in the potential for two vessel landings to be added during the peak hour.
The feasibility of fully using available berthing capacity within the peak period depends on sailing schedules and the frequency of vessel sailings and may mean that vessel landings
need to be scheduled based on available berthing windows rather than on preferred arrival and departure times for riders. In this case, the float and gangways are sized to accommodate two-way passenger traffic, so two berthed vessels are able to load and unload simultaneously. In addition, consideration must be given to potential impacts of maneuvering time requirements from added vessel traffic. In this example, the float is located in a constrained waterway that only has space for one vessel to maneuver at a time, which means that service schedules must include time between vessel landings to stagger vessel departing and arriving times and avoid the risk of vessels having to lay off and wait to land if a departing vessel is behind schedule, even if they are not scheduled to use the same berth.
For more information, see the Vessel Berthing Capacity section of Chapter 2.
Step 2: Evaluate Current Passenger Throughput and Dwell Time
In Step 1, the operator estimated that two additional vessel landings per hour could be accommodated during the peak period using current scheduled dwell times. To understand whether the increased passenger volumes from two added sailings can be accommodated in the terminal facilities connecting to the vessel without affecting dwell times, the operator must assess the embarking and disembarking capacity of the terminal. As a first step, Equation 9-3 of the TCQSM (Ryus et al. 2013) can be used to calculate embarking and disembarking times for each vessel landing. (Because the example terminal can accommodate two-way passenger flow, the estimated dwell time only includes the greater of the embarking or disembarking service time.) In this example, the operator calculates that passenger embarking rates are not sufficient to maintain the dwell times required to add two additional sailings.
Using the guidance presented in Chapter 3, the operator can review terminal operations and passenger flow to identify terminal elements where constraints on throughput and capacity may occur. One approach to reviewing passenger flow would be to observe terminal operations during peak commute periods and note where queues regularly occur as arriving and departing passengers move through the terminal. Once areas of constraint are identified, the operator can review potential capital improvements and operating best practices to increase throughput. Examples of potential improvements to address common areas of constraint on passenger throughput include the following:
- Fare collection: For many operators, fare collection represents the greatest opportunity to increase passenger throughput without expansion of terminal facilities. Potential improvements
- Movement of passengers with bicycles, luggage, or personal mobility devices: Terminal elements should be designed to reduce points of constraint and bottlenecks.
- Vessel boarding station: When new vessels are added to the fleet, vessel design should include consideration of boarding station width and vessel layout in relation to passenger boarding time.
include locating fare collection upstream of a holding area to allow free-flow boarding, as well as implementation of new fare technologies such as mobile ticket scanning.
For more information, see the Minimizing Dwell Time through Vessel and Terminal Design and Optimizing Capacity by Improving Passenger Movement sections of Chapter 3.
Step 3: Review Operating Margin Requirements
Before exploring potential schedule adjustments, the operator should review current on-time performance and scheduled dwell and transit times to determine whether the current service schedules are achievable or if additional time or operating efficiencies are needed to reduce the risk of late sailings. Using Equation 1, the operator calculates the operating margin used on each route.
Om = TT – (Tr + Mt + Dt) = 40 – (29 + 7) = 4 minutes
where
| Om |
= average operating margin (minutes). |
| TT |
= scheduled total trip time of a set of sailings over a designated period of time (minutes). Trip time could include a trip segment, one-directional trip, or round trip. |
| Tr |
= average transit time of a set of sailings (minutes). |
| Mt |
= average maneuvering time required for vessel approach and departure for a set of sailings (minutes). |
| Dt |
= average time required to complete passenger loading/unloading and necessary vessel functions of a set of sailings (minutes). |
Using the average dwell time, maneuvering time, and transit time experienced during a peak-hour one-way trip and comparing that total to the scheduled total trip time during that period, the operator calculates that each one-way trip incorporates a 4-minute operating margin. The operator reviews the on-time performance for the route during the same period, finding that while the route meets its overall on-time performance goal (at least 95% of all sailings depart within 5 minutes of scheduled departure time), on-time performance for trips within the peak period is only 89%. Therefore, review of operating margin requires a policy decision regarding agency priorities.
For example, if the agency’s goal is an overall 95% on-time performance target, then no additional operating margin is required for peak period sailings because the reduced demand and lower dwell-time requirements outside of the commute hours allow vessels to get back and stay on schedule so that they can meet the on-time performance target.
If the agency wishes to address the lower on-time performance during the peak period, then potential solutions include:
- Additional operating margin that can be added to trips during the peak period, and
- A review of vessel and terminal operations to look for potential efficiencies or opportunities to decrease trip time or dwell time.
For more information, see the Performance Metrics to Measure Capacity section of Chapter 2 and the Operating Margin section of Chapter 3.
Example 2: Vehicle Ferry
An agency that operates a lifeline route with a single vessel connecting passengers and vehicles to an island is planning to replace its aging vessel, which has a capacity of 20 vehicles and completes a round trip in 30 minutes. This major investment is expected to serve the route for at least 30 years. The agency is seeking guidance on how to size the replacement vessel to serve current and forecast demand. Because passenger demand is not forecast to exceed vessel capacity, the agency is focused on the number of vehicles carried by the replacement vessel.
Step 1: Establish Desired Level of Service
In order to make decisions regarding how much passenger and vehicle capacity is needed to serve current or forecast ridership, the agency must establish a desired LOS. This process can include multiple steps and factors, including the following:
- Complete a ridership demand forecast to estimate future capacity needs.
- If a priority of the system or agency involves promoting mode shift from drive-on to walk-on passengers, account for implementation of demand management strategies and associated impacts to forecast demand and targeted service levels.
- If a system or agency goal is to realize emissions reductions or pursue related funding opportunities, review potential impacts to service levels from application of new vessel technologies.
- Establish the level of demand that will be used as the targeted capacity for planning (e.g., the 85th percentile demand day).
This information will support the operator in establishing the number of vehicles that must be carried over a given period. Because the new vessel may not have the same service schedule, LOS planning may include trade-off decisions between vessel size and service frequency.
In this example, the operator defines its LOS based on a maximum wait time of 1 hour for vehicles, using forecast vehicle demand during the peak hour of the 90th percentile demand day for a 15-year planning horizon. To provide the established LOS, the replacement vessel must be capable of carrying 160 vehicles in each direction over a 2-hour period. Based on the current round-trip time of 30 minutes, this would require a vessel capacity of 40 vehicles.
For more information, refer to the Governance and Policy Factors section of Chapter 2 and the Optimizing Capacity with Demand Management section of Chapter 4.
Step 2: Establish AEU Measurement
To plan the design of the new vessel, the agency must also establish the AEU to use for vessel planning and communication of vehicle capacity. The AEU should be based on a review of available historic vehicle sizing data or an observation of typical vehicle demand as well as the best practices of other operators.
In this case, the operator establishes an AEU of 19 feet by 8.5 feet, which includes the space between vehicles. Using Equation 3, the operator can estimate the vehicle capacity of replacement vessels by applying the AEU.
Equation 3. Using AEU to calculate vehicle capacity of the vessel.
VS = L/(AEU + S) + C
where
| VS |
= number of standard vehicles (rounded down to nearest whole number). |
| L |
= linear feet of straight lanes available for vehicle use. |
| C |
= number of standard vehicles that can be accommodated in curved-lane sections. |
| AEU |
= length in feet of the AEU used by the service or route. |
| S |
= space between vehicles. (In this example, AEU includes the space between vehicles.) |
For more information, see the Providing Space for Various Vehicle Sizes section of Chapter 4.
Step 3: Understand Vessel Sizing Opportunities and Constraints
In addition to the number of vehicles that need to be carried each sailing and the AEU established in Steps 1 and 2, sizing the replacement vessel includes consideration of route, environmental, and regulatory factors. Potential considerations include minimum vessel sizes for seakeeping based on route operating conditions, impacts to crewing and security requirements based on passenger capacity, and compatibility with existing terminal infrastructure.
The desired capacity could also be provided with a larger vessel and less frequent service or with two smaller vessels with more frequent service. In this case, the operator does not have tie-up berths available for more than one vessel so decided not to explore potential two-vessel service.
For more information, see the Vessel and Fleet Planning section of Chapter 2.
Step 4: Calculate Impact of Using a Larger Replacement Vessel
Once the agency has established the vehicle capacity needed to provide the desired LOS and reviewed any constraints on vessel and fleet size, it must determine whether the existing terminal facility can accommodate the larger vehicle loads or if terminal improvements may be required. The total vehicle capacity and number of lanes required for vehicle staging can be reviewed based on the guidance for sizing and designing vehicle holding areas provided in Chapter 4. In addition, the capacity of connecting intersections and roadways should be reviewed to determine whether backups may occur that could affect the vehicle unloading/loading process. If constraints are anticipated, early coordination with the local municipality or department of transportation may be required.
Assessment of the increase to vehicle capacity with the replacement vessel should also include assessing potential impacts to the service schedule. Because the time required to load and unload vehicles is typically the controlling factor for dwell time, understanding the impact of the number of vehicles carried by the replacement vessel is key to planning service frequency. Using Equation 9-4 of the TCQSM (Ryus et al. 2013), the agency can estimate the time required to load and unload vehicles using the planned vehicle capacity of the replacement vessel.
In this example, increasing the vessel capacity from 20 to 40 vehicles is estimated to increase dwell time from 5 to 10 minutes, making the current 30-minute round-trip time unachievable. In order to provide the desired LOS, the operator must either use a larger-capacity vessel with less frequent sailings to carry the same number of vehicles over a period of time, or implement capital and operational improvements to reduce dwell time. Potential improvements include:
- Widening the loading ramp to two lanes to allow two vehicles to load or unload simultaneously, and
- Locating fare collection outside of a prepaid vehicle holding area that has capacity for at least one full vessel load of vehicles.
For more information, see the Minimizing Dwell Time and the Vehicle Terminal Capacity Planning and Minimizing Dwell Time sections of Chapter 4.
Step 5: Explore Options for Monitoring Level of Service
In order to monitor the continuing performance of the system and support planning for future capacity, the operator must have a way of tracking LOS performance. In this example, the operator is interested in collecting data related to the wait time experienced by vehicles once they enter the holding area or queue. One method of collecting data related to vehicle wait times would be to monitor the length of the queue and estimate the number of full vessel loads of vehicles that are waiting based on the location of the last vehicle in line. In order to implement this data collection, the operator installs cameras to remotely monitor the holding area and points along the roadside queuing lane. During peak demand periods when the holding area capacity is exceeded and vehicles queue along the roadway outside of the terminal, the operator reviews the recorded queue length and estimates the number of vehicles in the queue after a sailing departs based on the estimated location of the last vehicle. To facilitate this data collection process, the operator has several marked locations with associated vehicle counts, estimated using Equation 4.
Equation 4. Estimating vehicles left behind.
VLB = L/(AEU + S)
where
| VLB |
= estimated number of vehicles left behind. |
| L |
= linear feet of queuing lanes including holding area and roadside queuing. (For calculating roadside queuing use the distance from holding area minus areas that cannot be used for queuing such as intersections or driveways.) |
| AEU |
= length in feet of the AEU used by the service or route. |
| S |
= space between vehicles (if not included in AEU). Note that space between queued vehicles is greater than the space between vehicles planned on the vessel. |
For more information, see the Vehicles Left Behind section of Chapter 4.


