
2
The Making of a People
Rubén G. Rumbaut
Americans have their leveling ways: La Ciudad de Nuestra Señora la Reina de Los Angeles de Porciúncula has become, in one hundred years, L.A.
—Richard Rodríguez (1993)
In 2003 the Hispanic population of the United States reached 40 million—or 44 million if the inhabitants of the Commonwealth of Puerto Rico are included (U.S. Census Bureau, 2004b). Only Mexico (with a population above 100 million) is larger among Spanish-speaking countries today. The rapid growth of the Hispanic population—which had been estimated at only 4 million in 1950—has been stunning (Table 2-1).1 Its current growth rate is four times that of the total population. The U.S. Census Bureau (2004a) has projected that, given continuing immigration and moderate levels of natural increase, Hispanics will grow by 2050 to an estimated 103 million people and account for 25 percent of the national total, significantly exceeding the proportions of other ethnic or racial minorities. And while Hispanic Americans now account for one of every seven persons in the United States, their impact—social, cultural, political, and economic—is much more profound because of their concentration in particular states and localities. The origins, present status, and complex trajectories of this population thus merit careful analysis.
|
1 |
The Hispanic population (as variously defined over the years and estimated by the U.S. Census Bureau) grew from 6.9 million in 1960 to 9.1 million in 1970, 14.6 million in 1980, 22.4 million in 1990, and 35.2 million in 2000. In 1960, Hispanics accounted for only 3.9 percent of the total U.S. population; that proportion tripled to 12.5 percent in 2000. For a detailed analysis of the growth of the U.S. Hispanic population between 1960 and 1980 and of the problems of measuring it (and of adjusting for census undercounts and intercensal comparability), see Bean and Tienda (1987). For its growth from 1980 to 2000, see Table 2-1. |
TABLE 2-1 Size (1000s) and Growth of the Hispanic Foreign-Born Population of the United States, by Spanish-Speaking Country of Birth, 1980–2000
|
Country of Birth |
Year of Census |
% Population Growth |
|||
|
1980 |
1990 |
2000 |
1980–1990 |
1990–2000 |
|
|
North America and Caribbean |
|||||
|
Mexico |
2,194 |
4,263 |
9,177 |
94 |
115 |
|
Puerto Ricoa |
1,011 |
1,180 |
1,437 |
17 |
22 |
|
Cuba |
617 |
738 |
873 |
20 |
18 |
|
Dominican Republic |
166 |
344 |
688 |
107 |
100 |
|
Central America |
|||||
|
El Salvador |
95 |
465 |
817 |
392 |
76 |
|
Guatemala |
64 |
221 |
481 |
246 |
118 |
|
Honduras |
37 |
106 |
283 |
185 |
166 |
|
Nicaragua |
44 |
168 |
220 |
282 |
31 |
|
Panama |
60 |
83 |
105 |
38 |
26 |
|
Costa Rica |
29 |
31 |
72 |
3 |
134 |
|
South America |
|||||
|
Colombia |
147 |
287 |
510 |
95 |
78 |
|
Ecuador |
88 |
139 |
299 |
57 |
116 |
|
Peru |
57 |
144 |
278 |
155 |
93 |
|
Argentina |
68 |
95 |
125 |
40 |
32 |
|
Venezuela |
32 |
42 |
107 |
29 |
157 |
|
Chile |
37 |
56 |
81 |
54 |
43 |
|
Bolivia |
14 |
30 |
53 |
119 |
79 |
|
Uruguay |
14 |
22 |
24 |
58 |
10 |
|
Paraguay |
3 |
6 |
12 |
90 |
101 |
|
Spain |
54 |
78 |
87 |
44 |
12 |
|
Total |
4,831 |
8,498 |
15,786 |
76 |
86 |
|
aPuerto Ricans born in Puerto Rico are included here as foreign-born. SOURCE: U.S. Census Bureau, Census 2000 Summary File 3; 1980, 1990, and 2000 Integrated Public Use Microdata Series, at http://www.ipums.org. |
|||||
The making of this population needs to be understood from three vantage points. Hispanics are at once a new and an old population made up both of recently arrived newcomers and of old timers with deeper roots in American soil than any other ethnic groups except for the indigenous peoples of the continent.2 They comprise a population that can claim both
a history and a territory in what is now the United States that precede the establishment of the nation.
At the same time, it is a population that seems to have emerged suddenly, its growth driven both by accelerating immigration from the Spanish-speaking countries of Latin America—above all from Mexico, which shares a 2,000 mile border with the United States—and by high rates of natural increase. Indeed, 45 percent of the total Hispanic population of the United States today is foreign-born, and another 31 percent consists of a rapidly growing second generation of U.S.-born children of immigrant parents. Table 2-1 shows the growth of the foreign-born Hispanic population from 1980 to 2000 by country of birth. Already by 1990, for the first time in U.S. history, Spanish-speaking Latin Americans formed the largest immigrant population in the country—larger than the flows from Asia and Europe combined. By 2000, Mexican immigrants alone were more numerous than all European and Canadian immigrants combined, and more than all Asian, African, and Middle Eastern immigrants combined.
And the label itself—“Hispanic”—is new, an instance of a pan-ethnic category that was created by official edict three decades ago. The ethnic groups subsumed under this label—the Mexicans, Puerto Ricans, Cubans, Dominicans, Salvadorans, Guatemalans, Colombians, Peruvians, Ecuadorians, and the other dozen nationalities from Latin America and from Spain itself—were not “Hispanics” or “Latinos” in their countries of origin; rather, they became so only in the United States. That catchall label has a particular meaning only in the U.S. context in which it was constructed and is applied, and where its meaning continues to evolve.
This chapter reviews each of these three aspects—the classificatory, the historical, and the contemporary. The chapter highlights differences that most clearly distinguish the Hispanic population from non-Hispanics—especially in history and language, as well as place, race, national origins, immigration, generation, citizenship, and social status.3 Moreover, the chap-
|
|
cultures, above all in Cuba; for three centuries, African slave labor was brought in successive waves. In the continent, native American populations were concentrated especially around two agrarian empires in what are now Mexico and Perú; their physical and cultural continuities have been preserved by their descendants in the mainly Nahuatl and Maya speakers of Mexico and Guatemala, and the mainly Quechua and Aymara speakers of Perú, Ecuador, and Bolivia. For a population history and an analysis of current ethnic profiles and Amerindian survivals in each of the countries of the region, see Collier, Blakemore, and Skidmore (1985, pp. 127–160). |
ter takes account of the differences between the largest Hispanic ethnic groups, emphasizing that Hispanics as a whole are not a homogeneous entity and should not be presumed to be so. However, despite those group differences, the tens of millions of persons so classified do share a common label that symbolizes a minority group status in the United States, a label developed and legitimized by the state, diffused in daily and institutional practice, and finally internalized (and racialized) as a prominent part of the American mosaic. That this outcome is, to a considerable extent, a self-fulfilling prophecy does not make it any less real.
I raise and address a number of questions about Hispanic Americans: Who are they, where did they come from, and when? In what ways can their diverse peoples be considered a unique population? How do they differ from non-Hispanics in the United States? Do a common language and cultural tradition, as well as a shared history once in the United States, make the essential difference in the maintenance of a pan–Latin American ethnicity? Is there a Hispanic or Latino ethnic group, cohesive and self-conscious, sharing a sense of peoplehood in the same way that there is an African American people in the United States?4 Or is it merely an administrative aggregate devised for statistical purposes, a one-size-fits-all label that subsumes diverse peoples and identities? Is the focus on Hispanics or Latinos as a catchall category misleading, since it conceals not only the enormous diversity of contemporary immigrants from Spanish-speaking Latin America but also the substantial generational differences among groups so labeled? How do the labeled label themselves? How do the
|
|
the U.S.-born second-and-beyond generations. Since 1980, the decennial censuses have been constrained by the deletion of the parental nativity question that had been asked from 1870 to 1970—making it impossible to distinguish the first and second (foreign parentage) generations from each other and from the third-and-beyond (native parentage) generations. Fortunately, since 1994 the annual Current Population Survey (CPS) has included items on maternal and paternal country of birth, permitting such intergenerational analysis. For this reason, several of the chapters in this volume make use of the CPS as a primary data source. However, the CPS has its own limitations—including the fact that, unlike the decennial census, it does not collect data on languages spoken, level of English proficiency, or linguistic isolation. Given the central importance of language in the study of Hispanic Americans, in this chapter the 2000 census is used as the primary data source. |
quintessential markers of group difference in the American experience (phenotype, language, religion, nationality, citizenship, ancestry) differentiate Hispanics or Latinos as a whole from other pan-ethnic or racial aggregates (the non-Hispanic white, black, Asian, and American Indian populations)?
I begin with a discussion of the origin of the category itself and its use in official ethnic and racial classification. I then examine the historical origins of the Hispanic presence in the United States, tracing the roots of its three oldest and largest groups (Mexicans, Puerto Ricans, and Cubans). Finally, I highlight a set of salient characteristics and contexts that distinguish the contemporary Hispanic population as a whole from non-Hispanics and the major Hispanic ethnic groups from each other—issues elaborated in greater detail in the chapters that follow.
THE MAKING OF A CATEGORY
Beginning in 1850, the U.S. Census Bureau relied on objective indicators, such as country of birth (or decades later, parent’s birthplace, mother tongue, or Spanish surname), to identify persons of Mexican origin in its decennial counts.5 A century later, in the 1950s, the Census Bureau first published information on persons of Puerto Rican birth or parentage; tabulations on people of Cuban birth or parentage were first published in 1970. Efforts to demarcate and enumerate the Hispanic population as a whole, using subjective indicators of Spanish origin or descent, date back to the late 1960s (Bean and Tienda, 1987). At that time—in the context of surging civil rights activism, new federal legislation that required accurate statistical documentation of minority group disadvantages, and growing concerns over differential census undercounts—Mexican American organizations in particular pressed for better data about their group (Choldin, 1986). The Nixon White House ordered the addition of a Spanish-origin self-identifier on the 1970 census (it was included only in the “long form” sent to a 5 percent sample, since 109 million copies of the “short form” had already gone to press); to test it, the same question was inserted in the November 1969 CPS (the first time that subjective item was used).6
In 1976, the 94th Congress of the United States passed a remarkable
bill—Public Law 94-311 (see Box 2-1), a joint resolution “relating to the publication of economic and social statistics for Americans of Spanish origin or descent.” It remains the only law in the country’s history that mandates the collection, analysis, and publication of data for a specific ethnic group, and it goes on to define the population to be enumerated. The law, building on information gathered from the 1970 census, asserted that “more than 12 million Americans identify themselves as being of Spanish-speaking background and trace their origin or descent from Mexico, Puerto Rico, Cuba, Central and South America, and other Spanish-speaking countries”; that a “large number” of them “suffer from racial, social, economic, and political discrimination and are denied the basic opportunities that they deserve as American citizens”; and that an “accurate determination of the urgent and special needs of Americans of Spanish origin and descent” was needed to improve their economic and social status. Accordingly, the law mandated a series of data collection initiatives in the federal departments of Commerce, Labor, Agriculture, and Health, Education, and Welfare, specifying among other things that the Spanish-origin population be given “full recognition” by the Census Bureau’s data collection activities through the use of Spanish language questionnaires and bilingual enumerators, as needed; and that the Office of Management and Budget (OMB) “develop a Government-wide program for the collection, analysis, and publication of data with respect to Americans of Spanish origin or descent.”
In May 1977, as required by Congress, OMB’s Statistical Policy Division, Office of Information and Regulatory Affairs, issued Directive 15: Race and Ethnic Standards for Federal Statistics and Administrative Reporting to standardize the collection and reporting of “racial” and “ethnic” statistics and to include data on persons of “Hispanic origin.” Directive 15 specified a minimal classification of four “races” (American Indian or Alaskan Native, Asian or Pacific Islander, black, and white) and two “ethnic” backgrounds (of Hispanic origin and not of Hispanic origin) and allowed the collection of more detailed information as long as it could be aggregated within those categories. Since that time, in keeping with the logic of this classification, census data on Hispanics have typically been officially reported with a footnote indicating that “Hispanics may be of any race.”
Tellingly, however, the term led to the development of another category, “non-Hispanic white” (a catchall for persons who identify as white but whose ancestry does not include a Spanish-speaking nation), which has
|
|
themselves as Hispanic; in the rest of the United States, only 61 percent of those who identified as Hispanic had Spanish surnames, and a mere 46 percent of those with Spanish surnames identified as Hispanic (U.S. Census Bureau, 1975). |
|
BOX 2-1 Public Law 94-311 [H.J.Res. 92]; June 18, 1976 Joint Resolution relating to the publication of economic and social statistics for Americans of Spanish origin or descent. Whereas more than twelve million Americans identify themselves as being of Spanish-speaking background and trace their origin or descent from Mexico, Puerto Rico, Cuba, Central and South America, and other Spanish-speaking countries; and Whereas these Americans of Spanish origin or descent have made significant contributions to enrich American society and have served their Nation well in time of war and peace; and Whereas a large number of Americans of Spanish origin or descent suffer from racial, social, economic, and political discrimination and are denied the basic opportunities they deserve as American citizens and which would enable them to begin to lift themselves out of the poverty they now endure; and Whereas improved evaluation of the economic and social status of Americans of Spanish origin or descent will assist State and Federal Governments and private organizations in the accurate determination of the urgent and special needs of Americans of Spanish origin or descent; and Whereas the provision and commitment of State, Federal, and private resources can only occur when there is an accurate and precise assessment of need: Now, therefore, be it Resolved by the Senate and House of Representatives of the United States of America in Congress assembled, that the Department of Labor, in cooperation |
been typically set against the term “Hispanics” and the other racial minority categories, conflating the distinction. In the news media, academic studies, government reports, and popular usage the “ethnic” constructs “Hispanic” or “Latino”7 have already come to be used routinely and equivalently alongside “racial” categories such as Asian, black, and non-
|
with the Department of Commerce, shall develop methods for improving and expanding the collection, analysis, and publication of unemployment data relating to Americans of Spanish origin or descent. SEC. 2. The Department of Commerce, the Department of Labor, the Department of Health, Education, and Welfare, and the Department of Agriculture shall each collect, and publish regularly, statistics which indicate the social, health, and economic condition of Americans of Spanish origin or descent. SEC. 3. The Director of the Office of Management and Budget, in cooperation with the Secretary of Commerce and with the heads of other data-gathering Federal agencies, shall develop a Government-wide program for the collection, analysis, and publication of data with respect to Americans of Spanish origin or descent. SEC. 4. The Department of Commerce, in cooperation with appropriate Federal, State, and local agencies and various population study groups and experts, shall immediately undertake a study to determine what steps would be necessary for developing creditable estimates of undercounts of Americans of Spanish origin or descent in future censuses. SEC. 5. The Secretary of Commerce shall ensure that, in the Bureau of the Census data-collection activities, the needs and concerns of the Spanish-origin population are given full recognition through the use of Spanish language questionnaires, bilingual enumerators, and other such methods as deemed appropriate by the Secretary. SEC. 6. The Department of Commerce shall implement an affirmative action program within the Bureau of the Census for the employment of personnel of Spanish origin or descent and shall submit a report to Congress within one year of the enactment of this Act on the progress of such program. Approved June 16, 1976. |
Hispanic white, effecting a de facto racialization of the former. It is now also commonplace to find newspaper articles that report matter-of-factly that the country’s first Hispanic astronaut was Franklin Chang-Díaz, a Chinese Costa Rican, or that the first Latina chancellor of a University of California campus (Silverstein, 2003) is France A. Córdova, a French-born physicist who majored in English at Stanford, whose mother is an Irish American native New Yorker and whose father came to the United States as an 8-year-old from Tampico.8
Later criticism of the categories led to a formal review of Directive 15, beginning in 1993 with congressional hearings and culminating in revised standards that were adopted in 1997 (U.S. Bureau of the Census, 1997; see also Fears, 2003b; Snipp, 2003; Wallman, Evinger, and Schechter, 2000; Wright, 1994). The changes now stipulated five minimum categories for data on “race” (American Indian or Alaskan Native, Native Hawaiian or Other Pacific Islander, Asian, black or African American, and white); offered respondents the option of selecting one or more racial designations (an option used for the first time in the 2000 census); and reworded the two “ethnic” categories into “Hispanic or Latino” and “not Hispanic or Latino.” “Hispanic or Latino” was defined as “a person of Cuban, Mexican, Puerto Rican, South or Central American, or other Spanish culture or origin, regardless of race. The term, ‘Spanish origin,’ can be used in addition to ‘Hispanic or Latino.’” The notice in the Federal Register of these revisions to OMB Directive 15 (as adopted on October 30, 1997) pointedly added that “The categories in this classification are social-political constructs and should not be interpreted as being scientific or anthropological in nature…. The standards have been developed to provide a common language for uniformity and comparability in the collection and use of data on race and ethnicity by Federal agencies.” Nonetheless, Directive 15’s definitions of “racial” and “ethnic” populations are used not only by federal agencies, but also by researchers, schools, hospitals, business and industry, and state and local governments—and are conflated, abridged, and diffused through the mass media, entering thereby into the popular culture and shaping the national self-image.
THE MAKING OF A PAST
The Hispanic Prologue
Despite the seemingly sudden emergence of Hispanics or Latinos as a new, prominent—and official—part of the American mosaic, it is also the case that, with the sole exception of the indigenous inhabitants of the Americas, the country’s Spanish roots are much older than those of any other groups. They antedate by a century the creation of an English colony
|
|
greatest hitters but not as a Latino player: his mother, May Venzer, was a Mexican American Baptist who married a soldier named Samuel Williams and moved to San Diego, where Ted grew up and May came to be known as “the Angel of Tijuana” for her Salvation Army work there. In his autobiography, Ted Williams (2001) wrote that “if I had had my mother’s name, there is no doubt I would have run into problems in those days, [with] the prejudices people had in Southern California.” |
in North America and have left an indelible if ignored Spanish imprint, especially across the southern rim of the United States, from the Atlantic to the Pacific (Fernández-Shaw, 1972; Fuentes, 1992; Jiménez, 1994; Sánchez, 1991; Weber, 1992). In U.S. popular culture and in official narrative and ritual the American past has been portrayed as the story of the expansion of English America, suppressing if not silencing the Hispanic presence from the nation’s collective memory (see Walton, 2001). But past is prologue, and no understanding of the Hispanic peoples in the United States today or of the category under which they are now grouped can ignore the historical and geographic contexts of their incorporation.
The Spanish origins of what is now the United States date to 1513, when Juan Ponce de León first came to La Florida, as he named it. Spanish explorers drew the first maps of the Texas coast and of the northern Atlantic coast through Georgia and the Carolinas (where a colony was established in 1526) and up to the mouths of what would later be named the Hudson, the Connecticut, and the Delaware rivers; in 1570 Spanish Jesuits established a mission in Virginia, decades before Roanoke and Jamestown. By the early 1540s they had sailed up the California coast as well, and other explorers—among them Albar Núñez Cabeza de Vaca and Esteban de Azamor (a black Moor), Hernando de Soto, Coronado—had walked across what are now Texas, New Mexico, Arizona, Oklahoma, Colorado, Tennessee, Alabama, Arkansas, Missouri, and Kansas (ubiquitous “Coronado was here” historic markers can still be found alongside roads in these states). By the time of the American Revolution, Spain had cast a wide net of Hispanic culture and communities stretching from San Diego and Los Angeles to San Francisco on the west coast; throughout the Southwest from Tucson to Santa Fé, El Paso, and San Antonio; along the Mississippi River from St. Louis to New Orleans; and eastward through towns that stretched to Florida’s Atlantic coast by way of Mobile, Pensacola, and Tallahassee. Between the two coasts, as the historian David Weber has noted (1992), Spain claimed much of the American South and the entire Southwest—at least half of the present U.S. mainland—and Spain governed these areas for well over two centuries, a period longer than the United States has existed as an independent nation. When in 1763 Louisiana (until then French) came under Spanish rule, the Mississippi River divided most of what is now the continental United States into two enormous zones: one, to the east, English; one, to the west, Spanish.9 In 1783, when Florida was returned to
Spain, the entire southern corridor from California to Florida was once again Spanish-ruled—but Spain’s hegemony in the Americas would decline soon after.
Thousands of place names, from Sacramento to Cape Cañaveral—including six states—silently testify to these Spanish antecedents, as well as others for whom the Spanish derivation is not so obvious: for instance, Key West derives from Cayo Hueso (literally Bone Key), words that English speakers would mispronounce and misspell (Weber, 1992). Coast to coast, there are regions of the country in which every town and village bears a Spanish name, and in them can be found the first missions, ranches, schools, churches, presidios, theatres, public buildings, and cities in U.S. history (Rumbaut, 1978). Spanish St. Augustine in Florida, founded in 1565, is the oldest city in the United States; San Miguel Church in Santa Fé, New Mexico, has been used for Catholic worship since 1610. The New Mexico missions, one for every pueblo, were flourishing by 1630. San Antonio was founded in 1718, with a mission that would play a key role in Texan and American history more than a century later: El Alamo. San Diego, California, was founded in 1769, with the first in a chain of 21 missions extending to San Francisco, founded in 1776.
In the United States, the collective memory of these silent antecedents remains clouded by remnants of prejudices and stereotypes whose roots go to colonial rivalries in the 16th century between Spanish America and English America. Anti-Spanish propaganda in Protestant Europe and America built into the leyenda negra (black legend), now centuries old, whose original intent was to denigrate Catholic Spanish culture throughout the world and to portray Spaniards as a uniquely cruel and depraved race (Jiménez, 1994; Maltby, 1968). That legend was kept alive whenever conflict arose between English- and Spanish-speaking societies in America in the 1800s, especially during the Texas Revolt (1836), the U.S.–Mexican War (1846–1848), and the Spanish American War (1898). Two wartime slogans—“Remember the Alamo!” and “Remember the Maine!”—and the
|
|
Havana (which the British armada had captured the year before). English Florida did not join its 13 sister colonies during the subsequent American Revolution of 1776; in fact, many English loyalists (Tories) fled to the Florida settlements at the time. When the Revolutionary War ended in 1783, Britain was forced to give up most of its American possessions; the Second Treaty of Paris returned Florida to Spain in return for the Bahamas (which had been captured by Spain after it declared war on England in 1779 during the American Revolution). The Tories who had earlier fled to Florida now moved to the Bahamas to remain under the British crown. In 1819, after years of diplomatic wrangling, Spain signed the Adams-Onis Treaty, ceding Florida to the United States and drawing a definite border between Spanish land and the Louisiana Territory; that treaty was not ratified by the United States and the new republic of Mexico until 1831. |
first five words of the oldest song of the U.S. armed forces, the Marine Corps hymn, “From the halls of Montezuma”10—may be the most vivid remnants of these transformational wars in American memory. The Mexican War (largely forgotten in the United States but remembered in Mexico as la invasión norteamericana) was the first foreign war started by the United States and transformed the nation into a continental power; the treaty that ended it, along with the annexation of Texas that preceded it, expanded the territory of the United States by a million square miles, while severing nearly half of Mexico’s. Five decades later, the Spanish American War gave the United States possession of Spain’s last remaining colonies in Cuba, Puerto Rico, and the Philippines, transforming it into a global power.
The peoples of the conquered territories were absorbed into the expanding boundaries of the nation as second-class citizens. This was the case above all in the American (formerly the Mexican) Southwest: for a full century after the 1840s, Mexican Americans were subjected to laws, norms, and practices similar to the Jim Crow apartheid system that discriminated against blacks after the Civil War—injustices, most deeply rooted in Texas, that caused Mexicanos in the Southwest to see themselves as foreigners in a foreign land (Deutsch, 1987; Deverell, 2004; Foley, 2004; Montejano, 1987; Shipman, 1992; Weber, 1973, 1982).
The countries of the Caribbean Basin, and among them particularly Mexico, Puerto Rico, and Cuba, have felt most strongly the weight, and the lure, of the U.S. hegemonic presence. They include countries that, since the days of Benjamin Franklin (who already in 1761 suggested Mexico and Cuba as goals of American expansion) and Thomas Jefferson (who spoke Spanish fluently), were viewed as belonging as if by some “laws of political gravitation” (the phrase is John Quincy Adams’ in 1823, who also crafted the Monroe Doctrine) to the manifest destiny of the United States, in a Caribbean long viewed as “the American Mediterranean” (the term is Alexander Hamilton’s, writing in The Federalist in 1787). And they include countries whose ties with the United States are more recent, but who have emerged as major sources of Latin American immigration since the 1980s—notably the Dominican Republic, El Salvador, Guatemala, and Colombia, with other sizable flows from Nicaragua, Honduras, Perú, Ecuador, and elsewhere (Moncada and Olivas, 2003). Not surprisingly, given historical
patterns of economic, political, military, and cultural influence established over the decades,11 it is precisely these countries whose people have most visibly emerged as a significant component of American society.
Origins and Destinies: Mexicans in the United States
Mexicans are by far the largest and the oldest of Hispanic ethnic groups, and they have been incorporated overwhelmingly as manual laborers (see Barrera, 1979; Gutiérrez, 1995). When the Treaty of Guadalupe-Hidalgo ceded the lands of the Southwest to the United States in 1848, there were perhaps 75,000 inhabitants of Mexican and Spanish origin residing in that vast territory—nearly three-fourths of them (Hispanos) in New Mexico, with smaller numbers of Tejanos and Californios (see Griswold del Castillo, 1984; Pitt, 1971). Toward the end of the century, with the rapid expansion of railroads, agriculture, and mining in the Southwest and with the exclusion of Chinese workers in 1882 and later the Japanese, Mexicans became preferred sources of cheap and mobile migrant labor—at about the same time that capitalist development in Mexico under the government of Porfirio Díaz was creating a landless peasantry. By the early 1900s railroad lines—which expedited deliberate labor recruitment by U.S. companies—had linked the interior of Mexico with Texas and other states, and large numbers of Mexican manual laborers called braceros were working from the copper and coal mines of Arizona and Colorado to the steel mills and slaughterhouses of Chicago, Detroit, and Pittsburgh (Vargas, 1993).
Not all these braceros returned to Mexico, and settler communities began to form and grow (Cardoso, 1980; Gamio, 1930; Sánchez, 1993). It has been estimated that as many as 1 million Mexicans, up to one-tenth of the Mexican population at the time, crossed the border to the United States at some point during the violent decade of the Mexican Revolution of
1910, while demand for their labor in the United States increased during World War I and the 1920s (all the more with immigration restrictions imposed on Southern and Eastern Europeans in the 1920s). The U.S. census in 1910 counted some 220,000 Mexicans in the country; that number more than doubled by 1920 and had tripled to over 600,000 by 1930. Largely at the urging of American growers, the passage of restrictive national-origins immigration laws in 1921 and 1924 placed no limits on countries in the Western Hemisphere in order to permit the recruitment of Mexican workers when needed—and their deportation when they were not (as happened, among other instances, during the 1930s when about 400,000 were repatriated to Mexico, including many U.S. citizens, and again during the much larger deportations of Operation Wetback in the mid-1950s).
The large increase in the Mexican-origin population in California dates to the World War II period, which saw the establishment of the Bracero Program (1942–1964) of contract labor importation negotiated by the U.S. and Mexican governments. The end of the Bracero Program, but not of a built-in, structural demand for immigrant labor—in conjunction with a sharp reduction in U.S. legal visas for Mexican immigrants and increasing population growth and economic downturns in Mexico—prompted increasing flows of illegal immigration, peaking in 1986 (when the Immigration Reform and Control Act, IRCA, was passed). It then declined briefly but increased and stabilized after 1989 and expanded further still after the mid-1990s. Indeed, the period from 1965 to 1985 has been labeled an “era of undocumented migration” that functioned as “a de facto guest worker program,” bringing largely young male laborers from small Mexican towns and cities (Massey, Durand, and Malone, 2002). Nearly 3 million formerly undocumented immigrants were legalized under the amnesty provisions of IRCA, of whom over 2 million were Mexican nationals. By 2000, the undocumented population of the United States was estimated at about 8.5 million (Passel, 2002), of whom about 4.7 million were Mexicans—representing 55 percent of the total undocumented population in the country and about half of the total Mexican-born population.
The millions of Mexican immigrants and their children in the United States today are embedded in often intricate webs of transnational family ties and kinship networks, which can help sustain migration flows by reducing the risks and costs of migration (Massey, Alarcón, Durand, and González, 1987). By the end of the 1980s, national surveys in Mexico found that about half of adult Mexicans were related to someone living in the United States, and that one-third of all Mexicans had been to the United States at some point in their lives; later surveys suggest still larger proportions (Massey and Espinoza, 1997). Most of the adult immigrants living in the United States send remittances to their relatives in Mexico—estimated at over $13 billion in 2003 (Inter-American Development Bank, 2004).
Despite the large flows of both legal and unauthorized Mexican immigration in recent decades, however, the 2000 census found that nearly 60 percent of the Mexican-origin population of 22.3 million was U.S.-born; over 9 million were immigrants born in Mexico, about half of whom had come to the United States in the two decades since 1980. And their growing presence was spreading geographically: in 1990, Mexican immigrants were the largest foreign-born population in 18 of the 50 states; in 2000, they were the largest foreign-born population in 30 states. Yet two-thirds of all Mexican-origin persons still resided in California and Texas in 2000. (In both California and Texas, the Social Security Administration reported that the most popular baby boy’s name in 1998 was no longer John, Michael, or David, but José—see Garvey and McDonnell, 1999; Pitts, 1999.) Significant numbers of Mexican Americans (over 1 million) were in Chicago—long a major center of Mexican immigration—and in Houston (nearly 1 million), and in Dallas, San Antonio, and Phoenix (over 650,000 in each), but none compared with the Mexican-origin population of greater Los Angeles, which, at more than 5 million in 2000 (the largest concentration of any ethnic minority in any U.S. metropolitan area), is exceeded only by Mexico City itself.
Puerto Ricans and Cubans in the United States
Puerto Rico was occupied by the United States in 1898 and formally acquired as part of the Treaty of Paris, which settled the Spanish-American War. The status of the islanders was left ambiguous until the passage of the Jones Act in 1917, at the time of U.S. entry into World War I, which gave Puerto Ricans U.S. citizenship and made them eligible for the military draft; these provisions essentially remained after 1947 when a new constitution defined commonwealth status for Puerto Rico (the first governor elected by popular vote took office in 1949). This status defines the island’s relationship with the United States and distinguishes Puerto Ricans fundamentally from other Latin American peoples. As U.S. citizens by birth, Puerto Ricans travel freely—and frequently—between the island and the mainland without having to pass through the screens of the Immigration and Naturalization Service (now in the Department of Homeland Security) or the Border Patrol, as would foreign-born noncitizens coming to the United States.
Soon after the military occupation U.S. capital began flowing into Puerto Rico—then an island society based on subsistence agriculture and coffee exports—especially into a new and rapidly growing sugar industry, which displaced subsistence peasants into the cities and combined with high population growth to create urban unemployment. Capital-intensive industrialization and urbanization of the island continued and rapidly accelerated after the introduction of Operation Bootstrap in 1948 but failed to
solve the urban unemployment and population growth problems, intensifying internal economic pressures for migration to the mainland. Labor recruitment (though it never reached the extent that it did with Mexican workers) began in 1900, when a large group of workers went to sugar cane plantations in Hawaii and later as farmworkers to the mainland. It became widespread among industrial employers only during and after World War II—at the same time that cheap air travel was instituted between San Juan and New York (a one-way ticket cost less than $50)—when mass immigration to New York reached its peak and made Puerto Ricans the first “airborne” migration in U.S. history.
The Puerto Rican population on the mainland grew from about 12,000 in 1920 to 53,000 in 1930, sextupled to 301,000 in 1950, then tripled (in a single decade) to 888,000 in 1960. Net Puerto Rican migration to the mainland during the 1950s (about 470,000) was higher than the immigration totals of any country, including Mexico, during that peak decade. Although net migration subsequently decreased, travel back and forth is incessant, averaging over 3 million people annually since the 1980s (Bonilla and Campos, 1981; Fitzpatrick, 1987; Moore and Pachón, 1985; Rivera-Batiz and Santiago, 1998; Rodríguez, 1991; Rumbaut, 1992; Sánchez Korrol, 1983, 1994). The 2000 census counted a mainland Puerto Rican population of over 3.5 million (almost as many as on the island). The pattern of concentration in New York City, which had accounted for over 80 percent of the total Puerto Rican population in the U.S. mainland in 1950, gradually declined to 62 percent in 1970, under 40 percent in 1990, and about 25 percent in 2000. Despite their relative dispersal in recent years, there are still twice as many Puerto Ricans in New York City (over 850,000) as in the capital of Puerto Rico, San Juan.
If Mexico was the first nation in the Americas to achieve its independence from Spain (in 1821), and Puerto Rico the only one that has never become an independent state, Cuba was the last in Spanish America, becoming formally independent in 1902 after almost four years of U.S. military occupation following the end of the second Cuban War of Independence (1895–1898), during which over 10 percent of the population died, and the Spanish-American War (1898). A notable Cuban presence in the United States goes back to the early 19th century, beginning what became a tradition for Cuban exiles to carry out their political work from bases in New York and Florida. At the same time, Cuba was the target of repeated efforts at annexation by the United States throughout the 19th century, and also a main focus of U.S. trade and capital investment—although it never became a recruiting ground for agricultural workers, as did Mexico and Puerto Rico. U.S. economic penetration of the island increased sharply after the war and the military occupation at the turn of the century, expanding its control over sugar production as well as other sectors of the Cuban
economy, including transportation, mining, construction, and public utilities. By 1929 U.S. direct investment in Cuba totaled more than one-fourth of all U.S. investment in Latin America as a whole, more than was invested by U.S. capital in any Latin American country either on a per capita basis or in absolute terms. Moreover, Cuba remained subordinated to the United States after 1902 under the terms of the Platt Amendment, attached by the U.S. Congress to the Cuban Constitution. Not rescinded until 1934, the Platt Amendment formalized the right of the United States to intervene in Cuban internal affairs—and bred deep resentment of U.S. domination in various sectors of the Cuban population (see Pérez, 1990, 1999; Thomas, 1971). Nonetheless, an analyst of U.S.–Cuba relations and of the Americanization of the Cuban scene could write that, at least in the cities, “it is probably fair to say that by 1959, no other country in the world, with the exception of Canada, quite so resembled the United States” (Smith, 1991).
Still, at that time the Cuban population in the United States was just over 70,000. The waves of exiles that began in earnest in 1960, in the context of the Cold War, have continued to the present in several phases, from the daily flights that were suspended after the 1962 missile crisis, to the orderly “freedom flights” from 1965 to 1973, the boat flotillas from Camarioca in 1965 and Mariel in 1980, to the increasingly desperate crossings of balseros (rafters) in the 1980s and early 1990s, which became a full-fledged crisis in 1994 (when in less than one month 37,000 Cubans were rescued by the U.S. Coast Guard, most of whom detained for over a year in makeshift camps at the U.S. naval base in Guantánamo). An orderly migration quota was subsequently negotiated by the two governments, bringing almost 25,000 Cubans to the United States annually after the mid-1990s, but the bilateral accord and new high-level migration talks were suspended in late 2003 amid renewed intergovernmental conflict. Despite U.S. government efforts to resettle the exiles away from Miami, many eventually drifted back, adding to the original concentrations there and making the city in effect a majority Cuban community—and arguably the most politically powerful immigrant nationality in the country (García, 1996; Grenier and Pérez, 2003; Portes and Stepick, 1993). Cuban Americans have had consistently the lowest fertility rates among all Hispanic groups, as well as the oldest foreign-born population—it is estimated that more than 200,000 of those who came in the 1960s and early 1970s had died in exile by the year 2000. Still, the Cuban American population in the United States in 2000, at over 1.3 million, represented about 12 percent of the total on the island; nearly 50 percent of them are concentrated in metropolitan Miami, known as “Havana U.S.A.” Among Cuban cities, only the real Havana is larger.
THE MAKING OF A PORTRAIT
Ethnic Identity and National Origin
I shift focus now from the past to the present and to a sketch of some key differences that, beyond the distinct histories of particular groups, most clearly distinguish the Hispanic population from non-Hispanics—national origin and ethnic identity, immigration and generation, racial classification, language, citizenship, and social status—and from each other. I also consider how the confluence of these factors shapes their modes of incorporation in American society. For this purpose, I rely principally on an analysis of the 5 percent PUMS of the 2000 U.S. census, supplementing the analysis from other data sources.
Despite growing diversification and accelerating immigration from a wider range of Latin American countries over the past two decades (see Table 2-1), persons of Mexican, Puerto Rican, and Cuban origin still comprised 77.1 percent of the 35.2 million Hispanics counted by the 2000 census.12 Those of Mexican origin alone numbered 22.3 million—nearly two-thirds (63.3 percent) of the U.S. total (see Table 2-2). Thus, it should be underscored that aggregate statistics for the total Hispanic population reflect the predominant weight of the characteristics of the Mexican-origin population—a fact that shapes overall perceptions of the Hispanic population as a whole while obscuring its internal diversity.
Much of the remainder of this population is accounted for by six nationalities of relatively recent immigrant origin: Dominicans, Salvadorans, and Guatemalans make up another 7.2 percent of the Hispanic total, and Colombians, Peruvians, and Ecuadorians combine for nearly 4 percent more. Persons who trace their ethnic identities to the 10 other Spanish-speaking source countries of Central and South America, plus Spain, together comprised only 4 percent of the Hispanic total. Thus, 9 ethnic groups accounted for 9 of 10 (88 percent) Hispanics in the United States mainland. Their size and evolution reflect both the varied history of their incorporation in the United States and the relative geographical proximity of their source countries to the United States: Mexico, El Salvador, and Guatemala from Meso-America; Puerto Rico, Cuba, and the Dominican Republic from the Caribbean; Colombia, Perú, and Ecuador from South America. Only 7.9 percent of the 35.2 million Hispanics self-reported as “other Spanish, Hispanic or Latino” in the 2000 census, without indicating a particular
TABLE 2-2 Foreign-Born and Native-Born Generations of Hispanics and Non-Hispanics in the United States, 2000
|
Ethnic Identity (Self-Reported) |
Generation |
Total Number |
||
|
Foreign-Born First Generation |
U.S.-Born Second+ Generations |
|||
|
Not Hispanic |
N |
18,706,149 |
227,511,277 |
246,217,426 |
|
|
% |
7.6 |
92.4 |
100.0 |
|
Hispanic: |
N |
15,786,304 |
19,418,176 |
35,204,480 |
|
|
% |
44.8 |
55.2 |
100.0 |
|
Mexican |
% |
42.0 |
58.0 |
22,293,812 |
|
Puerto Ricana |
% |
39.7 |
60.3 |
3,537,351 |
|
Cuban |
% |
67.3 |
32.7 |
1,311,994 |
|
Dominican |
% |
68.5 |
31.5 |
994,313 |
|
Salvadoran, Guatemalan |
% |
77.5 |
22.5 |
1,532,512 |
|
Central American, other |
% |
76.5 |
23.5 |
903,574 |
|
Colombian |
% |
76.6 |
23.4 |
648,731 |
|
Peruvian, Ecuadorian |
% |
77.2 |
22.8 |
697,798 |
|
South American, other |
% |
78.3 |
21.7 |
494,186 |
|
Other Spanish, Hispanic, Latinob |
% |
5.7 |
94.3 |
2,790,209 |
|
Total |
N |
34,492,453 |
246,929,453 |
281,421,906 |
|
|
% |
12.3 |
87.7 |
100.0 |
|
aPuerto Ricans born in Puerto Rico are classified as “first generation”; those born in the U.S. mainland are classified as “second+ generations.” bPersons leaving “other” blank but specifying their country of birth or ancestry in other census questions were assigned to the appropriate national-origin group. This occurred in about 2 million cases. SOURCE: 2000 U.S. Census, 5% Public Use Microdata Samples (PUMS). |
||||
national origin or ancestry.13 Accordingly, for ease of presentation, the data tables that follow focus on the groups who account for the preponderant number of Hispanic Americans.
Hispanics as a whole are much more likely than non-Hispanics to consist of relatively recent newcomers to the United States. As noted, immigration and generation are central issues for understanding the Hispanic population of the United States: 45 percent of Hispanics are foreign-born, compared with only 7.6 percent of non-Hispanics; while 55 percent of Hispanics are U.S.-born, compared with 92.4 percent of non-Hispanics. Those figures refer to countries of birth, quite aside from citizenship status (e.g., Puerto Ricans born on the island are included under the foreign-born first generation, although they have birthright citizenship). Only the “other Spanish, Hispanic, Latino” are overwhelmingly a native-born population (94.3 percent)—some with ancestries that can be traced back many generations. Aside from that special case, the Mexicans and Puerto Ricans—the two populations of longest residence in the United States—are the only ethnic groups that consist mainly of natives (58 percent of the Mexicans and 60 percent of the Puerto Ricans were born on the U.S. mainland). All others are primarily first-generation immigrant populations—ranging from two-thirds of the Cubans and Dominicans to more than three-fourths of all the other groups.
Because the decennial census, which is the primary data source used in this chapter, no longer asks about parental nativity, it is not possible to break down the U.S.-born generations into those with foreign parentage (the second generation) and those with native parentage (that is, native-born of native parentage, the third+ generations). However, as noted, a decade ago the CPS restored the parental nativity question and thus makes possible multiple-generation comparisons (for that reason it is the data set of choice in several of the chapters that follow). Here, one finding from the CPS may be mentioned in passing because of its relevance to this discussion: fully 75 percent of the Hispanic population of the United States is of foreign parentage (first or second generation), compared with only 15 percent of the non-Hispanic population: a 5-to-1 ratio. About 95 percent of the Cubans, Central Americans, and South Americans are first or second genera-
|
13 |
The 2000 census reported about 5 million persons who checked “other Spanish, Hispanic or Latino” but left the space blank without writing in a particular ethnicity or national origin. However, about 2 million of these in fact reported a specific Spanish-speaking Latin American country of birth or a Hispanic ancestry in other questions in the census form, permitting their assignment to one of the main national-origin Hispanic groups listed in the tables in this chapter. The figure of 2.8 million “other Spanish, Hispanic, or Latino” persons in Table 2-2 reflects this adjustment. |
tion, as are 78 percent of the Puerto Ricans and 70 percent of the Mexicans, who have been in the United States longest. Among all Hispanics, those of Mexican origin account for 77 percent of the third+ generations, 68 percent of the second generation, and 58 percent of the first generation—suggesting the dominance of the Mexican population a few generations ago and its recent proportional decline as immigration from Central and South America and the Dominican Republic has accelerated sharply, especially over the past two decades.
Since 1970, census data on Hispanics have been based on subjective self-reports by respondents who check the “ethnic” question on Spanish origin (or “Hispanic or Latino” in the 2000 census)—and, if so, specify a particular Hispanic group. How closely do these subjective self-reports match objective markers, such as country of birth? At least among the foreign-born, who identifies as “Hispanic or Latino”?14Table 2-3 addresses that question, cross-tabulating that pan-ethnic self-identification (Hispanic or not) by principal countries of birth (distinguishing between Spanish-speaking countries—19 in Latin America, including the commonwealth of Puerto Rico, plus Spain—versus all other countries in the world). Of the 35.2 million self-identified Hispanics, 19.4 million (55 percent) were born in the United States. Among all foreign-born persons, 16 million were born in the 20 Spanish-speaking countries, and of them over 97 percent self-reported as “Hispanic or Latino.” Another 18.4 million persons were born elsewhere in the world, and 99 percent of them indicated they were not “Hispanic or Latino.”
The overwhelming majority (95 to 99 percent) of those born in each of the major Spanish-speaking countries of Latin America self-reported as “Hispanic or Latino” in 2000.15 Among those born in non-Spanish-speaking countries, only minuscule proportions identified as Hispanic—for example, only 1 percent of those born in the Philippines, and—from
|
14 |
Whether a particular ethno-national self-identification survives into the second or third-and-beyond generations, or shifts into a “Hispanic” or “Latino” pan-ethnicity, or fades altogether into non-Hispanic identities as a result of mixed parentage, ethnic intermarriage, racialization, or assimilation remain open empirical questions. The issue of intergenerational ethnic (and pan-ethnic) identity shifts is raised in other chapters of this volume (see especially Chapter 6 on Hispanic families). |
|
15 |
A third of those born in Spain and a third of those born in Panamá did not identify as “Hispanic or Latino”—nor did 19 percent of the Argentineans, 14 percent of the Venezuelans, and 9 percent of the Chileans—but those were the main exceptions. Among these groups—from Spain, Panamá, Argentina, Venezuela, and Chile—those not self-identifying as Hispanic were more likely to report their primary ancestry as “American,” “African American,” or a wide range of European origins, and to report their “race” as white or black (whereas those reporting as “Hispanic” from those countries were far more likely to indicate “other race” or “two or more races”). |
TABLE 2-3 Hispanic Ethnic Identity by Country of Birth, 2000
|
Country of Birth |
Ethnic Identity |
||
|
Hispanic |
Not Hispanic |
||
|
Born in the United States: |
N |
19,418,176 |
227,511,262 |
|
|
% |
7.9 |
92.1 |
|
Foreign-born in: |
|||
|
Spanish-speaking country |
N |
15,599,619 |
460,561 |
|
|
% |
97.1 |
2.9 |
|
Mexico |
% |
98.9 |
1.1 |
|
Puerto Ricoa |
% |
95.3 |
4.7 |
|
Cuba |
% |
98.0 |
2.0 |
|
Dominican Republic |
% |
98.0 |
2.0 |
|
El Salvador, Guatemala |
% |
97.2 |
2.8 |
|
Central America, other |
% |
89.7 |
10.3 |
|
Colombia |
% |
97.0 |
3.0 |
|
Perú, Ecuador |
% |
96.0 |
4.0 |
|
South America, other |
% |
84.0 |
16.0 |
|
Spain |
% |
67.4 |
32.6 |
|
Born elsewhere in the world: |
N |
186,685 |
18,245,603 |
|
|
% |
1.0 |
99.0 |
|
Total |
N |
35,204,480 |
246,217,426 |
|
|
% |
12.5 |
87.5 |
|
aFigures refer to persons born in Puerto Rico. SOURCE: 2000 U.S. Census, 5% PUMS. |
|||
non-Spanish “Latin” America—only 1.4 percent of those born in Haiti (on the island of Hispaniola), 1.8 percent of those born in Trinidad and Tobago, 1.8 percent of those born in Guyana, and 7.7 percent of those born in Brazil. In the first (immigrant) generation, clearly, there is a very strong correspondence between self-reported Hispanic ethnicity and national origin (being born in a Spanish-speaking country).
Hispanic Identity and “Race”
Much has been made in the media and even in academic discourse about “the browning of America,” a misnomer based on popular stereotypes of phenotypes presumed to characterize peoples of Latin American origin. Does the Hispanic population differ significantly from non-Hispanics by “race,” as it does by place and national origin? The American system of racial classification, employed variously since the
first census of 1790, has been the sine qua non of externally imposed, state-sanctioned measures of group difference, distinguishing principally the majority white population from black and American Indian minority groups, and later from Asian-origin populations (see Snipp, 2003). “One drop rules” of hypodescent are but one illustration of the manner in which it is a sociohistorically constructed system, evolving fixed categories that concretize social hierarchies in supposed racial phenotypes. Yet as noted earlier, “Hispanics” were incorporated in official statistics as an “ethnic” category, and explicitly conceived as being “of any race.”
Table 2-4 compares Hispanics and non-Hispanics, as well as the largest Hispanic ethnic groups, by the main racial categories employed in the 2000 census. Of the 246.2 million non-Hispanics counted by the census, 97 percent reported their race as either white (79 percent), black (13.7 percent), or Asian (4.1 percent). In sharp contrast, among the 35.2 million Hispanics, only half—49.9 percent—reported their race as either white (47.8 percent), black (1.8 percent), or Asian (0.3 percent). In both populations, only 1 percent reported their race as American Indian. However, there was a huge difference in the proportion of these two populations who indicated “other race”: while scarcely any non-Hispanics (a mere 0.2 percent) reported being of some “other” race, among the Latin Americans that figure was 42.6 percent, a total of about 15 million persons—a reflection of more than four centuries of mestizaje (racial mixing) and miscegenation in Latin America and the Caribbean, as well as differing conceptions of “race.” In addition, Hispanics were three times more likely to report an admixture of “two or more races”—6.4 percent of Hispanics versus only 2 percent of non-Hispanics—although among Hispanics who listed “two or more races” the overwhelming majority (85 percent) specified “white” plus another race.
Examining these results for the main Hispanic ethnic groups, the proportions who identified racially as white ranged from a low of 22 percent among Dominicans to a high of 84 percent among Cubans; the proportions who identified as black ranged from 1 percent or less among Mexicans, Salvadorans, Guatemalans, Colombians, Peruvians, and Ecuadorans, to a high of 8.2 percent among Dominicans, while the “other Spanish, Hispanic or Latino” were the most likely to identify as multiracial (10.7 percent). More than half of the Dominicans (59 percent) and of the Salvadorans and Guatemalans (55 percent) reported “another race,” as did 46 percent of the Mexicans, 42 percent of the Peruvians and Ecuadorans, 38 percent of the Puerto Ricans, 28 percent of the Colombians, and less than 8 percent of the Cubans. The meaning of “race,” however, is problematic for a number of reasons.
For example, one recent study found that, in addition to significant
TABLE 2-4 Hispanic Ethnic Identity by Race, 2000 Census
|
Ethnic Identity |
Race (Self-Reported) |
|||||||
|
White |
Black |
Asian |
American Indiana |
Other Race |
Two or More Races |
Total Number |
||
|
Not Hispanic |
N |
194,527,123 |
33,706,554 |
10,088,521 |
2,437,149 |
443,304 |
5,014,775 |
246,217,426 |
|
|
% |
79.0 |
13.7 |
4.1 |
1.0 |
0.2 |
2.0 |
100.0 |
|
Hispanic: |
N |
16,832,198 |
651,282 |
102,833 |
390,465 |
14,982,091 |
2,245,611 |
35,204,480 |
|
|
% |
47.8 |
1.8 |
0.3 |
1.1 |
42.6 |
6.4 |
100.0 |
|
Mexican |
% |
46.8 |
0.7 |
0.2 |
1.2 |
45.8 |
5.2 |
22,293,812 |
|
Puerto Rican |
% |
46.9 |
5.8 |
0.4 |
0.7 |
38.1 |
8.1 |
3,537,351 |
|
Cuban |
% |
84.4 |
3.6 |
0.2 |
0.2 |
7.6 |
4.1 |
1,311,994 |
|
Dominican |
% |
22.4 |
8.2 |
0.2 |
0.9 |
58.8 |
9.4 |
994,313 |
|
Salvadoran, Guatemalan |
% |
35.8 |
0.6 |
0.1 |
1.1 |
55.2 |
7.2 |
1,532,512 |
|
Central American, other |
% |
44.7 |
7.1 |
0.2 |
0.9 |
37.7 |
9.5 |
903,574 |
|
Colombian |
% |
62.0 |
1.1 |
0.2 |
0.4 |
28.2 |
8.2 |
648,731 |
|
Peruvian, Ecuadorian |
% |
47.9 |
0.6 |
0.4 |
0.8 |
41.7 |
8.5 |
697,798 |
|
South American, other |
% |
70.0 |
0.8 |
0.3 |
0.4 |
20.6 |
8.0 |
494,186 |
|
Other Spanish, Hispanic, Latino |
% |
49.2 |
2.5 |
1.0 |
1.9 |
34.7 |
10.7 |
2,790,209 |
|
Total |
N |
211,359,321 |
34,357,836 |
10,191,354 |
2,827,614 |
15,425,395 |
7,260,386 |
281,421,906 |
|
|
% |
75.1 |
12.2 |
3.6 |
1.0 |
5.5 |
2.6 |
100.0 |
|
aIncludes American Indian, Alaskan, and Hawaiian natives and other indigenous Pacific Islanders. SOURCE: 2000 U.S. Census, 5% PUMS. |
||||||||
change in their ethnic self-identities over time and generation in the United States (as measured by open-ended questions), the offspring of Latin American immigrants were by far the most likely to define their racial identities in sharp contrast to their own parents (Portes and Rumbaut, 2001). During the 1990s in South Florida and Southern California, the Children of Immigrants Longitudinal Study (CILS) surveyed a sample of more than 5,200 1.5- and second-generation youths, representing 77 different nationalities, including all of the main Spanish-speaking countries of Latin America. Their immigrant parents were also interviewed separately. In one survey (conducted when the youths were 17 to 18 years old), the respondents were asked to answer a semistructured question about their “race” and were given the option to check one of five categories: “white,” “black,” “Asian,” “multiracial,” or “other;” if the latter was checked, they had to specify what that “other race” was. The results are presented in Table 2-5. Among the Latin American–origin youths, less than a fourth of the total sample checked the conventional categories of white, black, or Asian; 12 percent reported being multiracial; and over 65 percent checked “other.” When those “other” self-reports were coded, it turned out that two-fifths of the sample (41 percent) wrote down “Hispanic” or “Latino” as their “race,” and another fifth (19.6 percent) gave their nationality as their “race.” The explicit racialization of the “Hispanic-Latino” category, as well as the substantial proportion of youths who conceived of their nationality of origin as a fixed racial category, are noteworthy both for their potential long-term implications in hardening minority group boundaries and for their illustration of the arbitrariness of racial constructions—indeed, of the ease with which an “ethnic” category developed for administrative purposes becomes externalized, diffused, objectified, and finally internalized as a putative biological marker of social difference.
The latter point is made particularly salient by directly comparing the youths’ notions of their “race” with that reported by their own parents. The closest match in racial self-perceptions between parents and children were observed among the Haitians, Jamaicans, and other West Indians (most of whom self-reported as black), among the Europeans and Canadians (most of whom labeled themselves white), and among most of the Asian-origin groups (except for the Filipinos). The widest mismatches by far occurred among all of the Latin American–origin groups without exception: overall, about three-fifths of Latin parents defined themselves as white, compared with only one-fifth of their own children. More specifically, 93 percent of Cuban parents identified as white, compared with only 41 percent of their children; 85 percent of Colombian parents defined themselves as white, but only 24 percent of their children did so—proportions that were similar for other South Americans; two-thirds of the Salvadoran, Guatemalan, and Nicaraguan parents saw themselves as white, but only
one-fifth of their children agreed; and about a third of the Dominican parents reported as white, more than twice the proportion of their children who did so. The children, instead, largely adopted “Hispanic” or “Latino” as a racial label (41 percent—the largest single response), whereas scarcely any of their parents did so (6.4 percent), or they gave their nationality as their race (19.6 percent of the children versus 6.3 percent of their parents). Indeed, well over half of the Dominican, Salvadoran, Guatemalan, Nicaraguan, Colombian, Peruvian, and Ecuadoran youth reported their race as “Hispanic” or “Latino.” Among the Mexicans, whose pattern differed from all of the others, the children preponderantly racialized the national label, whereas Mexican parents were more likely to use “other” (mestizo) and “multiracial” as descriptors. These results point to the force of the acculturation process and its impact on children’s self-identities. More fully exposed than their parents to American culture and its racial notions, and being incessantly categorized and treated as Hispanic or Latino, the children of immigrants learn to see themselves more and more in these terms—as members of a racial minority—and even to racialize their national origins. If these intergenerational differences between Latin immigrants and their U.S.-raised children can be projected to the third generation, the process of racialization may become more entrenched still.
In a related survey of more than 400 Dominican immigrants in New York City and Providence, Rhode Island, the adult respondents were asked a series of three questions about their racial self-identification (Itzigsohn, 2004). First, they were asked, in an open-ended format, how they defined themselves racially. Next they were given a close-ended question, asking if they were white, black, or other (and if other, to specify). Finally they were asked how they thought that “mainstream Americans” classified them racially. The results are summarized in Table 2-6. In response to the first open-ended question, 28 percent gave “Hispanic” as their “race,” another 4 percent said “Latino,” and still others offered a variety of mixed “Hispanic” or “Latino” answers; 13 percent said “Indio,” and another 13 percent gave their Dominican nationality as their race. Only 6.6 percent chose “black,” and 3.8 percent “white.”
The rest of their responses showed the extraordinary range of racial categories and labels common in the Spanish Caribbean—as well as the very significant responses obtained depending on the question asked, even though all three were ostensibly getting at the same thing: the respondent’s racial identity. When asked to choose from the closed-ended format of the second question, the largest response remained “Hispanic” (written in by 21 percent of the sample, in addition to 3 percent who chose “Latino”), although the categories “black” and “white” more than doubled to 16.8 and 11.6 percent, respectively. And when asked how they thought that others classified them racially, the category “black” dramatically increased
TABLE 2-5 Self-Reported Race of Children of Immigrants and Their Parents, by National Origin Groups, 1995–1996
to 37 percent—reflecting the reverse way in which the “one drop rule” (whereby anyone with African ancestry is considered black) functions in the United States versus the Dominican Republic—while “white” decreased to 6.4 percent. “Hispanic” was still given by almost a third of the sample (30.4 percent) as the “racial” category that they perceived others used to classify them. Indeed, “Hispanic” was the label most consistently given by
|
Self-Reported Racea |
||||
|
Asian (%) |
Multiracial (%) |
Hispanic, Latino (%) |
Nationality (%) |
Other (%) |
|
1.1 |
14.7 |
6.4 |
8.3 |
9.8 |
|
0.0 |
12.1 |
41.0 |
19.6 |
4.6 |
|
2.1 |
21.6 |
15.9 |
26.1 |
28.5 |
|
0.0 |
12.0 |
25.5 |
56.2 |
4.5 |
|
0.3 |
2.5 |
1.1 |
0.5 |
1.4 |
|
0.0 |
11.5 |
36.0 |
5.5 |
4.9 |
|
0.0 |
44.4 |
0.0 |
5.6 |
8.3 |
|
0.0 |
13.9 |
55.6 |
8.3 |
5.6 |
|
4.2 |
16.7 |
8.3 |
0.0 |
0.0 |
|
0.0 |
12.5 |
58.3 |
4.2 |
4.2 |
|
1.6 |
22.0 |
5.4 |
0.5 |
2.2 |
|
0.0 |
9.7 |
61.8 |
2.7 |
6.5 |
|
4.0 |
20.0 |
0.0 |
4.0 |
0.0 |
|
0.0 |
40.0 |
44.0 |
0.0 |
0.0 |
|
0.0 |
9.9 |
2.2 |
0.0 |
2.2 |
|
0.0 |
9.9 |
58.2 |
1.1 |
5.5 |
|
0.0 |
26.5 |
2.9 |
2.9 |
5.9 |
|
0.0 |
11.8 |
55.9 |
0.0 |
0.0 |
|
0.0 |
6.1 |
2.0 |
2.0 |
2.0 |
|
0.0 |
14.3 |
40.8 |
14.3 |
0.0 |
|
3.5 |
5.0 |
0.0 |
6.4 |
6.4 |
|
4.5 |
12.4 |
0.0 |
5.9 |
5.0 |
|
69.3 |
4.4 |
0.0 |
23.3 |
2.2 |
|
77.5 |
7.7 |
0.0 |
13.0 |
1.2 |
|
6.3 |
6.3 |
3.1 |
0.0 |
3.1 |
|
6.3 |
9.4 |
9.4 |
0.0 |
3.1 |
the respondents to characterize their own racial identity, whether asserted by themselves or imposed upon them by others.16
TABLE 2-6 Dominican Immigrants’ Answers to Three Racial Self-identification Questions (Survey of Dominican Immigrants in New York City and Providence, N=418)
|
|
Questions |
||
|
Responses |
How Do You Define Yourself Racially? (Open-ended) (%) |
Are You: White, Black, or Other? (If Other, specify) (Close-ended) (%) |
How Do You Think Most Americans Classify You Racially? (%) |
|
Black |
6.6 |
16.8 |
36.9 |
|
White |
3.8 |
11.6 |
6.4 |
|
Hispano/a (Hispanic) |
27.5 |
21.1 |
30.4 |
|
Latino/a |
4.1 |
2.8 |
3.2 |
|
Indio/a |
13.1 |
18.8 |
4.0 |
|
Dominicano/a |
12.8 |
2.0 |
0.2 |
|
Mestizo/a |
4.7 |
8.0 |
1.0 |
|
Trigueño/a |
4.1 |
4.5 |
2.0 |
|
Moreno/a |
1.9 |
2.0 |
2.2 |
|
Mulato/a |
0.3 |
1.5 |
0.0 |
|
Indio Hispano/a |
4.1 |
1.0 |
0.2 |
|
Black Hispano/a |
0.6 |
1.0 |
2.0 |
|
White Hispano/a |
0.6 |
0.3 |
0.5 |
|
Mixed Hispano/a |
0.6 |
1.3 |
0.2 |
|
Latino-Americano/a |
0.6 |
0.5 |
0.0 |
|
Latino-Hispano/a |
0.3 |
0.5 |
0.5 |
|
Java-India claro/a |
0.3 |
1.3 |
0.2 |
|
Amarillo/a (yellow) |
0.3 |
1.0 |
0.2 |
|
Oscuro, prieto, de color |
0.3 |
0.8 |
1.0 |
|
American |
0.6 |
0.0 |
0.5 |
|
Puerto Rican |
0.0 |
0.0 |
0.2 |
|
Human race, other |
6.9 |
1.5 |
0.7 |
|
Does not know |
5.0 |
1.3 |
6.9 |
|
SOURCE: Adapted from Itzigsohn (2004). |
|||
Immigration and Citizenship
These data on national origin, ethnic identity, and racial categorization add to the earlier sketch of historical patterns of migration and settlement to show how the Hispanic population as a collectivity differs in distinctive ways from non-Hispanics generally. Citizenship patterns, reflective of the history, type, size, and recency of Latin American immigration to the United States, constitute another significant set of distinguishing characteristics. As depicted in Table 2-7, virtually all Puerto Ricans are U.S. citizens by birthright, compared with 58 percent of the Mexicans, a third of the Cubans and
TABLE 2-7 Citizenship Status of Hispanics and Non-Hispanics in the United States, 2000
|
Ethnic Identity |
U.S. Citizenship |
|||
|
Citizen by Birthrighta |
Naturalized Citizen |
Not a Citizen |
||
|
Not Hispanic |
N |
229,216,195 |
8,616,047 |
8,385,184 |
|
|
% |
93.1 |
3.5 |
3.4 |
|
Hispanic: |
N |
21,072,230 |
3,917,885 |
10,214,365 |
|
|
% |
59.9 |
11.1 |
29.0 |
|
Mexican |
% |
58.9 |
9.2 |
31.9 |
|
Puerto Rican |
% |
98.7 |
0.6 |
0.8 |
|
Cuban |
% |
33.8 |
40.0 |
26.2 |
|
Dominican |
% |
32.9 |
24.5 |
42.6 |
|
Salvadoran, Guatemalan |
% |
23.2 |
18.7 |
58.1 |
|
Central American, other |
% |
25.8 |
23.9 |
50.3 |
|
Colombian |
% |
24.7 |
30.2 |
45.0 |
|
Peruvian, Ecuadorian |
% |
24.1 |
26.6 |
49.3 |
|
South American, other |
% |
23.8 |
28.1 |
48.0 |
|
Other Spanish, Hispanic, Latino |
% |
94.9 |
2.1 |
3.0 |
|
Total |
N |
250,288,425 |
12,533,932 |
18,599,549 |
|
|
% |
88.9 |
4.5 |
6.6 |
|
aIncludes persons born in Puerto Rico and other U.S. territories and those born abroad with at least one parent who was a U.S. citizen. SOURCE: 2000 U.S. Census, 5% PUMS. |
||||
Dominicans, and less than a fourth of all the rest. However, the likelihood of becoming a naturalized citizen—which generally requires living in the United States for a minimum of five years after gaining legal permanent residency (a “green card”)—varies widely. In addition to the 33 percent of Cuban Americans who were born in the United States, another 40 percent have naturalized U.S. citizenship—by far the largest proportion among Hispanics—in part reflecting the large numbers who came as exiles to the United States after 1959 and the legal status accorded to them subsequently (at least until the chaotic Mariel boatlift of 125,000 in 1980, when the U.S. government created a new designation of “entrant, status pending”); most of the 26 percent of Cubans who are not U.S. citizens came to the United States in or after 1980. The Mexicans, Salvadorans, and Guatemalans have the lowest proportions of those who have become naturalized citizens—reflecting in part the undocumented status of many immigrants among these three groups (see Passel, 2002) and in part the recency of their arrival. The very high proportion of Hispanics who have not yet become U.S.
citizens—almost three out of five Salvadorans and Guatemalans, half of the Peruvians and Ecuadorans, more than two out of five Dominicans and Colombians, and a third of the Mexicans—have important political implications, suggesting the extent to which these populations are at present disenfranchised and limited in the extent to which they can participate in the electoral system.
Hispanics as a whole are not only much younger in their age profile as well as poorer and less educated than non-Hispanics (as elaborated in several of the chapters that follow), but also much more likely than non-Hispanics to consist of relatively recent newcomers to the United States—which in turns affects their eligibility and propensity for naturalization. Table 2-8 shows the timing of their immigration to the United States by decade of arrival. Not only are immigrants a much greater share of the total Hispanic population, as shown earlier, but they have also arrived more recently in greater numbers. Hispanic immigrants were disproportionately more likely to have come in the 1980s and 1990s—indeed, nearly half of the 15.8 million foreign-born Hispanics have arrived only since 1990—while non-Hispanic immigrants (especially those from Europe and Canada) were slightly more likely to have arrived in the 1960s and 1970s and much more likely to have come in the pre-1960 period. The main exceptions in this regard are the Puerto Ricans, who were much more likely than any other group, Hispanic or not, to have arrived during the 1950s, and the Cubans, who were much more likely than any other group, Hispanic or not, to have arrived during the 1960s. These patterns of migration and length of residence in the United States, in turn, help shape a central aspect of acculturation processes—language—to which we now turn. English proficiency has always been a key to socioeconomic mobility for immigrants, as well as to their full participation in their adoptive society.
Language and Acculturation
Unlike the mass migrations from Southern and Eastern Europe during the era from the 1880s to the 1920s, and unlike those from Asia since the 1965 amendments to U.S. immigration law reopened the doors to Eastern Hemisphere immigrants who had been effectively barred since the passage of national quota laws in the 1920s—the vast majority of whom spoke different languages—immigrants from the Spanish-speaking countries of Latin America, who now comprise nearly half of all immigration to the United States, speak a common language: Spanish. This fact—not place, not race, not religion, not citizenship—is the single most distinctive difference between Hispanics and non-Hispanics in the United States. It raises significant questions about their modes of acculturation and socioeconomic incorporation, and—in conjunction with their patterns of geographical con-
TABLE 2-8 Decade of Arrival of Foreign-Born Hispanics and Non-Hispanics in the United States, 2000
|
Ethnic Identity |
Decade of U.S. Arrival |
|||||
|
Pre-1960 |
1960s |
1970s |
1980s |
1990s |
||
|
Not Hispanic |
N |
2,163,245 |
1,818,758 |
2,963,728 |
4,678,592 |
7,230,753 |
|
|
% |
11.5 |
9.6 |
15.7 |
24.8 |
38.3 |
|
Hispanic: |
N |
702,943 |
1,265,481 |
2,314,159 |
4,482,200 |
7,036,411 |
|
|
% |
4.4 |
8.0 |
14.6 |
28.4 |
44.5 |
|
Mexican |
% |
3.0 |
5.0 |
15.3 |
27.9 |
48.7 |
|
Puerto Ricana |
% |
20.0 |
15.3 |
14.2 |
21.7 |
28.8 |
|
Cuban |
% |
7.0 |
31.9 |
14.4 |
19.7 |
27.0 |
|
Dominican |
% |
1.5 |
8.7 |
14.6 |
32.3 |
42.8 |
|
Salvadoran, Guatemalan |
% |
0.7 |
2.6 |
11.4 |
40.9 |
44.4 |
|
Central American, other |
% |
2.8 |
6.5 |
12.0 |
36.9 |
41.8 |
|
Colombian |
% |
1.9 |
10.2 |
14.3 |
28.3 |
45.4 |
|
Peruvian, Ecuadorian |
% |
1.8 |
8.5 |
13.5 |
29.0 |
47.2 |
|
South American, other |
% |
2.9 |
10.1 |
15.4 |
24.8 |
46.9 |
|
Other Spanish, Hispanic, Latino |
% |
7.4 |
14.3 |
17.5 |
24.0 |
36.8 |
|
Total |
N |
2,866,188 |
3,084,239 |
5,277,887 |
9,160,792 |
14,267,164 |
|
|
% |
8.3 |
8.9 |
15.2 |
26.4 |
41.2 |
|
aPuerto Ricans born in the island of Puerto Rico, by decade of arrival on the U.S. mainland. SOURCE: 2000 U.S. Census, 5% PUMS. |
||||||
centration—about the development of Hispanic media and marketing and Latino political mobilization. Altogether, more than 28 million persons older than age 5 in the United States in 2000 reported speaking Spanish at home. That figure is about 10 million more than the total number of persons who spoke all other languages combined. The next largest language communities in the United States were speakers of French and Chinese (2 million each), German and Filipino/Tagalog (less than 1.5 million speakers each), and Italian and Vietnamese (about 1 million speakers each).
Tables 2-9 to 2-12 present a linguistic profile of these populations relative to non-Hispanics and to each other, comparing the foreign-born first generation and the U.S.-born second+ generations.17 Among the foreign-born, as Table 2-9 shows, a third of non-Hispanics age 5 and older speak English only (including those from English-speaking countries, from Australia and Canada to Jamaica and Britain itself), while two-thirds speak some other language at home; 93 percent of Hispanic immigrants speak Spanish at home, while only 6.3 percent speak English only. Among the U.S.-born, the contrast remains very sharp: 95.5 percent of non-Hispanics speak English only, compared with 36 percent of Hispanics; 63.5 percent of Hispanic natives still speak Spanish at home, especially Dominicans, Salvadoran, and Guatemalans.
All persons age 5 and older who reported speaking a language other than English at home were asked how well they spoke English (“very well,” “well,” “not well,” or “at all”). The results are presented in Table 2-10, broken down by nativity (foreign-born versus U.S.-born). Among the foreign-born, only 30 percent of Hispanics speak English “very well” (compared with 50 percent of non-Hispanics), while 46 percent speak English “not well” (compared with only 21 percent of non-Hispanics). However, that pattern of linguistic disadvantage in English proficiency is erased by the U.S.-born second+ generations: now three-fourths of Hispanics and non-Hispanics alike report speaking English “very well,” while the proportion who speak it “not well” is in single digits for both populations. Among both the first and second+ generations, Puerto Ricans emerge as the most English-proficient Hispanic group (English is an official language in Puerto Rico).
The evidence of linguistic assimilation between the foreign-born and the native-born is clear cut, but it leaves open the question of the degree of Spanish retention versus English acquisition among foreign-born Hispanics—a subject of considerable controversy in public commentary about a
TABLE 2-9 Language Spoken at Home of Foreign-Born and U.S.-Born Hispanics and Non-Hispanics, 2000 (Persons 5 Years and Older)
|
Ethnic Identity |
First Generation (Foreign-Born) |
Second+ Generations (U.S.-Born) |
|||||
|
English Only |
Spanish |
All Other Languages |
English Only |
Spanish |
All Other Languages |
||
|
Not Hispanic |
N |
5,780,867 |
355,778 |
12,313,265 |
202,899,620 |
3,110,915 |
6,380,528 |
|
|
% |
31.3 |
1.9 |
66.7 |
95.5 |
1.5 |
3.0 |
|
Hispanic: |
N |
984,087 |
14,422,751 |
105,506 |
5,787,871 |
10,167,640 |
66,913 |
|
|
% |
6.3 |
93.0 |
0.7 |
36.1 |
63.5 |
0.4 |
|
Mexican |
% |
6.1 |
93.6 |
0.3 |
34.5 |
65.2 |
0.2 |
|
Puerto Ricana |
% |
8.4 |
91.2 |
0.5 |
37.1 |
62.4 |
0.5 |
|
Cuban |
% |
6.2 |
93.4 |
0.4 |
32.9 |
66.4 |
0.6 |
|
Dominican |
% |
5.7 |
94.0 |
0.3 |
11.7 |
88.0 |
0.4 |
|
Salvadoran, Guatemalan |
% |
4.9 |
94.4 |
0.6 |
14.2 |
85.2 |
0.6 |
|
Central American, other |
% |
6.8 |
92.6 |
0.6 |
32.7 |
66.8 |
0.5 |
|
Colombian |
% |
6.1 |
93.4 |
0.5 |
22.2 |
76.8 |
0.9 |
|
Peruvian, Ecuadorian |
% |
5.1 |
94.2 |
0.7 |
24.3 |
74.9 |
0.8 |
|
South American, other |
% |
7.9 |
89.9 |
2.2 |
35.1 |
63.4 |
1.5 |
|
Other Spanish, Hispanic, Latino |
% |
18.8 |
55.9 |
25.2 |
49.9 |
49.1 |
1.0 |
|
Total |
N |
6,764,954 |
14,778,529 |
12,418,771 |
208,687,491 |
13,278,555 |
6,447,441 |
|
|
% |
19.9 |
43.5 |
36.6 |
91.4 |
5.8 |
2.8 |
|
aFor Puerto Ricans, “foreign-born” includes those born on the island of Puerto Rico, and “U.S.-born” refers to those born on the mainland. SOURCE: 2000 U.S. Census, 5% PUMS. |
|||||||
TABLE 2-10 English Proficiency of Foreign-Born and U.S.-Born Hispanics and Non-Hispanics Who Speak a Language Other Than English at Home (Persons 5 Years and Older)
|
Ethnic Identity |
First Generation (Foreign-Born) |
Second+ Generations (U.S.-Born) |
|||||
|
Very Well |
Well |
Not Well |
Very Well |
Well |
Not Well |
||
|
Not Hispanic |
N |
6,422,750 |
3,618,000 |
2,640,980 |
7,248,659 |
1,368,422 |
879,628 |
|
|
% |
50.6 |
28.5 |
20.8 |
76.3 |
14.4 |
9.3 |
|
Hispanic: |
N |
4,359,787 |
3,492,497 |
6,676,279 |
7,580,619 |
1,851,963 |
802,037 |
|
|
% |
30.0 |
24.0 |
46.0 |
74.1 |
18.1 |
7.8 |
|
Mexican |
% |
24.5 |
22.9 |
52.5 |
71.8 |
19.5 |
8.7 |
|
Puerto Rican |
% |
50.5 |
26.1 |
23.4 |
80.3 |
14.2 |
5.5 |
|
Cuban |
% |
36.0 |
20.6 |
43.4 |
87.3 |
8.9 |
3.8 |
|
Dominican |
% |
30.0 |
25.2 |
44.8 |
77.4 |
17.2 |
5.4 |
|
Salvadoran, Guatemalan |
% |
26.2 |
26.1 |
47.7 |
72.7 |
18.5 |
8.7 |
|
Central American, other |
% |
39.0 |
24.2 |
36.7 |
78.2 |
14.9 |
6.9 |
|
Colombian |
% |
35.1 |
29.1 |
35.8 |
84.5 |
11.3 |
4.3 |
|
Peruvian, Ecuadorian |
% |
35.7 |
28.0 |
36.2 |
84.2 |
11.7 |
4.1 |
|
South American, other |
% |
49.9 |
29.0 |
21.2 |
87.0 |
9.5 |
3.5 |
|
Other Spanish, Hispanic, Latino |
% |
50.0 |
28.0 |
21.9 |
75.7 |
17.4 |
6.9 |
|
Total |
N |
10,782,537 |
7,110,497 |
9,317,259 |
14,829,278 |
3,220,385 |
1,681,665 |
|
|
% |
39.6 |
26.1 |
34.2 |
75.2 |
16.3 |
8.5 |
|
SOURCE: 2000 U.S. Census, 5% PUMS. |
|||||||
presumed lack of a language shift to English among Hispanics, which in turn has raised questions about divided national loyalties and identities. Table 2-11 focuses on foreign-born Hispanics to examine in greater depth the dynamics of English acquisition and proficiency. The measure employed in the table—and illustrated in Figure 2-1—combines the percentage who speak English only with the ability to speak it very well or well into a single index of English fluency.
That degree of fluency is shaped by three main factors: length of time in the United States, age at arrival, and education. English fluency is only in part a function of length of time in the United States—46 percent of those who arrived in the United States in the 1990s were fluent in English by 2000, compared with 61 percent of those who entered in the 1980s, and 69 percent of those who came earlier—but much more powerfully it is a function of age at arrival and level of education. The capacity to learn and to speak a language like a native is especially good between age 3 and the early teens—which is why, of all the dimensions of assimilation, language acquisition is the one most likely to follow a straight-line trajectory. The younger the immigrant at the time of arrival—especially children under age 13—and the more educated the person, the greater the proficiency in English. For example, Spanish-speaking immigrants with a high school education or more who arrived before adolescence are almost universally English fluent (92 to 98 percent) regardless of decade of arrival in the United States, whereas only a minority (21 to 27 percent) of those with less than a high school education who arrived as adults age 35 or older were English proficient, regardless of how long they had been in the United States.
Table 2-12 presents data on a household measure of “linguistic isolation” (defined by the Census Bureau as households in which no one age 14 or older speaks English “very well”). By that measure, first-generation Hispanic households are twice as likely as non-Hispanic households to be linguistically isolated (39 to 19 percent), a disadvantage that remains in the second+ generations (13.8 to 0.6 percent). Again, within the Hispanic collectivity, significant differences were observed among different Hispanic ethnic groups, with U.S.-born Cuban households being the least likely to be linguistically isolated, and Salvadorans and Guatemalans the most.
The decennial census does not collect data on how well Hispanics speak Spanish, however, nor on their actual preference for or patterns of use of English versus Spanish, nor on their level of bilingualism (the sole question asked by the census about any language other than English is whether it is spoken in the home). Yet such data are indispensable to any analysis of linguistic assimilation, especially when examining the language status of those who immigrated as children or of the U.S.-born second generation. In Southern California and South Florida, the CILS collected relevant language data on large samples of 1.5- and second-generation
TABLE 2-11 English Fluencya of Foreign-Born Hispanics in the United States, 2000, by Age of Arrival, Education, and Length of Residence in the United States
|
% English Fluenta (Speaks English Only, or Well, or Very Well) |
||
|
Foreign-born Hispanics: |
|
N |
|
|
|
% |
|
Age at arrival: |
0–12 years old |
% |
|
|
13–34 years old |
% |
|
|
35 and older |
% |
|
Education completedb: |
College graduate |
% |
|
|
High school graduate |
% |
|
|
Less than high school |
% |
|
English fluency by: |
||
|
Age at arrival: |
Education completed: |
|
|
0–12 years old |
College graduate |
% |
|
|
High school graduate |
% |
|
|
Less than high school |
% |
|
13–34 years old |
College graduate |
% |
|
|
High school graduate |
% |
|
|
Less than high school |
% |
|
35 and older |
College graduate |
% |
|
|
High school graduate |
% |
|
|
Less than high school |
% |
|
aEnglish fluency = Persons 5 years or older who speak English only, or well, or very well. bHighest level of education completed for persons 25 years or older. SOURCE: 2000 U.S. Census, 5% PUMS. |
||
Mexican, Cuban, Colombian, Nicaraguan, Dominican, and other Latin American youth at three points in time across the decade from 1992 to 1995 to 2002, spanning ages 14 to 24 on average. The findings on linguistic assimilation are incontrovertible, even among the most presumably Spanish-retentive groups: Mexicans living along the U.S.-Mexico border in San Diego and Cubans in the most bilingual major city in the country, Miami. In 97 percent of the sample, Spanish was the primary language spoken at home. But among Mexican-born youth in San Diego, in the 1992 survey (when they were 14 years old on average) 32 percent already pre-
|
Decade of U.S. Arrival |
|||
|
1990s |
1980s |
Pre-1980 |
Total |
|
7,036,411 |
4,482,200 |
4,282,583 |
15,801,194 |
|
46 |
61 |
69 |
56.4 |
|
76 |
88 |
91 |
84.7 |
|
40 |
56 |
63 |
50.4 |
|
30 |
34 |
36 |
32.2 |
|
67 |
84 |
94 |
81.7 |
|
49 |
73 |
87 |
71.9 |
|
27 |
42 |
52 |
40.5 |
|
Decade of U.S. Arrival |
|||
|
1990s |
1980s |
Pre-1980 |
Total |
|
NA |
96 |
98 |
98.1 |
|
NA |
92 |
96 |
95.7 |
|
NA |
68 |
80 |
77.1 |
|
71 |
85 |
93 |
82.1 |
|
52 |
73 |
83 |
69.0 |
|
29 |
43 |
50 |
40.8 |
|
57 |
69 |
71 |
62.0 |
|
40 |
52 |
55 |
45.5 |
|
21 |
24 |
27 |
23.6 |
ferred to speak English, and that preference rose to 61 percent by the 1995 survey and to 87 percent by the 2002 survey (when they were 24 years old on average); only 13 percent indicated a preference for Spanish by 2002. The proportions preferring English at the three surveys were even larger among the Mexican American second generation: 45 percent in 1992, 79 percent in 1995, and 96 percent by 2002. In Miami, only 2 percent of all of the Latin American groups combined, foreign-born and native-born, expressed a preference for Spanish over English by the last survey. A principal reason for this shift had to do with their levels of speaking, reading, and
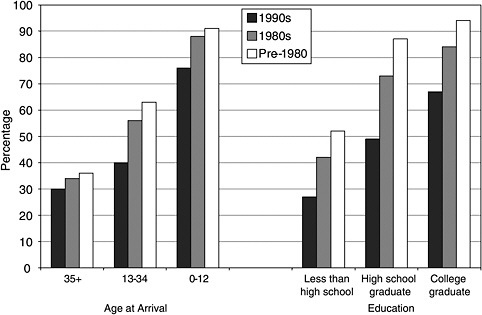
FIGURE 2-1 English fluency of foreign-born Hispanics in the United States, 2000, by age of arrival, education, and length of residence in the United States.
NOTE: English fluency = persons age 5 or older who speak English only, or well, or very well; education = highest level of education completed for persons age 25 or older.
LEGEND: Length of residence in the United States grouped by decade of arrival: 1990s, 1980s, before 1980.
SOURCE: 2000 U.S. Census, 5% PUMS.
writing proficiency in English and Spanish: over time, the degree of proficiency in English significantly outstripped their Spanish fluency, although nearly half of the sample managed to maintain a limited degree of bilingualism by their mid-20s—a pattern observed only among Spanish speakers, unlike Asian-origin children of immigrants, whose native languages atrophied at a much faster rate.
This pattern of rapid linguistic assimilation was constant across nationalities and socioeconomic levels and suggests that, over time, the use of and fluency in Spanish will inevitably decline. The appearance of language loyalty among Spanish speakers (especially Mexicans) is due largely to the effect of continuing high immigration to the United States. For example, a rare multigenerational study of a large representative sample of Mexican-origin couples in Los Angeles (López, 1978) found that among first-generation women, 84 percent used Spanish only at home, 14 percent used both languages, and 2 percent used English only; by the third genera-
TABLE 2-12 Linguistic Isolation in Hispanic and Non-Hispanic Households in the United States, by Generation, 2000 (Persons Five Years and Older)
|
Ethnic Identity |
First Generation (Foreign-Born) |
Second+ Generations (U.S.-Born) |
|||
|
Not Linguistically Isolated |
Linguistically Isolated |
Not Linguistically Isolated |
Linguistically Isolated |
||
|
Not Hispanic |
N |
14,842,048 |
3,505,125 |
219,177,673 |
1,244,351 |
|
|
% |
80.9 |
19.1 |
99.4 |
0.6 |
|
Hispanic: |
N |
9,474,134 |
6,000,378 |
16,289,498 |
2,610,582 |
|
|
% |
61.2 |
38.8 |
86.2 |
13.8 |
|
Mexican |
% |
57.3 |
42.7 |
84.7 |
15.3 |
|
Puerto Ricana |
% |
76.2 |
23.8 |
93.5 |
6.5 |
|
Cuban |
% |
61.5 |
38.5 |
94.0 |
6.0 |
|
Dominican |
% |
63.1 |
36.9 |
76.5 |
23.5 |
|
Salvadoran, Guatemalan |
% |
57.9 |
42.1 |
67.8 |
32.2 |
|
Central American, other |
% |
69.0 |
31.0 |
82.1 |
17.9 |
|
Colombian |
% |
65.8 |
34.2 |
84.4 |
15.6 |
|
Peruvian, Ecuadorian |
% |
67.5 |
32.5 |
83.6 |
16.4 |
|
South American, other |
% |
74.8 |
25.2 |
91.3 |
8.7 |
|
Other Spanish, Hispanic, Latino |
% |
78.9 |
21.1 |
90.6 |
9.4 |
|
Total |
N |
24,316,182 |
9,505,503 |
235,467,171 |
3,854,933 |
|
|
% |
71.9 |
28.1 |
98.4 |
1.6 |
|
NOTE: Linguistic isolation is defined by the U.S. Census Bureau as “a household in which no one age 14 or older speaks English very well.” aFor Puerto Ricans, “foreign-born” includes those born on the island of Puerto Rico, and “U.S.-born” refers to those born on the mainland. SOURCE: 2000 U.S. Census, 5% Integrated PUMS. |
|||||
tion there was a complete reversal, with 4 percent speaking Spanish only at home, 12 percent using both, and 84 percent shifting to English only. Among the men, the pattern was similar except that their shift to English by the second generation was even more marked. More recently, the 2002 National Survey of Latinos—with a large representative sample of first-, second-, and third-generation adults age 18 and older—confirmed these generational differences in language preference and dominance, which in turn were found to shape attitudes and ethnic self-identities (Pew Hispanic Center/Kaiser Family Foundation, 2002). The findings of these studies strongly indicate that the linguistic outcomes for the third generation—the grandchildren of today’s immigrants—will parallel the age-old pattern in American history: the grandchildren may learn a few foreign words and phrases as a vestige of their ancestry, but they are most likely to grow up speaking English only. The shift to English may actually be occurring at a more accelerated rate today. Arguably, the atrophy of these children’s ability to maintain fluency in the language of their immigrant parents is a significant loss of scarce and valuable bilingual resources both for the individual and for the United States in a global economy.
Labor Migration and Human Capital
Group differences in acculturation and linguistic isolation are rooted in very significant differences in the overall educational attainment of Hispanics and non-Hispanics, especially among the foreign-born. By far, both the most educated and the least educated groups in the United States today are immigrants, a reflection of polar-opposite types of migrations embedded in very different historical contexts (Rumbaut, 1992, 1994). That point is made in Table 2-13, contrasting two poles of educational attainment among foreign-born and U.S.-born Hispanics and non-Hispanics age 25 or older: those with less than a high school education, and those with a four-year college degree or more.
Among the foreign-born, non-Hispanics (many of whom are Asian-origin professionals, such as the flows from India, Taiwan, China, and Korea, as well as others from Europe, the Middle East, and Africa) are four times more likely to have college degrees as Hispanics—36 compared with 9 percent. Conversely, nearly three-fifths of Hispanic adults have less than a high school education, compared with only one-fifth of non-Hispanic immigrants. This comparative disadvantage in human capital of Latin American immigrants vis-à-vis their non–Latin American counterparts is reduced but not eliminated by the U.S.-born generations. Intergroup differences in the Hispanic population are particularly pronounced, especially between Mexican, Salvadoran, and Guatemalan immigrants and other groups—although by the U.S.-born generations, these same groups (who in
TABLE 2-13 Educational Attainment of Foreign-Born and U.S.-Born Hispanics and Non-Hispanics in the United States, 2000 (Persons 25 Years and Older)
|
Ethnic Identity |
First Generation (Foreign-Born) |
Second+ Generations (U.S.-Born) |
|||
|
Less Than High School |
College Graduate or More |
Less Than High School |
College Graduate or More |
||
|
Not Hispanic |
N |
3,213,973 |
5,388,741 |
23,821,393 |
37,132,874 |
|
|
% |
21.3 |
35.7 |
16.0 |
25.0 |
|
Hispanic: |
N |
6,724,296 |
1,007,105 |
1,964,135 |
903,691 |
|
|
% |
58.5 |
8.8 |
29.1 |
13.4 |
|
Mexican |
% |
69.9 |
4.4 |
31.0 |
11.6 |
|
Puerto Rican |
% |
46.4 |
10.9 |
23.2 |
14.8 |
|
Cuban |
% |
40.9 |
18.8 |
13.3 |
34.2 |
|
Dominican |
% |
51.8 |
9.5 |
19.3 |
21.4 |
|
Salvadoran, Guatemalan |
% |
64.7 |
5.2 |
26.7 |
22.9 |
|
Central American, other |
% |
42.9 |
13.2 |
13.5 |
33.2 |
|
Colombian |
% |
27.9 |
22.0 |
10.7 |
38.3 |
|
Peruvian, Ecuadorian |
% |
29.5 |
17.6 |
9.3 |
36.1 |
|
South American, other |
% |
19.0 |
31.7 |
7.5 |
46.6 |
|
Other Spanish, Hispanic, Latino |
% |
28.2 |
28.5 |
30.1 |
12.8 |
|
Total |
N |
9,938,269 |
6,395,846 |
25,785,528 |
38,036,565 |
|
|
% |
37.4 |
24.0 |
16.6 |
24.4 |
|
SOURCE: 2000 U.S. Census, 5% PUMS. |
|||||
the immigrant generation constitute the least educated population in American society) make a very substantial gain in educational attainment.
These intergroup differences in education are vividly reflected in their occupational status. Table 2-14 presents census data for employed persons age 16 and older, using the Duncan socioeconomic index (SEI) to rank occupations into two polar types: (1) professional, managerial, and technical occupations with SEI scores above 50 and (2) low-wage labor, indexing jobs with SEI scores below 25. It becomes immediately clear that the foreign-born Hispanic population of the United States is disproportionately concentrated at the bottom of the occupational structure, with 61.5 percent of workers in low-wage labor (more than twice the 30 percent of non-Hispanics working at these jobs). The presence of highly educated professionals from Mexico and elsewhere (Alarcón, 2000) is dwarfed within this overall profile.
It bears underscoring that this figure is driven by the extraordinarily high proportions of three nationalities in particular: Mexicans, among whom more than 4.5 million immigrants, or 69.7 percent of all Mexican-born workers, labor in the lowest paid jobs of the U.S. economy; and Salvadorans and Guatemalans, among whom two-thirds (65.6 percent) are low-wage laborers. Dominicans follow in this hierarchy (54 percent), then Peruvians, Ecuadorians, Colombians, and Puerto Ricans (all between 45 and 49 percent), Cubans (38 percent), and finally “other” South American and other Spanish (33 percent)—but even these latter groups have a higher proportion of low-status workers than do all non-Hispanic immigrants as a whole. That central fact—the entry of migrant workers into the bottom rungs of U.S. labor markets, who fill the vast demand for low-wage labor in an “hourglass” economy—is a defining characteristic of the Latin-origin foreign-born population, especially of its largest component (the flows from Mexico, El Salvador, and Guatemala, especially of undocumented laborers). It has profound long-term implications for the social and economic prospects of their children’s generation, and it is also the basis for common stereotypes that disparage and stigmatize the population as a whole.
Still, among the U.S.-born generations, the gap between Hispanics and non-Hispanics in the proportion of all workers who are at the bottom of the occupational hierarchy closes substantially, to 36 versus 30 percent, respectively—a 6-point differential that is five times smaller than the 31-point gap observed among the foreign-born. Conversely, non-Hispanic immigrants as a whole are far more likely than Hispanics—by a 3-to-1 ratio (46 to 16 percent)—to be employed in professional status positions; indeed, their high levels of educational and professional attainment significantly surpass the norms for non-Hispanic white natives in the United States, and generally reflect the “brain drain” character of immigrant flows from these regions. That gap is also reduced by the U.S.-born generations between
TABLE 2-14 Occupational Statusa of Foreign-Born and U.S.-Born Hispanics and Non-Hispanics in the United States, 2000 (Employed Persons 16 and Older)
Hispanics and non-Hispanics, to 40 versus 29 percent, but it is not eliminated. Again, as with education, intergroup differences within the Hispanic population are quite pronounced, especially between Mexican, Salvadoran, and Guatemalan immigrants on one hand (groups from three countries adjacent to the southern land border, with the fastest overall growth rates over the past two decades and the largest proportions of undocumented immigrants) and other groups on the other—although among the U.S.-born these ethnic groups make very substantial gains in occupational attainment overall. Nonetheless, the continuation of present trends portends widening social and economic inequalities in the Hispanic population, segmented by national origin and generation.
CONCLUSION
Four decades into a new era of mass immigration, it has become commonplace to observe that the United States is undergoing its most profound demographic transformation in a century. Whether in terms of its size, growth, composition, or spatial concentration, the sheer magnitude of the phenomenon is impressive. This new immigration is overwhelmingly non-European in national origin; half of it hails from Spanish-speaking Latin America. The immigrant stock population of the United States today numbers around 70 million people—that is, persons who are either immigrants or U.S.-born children of immigrants—a figure that accounts for nearly a fourth of the total national population and fully three-fourths of the Hispanic population. The latter has been growing much faster than the national population, both through continuing immigration and natural increase, and it will continue to do so for the foreseeable future.
This chapter has focused on factors that distinguish the Hispanic population of the United States from non-Hispanics—their histories and geographies of incorporation, national origins, racial categorization, immigration, citizenship, and especially language, as well as the crucial human capital disadvantages of the first generation compared with non-Hispanic immigrants generally and their implications for a rapidly growing U.S.-born second generation. The confluence of these factors, influencing one another in a process of cumulative causation, shapes a distinctive profile for Hispanics as a whole—a profile that reflects the numerical dominance of the Mexican-origin population, which accounts for nearly two-thirds of the total. However, I have also accented differences between the foreign-born and native-born generations, underscoring the dynamic changes taking place in their acculturation and integration, and among the largest Hispanic-origin ethnic groups, emphasizing that Hispanics or Latinos as a whole are not a homogeneous entity and should not be presumed to be so.
It is also true that the tens of millions of persons so categorized do share
a common label symbolizing a minority group status in the United States. Although the official pan-ethnic category is only about three decades old, and the diverse peoples subsumed under it are largely newcomers who identify with their national origins, the labels “Hispanic” or “Latino” are now used pervasively throughout the society (alongside “Asian,” “black,” “non-Hispanic white”), entering into the popular culture and shaping the national racial-ethnic discourse and hierarchy.
Moreover, the Spanish roots of what is now the United States are older than those of Americans of European, African, and Asian descent. In that sense Hispanic Americans share the legacy of a distinct history that both precedes the founding of the nation, and, most notably as a consequence of two defining wars (the U.S.–Mexican War and the Spanish-American War), of the expansion of the nation in the 19th century. In particular, Mexican Americans and Puerto Ricans—the two largest Hispanic groups and two of the three largest ethnic minorities in the country—are peoples whose incorporation originated largely involuntarily through conquest, occupation, and exploitation, followed by mass immigration during the 20th century, setting the foundation for subsequent patterns of social and economic inequality. The Cubans, Dominicans, Salvadorans, Guatemalans, Nicaraguans, Colombians, and other Latin Americans are of more recent and varied vintage, but their distinct histories too shape their modes of incorporation.
The past, as William Faulkner observed, is never dead; it is not even past. But the past, while prologue, need not be the epilogue too. That epilogue is being written today largely by hard-working newcomers of diverse Latin origins seeking to make their way and looking ahead to their children’s American futures. In the process they are transforming American society even as they themselves are being transformed into the newest Americans. This volume seeks to offer a systematic assessment of their collective enterprise.
REFERENCES
Alarcón, R. (2000). Skilled immigrants and cerebreros: Foreign-born engineers and scientists in the high technology industry of Silicon Valley. In N. Foner, R.G. Rumbaut, and S.J. Gold (Eds.), Immigration research for a new century: Multidisciplinary perspectives (pp. 301–321). New York: Russell Sage Foundation.
Bailey, B. (2001). Dominican-American ethnic/racial identities and United States social categories. International Migration Review, 35(3), 677–708.
Barrera, M. (1979). Race and class in the Southwest. South Bend, IL: University of Notre Dame Press.
Bean, F.D., and Tienda, M. (1987). The Hispanic population of the United States. New York: Russell Sage Foundation.
Black, B. (1988). The good neighbor. New York: Pantheon.
Bonilla, F., and Campos, R. (1981). A wealth of poor: Puerto Ricans in the new economic order. Daedalus, 110, 133–176.
Cardoso, L. A. (1980). Mexican immigration to the United States, 1897–1931. Tucson: University of Arizona Press.
Castillo, J. (2003). Latino? Hispanic? Chicano? American Statesman, July 26.
Choldin, H.M. (1986). Statistics and politics: The “Hispanic issue” in the 1980 census. Demography, 23(3), 403–418.
Collier, S., Blakemore, H., and Skidmore, T.E. (Eds.) (1985). The Cambridge Encyclopedia of Latin America and the Caribbean (pp. 127–160). New York: Cambridge University Press.
Deutsch, S. (1987). No separate refuge: Culture, class, and gender on an Anglo-Hispanic frontier in the American Southwest, 1880–1940. New York: Oxford University Press.
Deverell, W. (2004). Whitewashed adobe: The rise of Los Angeles and the remaking of its Mexican past. Berkeley: University of California Press.
Fears, D. (2003a). Latinos or Hispanics? A debate about identity. Washington Post, August 25.
Fears, D. (2003b). The roots of Hispanic: 1975 committee of bureaucrats produced designation. Washington Post, October 15.
Fernández-Shaw, C. M. (1972). Presencia Española en los Estados Unidos. Madrid: Ediciones Cultura Hispánica.
Fitzpatrick, J.P. (1987). Puerto Rican Americans: The meaning of migration to the mainland (2nd edition). Englewood Cliffs, NJ: Prentice-Hall.
Foley, N. (2004). Straddling the color line: The legal construction of Hispanic identity in Texas. In N. Foner and G. M. Frederickson (Eds.), Not just white and black: Historical and contemporary perspectives on immigration, race, and ethnicity in the United States (pp. 341–357). New York: Russell Sage Foundation.
Fuentes, C. (1992). The buried mirror: Reflections on Spain and the New World. New York: Houghton Mifflin.
Gamio, M. (1930). Mexican immigration to the United States. Chicago: University of Chicago Press.
García, M.C. (1996). Havana USA: Cuban exiles and Cuban Americans in South Florida, 1959–1994. Berkeley: University of California Press.
Garvey, M., and McDonnell, P.J. (1999). José moves into top spot in name game: Favorite choice for boys in California, Texas last year marks major shift. Los Angeles Times, January 8.
Grenier, G.J., and Pérez, L. (2003). The legacy of exile: Cubans in the United States. Boston: Allyn and Bacon.
Griswold del Castillo, R. (1984). La familia: Chicano families in the urban Southwest, 1846 to the present. South Bend, IL: University of Notre Dame Press.
Gutiérrez, D.G. (1995). Walls and mirrors: Mexican Americans, Mexican immigrants, and the politics of ethnicity. Berkeley: University of California Press.
Inter-American Development Bank. (2004, May). Latin American immigrants in the United States to send $30 billion to homelands in 2004. Available: http://www.iadb.org/exr/remittances/images/map2003English.pdf [accessed June 2004].
Itzigsohn, J. (2004). The formation of Latino and Latina panethnic identities. In N. Foner and G. Frederickson (Eds.), Not just black and white: Historical and contemporary perspectives on immigration, race, and ethnicity in the United States (pp. 197–216). New York: Russell Sage Foundation.
Jiménez, A. (Ed.) (1994). Handbook of Hispanic cultures in the United States: History. Houston: Arte Público Press.
Johannsen, R.W. (1985). To the halls of the Montezumas: The Mexican War in the American imagination. New York: Oxford University Press.
La Feber, W. (1993). Inevitable revolutions: The United States in Central America. New York : W.W. Norton.
Landale, N.S., and Oropesa, R.S. (2002). White, black, or Puerto Rican? Racial self-identification among mainland and island Puerto Ricans. Social Forces, 81, 231–254.
Langley, L.D. (2001). The banana wars: United States intervention in the Caribbean, 1898-1934 (2nd ed.) Wilmington, DE: SR Books.
Langley, L.D. (2003). The Americas in the modern age. New Haven, CT: Yale University Press.
López, D.E. (1978). Chicano language loyalty in an urban setting. Sociology and Social Research, 62, 267–278.
Maltby, W.S. (1968). The black legend in England: The development of anti-Spanish sentiment, 1558–1560. Durham, NC: Duke University Press.
Massey, D.S. (1993). Latinos, poverty, and the underclass: A new agenda for research. Hispanic Journal of Behavioral Sciences, 15, 449–475.
Massey, D.S., and Espinosa, K.E. (1997). What’s driving Mexico-U.S. migration? A theoretical, empirical, and policy analysis. American Journal of Sociology, 102(4), 939–999.
Massey, D.S., Alarcón, R., Durand, J., and González, H. (1987). Return to Aztlán: The social process of international migration from Western Mexico. Berkeley: University of California Press.
Massey, D.S, Durand, J., and Malone, N. (2002). Beyond smoke and mirrors. New York: Russell Sage Foundation.
Moncada, A., and Olivas, J. (2003). Hispanos 2000. Madrid: Ediciones Libertarias.
Montejano, D. (1987). Anglos and Mexicans in the making of Texas, 1836–1986. Austin: University of Texas Press.
Moore, J., and Pachón, H. (1985). Hispanics in the United States. Englewood Cliffs, NJ: Prentice-Hall.
Musicant, I. (1990). The banana wars: A history of United States military intervention in Latin America from the Spanish American War to the invasion of Panama. New York: Macmillan.
Passel, J. (2002). New estimates of the undocumented population in the United States. Migration Information Source. Available: http://www.migrationinformation.org/Feature/display.cfm?ID=19 [accessed May 22, 2002].
Pérez, L.A., Jr. (1990). Cuba and the United States: Ties of singular intimacy. Athens: University of Georgia Press.
Pérez, L.A., Jr. (1999). On becoming Cuban: Identity, nationality, and culture. Chapel Hill: University of North Carolina Press.
Pew Hispanic Center/Kaiser Family Foundation. (2002). National survey of Latinos. Available: http://www.pewhispanic.org/site/docs/pdf/LatinoSurveyReportFinal.pdf [accessed December 2002].
Pitt, L. (1971). The decline of the Californios: A social history of the Spanish-speaking Californians, 1846–1890. Berkeley: University of California Press.
Pitts, L., Jr. (1999). José is just as American as baseball, apple pie, and John. Houston Chronicle, January 15.
Portes, A., and Rumbaut, R.G. (2001). Legacies: The story of the immigrant second generation. Berkeley and New York: University of California Press and Russell Sage Foundation.
Portes, A., and Stepick, A. (1993). City on the edge: The transformation of Miami. Berkeley: University of California Press.
Rivera-Batiz, F.L., and Santiago, C.E. (1998). Island paradox: Puerto Rico in the 1990s. New York: Russell Sage Foundation.
Rodríguez, C. (1991). Puerto Ricans: Born in the USA. Boulder, CO: Westview Press.
Rodríguez, R. (1993). Days of obligation: An argument with my Mexican father. New York: Penguin.
Rumbaut, R.D. (1978). The Hispanic prologue. In D. Cardús (Ed.), A Hispanic look at the bicentennial (pp. 5–22). Houston, TX: Institute of Hispanic Culture.
Rumbaut, R.G. (1992). The Americans: Latin American and Caribbean peoples in the United States. In A. Stepan (Ed.), Americas: New interpretive essays (pp. 275–307). New York: Oxford University Press.
Rumbaut, R.G. (1994). Origins and destinies: Immigration to the United States since World War II. Sociological Forum, 9(4), 583–621.
Sachs, S. (2001). What’s in a name? Redefining minority. New York Times, March 11.
Sánchez, G.J. (1993). Becoming Mexican American: Ethnicity, culture, and identity in Chicano Los Angeles, 1900–1945. New York: Oxford University Press.
Sánchez, J.P. (1991). Hispanic American heritage. In H. J. Viola and C. Margolis (Eds.), Seeds of change: A quincentennial commemoration (pp. 173–185). Washington, DC: Smithsonian Institution Press.
Sánchez Korrol, V.E. (1983). From colonia to community: The history of Puerto Ricans in New York City, 1917–1948. Westport, CT: Greenwood Press.
Sánchez Korrol, V.E. (1994). In their own right: A history of Puerto Ricans in the USA. In A. Jiménez (Ed.), Handbook of Hispanic cultures in the United States: History (pp. 281–301). Houston, TX: Arte Público Press.
Schoultz, L. (1998). Beneath the United States: A history of U.S. policy toward Latin America. Cambridge, MA: Harvard University Press.
Shipman, D.E. (1992). Spanish Texas, 1519–1821. Austin: University of Texas Press.
Silverstein, S. (2003). Chancellor tackles image problems. Los Angeles Times, May 27.
Smith, P.H. (1999). Talons of the eagle: Dynamics of U.S.-Latin American relations. New York: Oxford University Press.
Smith, W.S. (1991). Portrait of Cuba. Atlanta, GA: Turner.
Snipp, C.M. (2003). Racial measurement in the American census: Past practices and implications for the future. Annual Review of Sociology, 29, 563–588.
Thomas, H. (1971). Cuba: The pursuit of freedom. New York: Harper & Row.
U.S. Census Bureau. (1975). Comparison of persons of Spanish surname and persons of Spanish origin in the United States. Technical Paper No. 38. Washington, DC: U.S. Government Printing Office.
U.S. Census Bureau. (1997). Revisions to the standards for the classification of federal data on race and ethnicity. Available: http://www.census.gov/population/www/socdemo/race/Ombdir15.html [accessed May 2004].
U.S. Census Bureau. (2004a). Census Bureau projects tripling of Hispanic population in 50 years. Available: http://www.census.gov/Press-Release/www/releases/archives/population/001720.html [accessed May 2004].
U.S. Census Bureau. (2004b). Hispanic and Asian Americans increasing faster than overall population. Available: http://www.census.gov/Press-Release/www/releases/archives/race/001839.html [accessed June 2004].
Vargas, Z. (1993). Proletarians of the North: A history of Mexican industrial workers in Detroit and the Midwest, 1917–1933. Berkeley: University of California Press.
Wallman, K.K., Evinger, S., and Schechter, S. (2000). Measuring our nation’s diversity. American Journal of Public Health, 90(11), 1704–1708.
Walton, J. (2001). Storied land: Community and memory in Monterey. Berkeley: University of California Press.
Weber, D.J. (Ed.). (1973). Foreigners in their native land: Historical roots of the Mexican Americans. Albuquerque: University of New Mexico Press.
Weber, D.J. (1982). The Mexican frontier, 1821–1846: The American Southwest under Mexico. Albuquerque: University of New Mexico Press.
Weber, D.J. (1992). The Spanish frontier in North America. New Haven, CT: Yale University Press.
Williams, T., and Pietrusza, D. (2001). My life in pictures. Kingston, NY: Total Sports.
Wright, L. (1994). One drop of blood. The New Yorker, July 24.


