
10
Climate Forcings and Climate Models
|
As described in Chapter 1, global mean surface temperature varies in response to forcings external to the climate system that affect the global energy balance. For the last 2,000 years, the dominant forcings have been the natural changes in solar irradiance and volcanic eruptions, along with the more recent anthropogenic influences from greenhouse gases, tropospheric aerosols, and land use changes. This chapter largely focuses on the natural forcings during the preindustrial period, data for which come from some of the same sources as the proxy evidence for surface temperature variations, namely, historical records, ice cores, and
tree rings. These reconstructions are typically associated with as much uncertainty as reconstructions of surface temperature.
Climate models are often used to simulate the response of climate to variations in external forcing, including those indicated by proxy evidence. A variety of models have been used to estimate the surface temperature variations implied by the available proxy data for the last 2,000 years. Climate models can also be used to study the feedbacks that determine the response of the global mean surface temperature to external forcings and also to estimate the natural internal variability of the climate system.
CLIMATE FORCINGS
The temperature of the Earth is determined by a balance of the energy entering the Earth–atmosphere system and the energy leaving the system. An energy imbalance imposed on the climate system either externally or by human activities is termed a climate forcing (NRC 2005); persistent climate forcings cause the temperature of the Earth to change until an energy balance is restored. The amount of change is determined by the magnitudes of the climate forcings and the feedbacks within the climate system that amplify or diminish the effect of the forcings (NRC 2003b). Climate forcings that directly affect the radiative balance of the Earth are termed radiative forcings and are typically measured in watts per square meter (W·m–2) (NRC 2005). Positive global mean radiative forcings result in warming of global mean surface temperatures. Volcanic eruptions, changes in the Sun’s radiative output, and the mostly anthropogenic changes in greenhouse gases, tropospheric aerosols, and land use are the main climate forcings for surface temperatures over the last 2,000 years.
Greenhouse Gases
The primary natural greenhouse gases are carbon dioxide (CO2), methane (CH4), and nitrous oxide (N2O). Water vapor is also a greenhouse gas that contributes the largest warming, but it is treated as a feedback because its concentration is controlled by the temperature of the atmosphere rather than by human activities. Continuous atmospheric measurements of carbon dioxide have been available since the mid-20th century from the Mauna Loa Observatory, and all of the significant greenhouse gases have been monitored since 1980 by the National Oceanic and Atmospheric Administration’s global air sampling network (Keeling and Whorf 2005). For previous decades and centuries, greenhouse gas concentrations are obtained by analyzing air bubbles trapped in cores and firn of ice in Antarctica and Greenland.
Over the glacial–interglacial cycles of the last 650,000 years, carbon dioxide varied between about 300 ppm (parts per million by volume) during warm interglacial periods and about 180 ppm during cold glacial periods (Siegenthaler et al. 2005a). Methane and nitrous oxide atmospheric concentrations during interglacial periods did not exceed 790 ppb (parts per billion by volume) and 290 ppb, respectively (Spahni et al. 2005). Carbon dioxide, methane, and nitrous oxide varied little over the past 2,000 years prior to the industrial era (Figure 10-1). Ice core measurements indicate that carbon dioxide and nitrous oxide remained within a few ppm and ppb, respectively, of their mean concentrations and within the uncertainties of the data (Raynaud et al. 2003, Gerber et al. 2003). Methane fluctuated between 600 and 750 ppb, changing with the climate and likely resulting from fluctuations in natural and early anthropo-
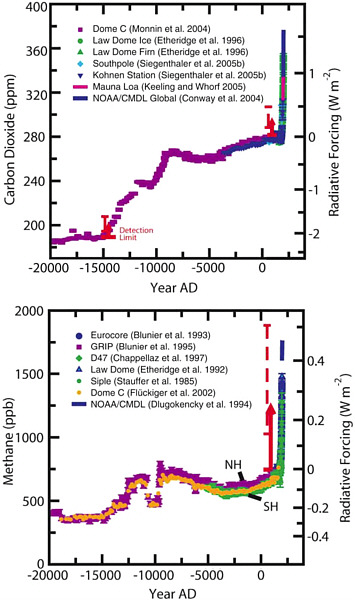
FIGURE 10-1 Evolution of atmospheric carbon dioxide and methane over the last 22,000 years. Left-hand axes show atmospheric concentrations (note the carbon dioxide scale does not start from zero), and right-hand axes show the radiative forcing relative to 1750 as calculated using the formulas given by Myhre et al. (1998) and Ramaswamy et al. (2001). Red arrows indicate the theoretical detection limit of a forcing (relative to Last Glacial Maximum and preindustrial conditions) within a climate system model, assuming an internal climate variability or detection threshold of 0.2°C, climate equilibrium, and a midrange climate sensitivity of 3°C for a carbon dioxide doubling. Dashed red lines indicate the uncertainty of the detection threshold associated with the climate sensitivity range of 1.5 to 4.5°C. SOURCE: Joos (2005). Reprinted with permission; copyright 2005.
genic sources (Blunier et al. 1993, Ruddiman and Thomson 2001, Raynaud et al. 2003, Keppler et al. 2006). Since the beginning of the Industrial Revolution (ca. 1750), the concentrations of these greenhouse gases in the atmosphere have increased considerably. Currently, they are appreciably outside the envelope of glacial–interglacial variations of the last 650,000 years. Carbon dioxide has increased from about 280 ppm during preindustrial times to current values of around 380 ppm. Methane has more than doubled from preindustrial levels, with more moderate but significant increases of nitrous oxide. The radiative forcing due to the increases of these and other long-lived greenhouse gases (relative to A.D. 1750) is about 2.5 W·m–2 (Joos 2005) (Figure 10-1). This is significantly larger than any variations or trends in the natural forcings, as we understand them over the last 2,000 years.
Orbital Changes in Incoming Solar Radiation
The amount of energy received by the Earth from the Sun varies on many different timescales. Over the last two millennia, two mechanisms mainly have affected the amount of solar energy reaching the top of Earth’s atmosphere. The first mechanism is tied to changes in the Earth’s orbital parameters caused by the gravitational pull of the Sun, Moon, and other planets. These effects combine to change the tilt of Earth’s axis of rotation, the eccentricity of Earth’s orbit, and the orientation of the eccentric orbit with respect to the vernal equinox, with timescales ranging from 20,000 to 400,000 years (Berger 1978). Over the limited period of the last 2,000 years, changes in the Earth’s orbit have led to small changes in the amount of solar radiation arriving at the top of the Earth’s atmosphere by latitude and by season. These orbital effects should have resulted in only a small trend in seasonal surface temperatures over the last 2,000 years, making Northern Hemisphere summers slightly cooler and Northern Hemisphere winters slightly warmer today than they were 2,000 years ago. Because of the seasonal nature of these effects, the incoming global average, annual mean solar radiation has remained essentially unchanged.
Solar Variability
The Sun’s emission of radiation also varies in association with the frequency of occurrence of dark sunspots, bright faculae, and other solar phenomena. Estimates of total solar irradiance over the last two millennia come from several measures. Direct space-based radiometer measurements available since 1978 indicate that the total irradiance has varied by only about 0.1 percent over the last two 11-year solar cycles (Fröhlich and Lean 2004). These direct measurements showed a good correlation of sunspot number and irradiance during cycles 21 and 22. For the most recent cycle, the irradiance is as high as during the last two cycles, but the sunspot number is 20–30 percent lower (Fröhlich and Lean 2004, Lean 2005b).
Different solar indices, such as sunspot number, length of the solar cycle, and cosmogenic isotopes of carbon and beryllium, have been proposed as proxies for total solar irradiance during the past two millennia (Figure 10-2). Visual recordings of sunspots with telescopes have been available since 1610, but as noted above, the correlation of sunspots with irradiance has not been the same for the last three cycles. Measurements of beryllium isotopes in ice cores and carbon isotopes in tree rings are available for the past 1,000 to 2,000 years. The production of these isotopes is from
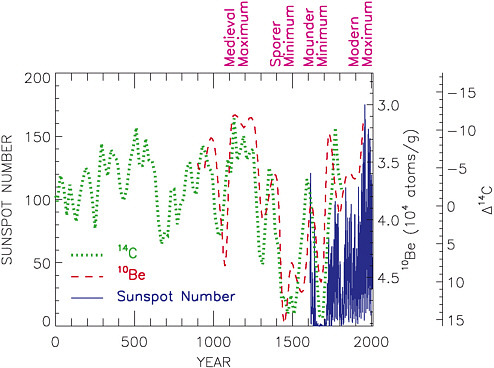
FIGURE 10-2 Records of sunspot number and cosmogenic isotope fluctuations in tree rings and ice cores associated with solar activity over the past 2,000 years. SOURCE: Updated from Fröhlich and Lean (2004). Reprinted with permission; copyright 2004.
galactic cosmic rays that are pushed away from Earth by the solar wind during times of strong solar activity. The relation between irradiance and cosmogenic isotopes, though, is complex and is not necessarily linear (Wang et al. 2005b).
Proxy records of solar irradiance have been used, often in combination with recent satellite measurements and solar modeling experiments, to obtain reconstructions of total solar irradiance over the last two millennia. Early reconstructions adopted a long-term trend in solar irradiance based on cosmogenic isotope records and comparisons to Sun-like stars, yielding a solar irradiance estimate for the Maunder Minimum (1645–1715) of about 0.2–0.4 percent below contemporary solar minima (Hoyt and Schatten 1993, Lean et al. 1995). The mechanisms proposed to explain this trend have been questioned recently, and newer reconstructions assume that solar output during the Maunder Minimum was closer to that of the present-day solar minima (Foukal et al. 2004). The most recent reconstructions (Fröhlich and Lean 2004, Wang et al. 2005a) indicate that solar irradiance has varied by about 0.1 percent over the last 2,000 years, which is equivalent to variations in radiative forcing of 0.1–0.2 W·m–2 between periods of low and high solar activity (Figure 10-2). Extended intervals of low
solar activity, marked by an absence of sunspots, include the periods from 1645 to 1715 (the Maunder Minimum) and from 1450 to 1550 (the Sporer Minimum). These solar minima occurred within the Little Ice Age (which extended from around 1500 to 1850). Some studies have suggested that solar activity during medieval times may have been comparable to the modern solar maximum. Significant uncertainties exist in all of these records because of the shortness of the calibration record and our incomplete physical understanding of solar activity and its influence on irradiance. Additionally, indirect effects associated with ozone and stratospheric changes may alter the atmospheric circulation and response (Shindell et al. 2001).
Volcanic Eruptions
The radiative effect of a volcanic eruption depends on its magnitude and location, the time of year, the vertical orientation of the eruption, and the types and sizes of the ejecta (Robock 2000). Explosive volcanic eruptions add large amounts of ash and sulfur gases to the atmosphere, which diminish the amount of solar radiation reaching the surface, thereby cooling the Earth. Larger ash particles settle rapidly to the surface and generally only cool the surface temperature over a small region for several days to a few weeks. The sulfur gases combine with water vapor to form sulfate aerosols. In large explosive eruptions, the smaller sulfate aerosols are injected high into the atmosphere where they remain for up to several years. Sulfate aerosols from tropical eruptions are transported globally by high-altitude winds, whereas sulfate aerosols from high-latitude eruptions are more spatially restricted and have less effect on global temperature. Although large eruptions can lead to significant cooling immediately after the eruption, such as “the year without a summer” after the 1815 eruption of Mount Tambora in Indonesia, the effect is isolated to a few years. Accumulation of sulfate aerosols from several volcanoes closely spaced in time can lead to more extended global cooling.
Satellite instruments provided aerosol measurements for the large Mount Pinatubo eruption of 1991 in the Philippines. Historical records have been used to document past large eruptions in populated regions, notably Tambora in 1815 and Krakatau in 1883. Farther back, polar ice cores in Greenland and Antarctica recorded the acidity and sulfate in annual ice layers from the settling of volcanic sulfate aerosols (Crowley 2000, Hegerl 2006). Disentangling whether the volcanic debris were from a high-latitude volcano nearby or a large tropical volcano requires using records from multiple ice cores located at both poles and is sensitive to which ice cores are used. Reconstructions of volcanic activity over the last two millennia all distinguish the large eruptions of 1258 or 1259, 1453, and 1815, along with periods of more active volcanism in the late 13th century, the 17th century, and the early 19th century, although the various reconstructions differ with respect to some of the details (Figure 10-3).
Land Use
Although humans have been changing the natural vegetation for thousands of years by clearing forests and planting crops (Ruddiman 2003), the largest regional changes in continental vegetation cover have occurred since the mid-19th century in the Northern Hemisphere and early 20th century in the Southern Hemisphere (Bertrand et al. 2002). Changing land cover affects climate by modifying the surface reflectivity
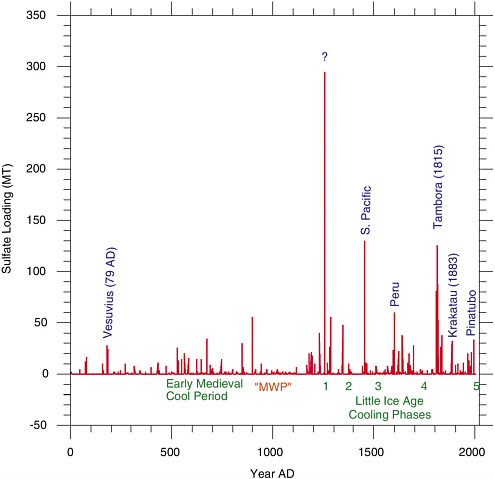
FIGURE 10-3 Ice core estimates of global stratospheric sulfate loading from volcanoes (A.D. 1–2005). SOURCE: T. Crowley, Duke University, 2006, unpublished material. Reprinted with permission; copyright 2006.
and the hydrological cycle. At present, estimates of the temperature change due to land use change are model and dataset dependent and cannot be independently verified with proxy data. One study estimates a global cooling as large as 0.4°C over the last 1,000 years (Bauer et al. 2003). Another suggests significant regional warming in the 20th century (Christy et al. 2006).
In addition to these direct radiative effects, land cover changes can affect the sources and sinks of greenhouse gases and the amount of dust lifted into the atmosphere by the wind. For instance, atmospheric carbon dioxide concentrations are increased by clearing of forests and decreased by reforestation, methane concentra-
tions are increased by the cultivation of rice, and nitrous oxide concentrations are increased by the use of nitrogen fertilizers in agricultural activity.
Tropospheric Aerosols
Natural concentrations of tropospheric aerosols remained relatively constant before the industrial period. Concentrations increased over the 20th century due to human activities (Ramaswamy et al. 2001). The radiative forcings of tropospheric aerosols have large ranges associated with uncertainties in aerosol sources, composition, and properties and their interactions with clouds (NRC 2005). Observations and models indicate that, in total, the direct effects of aerosols and the indirect effect associated with aerosol–cloud interactions likely lead to a reduction of solar radiative flux at the Earth’s surface, although separate aerosol species, such as black carbon, may have a positive radiative forcing (Ramaswamy et al. 2001). Tropospheric aerosols persist in the atmosphere for days to weeks and have significant regional variation; uncertainties in their forcing effects are large, especially at smaller spatial scales (NRC 2005).
CLIMATE MODEL SIMULATIONS
Computer models can be used to simulate the behavior of the climate system, taking into account both temporal and geographic variability, to understand both the natural variability of the climate system and the response of the climate system to changes in climate forcings (NRC 2001). These simulations can also be used to interpret proxy-based climate reconstructions (Trenberth and Otto-Bliesner 2003). A hierarchy of models have been used to simulate the climate variability of the last 1,000 years. These models range from simpler energy balance models to much more detailed and computer-intensive models of the Earth system. Climate models have been used to test various aspects of surface temperature reconstructions. In addition, they can be used to estimate the sensitivity of the surface temperature and other climatic variables to the estimated climate forcings over this period and the uncertainties inherent in those estimates. Using model simulations with several temperature reconstructions and instrumental data over the past seven centuries and accounting for uncertainties in the reconstructions and forcings, Hegerl et al. (2006) give an estimate of climate sensitivity of 1.5–6.2°C.
Climate simulations of the last 1,000 years have been performed with a variety of models (Jones and Mann 2004b and references therein). These simulations generally indicate that surface temperatures in the Northern Hemisphere were cooler prior to the 20th century than during the reference period from 1961 to 1990, with the second half of the 20th century being warmer than any part of the preceding millennium (Figure 10-4). Simulated Northern Hemisphere surface temperatures decrease from A.D. 1000 to a broad minimum extending from 1500 to 1700, and they warm substantially after 1900. Coolings associated with volcanoes are evident in the simulated surface temperatures. The average response of a climate model to volcanic forcing exhibits an e-folding time of cooling consistent with that inferred from large-scale tree-ring- and multiproxy-based reconstructions of Northern Hemisphere summer surface temperature (Hegerl et al. 2003; Figure 10-5). The model simulations are consistent with published surface temperature reconstructions.
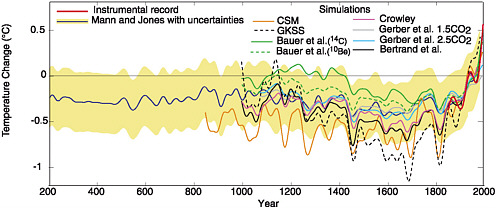
FIGURE 10-4 Estimates of Northern Hemisphere surface temperature variations over the last two millennia. Shown are 40-year smoothed series. Models have been aligned to have the same mean over the common 1856–1980 period as the instrumental series (which is assigned zero mean during the 1961–1990 reference period). The model simulations are based on varying radiative forcing histories and employ a hierarchy of models. SOURCE: Jones and Mann (2004b). Reproduced by permission of American Geophysical Union; copyright 2004.
Differences among the model simulations of the last millennium are related to several factors. The volcanic and solar forcing reconstructions used by the models differ as do their geographic and seasonal implementation. Most climate model simulations published to date used one of the earlier reconstructions of solar irradiance that included an increase in solar irradiance from the Maunder Minimum to present of around 0.2–0.4 percent. None of the long transient simulations have included wave-length-dependent changes in solar irradiance, although this effect has been investigated with shorter sensitivity simulations and has been shown to impact regional surface climate (Shindell et al. 2001). Volcanic reconstructions used in the various climate model simulations show similar timing of major volcanic eruptions and temporal clusters of eruptions. The models differ in the conversion of volcanic sulfate loading into optical depth and in the seasonally dependent horizontal and vertical dispersion of the aerosol cloud. The models also vary with respect to the specifics of the radiative transfer calculations included for volcanic aerosols. For example, in some energy balance models and intermediate complexity models, volcanoes are represented as a negative deviation of the solar irradiance.
Differences between the various model simulations can also be related to differences in the sensitivity of the models (Goosse et al. 2005). Two of the models, CSM and GKSS, are full three-dimensional climate models and have equilibrium climate sensitivities of 2°C and 3.2°C, respectively, for doubling of atmospheric CO2. Some simpler models have an adjustable climate sensitivity (i.e., the Gerber 1.5 × CO2 and 2.5 × CO2 simulations). Different models also exhibit different sensitivities to different external forcings. The full three-dimensional climate models, which include parameterizations for the size distribution and transport of volcanic aerosols, show
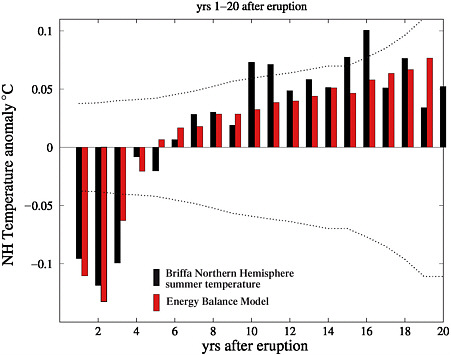
FIGURE 10-5 Comparison of the average response to volcanic eruptions in an energy balance model and the Briffa et al. (2001) reconstruction for the year of the eruption (year 1) to the next major eruption. Dotted lines represent 9–95 percent uncertainty ranges for the observed response (note the sample size decreases with time). SOURCE: Hegerl et al. (2003). Reproduced by permission of American Geophysical Union; copyright 2003.
stronger cooling than the models that prescribe the volcanic forcing in terms of a reduction in the Sun’s emission.
ANTHROPOGENIC FORCING AND RECENT CLIMATE CHANGE
Based on current estimates, variations in natural climate forcings over the last 2,000 years were much less than the increase in current greenhouse forcing due to human activities. Over the 27-year period in which it has been monitored with satellite-borne instruments, the solar radiative forcing has varied only by 0.1–0.2 W·m–2 (Foukal et al. 2004). Volcanic activity has not been anomalous as compared to the last 1,000 years and cannot be used to explain the late 20th century warmth. Concentrations of the greenhouse gases in the atmosphere increased substantially over the 20th century and are appreciably above their preindustrial levels. The radiative forcing due to the increases of long-lived greenhouse gases from 1750 to 2000 is about 2.5 W·m–2 (Ramaswamy et al. 2001). Tropospheric aerosols and land use have also changed due to human activities, but the magnitudes of these forcings are not as well
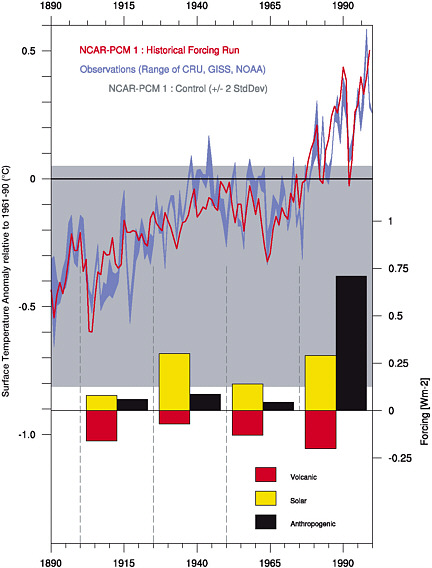
FIGURE 10-6 Model-based estimates of global surface temperature (blue line) compared to observational estimates (red line) with contributions of natural and anthropogenic forcings for 25-year periods shown as color bars. SOURCE: Ammann et al. (2003). Reproduced by permission of American Geophysical Union; copyright 2003.
constrained (Ramaswamy et al. 2001, NRC 2005). Results using a Monte Carlo approach, climate model simulations, and observations of atmospheric and oceanic warming suggest a total radiative forcing from preindustrial times to the present of 1.4–2.4 W·m–2, which is consistent with the observed warming (Knutti et al. 2002).
Simulations with energy balance and intermediate complexity models indicate that a combination of solar and volcanic forcings can explain periods of relative warmth and cold between A.D. 1000 and 1900, but anthropogenic forcings, particularly increases in greenhouse gases, are needed to reproduce the late 20th century warming (Crowley 2000, Bertrand et al. 2002, Bauer et al. 2003). Coupled atmosphere–ocean models have been used to simulate the relative roles of natural versus human-induced climate forcings in explaining the 20th century changes in global surface temperature constructed from instrumental records (Stott et al. 2000, Ammann et al. 2003) (Figure 10-6). Although the different model simulations use different specifications of the various natural and anthropogenic forcings and different parameterizations, the simulations are in agreement that anthropogenic forcing is the largest contributor to late 20th century warmth.
Current climate models have been tuned to optimize their ability to simulate the present climate, and they exhibit a range of climate sensitivities associated with different treatments of processes such as those associated with clouds and snow and ice (Webb et al. 2006, Winton 2006). Some models have been compared against data for past time periods that encompass major changes in forcings and climate responses, for example, the Last Interglaciation (Kaspar et al. 2005, Otto-Bliesner et al. 2006a) and the Last Glacial Maximum (Masson-Delmotte et al. 2006, Otto-Bliesner et al. 2006b). That these models’ simulated climates for those epochs are consistent with proxy evidence lends credibility to their use for attribution of 20th century climate change and projections of future climate change.


