
Overview
The Earth warmed by roughly 0.6°C (1°F) during the 20th century and is projected to warm by an additional ~2–6°C during the 21st century.1 Paleoclimatology, or the study of past climates, can help place this warming in the context of natural climate variability. Lessons learned from studying past climates can also be applied to improving projections of how the climate system will respond to future changes in greenhouse gas concentrations and other climate forcings, as well as how ecosystems and societies might be affected by climate change.
Widespread, reliable instrumental records are available only for the last 150 years or so. To study how climatic conditions varied prior to the time of the Industrial Revolution, paleoclimatologists rely on proxy evidence such as tree rings, corals, ocean and lake sediments, cave deposits, fossils, ice cores, borehole temperatures, glacier length records, and documentary evidence. For example, records of Alpine glacier length, some of which are derived from paintings and other documentary evidence, have been used to reconstruct the time series of surface temperature variations in south-central Europe for the last several centuries. Until recently, most reconstructions of climate variations over the last few thousand years focused on specific locations or regions. Starting in the 1990s, researchers began to combine proxy records from different geographic regions, often using a variety of different types of records, in an effort to document large-scale climate changes over the last few millennia. Most of these large-scale surface temperature reconstructions have focused on hemispheric average or global average surface temperatures over the last few hundred to few thousand years. These reconstructions, and in particular the following questions, are the focus of this report:
|
1 |
This Overview is written for a nontechnical audience and uses minimal referencing. The arguments and evidence to support the committee’s findings are discussed and referenced in Chapters 1–11. This statement, for example, is supported by original research by Smith and Reynolds (2005), Jones et al. (2001), and Hansen et al. (2001), as discussed in Chapter 2. |
-
What kinds of proxy evidence can be used to estimate surface temperatures for the last 2,000 years?
-
How are proxy data used to reconstruct surface temperatures over different geographic regions and time periods?
-
What is our current understanding of how the hemispheric mean or global mean surface temperature has varied over the last 2,000 years?
-
What conclusions can be drawn from large-scale surface temperature reconstructions?
-
What are the limitations and strengths of large-scale surface temperature reconstructions?
-
What do climate models and forcing estimates tell us about the last 2,000 years?
-
How central are large-scale surface temperature reconstructions to our understanding of global climate change?
-
What comments can be made on the value of exchanging information and data?
-
What might be done to improve our understanding of climate variations over the last 2,000 years?
What kinds of proxy evidence can be used to estimate surface temperatures for the last 2,000 years?
Instrumental Records
Combining instrumental records to calculate large-scale surface temperatures requires including a sufficient number of instrumental sites with wide geographic distribution to get a representative estimate. Instrumental temperature records extend back over 250 years in some locations, but only since the middle of the 19th century has there been a sufficient number of observing stations to estimate the average temperature over the Northern Hemisphere or over the entire globe. Tropical measurements are particularly useful for estimating global mean temperature because tropical temperature variations tend to track global mean variations more closely.
Documentary and Historical Records
In many parts of the world, the surface temperature record can be extended back several centuries by examining historical documents such as logbooks, journals, court records, and the dates of wine harvests. This evidence shows that several regions were relatively cool from about 1500 to 1850, a period sometimes referred to as the Little Ice Age. Historical evidence also suggests that Europe and East Asia, in particular, experienced periods of relative warmth during the medieval interval from roughly A.D. 900 to 1300. In contrast to the widespread warming of the 20th century, the timing of these earlier warm episodes appears to have varied from location to location, but the sparseness of data precludes certainty on this point.
In areas where writing was not widespread or preserved, archeological evidence such as excavated ruins can also sometimes offer clues as to how climate may have been changing at certain times in history and how human societies may have responded to those changes. However, the interpretation of historical, documentary, and archeological evidence is often confounded by factors such as disease outbreaks and societal changes. Hence, climatologists more often rely on natural proxy evidence to
produce quantitative reconstructions of past climates and use historical and archeological evidence, when it is available, to provide a consistency check.
Tree Rings
Tree ring formation is influenced by climatic conditions, especially in areas near the edge of the geographic distribution of tree species. At high latitudes and/or at high elevations, tree ring growth is related to temperature, and thus trees from these sites are commonly used as a basis for surface temperature reconstructions. Cores extracted from the trees provide annually resolved time series of tree ring width and of wood properties, such as density and chemical composition, within each ring. In some cases, records from living trees can be matched with records from dead wood to create a single, continuous chronology extending back several thousand years.
Tree ring records offer a number of advantages for climate reconstruction, including wide geographic availability, annual to seasonal resolution, ease of replication, and internally consistent dating. Like other proxies, tree rings are influenced by biological and environmental factors other than climate. Site selection and quality control procedures have been developed to account for these confounding factors. In the application of these procedures, emphasis is placed on replication of records both within a site and among sites and on numerical calibration against instrumental data.
Corals
The annual bands in coral skeletons also provide information about environmental conditions at the time that each band was formed. This information is mostly derived from changes in the chemical and isotopic composition2 of the coral, which reflects the temperature and isotopic composition of the water in which it formed. Since corals live mostly in tropical and subtropical waters, they provide a useful complement to records derived from tree rings. Coral skeleton chemistry is influenced by several variables, and thus care must be taken when selecting coral samples and when deriving climate records from them. Thus far, most of the climate reconstructions based on corals have been regional in scale and limited to the last few hundred years, but there is now work toward establishing longer records by sampling fossil corals.
Ice Cores
Oxygen isotopes measured in ice cores extracted from glaciers and ice caps can be used to infer the temperature at the time when the snow was originally deposited. For the most recent 2,000 years, the age of the ice can in most places be determined by counting annual layers. The isotopic composition of the ice in each layer reflects both the temperature in the region where the water molecules originally evaporated far upwind of the glacier and the temperature of the clouds in which the water vapor molecules condensed to form snowflakes. The long-term fluctuations in temperature
reconstructions derived from ice cores can be cross-checked against the vertical temperature profiles in the holes out of which they were drilled (see below). Ice-isotope-based reconstructions are available only in areas that are covered with ice that persists on the landscape (e.g., Greenland, Antarctica, and some ice fields atop mountains in Africa, the Andes, and the Himalayas). The interpretation of oxygen isotope measurements in tropical ice cores is more complicated than for polar regions because it depends not only on temperature but also on precipitation in the adjacent lowlands.
Marine and Lake Sediments
Cores taken from the sediments at the bottoms of lakes and ocean regions can be analyzed to provide evidence of past climatic change. Sediment cores can be analyzed to determine the temperature of the water from which the various constituents of the sediment were deposited. This information, in turn, can be related to the local surface temperature. Records relevant to temperature include oxygen isotopes, the ratio of magnesium to calcium, and the relative abundance of different microfossil types with known temperature preferences (such as insects) or with a strong temperature correlation (e.g., diatoms and some other algae). Changes in the properties of sediments are also of interest. For example, during cold epochs icebergs streaming southward over the North Atlantic carried sand and gravel and deposited it in sediments at the latitudes where they melted; the properties of this material are indicative of the generally colder conditions in the region where the icebergs originated.
Ocean and lake sediments typically accumulate slowly, and the layering within them tends to be smoothed out by bottom-dwelling organisms. Hence it is only in regions where sedimentation rates are extraordinarily high (e.g., the Bermuda Rise, the northwest coast of Africa) or in a few oxygen-deprived areas (e.g., the Santa Barbara Basin, the Cariaco Basin off Venezuela, or in deep crater lakes) that sediments can be dated accurately enough to provide information on climate changes during the last 2,000 years. More slowly accumulating sediments from ocean basins throughout the world are one of our main sources of information on climate variations on timescales of millennia and longer.
Boreholes
Past surface temperatures can also be estimated by measuring the vertical temperature profile down boreholes drilled into rock, frozen soils, and ice. Temperature variations at the Earth’s surface diffuse downward with time by the same process that causes the handle of a metal spoon to warm up when it is immersed in a cup of hot tea. The governing equation for this process can be used to convert the vertical profile of temperature in a borehole into a record of surface temperature versus time. Features in the vertical temperature profile are smoothed out as they propagate downward, resulting in a loss of information. Hence, large-scale surface temperature reconstructions based on borehole measurements typically extend back only over a few centuries, with coarse time resolution.
Hundreds of holes have been drilled to depths of several hundred meters below the surface at sites throughout the Northern Hemisphere and at a smaller number of sites in the Southern Hemisphere. Many of these “boreholes of opportunity” were drilled for other reasons such as mineral exploration. Specialists acknowledge several differ-
ent types of errors in borehole-based temperature reconstructions, such as an imperfect match between ground temperature and near-surface air temperature, but available evidence indicates that these errors do not significantly influence reconstructions for large regions using many boreholes. Boreholes drilled through glacial ice to extract ice cores are free from many of these problems and can be analyzed jointly with the oxygen isotope record from the corresponding core, yielding a much longer and more accurate temperature reconstruction than is possible with boreholes drilled through rock or permafrost. However, ice-based boreholes are available only in areas with a thick cover of ice.
Glacier Length Records
Records of the lengths of many mountain glaciers extend back over several hundred years. Relatively simple models of glacier dynamics can be used to relate changes in glacial extent to local changes in temperature on timescales of a few decades. The rates of warming inferred from this technique compare quite well with local instrumental measurements over the last century or so.
Most glacier length records are derived from direct observations reported in the historical record, such as paintings that show how far local glaciers extended into their valleys at specific times in history. Natural evidence can also be used to infer past glacial extent. For example, organic materials such as shrubs have recently been uncovered behind rapidly retreating glaciers in several locations. These relics, which were killed and incorporated into the ice when they were overtaken by the glacier at a time when the glacier was advancing, can be dated using radiocarbon to estimate how long it has been since the glacier was last absent from that location.
Other Proxies
Several other types of proxy evidence have been used to reconstruct surface temperatures on a regional basis. For example, calcium carbonate formations in caves, such as stalagmites, and layered organisms found in marine caves called sclerosponges have been analyzed, using methods similar to those used to analyze coral skeletons, to obtain information on past climate variations.
How are proxy data used to reconstruct surface temperatures?
Knowledge of chemical, biological, and/or ecological processes is used to guide the sampling, analysis, and conversion of natural proxy data into surface temperature reconstructions. Borehole temperature measurements and glacier length records can be converted to temperature time series using physically based models with a few key variables. For all other proxies used for the reconstructions discussed in this report, statistical techniques are employed to define the relationship between the proxy measurements and the concurrent instrumental temperature record, and then this relationship is used to reconstruct past temperature variations from the remaining proxy data. The basic methodology is shown schematically in Figure O-1 and described in more detail in the paragraphs that follow. There are variations in the way in which these methods are applied to different proxies and variations in the way that different research groups apply these methods.
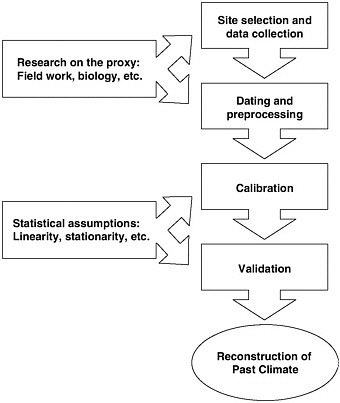
FIGURE O-1 Schematic diagram of the general methodology used to reconstruct past climates, including surface temperature reconstructions.
-
Site selection and data collection—choosing and sampling the particular site and proxy to be used for the reconstruction. In principle, proxy and site selection should be based on an understanding of the physical, chemical, physiological, and/or ecological processes that determine how the proxy reacts to local environmental conditions. In practice, the type and amount of proxy data available at any given location are limited, and the relationship between the proxy and the climate variable of interest is not exactly known. Researchers follow established techniques to collect and measure the samples, while looking for sites where proxy records are as long, continuous, and representative of the target climatic variable as possible.
-
Dating and preprocessing—synchronizing the individual proxy records so they can be plotted on a common time axis. For tree rings, dating is accurate to the calendar year. Dating of corals, ice cores, and historical documents is also often accurate to within a year. Other proxies typically have lower temporal resolution. Adjustments may be performed at this stage to reduce the variations in the proxy time series that are
-
related to nonclimatic factors. Time histories derived from different samples from the same area may also be averaged or spliced together to construct longer and more representative proxy records.
-
Calibration—placing a temperature scale on the “proxy thermometer.” This step typically involves the use of a statistical technique called linear regression. Data can be collected on how proxies respond to temperature in the laboratory or in the field, in which case statistical tests of theoretical or empirical constraints can be used to guide the reconstruction. Since these experimental and monitoring activities cannot be performed for every single proxy record, many reconstructions rely on linear regression to derive an empirical relationship between the proxy time series and the surface temperature in the region of interest. The manner in which this methodology is applied (e.g., whether the regression is based on annual means, 10-year means, or 30-year means, and whether trends are removed from the data) varies from study to study.
-
Validation—testing whether the empirical relationship derived in step 3 has measurable skill, and quantitatively assessing its performance. Typically, portions of the instrumental record are withheld during calibration. The linear regression coefficients derived from the calibration are then used to reconstruct the temperature time series from the proxy data during this validation period, and the reconstructed temperatures are compared with the corresponding instrumental temperature record. A number of different metrics may be used to assess the skill of the reconstruction during the validation step.
-
Reconstruction—the regression algorithm developed in step 3 is applied to the proxy data that are available prior to the instrumental record to extend the temperature reconstruction back in time. Error bars are sometimes assigned to the reconstruction based on how well it matches the observed surface temperature variations during the validation period in step 4. In general, the width of the error bars will vary in time according to the quantity and quality of available proxy evidence. As discussed in further detail below, these error bars do not account for all of the uncertainties present in the reconstruction.
Although calibration against instrumental data is a necessary step to determine how well proxies reflect climate, proxy records are not perfect thermometers; that is, the true relationship between the proxy and the local surface temperature is not known exactly. Furthermore, all proxies are influenced by variables other than temperature, and it can be difficult to account for these confounding factors. The use of linear regression in the calibration step is also a concern because reconstructions derived from linear regression models based on the method of least squares exhibit less variability than the instrumental records they are calibrated against. Additional variance can be lost if the individual proxy records within the reconstruction are not spliced together properly. Finally, in applying these methods it is assumed that the correlation between the proxy data and the instrumental record will hold up over the entire period of the reconstruction, but this assumption is difficult to test.
Large-Scale Surface Temperature Reconstructions
Several surface temperature reconstructions carried out since the mid-1990s involve the synthesis of data from many different locations, often from disparate sources such as tree rings, corals, and ice cores, to infer patterns of temperature variations over
large geographic areas.3 The methodology used to carry out these large-scale surface temperature reconstructions is broadly similar to the methodology described in the preceding section, but modified in the following ways. In step 1, instead of choosing sites to sample, one chooses the particular set of proxies to be used as the basis for the reconstruction. The reconstruction might be based on just one kind of proxy or a combination of several different kinds of proxies (in which case it is referred to as a multiproxy reconstruction), which may have been sampled by a number of different researchers at different times without knowledge that their data would be used for this purpose. To obtain enough spatial coverage, some of the reconstructions include proxies that may be more sensitive to precipitation than they are to temperature, in which case statistical techniques are used to infer the temperature signal, exploiting the spatial relationship between temperature and precipitation fields.
There are two general approaches that are commonly used to perform the calibration, validation, and reconstruction steps (steps 3, 4, and 5 in Figure O-1) for large-scale surface temperature reconstructions. In the first approach, proxies are calibrated against the time series of the dominant patterns of spatial variability in the instrumental temperature record and the results are combined to yield a time series of large-scale average temperature. In the second approach, the individual proxy data are first composited and then this series is calibrated directly against the time series of large-scale temperature variations.
Both the number and the quality of the proxy records available for surface temperature reconstructions decrease dramatically moving backward in time. At present fewer than 30 annually resolved proxy time series are available for A.D. 1000; relatively few of these are from the Southern Hemisphere and even fewer are from the tropics (Figure O-2). Although it is true that fewer sites are required for defining long-term (e.g., century-to-century) variations in hemispheric mean temperature than for short-term (e.g., year-to-year) variations, the coarse spatial sampling limits our confidence in hemispheric mean or global mean temperature estimates prior to about A.D. 1600 and makes it difficult to generate meaningful quantitative estimates of global temperature variations prior to about A.D. 900. Moreover, the instrumental record is shorter than some of the features of interest in the preindustrial period, so there are very few statistically independent pieces of information in the instrumental record for calibrating and validating long-term temperature reconstructions.
Climate Models and the Climate System
Part of the natural variability in the Earth’s temperature is generated by processes operating within the confines of the climate system and part of it is generated by forcings external to the climate system. For the last 2,000 years, these external forcings include volcanic eruptions, variations in the intensity of incoming solar radiation, and changes in greenhouse gas concentrations. The direct effect of these forcings on the Earth’s global mean surface temperature is modified by the presence of feedbacks in
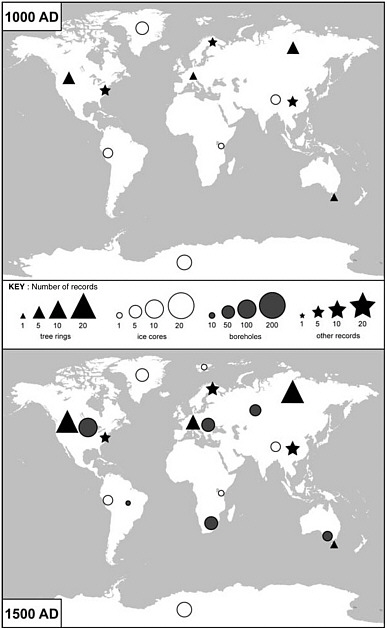
FIGURE O-2 Regional distribution of tree ring, borehole, ice core, and “other” records used to create the large-scale surface temperature reconstructions in Figure S-1 (and Figure O-5) for (top) A.D. 1000 and (bottom) A.D. 1500. “Other records” include marine and lake sediment cores, cave carbonates, and documentary records. The indicated distribution is approximate; for example, several deep-sea sediment cores are not indicated geographically. SOURCE: Data from Huang et al. (2000), Mann and Jones (2003a), Esper et al. (2002a), and Moberg et al. (2005a).
the climate system, such as the one involving the increase in water vapor with increasing temperature. Climate models are often used to estimate the strength of the various feedbacks in the climate system and the overall sensitivity of the Earth’s global mean surface temperature to a prescribed forcing, such as a doubling of atmospheric carbon dioxide concentration.
Climate sensitivity can also be estimated by forcing climate models with the observed or reconstructed external forcings of the climate system over a certain time period and comparing the model response to the observed or reconstructed surface temperature during the same period. This strategy can be applied to past climatic variations on timescales ranging from a few years (in the case of a single volcanic eruption) to tens of thousands of years (as in the simulation of the Ice Ages). Modeling climate variations on the timescale of the last 2,000 years is particularly challenging because the external forcings that operate on this timescale are relatively small and are not as well known as the forcings in the above examples.
What is our current understanding of how the hemispheric mean or global mean surface temperature has varied over the last 2,000 years?
To understand the current state of the science surrounding large-scale surface temperature reconstructions, it is helpful to first review how these efforts have evolved over the last few decades. In a chapter titled “Observed Climate Variability and Change,” IPCC (1990) presented a schematic depiction, reproduced in Figure O-3, of global temperature variations extending from 1975 back to A.D. 900. The Medieval Warm Period and Little Ice Age labels that appear in the graphic refer to features in European and other regional time series that were assumed to be indicative of global mean conditions. The peak-to-peak amplitude of the temperature fluctuations was
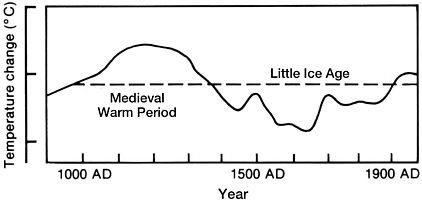
FIGURE O-3 Schematic description of global temperature variations in degrees Celsius for the last 1,100 years published more than 15 years ago. SOURCE: IPCC (1990). Reprinted with permission; copyright 1990, IPCC.
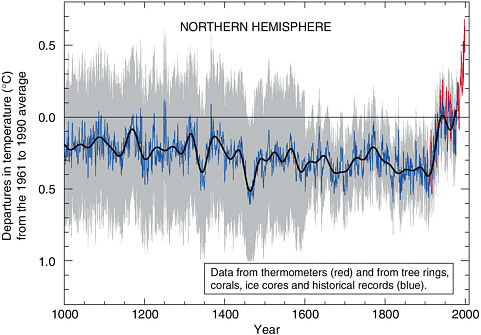
FIGURE O-4 Multiproxy reconstruction of Northern Hemisphere surface temperature variations over the past millennium (blue), along with 50-year average (black), a measure of the statistical uncertainty associated with the reconstruction (gray), and instrumental surface temperature data for the last 150 years (red), based on the work by Mann et al. (1999). This figure has sometimes been referred to as the “hockey stick.” SOURCE: IPCC (2001). Reprinted with permission; copyright 2001, IPCC.
depicted as being on the order of 1°C. The pronounced warming trend that began around 1975 was not indicated in the graphic.
IPCC (2001) featured the multiproxy Northern Hemisphere surface temperature reconstruction reproduced in Figure O-4, which includes error bars. In comparison to the previous figure, the reconstructed surface temperature variations prior to the 20th century were less pronounced, and the 20th century warming was rendered more dramatic by the inclusion of data after 1975. On the basis of the results summarized in this figure, the IPCC concluded that “the increase in temperature in the 20th century is likely4 to have been the largest of any century during the last 1,000 years. It is also likely that, in the Northern Hemisphere, the 1990s was the warmest decade and 1998 the warmest year.”
Despite the wide error bars, Figure O-4 was misinterpreted by some as indicating the existence of one “definitive” reconstruction with small century-to-century variability prior to the mid-19th century. It should also be emphasized that the error bars in this particular figure, and others like it, do not reflect all of the uncertainties inherent in large-scale surface temperature reconstructions based on proxy data.
A more recent and complete description of what we know about the climate of the last two millennia can be gleaned from an inspection of Figure O-5, which was prepared by this committee to show the instrumental record compiled from traditional thermometer readings, several large-scale surface temperature reconstructions based on different kinds of proxy evidence, and results from a few paleoclimate model simulations. Figure O-5 is intended only to provide an illustration of the current state of the science, not a comprehensive review of all currently available large-scale surface temperature estimates.
The instrumental record shown in panel A is compiled from traditional thermometer readings that measure the temperature of the air just above the land surface (or, for ocean points, the temperature of the water just below the ocean surface). Panel B shows a global surface temperature reconstruction based on changes in the lengths of many mountain glaciers, which shrink when the climate warms and grow when the climate cools, and also a global surface temperature reconstruction based on borehole temperature measurements. Panel C shows a compilation of several recent multiproxy-based and tree-ring-based Northern Hemisphere surface temperature reconstructions, each performed by a different paleoclimate research group using its own selection of proxies and its own calibration and validation protocols. Panel D shows results from two climate model experiments forced with time-varying estimates of natural climate forcings over the last 1,000 years plus anthropogenic forcing since the start of the Industrial Revolution.
Each of the curves in Figure O-5 has different uncertainties and somewhat different geographical and seasonal emphasis; no one curve can be said to be the best representation of the actual variations in Northern Hemisphere or global mean surface temperature during the last 1,100 years. Nor is it possible to assign error bars to either individual reconstructions or the ensemble of reconstructions that reflect all of the uncertainties inherent in the conversion of proxy data into large-scale surface temperature estimates.
FIGURE O-5 Large-scale surface temperature variations since A.D. 900 derived from several sources. Panel A shows smoothed and unsmoothed versions of the globally and annually averaged instrumental temperature record (Jones et al. 2001). Panel B shows global surface temperature reconstructions based on glacier length records (Oerlemans 2005b) and borehole temperatures (Huang et al. 2000). Panel C shows three multiproxy reconstructions (Mann and Jones 2003a, Moberg et al. 2005a, and Hegerl et al. 2006) and one tree-ring-based reconstruction (Esper et al. 2002a, scaled as described in Cook et al. 2004) of Northern Hemisphere mean temperature. Panel D shows two estimates of Northern Hemisphere temperature variations produced by models that include solar, volcanic, greenhouse gas, and aerosol forcings, as described by Jones and Mann (2004b). All curves have been smoothed using a 40-year low-pass filter (except for the unsmoothed instrumental data), each curve has been aligned vertically such that it has the same mean as the corresponding instrumental data during the 20th century, and all temperature anomalies are relative to the 1961–1990 mean of the instrumental record.
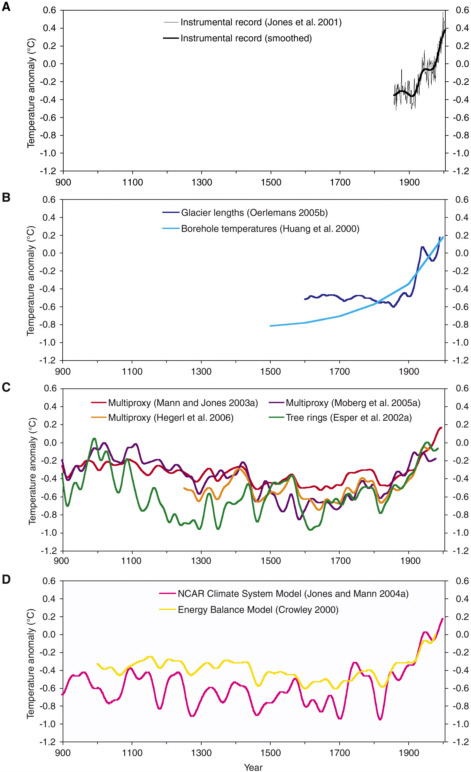
Despite these limitations, the large, diverse, and coherent collection of evidence represented by the samples shown in Figure O-5 indicates that global surface temperatures were relatively cool between 1500 and 1850 (the Little Ice Age) and have risen substantially from about 1900 to present. The tree-ring-based and multiproxy-based surface temperature reconstructions shown in panel C also suggest that the Northern Hemisphere was relatively warm around A.D. 1000, with at least one reconstruction showing surface temperatures comparable in warmth to the first half of the 20th century. The timing, duration, and amplitude of warm and cold episodes vary from curve to curve, and none of the large-scale surface temperature reconstructions show medieval temperatures as warm as the last few decades of the 20th century.
What conclusions can be drawn from large-scale surface temperature reconstructions?
Based on its deliberations, the plots shown in Figure O-5, and the evidence described in the chapters that follow and elsewhere, the committee draws the following conclusions:
-
The instrumentally measured warming of about 0.6°C during the 20th century is also reflected in borehole temperature measurements, the retreat of glaciers, and other observational evidence, and can be simulated with climate models.
-
Large-scale surface temperature reconstructions yield a generally consistent picture of temperature trends during the preceding millennium, including relatively warm conditions centered around A.D. 1000 (identified by some as the “Medieval Warm Period”) and a relatively cold period (or “Little Ice Age”) centered around 1700. The existence of a Little Ice Age from roughly 1500 to 1850 is supported by a wide variety of evidence including ice cores, tree rings, borehole temperatures, glacier length records, and historical documents. Evidence for regional warmth during medieval times can be found in a diverse but more limited set of records including ice cores, tree rings, marine sediments, and historical sources from Europe and Asia, but the exact timing and duration of warm periods may have varied from region to region, and the magnitude and geographic extent of the warmth are uncertain.
-
It can be said with a high level of confidence that global mean surface temperature was higher during the last few decades of the 20th century than during any comparable period during the preceding four centuries. This statement is justified by the consistency of the evidence from a wide variety of geographically diverse proxies.
-
Less confidence can be placed in large-scale surface temperature reconstructions for the period from A.D. 900 to 1600. Presently available proxy evidence indicates that temperatures at many, but not all, individual locations were higher during the past 25 years than during any period of comparable length since A.D. 900. The uncertainties associated with reconstructing hemispheric mean or global mean temperatures from these data increase substantially backward in time through this period and are not yet fully quantified.
-
Very little confidence can be assigned to statements concerning the hemispheric mean or global mean surface temperature prior to about A.D. 900 because of sparse data coverage and because the uncertainties associated with proxy data and the methods used to analyze and combine them are larger than during more recent time periods.
Our confidence in the validity of large-scale surface temperature reconstructions is based, in part, on the fact that the individual proxy data series used to create these reconstructions generally exhibit strong correlations with local environmental conditions. In most cases, there is a physical, chemical, or physiological reason why the proxy reflects local temperature variations. Our confidence is stronger when multiple independent lines of evidence point to the same result, as in the case of the Little Ice Age cooling and of the 20th century warming.
Although the reconstructions based on borehole temperature composites and glacier length records in Figure O-5 do not extend back far enough to provide an independent check on the tree-ring- and multiproxy-based reconstructions for periods prior to the 16th century, there is additional evidence pointing toward the unique nature of recent warmth in the context of the last one or two millennia. This evidence includes the recent melting on the summits of ice caps on Ellesmere Island and Quelccaya and other Andean mountains, the widespread retreat of glaciers in mountain ranges around the world (which in some places has exposed decomposing organic matter that dates to well before A.D. 1000), the recent disintegration of the Larsen B ice shelf in Antarctica, and the fact that ice cores from both Greenland and coastal Antarctica show evidence of 20th century warming (whereas only Greenland shows warming during medieval times). Ice cores from the Andes and Tibetan plateau and the recession of the ice caps on mountains in equatorial Africa, which reflect both temperature and hydrologic processes, also suggest that the 20th century climate is unusual in the context of the last few thousand years.
What are the limitations and strengths of large-scale surface temperature reconstructions?
The main reason that our confidence in large-scale surface temperature reconstructions is lower for periods before about A.D. 1600 is the relative scarcity of precisely dated proxy evidence. Other factors limiting our confidence in these reconstructions include:
-
The relatively short length of the instrumental record (about 150 years) only provides a few pieces of independent information to both calibrate and validate surface temperature reconstructions over large spatial scales and multidecade time periods. Instrumental records used for calibration and validation of proxy data have also been collected during a period when both global mean temperatures and human impacts on the environment have increased substantially.
-
Although care is taken when selecting, analyzing, and interpreting proxy data, there is always the possibility that the relationship between the proxy and local surface temperature may have varied over time. Most proxies are sensitive to temperature only during certain times of year, and the proxy may reflect temperature variations on timescales longer than the calibration period.
-
In the absence of a consensus as to which methods or statistical formulas are most appropriate for calibrating and validating these reconstructions, different choices made by different investigators and research groups also contribute to the differences between them. In some cases the choice of whether or not to include one or more proxy records in a reconstruction has also been a factor.
-
The reliability of large-scale temperature time series derived from observations at a small number of sites and with varying levels of chronological precision is still unresolved. It is widely agreed that fewer sites are required for defining century-to-century fluctuations than year-to-year fluctuations, but errors in the reconstructions that are specifically attributable to the limited spatial sampling are difficult to quantify.
The committee identified the key strengths of large-scale surface temperature reconstructions as:
-
Proxy records are meaningful recorders of environmental variables. These records are selected and sampled on the basis of established criteria, and the connections between proxy records and environmental variables are well justified in terms of physical, chemical, and biological processes.
-
Tree rings, the dominant data source in many large-scale surface temperature reconstructions, are derived from regional networks with extensive replication that reflect temperature variability at the regional scale.
-
Most surface temperature reconstructions incorporate proxy evidence from a variety of sources and wide geographic areas, and the resulting temperature estimates are often robust with respect to the removal of individual records.
-
The same general temperature trends emerge from different reconstructions. Some reconstructions focus on temperature-sensitive trees, others focus on geochemical and sedimentary proxies, and others infer the temperature signal by exploiting the spatial relationship between temperature and precipitation fields.
Our overall confidence in the general character of the reconstructions for the period from around A.D. 1600 onward is high because different reconstructions based on different types of proxy evidence, different selections of proxy data of a given type, and different methodologies yield similar results. Our confidence in statements concerning how temperature may have varied before 1600, and in particular concerning the warmth of the Northern Hemisphere during medieval times compared to that of the last few decades, is lower because of the limited amount of proxy evidence available and the uncertainties in reconstructing a large-scale average temperature from such limited datasets.
The basic conclusion of Mann et al. (1998, 1999) was that the late 20th century warmth in the Northern Hemisphere was unprecedented during at least the last 1,000 years. This conclusion has subsequently been supported by an array of evidence that includes both additional large-scale surface temperature reconstructions and pronounced changes in a variety of local proxy indicators, such as melting on ice caps and the retreat of glaciers around the world. Not all individual proxy records indicate that the recent warmth is unprecedented, although a larger fraction of geographically diverse sites experienced exceptional warmth during the late 20th century than during any other extended period from A.D. 900 onward.
Based on the analyses presented in the original papers by Mann et al. and this newer supporting evidence, the committee finds it plausible that the Northern Hemisphere was warmer during the last few decades of the 20th century than during any comparable period over the preceding millennium. The substantial uncertainties currently present in the quantitative assessment of large-scale surface temperature changes prior to about A.D. 1600 lower our confidence in this conclusion compared to the high
level of confidence we place in the Little Ice Age cooling and 20th century warming. Even less confidence can be placed in the original conclusions by Mann et al. (1999) that “the 1990s are likely the warmest decade, and 1998 the warmest year, in at least a millennium” because the uncertainties inherent in temperature reconstructions for individual years and decades are larger than those for longer time periods, and because not all of the available proxies record temperature information on such short timescales.
What do climate models and forcing estimates tell us about the last 2,000 years?
On the basis of satellite-based monitoring, which began in the late 1970s, it is clear that the rapid global warming of the last few decades is not attributable to an increase in the Sun’s emission. The measurements indicate that the Sun’s emission has not changed significantly during this period, apart from small variations in association with the 11-year sunspot cycle. Whether variations in the Sun’s brightness on longer timescales are large enough to constitute a significant climate forcing is still a matter of debate. It has been hypothesized that reduced solar radiation during the so-called Maunder Minimum in the sightings of sunspots from 1645 to 1715 could have contributed to the coldness of the Little Ice Age.
Sulfate aerosols formed from gases injected into the stratosphere during major volcanic eruptions are known to increase the fraction of the incident solar radiation reflected back to space, cooling the lower atmosphere and the uppermost layers of the ocean. Even though most of the particles settle out of the stratosphere within a year or two, the cooling persists because it takes the ocean several years to cool down and a decade or longer to warm back up. Proxy evidence indicates that the period around A.D. 1000, during which warm intervals are evident in many of the proxy records, corresponded to an extended interval of low volcanic activity in which the incoming solar radiation was relatively unobstructed by the presence of stratospheric aerosols.
Reconstructions of temperatures and external forcings during the 2,000 years preceding the start of the Industrial Revolution are not yet sufficiently accurate to provide a definitive test of the climate sensitivities derived from climate models, mostly because the external forcings on this timescale (mainly solar variability and variations in volcanic activity) are not very well known. Climate model simulations forced with estimates of how solar emission, volcanic activity, and other natural forcings might have varied over this time period, however, are broadly consistent with surface temperature reconstructions (see panel D of Figure O-5).
How central are large-scale surface temperature reconstructions to our understanding of global climate change?
Surface temperature reconstructions have the potential to provide independent information about climate sensitivity and about the natural variability of the climate system that can be compared with estimates based on theoretical calculations and climate models, as well as other empirical data. However, large-scale surface temperature reconstructions for the last 2,000 years are not the primary evidence for the widely accepted views that global warming is occurring, that human activities are contributing, at least in part, to this warming, and that the Earth will continue to warm over the next century. The primary evidence for these conclusions (see, e.g., NRC 2001) includes:
-
measurements showing large increases in carbon dioxide and other greenhouse gases beginning in the middle of the 19th century,
-
instrumental measurements of upward temperature trends and concomitant changes in a host of proxy indicators over the last century,
-
simple radiative transfer calculations of the forcing associated with increasing greenhouse gas concentrations together with reasonable assumptions about the sign and magnitude of climate feedbacks, and
-
numerical experiments performed with state-of-the-art climate models.
Supporting evidence includes:
-
The observed global cooling in response to volcanic eruptions is consistent with sensitivity estimates based on climate models.
-
Proxy evidence concerning the atmospheric cooling in response to the increased ice cover and the decreased atmospheric carbon dioxide concentrations at the time of the last glacial maximum is consistent with sensitivity estimates based on climate models.
-
Documentation that the recent warming has been a nearly worldwide phenomenon.
-
The stratosphere has cooled and the oceans have warmed in a manner that is consistent with the predicted spatial and temporal pattern of greenhouse warming.
Surface temperature reconstructions for the last 2,000 years are consistent with other evidence of global climate change and can be considered as additional supporting evidence. In particular, the numerous indications that recent warmth is unprecedented for at least the last 400 years and potentially the last several millennia, in combination with estimates of external climate forcing variations over the same period, support the conclusion that human activities are responsible for much of the recent warming. However, the uncertainties in the reconstructions of surface temperature and external forcings for the period prior to the instrumental record render this evidence less conclusive than the other lines of evidence cited above. It should also be noted that the scientific consensus regarding human-induced global warming would not be substantively altered if, for example, the global mean surface temperature 1,000 years ago was found to be as warm as it is today.
What comments can be made on the value of exchanging information and data?
The collection, compilation, and calibration of paleoclimatic data represent a substantial investment of time and resources, often by large teams of researchers. The committee recognizes that access to research data is a complicated, discipline-dependent issue and that access to computer models and methods is especially challenging because intellectual property rights must be considered. Our view is that all research benefits from full and open access to published datasets and that a clear explanation of analytical methods is mandatory. Peers should have access to the information needed to reproduce published results, so that increased confidence in the outcome of the study can be generated inside and outside the scientific community. Other committees
and organizations have produced an extensive body of literature on the importance of open access to scientific data and on the related guidelines for data archiving and data access (e.g., NRC 1995). Paleoclimate research would benefit if individual researchers, professional societies, journal editors, and funding agencies continued to improve their efforts to ensure that these existing open-access practices are followed.
Tree ring researchers have recognized the importance of data archiving since 1974, when the International Tree Ring Data Bank was established to serve as a permanent repository for tree ring data (measurements, chronologies, and derived reconstructions). Its holdings are available online via the World Data Center for Paleoclimatology, as are a number of other proxy data from ice cores, corals, boreholes, lake and ocean sediments, caves, and biological indicators. As proxy datasets become increasingly available on the Web, all researchers are given the opportunity to analyze data, test methods, and provide their own interpretation of the existing evidence via recognized, peer-reviewed scientific outlets.
What might be done to improve our understanding of climate variations over the last 2,000 years?
Surface temperature reconstructions have the potential to further improve our knowledge of temperature variations over the last 2,000 years, particularly if additional proxy evidence can be identified and obtained. Additional proxy data that record decadal-to-centennial climate changes, especially for the period A.D. 1–1600, would be particularly valuable. New data from the Southern Hemisphere, the tropics, and the oceans would improve our confidence in global temperature reconstructions, while additional data from regions that have already been sampled would help reduce the uncertainties associated with current reconstructions. In addition, many existing proxy records were collected decades ago and need to be updated in order to perform more reliable comparisons with instrumental records. Better data coverage would also make it possible to test whether or not past temperature changes had the same pattern as the warming during the last century.
New methods, or more careful use of existing ones, may also help circumvent some of the existing limitations of large-scale surface temperature reconstructions based on multiple proxies. Each individual proxy provides a record of environmental change, but the process of combining these signals into a spatially averaged temperature signal requires careful statistical evaluation. It might be possible to circumvent some of the limitations associated with these reconstructions by employing a number of complementary strategies in analyzing the proxy data, including using them to constrain climate models, and by attempting to calibrate the proxy data against climatic variables in different ways.
Finally, some of the most important consequences of climate change are linked to changes in precipitation, especially the frequency and intensity of droughts and floods, as opposed to temperature alone. Changes in regional circulation patterns, snowfall, hurricane activity, and other climate elements over time are also of interest. Hence, it would be valuable to see both regional and large-scale reconstructions of changes in precipitation and other climate variables over the last 2,000 years, to complement those made for temperature. Efforts to improve the reliability of surface temperature reconstructions also need to be complemented by efforts to improve our understanding of the forcings that have contributed to climate variability over the past 2,000 years.
When analyzed in conjunction with historical and archeological evidence, paleoclimatic reconstructions can also tell us how past societies adapted to climate changes. This field of research is moving forward: Hypotheses are being tested, methods are being refined, and new ideas are being introduced.


