
2
Energy for Electricity
BACKGROUND
This chapter considers sources of energy used for the generation of electricity. The committee’s analysis includes utilities, independent power producers, and commercial, and industrial sources. The generation data that we used are available at the Web site of the Energy Information Administration (EIA) (www.eia.doe.gov) of the U.S. Department of Energy, and are the official energy statistics from the U.S. government.
The Current Mix of Electricity Sources
The total electricity generation1 in the United States during 20082 was 4.11 million gigawatt hours (GWh), down very slightly from 2007. In terms of usage, the residential sector consumed the most electricity (36.6% of the total), followed by the commercial sector (36.3%). The industrial sector (26.9%), and transportation (0.2%) accounted for the rest.
The energy sources and the amount of electricity they contributed are given in Table 2-1.
The two largest classes of “other renewables” were wind, which produced 52,026 GWh or 1.3% of the 2008 electricity-generation total; and
TABLE 2-1 Net Electricity Generation by Energy
|
Energy Source |
Net Electricity Generation (GWh) |
Percent of Total Net Generation |
|
Coal |
2,000,000 |
48.5 |
|
Petroleum liquidsa |
31,200 |
0.8 |
|
Petroleum coke |
14,200 |
0.4 |
|
Natural gas |
877,000 |
21.3 |
|
Other gasesb |
11,600 |
0.3 |
|
Nuclear |
806,000 |
19.6 |
|
Hydroelectric |
248,000 |
6.0 |
|
Other renewablesc |
124,000 |
3.0 |
|
NOTE: Net electricity-generation numbers reported by the Energy Information Administration are rounded to three significant figures. aDistillate fuel oil, residual fuel oil, jet fuel, kerosene, and waste oil. bBlast furnace gas, propane gas, and other manufactured and waste gases derived from fossil fuels. cWind, solar thermal, solar photovoltaic (PV), geothermal, wood, black liquor, other wood waste, biogenic municipal solid waste, landfill gas, sludge waste, agricultural by-products, and other biomass. SOURCE: Data from EIA 2008, 2009a. |
||
wood and wood-derived energy sources (38,789 GWh, or 0.9%). Other renewable sources individually amounted to less than 0.5% each; the largest was other biomass, (16,099 GWh, or 0.4%. Generation from solar PV was approximately 600 GWh.
Rationale for Choice of Fuel Sources to Analyze
This chapter provides detailed analyses of electricity generation from coal, natural gas, nuclear fission, wind, and solar. The first three sources were chosen because they together account for 88% of all electricity generated in the United States; moreover they feature prominently in current policy discussions about energy sources. Wind energy also is prominent in policy discussions concerning electricity, and it appears to have the largest potential among all renewable sources to provide additional electricity in the medium term according to current projections (see discussion later in this chapter). Solar energy for electricity (photovoltaics) also is discussed, although not in detail, because of recent legislative and public interest and because of the rapid increase in use over the past 10 years. For the above reasons, the committee concluded that analyzing the external costs and benefits associated with these sources would be of the greatest value to policy makers.
We mention biomass (briefly) because it is such a dispersed source of
electricity (many very small generators). We did not focus on hydropower generation of electricity, even though its current contribution is far greater than that of all other renewable sources combined, because the potential use of hydropower to increase significantly is modest, and hydropower currently receives little attention in energy-policy discussions.
Describing the Effects Caused by Life-Cycle Activities
In its analyses, the committee describes externalities—indeed, all effects caused by life-cycle activities—as being upstream or downstream. By “up-stream,” in the context of energy for electricity, the committee means effects that occur before electricity is generated at an electricity-generating unit (EGU) (such effects as EGU; steam turbine, wind turbine, and solar cell). For fossil-fuel and nuclear EGUs, the largest upstream effects are associated with obtaining and transporting fuel. They include effects of exploration, development, and extraction of geologic deposits of fuel or ore, refining and processing, and transportation of primary energy sources (for example, coal and natural gas). For solar, wind, and hydropower EGUs, the main upstream effects are associated with obtaining, fabricating, and transporting materials required for the EGU and with the construction of the EGU, including road building and other activities. Fossil-fuel and nuclear EGUs also have these effects, but they typically are smaller than those associated with the ongoing production and transportation of the primary energy sources. The committee’s upstream limit for consideration of effects was exploration for fuel. Although effects even further upstream can occur, such as reactions to the announcement of a lease sale for oil, gas, or even the announcement of a proposed mine (for example, see NRC 2003a), those effects are generally unquantified. By “downstream” the committee means effects that are associated with generation of electricity and the subsequent transmission and distribution of electricity to end users. In other words, effects associated with the operation of an electricity-generating facility or with electricity transmission and distribution (that is, delivery to the end user) are considered downstream effects.
General Approach Taken
The goal of this chapter is to describe and, when possible, to quantify the monetary value of the physical effects3 (that is, the “damages”) of electricity production. For electricity generation from nuclear fission, wind power, solar power, and biomass, our analysis summarizes effects reported
from previous studies, but does not monetize damages from externalities. For electricity generation from coal and natural gas we are able to quantify and monetize the externalities associated with local and global air pollution, both upstream and downstream. We express these externalities in costs per kWh of electricity generated and also in costs per ton of pollution generated.
As summarized in Chapter 1, this study is preceded by a large literature on the social cost of electricity. Two notable studies are those by Oak Ridge National Laboratory and Resources for the Future (ORNL-RFF) (1992-1998) and the ExternE project (EC 2003). The goal of each study was to estimate the life-cycle externalities associated with electricity production from various fuel types. Externalities were expressed in monetary terms per kWh to permit comparisons across fuel types. The social costs of electricity generation, together with the private costs of electricity generation, could thus be used to inform choices among fuel types when expanding or replacing generation capacity. Both studies conducted their analyses using representative plants in two geographic locations. Both studies were exhaustive in their descriptions of, and attempts to quantify, various categories of externalities throughout the fuel cycle.
In addition to literature on social costs of electricity, there have been studies on the environmental effects of electricity production. The National Research Council recently (2007b) reported on environmental effects of wind-energy projects, and the New York State Energy Research and Development Authority recently (NYSERDA 2009) reported on effects and risks to vertebrate wildlife in the northeastern United States from six types of electricity generation.4 Both reports included assessments of all life-cycle stages, but did not quantify or monetize the effects.
This chapter builds on and extends these studies. We have attempted to describe externalities and other effects broadly, and to analyze them wherever possible. However, we have focused our efforts to monetize external costs for the categories of externalities that earlier studies found to be a significant component of damages. We extend the studies by measuring the externalities associated with local and global air pollution—a significant component of the costs of electricity generation—for individual coal-fired and gas-fired power plants in the United States. This allows us to characterize the diversity in the damages of electricity generation from fossil fuel across plants and to relate damages per kWh to the pollution intensity of the plant (that is, to pounds of sulfur dioxide [SO2] or particulate matter [PM] emitted per kWh) and the location of the plant, which affects the size of the human and other populations exposed to pollution generated by the plant. We also express damages per ton of pollution emitted. While
a comparison of damages per kWh may (together with information about private costs) help inform the choice of fuel type, it is not particularly useful if the goal is to internalize the externalities associated with pollution emissions.5 Economic theory suggests that the most economically efficient policy to address air-pollution externalities is a policy that targets the externality itself rather the output associated with it. We therefore present information on damages per ton of emissions from coal and natural gas plants that contribute to the concentrations of criteria pollutants.6
The core of our analysis of local air-pollution damages uses an integrated assessment model (the Air Pollution Emissions Experiments and Policy, or APEEP model) (Appendix C), which links emissions of SO2, oxides of nitrogen (NOx), PM2.5, PM10,7 ammonia (NH3), and volatile organic compounds (VOCs) to ambient levels of SO2, NOx, PM2.5, PM10, and ozone (see Box 2-1). The model calculates the damages associated with population exposures8 to these pollutants in six categories: health, visibility, crop yields, timber yields, building materials and recreation. Health damages include premature mortality and morbidity (for example, chronic bronchitis, asthma, emergency hospital admissions for respiratory and cardiovascular disease), and are calculated using concentration-response functions employed in regulatory impact analyses by the U.S. Environmental Protection Agency (EPA). Damages to crops are limited to major field crops, and recreation damages are those associated with pollution damages to forests. A description of the concentration-response functions used in the model is in Appendix C, which also provides details on the choice of unit values used to monetize damages. Damages associated with carbon dioxide (CO2) emissions are computed based on a review of the literature, and are described in Chapter 5. Not all impacts and externalities associated with electricity production have been quantified and monetized in this study. Table 2-2 summarizes which impacts are quantified, monetized, or qualitatively discussed within this chapter.
|
BOX 2-1 Airborne Particulate Matter PM is a heterogeneous collection of solid and liquid particles that can be directly emitted from a source (primary pollutants) or can be formed in the atmosphere by interaction with other pollutants (secondary pollutants). Secondary PM can be formed by oxidation of NOx and SOx to form acids that can be neutralized by ammonia to form sulfates and nitrates. Organic PM may be chemically transformed by oxidants in the air to form secondary pollutants. Soot particles can be altered by adsorption of other pollutants on their surface. PM is monitored for both mass and size. Ultrafine particles (less than 0.1 micron in aerodynamic diameter) can be emitted from combustion sources or can be formed by nucleation of atmospheric gases, such as sulfuric acid or organic compounds. Fine particles (less than 2.5 microns) are produced mainly by combustion of fossil fuels, either from stationary or mobile sources. Coarse particles (sometimes called PM102.5) are mainly primary pollutants that may come from abrasive or crushing processes or the suspension of soil. PM larger than 10 microns is not of great concern for this report because they are not readily respirable and do not have a long half-life in the atmosphere. Current research on PM is exploring the influence of particle composition (in addition to mass and size) on its toxicity, as recommended by the National Research Council (NRC 1998, 1999, 2001, 2004b). However, enough data are not yet available from this research to inform the estimation of damages in this report. |
Regulations
As noted in Chapter 1, the externalities examined in this study are those that have not been eliminated by regulation. Most stages of electricity production are subject to regulations at the federal, state, and local levels. Surface mining of coal, for example, is regulated under the 1977 Surface Mining and Control Act. Air-pollution emissions from electricity-generating facilities are regulated under the Clean Air Act. The U.S. Nuclear Regulatory Commission regulates and licenses nuclear power plants.
Relevant regulations for upstream and downstream activities related to electricity generation are varied and extensive. Their details are not necessarily of great import for this study, although they obviously are important for other reasons. For this study, though, the existence of regulations is of great importance, because in large part regulations are an attempt to reduce upstream and downstream damages from electricity generation, and they have substantially reduced these damages over time. We discuss only those damages that remain, with emphasis on those that can be quantified and monetized. Most of the committee’s quantitative analyses of damages in
TABLE 2-2 Energy for Electricity: Impacts and Externalities Discussed, Quantified, or Monetized
|
|
Energy Sources for Electricity |
|||||
|
Impact or Burden |
Coal |
Natural Gas |
Nuclear |
Wind |
Biomass |
Solar |
|
Upstream |
||||||
|
Air pollutant emissions (SOx, NOx, PM) |
|
|
q |
q |
|
q |
|
CO2-eq (carbon dioxide equivalent) emissions |
|
|
q |
q |
q |
|
|
Metals, radionuclides, and other air pollutants |
q |
q |
q |
q |
q |
|
|
Effluents |
q |
q |
q |
|
|
|
|
Solid wastes |
q |
q |
q |
|
|
|
|
Land cover/footprint |
q |
q |
q |
q |
q |
|
|
Ecological effects |
q |
q |
q |
|
||
|
Occupational and transport injuries |
† |
† |
|
|
|
|
|
Downstream |
|
|
|
|
|
|
|
Air pollutant emissions (SOx, NOx, PM) |
$ |
$ |
|
|
|
|
|
CO2-eq emissions |
|
|
|
|
|
|
|
Metals, radionuclides, and other air pollutants |
q |
q |
|
|
|
q |
|
Effluents |
q |
q |
q |
|
|
|
|
Solid wastes |
q |
q |
q |
q |
||
|
Land cover/footprint |
q |
q |
q |
q |
q |
|
|
Ecological effects |
q |
|
|
†, q |
|
|
|
q = qualitative discussion.
† = impacts quantified. $ = impacts monetized. |
||||||
this chapter focus on emissions from electricity-generating facilities that are fired by coal or natural gas. Under the Clean Air Act, electric utilities are regulated at both the state and federal levels. The Clean Air Act requires states to formulate state implementation plans (SIPs) to pursue achievement of the National Ambient Air Quality Standards (NAAQS) (NRC 2004c). Under SIPs, electricity-generating units (EGUs) are assigned emissions limits for SO2, NOx, PM, and other pollutants, usually stated as performance standards (for example, maximum annual average tons of SO2 that may be emitted per million British thermal units [MMBtu] of heat input). These performance standards vary widely across states. In addition, EGUs are subject under the Clean Air Act to “new source review,” a series of regula-
tions that pertain to newly constructed facilities and to modifications of existing facilities.9 Coal-fired power plants built after 1970 are also subject to “new source performance standards” (NSPS), which impose strict limits on emissions that contribute to the formation of criteria air pollutants. For example, the 1978 NSPS for coal-fired power plants requires the installation of flue gas desulfurization units (scrubbers) on all new coal-fired EGUs.
Emissions of SO2 and NOx are also regulated under various cap-and-trade programs. The goal of Title IV of the 1990 amendments to the Clean Air Act was to reduce SO2 emissions from EGUs to 8.95 million tons by 2010. That goal has been achieved by issuing SO2 permits (allowances) to EGUs equal to 1.2 pounds of SO2 per MMBtu (based on 1985-1987 heat input) and allowing utilities to trade allowances, which may not violate the NAAQS. In 1998, EPA issued a call for SIPs to reduce emissions of NOx. The rule provided the option for states to participate in a regional NOx Budget Trading Program. This program operated from 2003 to 2008, when it was replaced by a NOx ozone season trading program.
The net effect of the environmental regulations described above, as well as others, is that emissions per megawatt-hour (MWh) that contribute to criteria air pollution vary greatly among plants. Newer power plants have, on average, much lower emissions rates. As discussed later in this chapter, SO2 (and NOx) emissions per MWh are much lower for units installed after 1979 than for units installed before that date.
ELECTRICITY PRODUCTION FROM COAL
Current Status of Coal Production
Coal, a nonrenewable fossil fuel, accounts for approximately one-third of total U.S. energy production, and nearly half of all electricity produced. Coal is classified into four types based upon the relative mix of carbon, oxygen and hydrogen: lignite, sub-bituminous, bituminous, and anthracite (Table 2-3). The greater the carbon content, the greater the energy (heating) value of coal. Sub-bituminous and bituminous coal account for more than 90% of coal produced in the United States. Sub-bituminous coal has as much lower sulfur content but also as much lower energy content than bituminous coal. In electricity generation, replacing a ton of bituminous coal requires about 1.5 tons of sub-bituminous coal (NRC 2007c).
The United States has more than 1,600 coal-mining operations that pro-
|
9 |
New source review applies to facilities in areas of pristine air quality where the goal is to prevent significant deterioration of air quality and also to facilities in areas that have not attained the NAAQS. Regulations governing each facility are determined on a case-by-case basis. See the regulatory overview in Chapter 2 of NRC 2006a. |
TABLE 2-3 Coal Classification by Type
|
Type |
Carbon Content (%) |
Heating Value (Thousand Btu/lb) |
U.S. Production (%) |
|
Lignite |
25-35 |
4.0-8.3 |
6.9 |
|
Sub-bituminous |
35-45 |
8.3-13.0 |
46.3 |
|
Bituminous |
45-86 |
11.0-15.0 |
46.9 |
|
Anthracite |
86-97 |
~15.0 |
<0.1 |
|
ABBREVIATION: Btu/lb = British thermal unit per pound. SOURCE: EIA 2008a, Table 7.2; NEED 2008; EIA 2009b. |
|||
duced more than 1.18 billion short tons10 in 2008. Major coal-producing regions are shown in Figure 2-1. The EIA estimates that 70% of coal production comes from surface mines, the majority of which are in Wyoming, Montana, West Virginia, Pennsylvania, and Kentucky. Large mining operations in the Powder River Basin (PRB) in Wyoming and Montana accounted for more than 50% of surface-mine coal production and 40% of nationwide coal production in 2007. Coal in the PRB is mainly sub-bituminous; coal in Appalachia is mainly bituminous (NRC 2007c). The top five coal-producing states in 2007 are listed in Table 2-4.
On average, more coal is produced in the United States than is consumed. The EIA estimates that nearly 95% of U.S.-mined coal is consumed domestically. In 2008, the United States exported 23.0, 7.0, and 6.4 million short tons to Canada, the Netherlands, and Brazil, respectively.
U.S. coal production is focused in a relatively small number of states, but coal is consumed throughout the country. As a result, coal is transported by all major surface transportation modes (Figure 2-2). Once mined, coal is typically transported to power plants, steel mills, and other commercial and industrial companies by rail. In 2007, approximately 70% of coal production was distributed by rail. The remaining 30% was transported by barge, tramway and pipelines, or truck.
Looking forward, it can be expected (barring shifts in current coal consumption trends) that western states will increase their production relative to other states (EIA 2008a). Table 2-5 below lists the ten states with the largest Estimated Recoverable Reserves (ERR). The ERR is derived by the Energy Information Administration (EIA) for each state by applying coal mine recovery and accessibility factors to the Demonstrated Reserve Base (NRC 2007c).
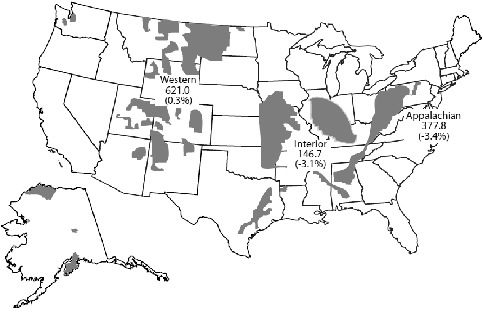
FIGURE 2-1 Major coal-producing regions in the United States (million short tons and percent change from 2006). SOURCE: EIA 2009c, p. 2.
TABLE 2-4 Five Leading Coal-Producing States, 2007, by Mine Type and Production (Thousand Short Tons)
|
State |
Number of Mines |
Production |
|
Wyoming |
20 |
453,568 |
|
Underground |
1 |
2,822 |
|
Surface |
19 |
450,746 |
|
West Virginia |
282 |
153,480 |
|
Underground |
168 |
84,853 |
|
Surface |
114 |
68,627 |
|
Kentucky |
417 |
115,280 |
|
Underground |
201 |
69,217 |
|
Surface |
216 |
46,064 |
|
Pennsylvania |
264 |
65,048 |
|
Underground |
50 |
53,544 |
|
Surface |
214 |
11,504 |
|
Montana |
6 |
43,390 |
|
Underground |
1 |
47 |
|
Surface |
5 |
43,343 |
|
Total, Top Five States |
989 |
830,766 |
|
Underground |
421 |
210,483 |
|
Surface |
568 |
620,284 |
|
Total, United States |
1,358 |
1,145,480 |
|
SOURCE: Adapted from EIA 2009c, p. 11, Table 1. |
||
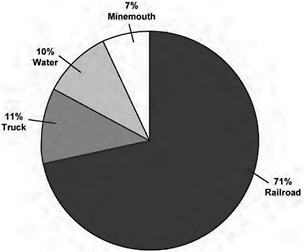
FIGURE 2-2 Methods of U.S. coal transport. NOTE: Data exclude a small unknown component. SOURCE: EIA in AAR 2009.
Brief History of Coal Production
Coal was the predominant source of U.S. energy from the late 19th century through the mid 20th century. Coal was used for electricity, space heating, industrial process heating for iron, steel, and other commodities, and fuel to power ship and train steam engines. During the latter 20th
TABLE 2-5 Estimated Recoverable Reserves for the 10 States with the Largest Reserves by Mining Method for 2005 (million short tons)
|
State |
Underground Minable Coal |
Surface Minable Coal |
Total |
|
Montana |
35,922 |
39,021 |
74,944 |
|
Wyoming |
22,950 |
17,657 |
40,607 |
|
Illinois |
27,927 |
10,073 |
38,000 |
|
West Virginia |
15,576 |
2,382 |
17,958 |
|
Kentucky |
7,411 |
7,483 |
14,894 |
|
Pennsylvania |
10,710 |
1,044 |
11,754 |
|
Ohio |
7,719 |
3,767 |
11,486 |
|
Colorado |
6,015 |
3,747 |
9,762 |
|
Texas |
— |
9,534 |
9,534 |
|
New Mexico |
2,801 |
4,188 |
6,988 |
|
Total, Top 10 States |
137,031 |
98,896 |
235,927 |
|
Total United States |
152,850 |
114,705 |
267,554 |
|
SOURCE: EIA 2006a. Adapted from NRC 2007c, p. 51, Table 3.2. |
|||
century, however, coal was rapidly replaced by petroleum and natural gas for fuel and space heating, respectively. Today, approximately 7% of coal is consumed to generate heat for a variety of industrial processes, including paper, concrete, and steel production.
Upstream Impacts and Externalities of Electricity Production from Coal
Injuries and Illnesses in Coal-Mining Operations
Although the gravity of occupational injuries and illnesses cannot be underestimated, the tradition in economics is to treat occupational injuries and deaths as job characteristics that are traded in labor markets rather than to treat them as externalities. In general, miners receive compensating wage differentials for the higher risks that they face on the job (Viscusi 1993).11 In addition, some proportion of injuries and deaths are compensated after the fact through workmen’s compensation, insurance, or court judgments. We also note that previous studies of the social cost of electricity (for example, ORNL-RFF 1994b) did not count occupational injuries and illnesses as externalities. However, occupational injuries are briefly discussed because they are an important societal concern related to energy production.
Coal-mining-related fatalities and nonfatal injuries have generally decreased over time, even though employee hours have not steadily declined (Figure 2-3). This is the result of increased regulation and safer mining technology. In 2008,12 29 fatal injuries (corresponding to 2 deaths per 10,000 workers) and 4,760 nonfatal injuries (an incidence rate of 3.83 per 100 workers) were reported.13 This marked a 27% decrease from 2000 to 2007 in the incidence of both fatal and nonfatal injuries and, more dramatically, 35% and 54% decreases, respectively, in the incidence of fatal and nonfatal injuries from the previous decade. The majority of both fatal and nonfatal injuries occur in underground mines (67% in 2008), followed by strip mines (19%) and processing plants (8%).14
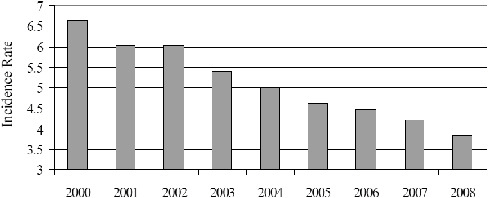
FIGURE 2-3 Injuries in U.S. coal-mining operations from 2000 to 2008. SOURCE: Data from MSHA 2008, Table 08; MSHA 2009.
Most injuries in coal-mining operations result in workdays lost (WDL). In 2007, nonfatal injuries accounted for 220,284 WDL. Injuries classified as strain/sprain, cut or puncture, and fracture accounted for 76% of all injuries (31%, 24%, and 18%, respectively) but only 67% of nonfatal WDL and 6% of fatalities. Multiple injuries and bruises or contusions accounted for 79% and 12%, respectively, of fatalities, while accounting for only 3% and 11%, respectively, of total injuries. Coal-mining operations also reported a total of 159 occupational illnesses in 2007, 80 being disorders associated with repeated trauma and 40 being dust-related diseases of the lungs.
Injuries and Fatalities in Coal Transport
Coal transport introduces risks to the public and to employees of the transportation industry (primarily railroad, truck, and barge), which we describe below. As discussed above, occupational injuries and fatalities are not considered externalities. However, nonoccupational injuries and fatalities probably are externalities—that is, one could argue that the railroad operator might not take the full risk of death or injury to another person into consideration when choosing driving speed or safety equipment unless required to do so by law.
Domestic coal shipments represented 730 billion ton-miles in 2006, a 47% increase from 498 billion ton-miles in 1996. According to the Energy Information Administration, 71% of these U.S. coal shipments were delivered to their final domestic destinations by rail, followed by truck (11%) and barge (10%, mainly on inland waterways). Rail’s share, along with the average length of haul for rail coal movements, has been increasing over
the past 15 years (from 57% in 1990 to 71% in 2006). This is largely due to the growth of western coal. Waterborne traffic’s share of coal shipments has been declining, while the share of coal shipped by truck has fluctuated. Trucks transport coal over short distances, thus accounting for a small proportion of coal ton-miles (less than 2% in 2002) but a more substantial amount of tonnage (12% that same year). The average distance traveled by truck per shipment of coal increased from 51 miles in 1997 to 88 miles in 2002.
Coal is by far the most significant commodity carried by rail. In 2007, coal transport accounted for almost 44% of tonnage, 24% of carloads, and 21% of gross revenue for U.S. Class I railroads as well as a significant portion of non-Class I railroad freight. The commodity dominates originated rail traffic in major coal-producing regions. For example, coal accounted for 79% of total rail tons originated in Kentucky, 95% in West Virginia, and 96% in Wyoming in 2006. Coal (not including coal coke) is also a significant commodity in waterborne commerce, accounting for approximately 9% of tonnage. Large trucking, by contrast, only owes 0.2% of vehicle miles traveled to coal transport. For these reasons, we focus on the externalities associated with the shipment of coal by rail.
Over the past several decades, rail transportation has seen considerable drops in accident/incident rates, thanks in part to numerous initiatives on grade crossings and trespasser prevention. In 2008, there were 571 freight rail fatalities and 4,867 nonfatal injuries, indicating a 9% decline in fatalities and 11% decline in nonfatal injuries since 2007, and, more notably, 48% and 76% declines, respectively, since 1990. Ninety-seven percent of fatalities occur among the public, while, in contrast, the majority of nonfatal injuries and illnesses are borne by employees.
To estimate fatal and nonfatal injuries attributable to coal transport via rail, we use revenue ton-miles15 as a quantifiable proxy for risk of rail-associated injury. The reasoning for using revenue ton-miles as a proxy for risk of injury to railroad employees is that the number of employee hours, and hence the number of injuries, is more closely correlated with the revenue ton-miles measure than with train-miles or carloads. The reason for using revenue ton-miles as a proxy for risk of injury to the public is based on availability of information. A train-miles measure of coal transport would be the preferred metric for assessing risk to the public, but no such recent measure is available. We chose ton-miles of coal transport as the “next-best” measure for assessing risk to the public because it includes distance.
Our estimate of the number of fatal and nonfatal rail injuries attribut-
able to shipping coal for electric power generation appears in Table 2-6. The estimate is computed by multiplying the total number of occupational and public injuries occurring on freight railroads16 in 2007 by the proportion of ton-miles of commercial freight activity on domestic railroads accounted for by coal (43%).17 This estimate is then multiplied by the percent of coal transported that is used for electric power generation (91%).
By analogy with coal mining, we assume that occupational deaths and injuries are not externalities. A key issue is whether deaths among the public constitute externalities. One can argue that they are externalities (most are people struck by a moving train); however, based on the magnitude of the resulting damages, we have not monetized them, and they are not included in our aggregated damages. Valuing the 241 lives lost in 2007 by using a value of a statistical life (VSL) of $6 million 2000 U.S. dollars (USD) (about $7.2 million 2007 USD) would result in damages less than $2 billion annually.
Land-Use and Runoff Externalities from Surface and Underground Mines
This section describes, but does not quantify or monetize, environmental effects of coal mining. Over the past 58 years there has been a relative shift to surface mining and to coal from western states (Figures 2-2 and 2-4). Surface mining is used for shallow deposits. Techniques range from area strip mining more typical in the West to contour strip mining and mountaintop mining/valley fill (also known as “mountaintop removal”) more typical in the East. Underground mining techniques range from drift mines and slope mines for deposits relatively near the surface to shaft mines for deposits deep underground.
Wyoming’s Powder River Basin (PRB) has near-surface deposits of coal that are more than 100 feet thick, making surface mining easy and productive, and the coal is almost always shipped to market “raw” (that is, without processing). A single PRB surface mine can yield more than 90 million tons annually. In contrast, coal in Appalachia, whether from surface or underground mining, is generally produced at smaller, lower-yield mines, and the coal often is processed in order to lower ash and moisture content (NRC 2007c).
The negative environmental externalities of coal mines, both during operation and after closure, depend in part on the mining method:
TABLE 2-6 Estimated Injuries, Illnesses, and Fatalities During Rail Transport of Coal for Electric Power, 2007
|
|
Fatalities |
Nonfatal Cases |
Total Cases |
||||
|
Injuries |
Illnesses |
NFDL |
NDL |
Total NF |
|||
|
Employees on duty |
5 |
1,408 |
36 |
991 |
453 |
1,444 |
1,449 |
|
Other (such as the public) |
241 |
— |
— |
— |
— |
698 |
939 |
|
Total |
246 |
— |
— |
— |
— |
2,142 |
2,388 |
|
ABBREVIATIONS: NFDL = nonfatal days lost; NDL= no days lost; NF = nonfatal. SOURCE: FRA 2008. |
|||||||
-
Underground mining. In addition to its threats to human health and safety, underground mining can also have environmental externalities. Collapses or gradual subsidence above the mined void can affect surface and subsurface water flows. Mine fires can occur, especially in abandoned mines. The disposal of mine wastes, especially wastes resulting from coal processing, can present environmental problems (NRC 2002b, 2007c). As much as 50% of the material fed to a process for treating raw coal can result in waste, often in the form of slurry, which usually is pumped into an impoundment. Impoundments can give way, as in the October 2000 breakthrough of a 72-acre coal waste impoundment near Inez, Kentucky (NRC 2002b). Environmental problems also can be triggered by acid mine
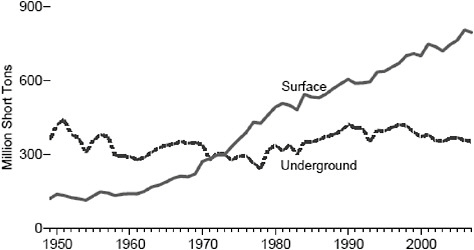
FIGURE 2-4 U.S. coal production 1949-2007, by mining method. SOURCE: EIA 2008a, p. 224, Figure 7.2.
-
drainage caused primarily by pyrite (FeS2), which is found in coal, coal overburden, and mine waste piles (USGS 2009a).
-
Surface mining (area and contour). Surface mining shares with underground mining the problem of mine waste disposal and acid mine drainage. It also poses the environmental challenge of reclaiming large tracts of land. The 1977 Surface Mining Control and Reclamation Act was intended to address surface-mining effects. It requires that sites be returned to their prior condition or to a condition that supports “higher and better uses.”
-
Mountaintop mining/valley fill (MTM/VF). MTM/VF is a type of surface mining used on steep terrain. Since its inception in the 1970s, this mining method has become widespread in Appalachia. Mountaintop mining often generates a large volume of rock, or “excess spoil,” that cannot be returned to its original locations and typically is placed in adjacent valleys. MTM/VF shares the negative externalities of other types of surface mining (see above) and has other externalities as well.
A Final Programmatic Environmental Impact Statement (FPEIS) on MTM/VF was released in October 2005 to consider developing agency policies regarding the adverse environmental effects of MTM/VF. Prepared by the U.S. Army Corps of Engineers, EPA, the U.S. Department of Interior’s Office of Surface Mining and Fish and Wildlife Service, and the West Virginia Department of Environmental Protection, the FPEIS focused on approximately 12 million acres encompassing most of eastern Kentucky, southern West Virginia, and western Virginia as well as scattered areas of eastern Tennessee. About 6.8% of the study area (816,000 acres) has been or may be affected by recent and future (1992-2012) mountaintop mining (EPA 2002, 2005a).
The study area is largely forested and contains about 59,000 miles of streams, most of which are considered headwater streams. The FPEIS comments that “headwater streams are generally important ecologically” and that “the study area is valuable because of its rich plant life and because it is suitable habitat for diverse populations of migratory songbirds, mammals, and amphibians” (EPA 2005a, p. 3).
The EPA Region 3 Web site on MTM/VF and the FPEIS note that valley fills generally are stable, but “based on studies of over 1,200 stream segments affected by mountaintop mining and valley fills, the following environmental issues were noted:
-
An increase of minerals in the water—zinc, sodium, selenium, and sulfate levels may increase and negatively impact fish and macroinvertebrates leading to less diverse and more pollutant-tolerant species.
-
Streams in watersheds below valley fills tend to have greater base flow.
-
Streams are sometimes covered up.
-
Wetlands are, at times inadvertently and other times intentionally, created; these wetlands provide some aquatic functions, but are generally not of high quality.
-
Forests may become fragmented (broken into sections).
-
The regrowth of trees and woody plants on regraded land may be slowed due to compacted soils.
-
Grassland birds are more common on reclaimed mine lands as are snakes; amphibians such as salamanders, are less likely….
-
Cumulative environmental costs have not been identified…(EPA 2009a).
The Web site also notes that there may be social, economic, and heritage issues with MTM/VF. Similarly, a USGS study of the Kanawha Basin (Paybins et al. 2000) shows significant degradation in the biotic communities of this mid-Atlantic river basin as a result of coal-mining operations, and other USGS studies show similar effects elsewhere (see USGS 2009b).
A possible benefit of coal mining can be the roads, utilities, and other infrastructure that accompany a mining operation. With proper planning, especially integration of the mine decommissioning and closure plan with local master plans, this infrastructure can be used for other economic enterprises following mine closure (NRC 2007c).
Upstream Emissions of Greenhouse Gases and Other Pollutants
The upstream life cycle of power generation from coal includes many relevant activities such as construction of infrastructure and power plants (see, for example, Pacca and Horvath 2002), but the most significant, from a perspective of greenhouse gas (GHG) emissions and criteria-pollutant-forming emissions, are surface and underground mining and transportation of coal. Mining and transport are fuel- and energy-intensive, requiring combustion of fossil fuels for cutting, moving, and preparing the coal from the mine and delivering it to power plants and other industrial facilities. Beyond emissions from engines, there are also significant emissions of methane, a GHG that exists within coal seams and is released as the seams are cut to extract the coal. As methane is a much more potent GHG than CO2, methane emissions are a significant concern.
In surface mining, the overburden (layers of rock and earth above the coal) is broken and removed to get to the underlying coal. The breaking and removal of both overburden and coal, and its movement from mine to transportation network is done with enormous machinery and engines that operate mostly by burning liquid fuels that release GHG emissions and criteria-pollutant-forming emissions. Underground mining uses similar
technologies, but shafts need to be drilled down to the seam depth, and the subsurface coal cutting and moving equipment is generally less energy efficient due to its smaller size since it has to fit beneath the surface.
Prior studies have assessed the relative contribution of air emissions from mining and transport of coal in the life cycle of coal-fired power generation (Jaramillo et al. 2007, Spath et al. 1999, ORNL/RFF 1992-1998). While not negligible, these studies found that upstream activities lead to relatively small life-cycle air emissions because of the dominance of GHG emissions and criteria-pollutant-forming emissions on site at coal-fired power plants. For example, Jaramillo et al. (2007) report that the mid-point GHG emission factors for coal combustion (at the power plant) and the entire coal life cycle are 2,100 lb CO2 equivalent (eq)/MWh and 2,270 lb CO2-eq/MWh, respectively.
Downstream Externalities of Electricity Production from Coal
Analysis of Current Air-Pollution Damages from Coal-Fired Power Plants
The air-pollution emissions from fossil-fueled power plants constitute a significant portion of the downstream damages associated with electric power generation. In this section, we quantify the impacts on human health, visibility, agriculture, and other sectors associated with coal-fired powerplant emissions contributing to criteria pollutant formation. The effects of those emissions on ambient air quality are modeled using the APEEP model (Muller and Mendelsohn 2006) and are calculated for each of 406 coal-fired power plants for the year 2005. We use the APEEP model to calculate the damages associated with emitting a ton of each of four pollutants (SO2, NOx, PM2.5, and PM10) at each power plant. Damages per ton are multiplied by the tons of each of the four pollutants emitted by the plant in 2005. This produces an estimate of aggregate damages associated with criteria-pollutant-forming emissions from each plant. Damages are also expressed per kWh.
Choice of Modeling Platform
Calculating the damages associated with air-pollution emissions involves three steps: (1) translating changes in emissions into changes in ambient air quality; (2) using concentration-response functions to calculate health impacts, environmental impacts, and others; and (3) valuing those impacts. This section describes the choices the committee made along each of these dimensions and discusses their strengths and limitations.
Approach to Air-Quality Modeling
There are two general approaches one can take to air-quality modeling: process-based modeling and reduced-form modeling. A process-based model captures the complexities of environmental processes by including exhaustively detailed representations of each mechanism in the atmosphere. Process-based models attempt to reflect the natural processes that govern the relationship between emissions and concentrations. The models are often applied to simulations with very fine spatial and temporal scales. The Community Multiscale Air Quality (CMAQ) model is widely considered the state of the science in process-based air-quality modeling (Byun and Schere 2006).
Despite these advantages, there are downsides to process models. Because of their exhaustive embodiment of a multitude of atmospheric processes, such models are time-intensive and expensive to operate. The implied cost of running process models limits the number of times researchers can run these models for a particular application. This constraint forces policy analyses using these models to make other compromises. For example, process models cannot be used to conduct large numbers of experiments. As a result, national applications of CMAQ and other process models feature a relatively small number of modeling runs in which many sources have their emissions modified at once. This approach may be appropriate for simulating a national or regional policy, but the simulation design is fundamentally unable to isolate the impact of emissions from individual sources over a large modeling domain. If that is the objective of the research, which is the objective in this study, then a simpler, reduced-form air-quality model.18
The reduced-form modeling approach depicts the environment with a simple representation that mimics the overall behavior of the entire system. Reduced-form models do not include all the complex relationships of the process-based models. Their advantages are that they are relatively fast, inexpensive to operate, and easy to interpret. The most critical drawback of reduced-form models is that they may omit or misrepresent a key element in the environmental process. The model used in this analysis, APEEP, uses a source-receptor matrix with county-level sources and receptors that are derived from a Gaussian air-quality model. The cells of the matrix, which are generated by the Gaussian model, represent estimates of the concentrations of a given pollutant (per unit of emission). The cells were systematically adjusted to implicitly represent the spatial effects of the dispersion and
transformation processes embodied in the CMAQ model. An alternative approach to develop a reduced-form model is to fit a “response surface” to CMAQ output, which has been used by EPA. The latter is a purely statistical approach.
APEEP has been carefully calibrated to CMAQ to reflect the relationships between emissions and concentrations that CMAQ estimates. However, APEEP has some drawbacks: It cannot effectively represent episodic events because of the use of annual and seasonal average meteorologic data. Although its use of county-level resolution is quite fine-grained for a national study, a preferred approach would be grid-cell-level resolution for large western counties.
Our choice of air-quality modeling approach in this study is motivated by the desire to model the impact of emissions from individual power plants. Power plants vary greatly in the amount of pollution they emit and, by virtue of their location, in the impact of the pollution on human health and on ecosystems. Exploring the heterogeneity of pollution impacts across space is important from a policy perspective because it provides regulators with a means to set priorities for emissions abatement by identifying the relative damage caused by emissions from different sources. To explore these effects, many model runs must be conducted. Reduced-form models are the optimal modeling choice in such a context.
Choice of Concentration-Response Functions
In analyses of air-pollution damages and the benefits of reducing them (for example, the Benefits and Costs of the Clean Air Act, 1990-2010 [EPA 1999]), impacts on human health constitute the vast majority of monetized damages, with premature mortality constituting the single largest damage category. The concentration-response functions for human health end points (including premature mortality, chronic bronchitis, and hospital admissions) used in APEEP are listed in Table C-1 of Appendix C. They are the same concentration-response functions as those used in the EPA regulatory impact analyses; therefore, those functions have been vetted by the EPA Clean Air Science Advisory Committee. In particular, the impact of PM on premature mortality is calculated using the relationship between PM2.5 and all-cause mortality in Pope et al. (2002).19 The concentration-response functions used to calculate impacts on agriculture, forestry, and
other sectors are listed in Appendix C and further described in Muller and Mendelsohn (2006).
One limitation of the APEEP model as used in this analysis is its limited treatment of ecosystem damages. For example, the model does not measure the impacts of acid rain associated with NOx and SO2 emissions either on tree canopy or on fish populations. It also fails to capture eutrophication of fresh-water ecosystems from nitrogen deposition.
Valuation
As in most analyses of damages associated with criteria-pollutant-forming emissions, health damages figure prominently in aggregate monetized damages—especially premature mortality associated with PM2.5. The value of monetized damages is particularly sensitive to the VSL used to monetize cases of premature mortality. The value that we use for our central case analysis is $6 million 2000 USD. This value is supported by recent meta-analyses of the literature on the VSL as well as by values used in EPA regulatory impact analyses. In their 2003 meta-analysis, Viscusi and Aldy (2003) reported a mean value of $6.7 million (2000 USD), and Kochi et al. (2006) reported a value of $5.4 million based on an empirical Bayes estimator. These values are in line with values used in recent EPA regulatory impact analyses: The Clean Air Interstate Rule (CAIR) regulatory impact analysis (RIA) uses a value of $5.4 million (1999 USD), and the EPA National Center for Environmental Economics recommends using a $7.4 million VSL (2006 USD). (This amount is equivalent to $6.3 million in 2000 USD.) A $6 million VSL (2000 USD) is also used by other researchers (for example, Levy et al. 2009) who recently examined the health impacts of power-plant emissions.
We applied the same VSL to persons of all ages. Although there is some evidence that willingness to pay for changes in mortality risks varies with age, the EPA Environmental Economics Advisory Committee of the Science Advisory Board judged in 2007 that the literature on this issue was not sufficiently mature to determine exactly how the VSL varies with age. The practice of valuing lives lost by multiplying the number of life years lost by the value of a statistical life year (VSLY) was also rejected. The empirical evidence on the impact of age on the VSL does support the use of the VSLY approach, which assumes that the VSL is proportional to remaining life expectancy (EPASAB 2007).
In calculating the value of premature mortality, we treated the lives lost due to changes in PM2.5 concentrations as occurring in the same year as the change in the concentrations. EPA (1999, Appendix D) assumed that the impact of a reduction in PM2.5 concentrations was spread over 5 years, with 25% of the change in deaths occurring in same year as the change in
concentrations, 25% occurring the next year, and one-sixth occurring in each of the following 3 years. At a 3% discount rate, the present discounted value of damages using EPA’s lag structure would be 95% of the mortality damages that we calculated. At a discount rate of 7%, the damages would be 89% of the mortality damages that we calculated. However, selecting a particular lag structure is associated with great uncertainty. In its review of the NAAQS for PM, EPA indicated that it is difficult to assess the time between the occurrence of a cause and its purported effect based on the studies it reviewed of PM exposures, given that airborne PM concentrations are generally correlated over time in any given area. For all-cause mortality and cardiovascular mortality, EPA observed that the greatest effect size is generally reported for the 0-day lag and 1-day lag. The effect generally tapered off for longer lag periods (EPA 2005b).
Treatment of Uncertainty
The version of APEEP used in our analysis does not provide error bounds that reflect either statistical uncertainty in the concentration-response functions used in the model or in the range of VSL estimates in the literature. The relationship between emissions and ambient air quality is likewise treated as certain, as is the case in regulatory impact analyses of air-quality regulations. Due to the importance of the VSL in determining the size of air-pollution damages, we used a value of $2 million (2000 USD) as a sensitivity analysis. The likely impact of using alternative concentration-response functions (for example, Dockery et al. 1993) is discussed below.
Methodology The APEEP model calculates the damages associated with emitting an additional ton of each of six pollutants (SO2, NOx, PM2.5, PM10, NH3, and VOCs) as a function of the county in which the pollutant is emitted and the effective stack height of the emissions. The categories of damages covered by APEEP and reflected in our estimates include premature mortality associated with PM2.5, cases of chronic bronchitis and respiratory and cardiovascular hospital admissions associated with PM2.5 and PM10, changes in crop and timber yields associated with ozone, damage to building materials from SO2, impairments to visibility associated with PM2.5 and recreation damages associated with ozone-related changes in forest canopy. As described in more detail in Appendix C, APEEP calculates the impact of a ton of emissions of each pollutant on ambient air quality, and the effect of the change in ambient air quality on population-weighted exposures to PM, ozone, SO2, and NOx. The impact of changes in exposure on health, crop yields, visibility, and other categories of damages is estimated using concentration-response functions from the literature. Damages are monetized using unit values from the literature. (Appendix C lists the
concentration-response functions used in the analysis and the unit values used to monetize damages.)
We calculated damages associated with each power plant by multiplying the damages per ton of each pollutant by the number of tons of each pollutant emitted by the plant in 2005, implying that we calculated the damages associated with 2005 emission levels compared with zero emissions. In practice, installing additional pollution control devices (or switching to low-sulfur coal) could reduce emissions very close to zero at most plants. We could have calculated damages relative to some estimate of the lowest emissions levels achievable by using existing control technologies; however, a zero baseline is more transparent. This approach implies that the damages calculated at each plant are an upper bound to the benefits from additional pollution controls.20
Results The monetized damages associated with emissions of SO2, NOx, PM2.5, and PM10 in 2005 are calculated for each of 406 coal-fired electricity-generating facilities by combining damages per ton from APEEP with emissions data from the 2005 National Emissions Inventory (NEI).21 Estimates of the damages associated with a ton of each of four kinds of emissions (SO2, NOx, PM2.5, and PM10) that form criteria air pollutants are obtained from APEEP as a function of the county in which the pollutant is emitted and the effective stack height of the emissions. These are combined with data on emissions of these pollutants, by stack, from the 2005 NEI.22 This allows us to calculate the monetized damages associated with each pollutant at the plant level. Data from the Energy Information Administration on net generation of electricity from coal were used to compute monetized damages per kWh.
Damages from the criteria-pollutant-forming emissions were calculated, as described above, for each of 406 plants that generated electricity from coal in 2005.23 Table 2-7 and Figure 2-5 present the distribution of monetized damages across plants. (In Table 2-7 all plants are weighted equally, hence the mean figures are arithmetic means of damages across all plants.) As Table 2-7 makes clear, most damages come from SO2 (85%), followed by NOx (7%), PM2.5 (6%) and PM10 (2%). This reflects the size of SO2 and NOx emissions from coal-fired power plants and the damages associated with fine particles formed from SO2 and NOx.24 Directly emitted PM2.5 has very high damages per ton (see Table 2-8), but very little PM2.5 is emitted directly by power plants; most is formed from chemical transformations in the atmosphere.
Table 2-8 shows how the damages per ton of pollutant vary across plants, again weighting all plants equally. Variation in damages per ton reflects differences in the size of the populations (human and other) exposed to pollution from each plant, as well as differences in effective stack heights across plants. The assumption implicit in our calculations—that the damage per ton of pollutant emitted is independent of the number of tons emitted at the plant—is consistent with the epidemiological literature and with the calculation of air-pollution damages by EPA and other agencies.25
Damages from the criteria-pollutant-forming emissions in 2005 averaged $156 million per plant, but the range of damages across plants was wide—the 5th and 95th percentiles of the distribution are $8.7 and $575 million dollars, respectively (2007 USD). As Figure 2-5 shows, the distribution is highly skewed. After ranking all the plants according to their damages, we found that the most damaging 10% of plants produced 43% of aggregate air-pollution damages from all plants, and the least damaging 50% of the plants produce less than 12% of aggregate damages.26 Where are the plants with the highest damages located? The map in Figure 2-6 shows the size of damages created by each of the 406 plants, by plant location. Plants with large damages are concentrated to the east of the Mississippi, along the Ohio River Valley, in the Middle Atlantic and the South.
Some of the variation in damages across plants occurs because plants that generate more electricity tend to produce greater aggregate damages;
|
23 |
Each of our plants is classified as SIC 4911. Together they accounted for 94.6% of electricity generated from coal and sold to the grid (EIA 2009d, Table 1.1). |
|
24 |
Approximately 99% of the damages associated with SO2 come from secondary particle formation, that is, the transformation of SO2 into PM10 and PM2.5. |
|
25 |
The concentration-response functions in the air pollution literature are approximately linear in ambient concentrations. The unit values assigned to health and other endpoints are likewise assumed to remain constant over the relevant ranges of the endpoints. |
|
26 |
Each set of plants—the most damaging 10% and the least damaging 50%—account for approximately one quarter of electricity generated by the 406 plants. |
TABLE 2-7 Distribution of Criteria-Air-Pollutant Damages Associated with Emissions from 406 Coal-Fired Power Plants in 2005 (2007 U.S. Dollars)
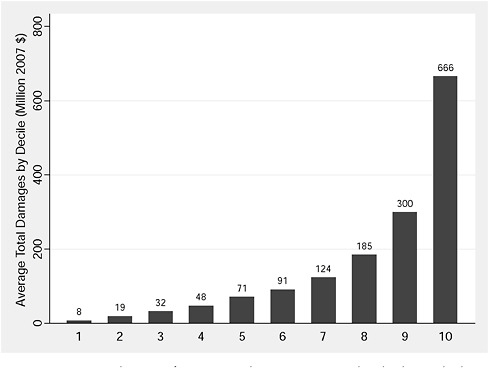
FIGURE 2-5 Distribution of aggregate damages in 2005 by decile: coal plants (U.S. dollars, 2007). NOTE: In computing this graph, power plants were sorted from smallest to largest based on aggregate damages. The lowest decile represents the 40 plants with the smallest aggregate damages. The figure on the top of each bar is the average, across all plants, of damages associated with SO2, NOx, PM2.5, and PM10.
TABLE 2-8 Distribution of Criteria-Air-Pollutant Damages per Ton of Emissions from Coal-Fired Power Plants (2007 U.S. Dollars)
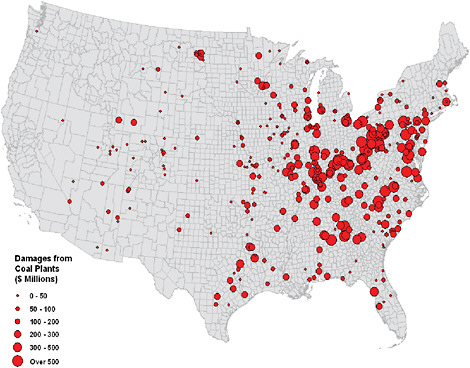
FIGURE 2-6 Air-pollution damages from coal generation for 406 plants, 2005 (U.S. dollars, 2007). Damages related to climate-change effects are not included.
hence we also report damages per kWh of electricity produced.27 Table 2-9 and Figures 2-7 and 2-8 show damages per kWh for all four pollutants. Mean damages per kWh (2007 USD) from four criteria-pollutant-forming emissions are 4.4 cents per kWh if all plants are weighted equally and 3.2 cents per kWh if plants are weighted by the electricity they generate. The lower figure reflects the fact that larger plants are often less damaging per kWh.28 What is equally important as mean damages is the distribution of damages across plants. As Table 2-9 indicates the 95th percentile of the distribution—damages of 12 cents per kWh—is more than an order of magnitude larger than the 5th percentile. The distribution of damages per kWh (Figure 2-7) is very skewed: There are many coal-fired power plants with low damages per kWh as well as a small number of plants with high damages. Using generation-weighted figures, the damages per kWh from the least damaging 5% of plants were very small: 94% lower than the average coal-fired plant and almost as low as the average damage per kWh at natural gas power plants (0.16 cents). Figure 2-8 maps damages per kWh for each power plant. As in the case of aggregate damages, the plants with lowest damages per kWh are in the West. Plants with the largest damages per kWh are concentrated in the Northeast and the Midwest.
What explains variation in damages per kWh across plants? Damages per kWh associated with a criteria air pollutant (for example, SO2) are the product of emissions per kWh and the damage per ton of pollutant emitted. For the 406 plants examined, variation in damages per kWh is primarily due to variation in pollution intensity (emissions per kWh) across plants, rather than variation in damages per ton of pollutant, which varies with plant location. In the case of SO2, emissions per kWh reflect the sulfur content of the coal burned, adoption of control technologies (for example, scrubbers), as well as the vintage of the plant. Pounds of SO2 emitted per MWh (see Tables 2-10 and 2-11) vary greatly across plants, and this variation explains approximately 83% of the variation in damages attributed to SO2 emissions per kWh. As Table 2-11 indicates, pounds of SO2 and NOx emitted per MWh vary significantly with plant vintage, reflecting the fact that newer plants are subject to more stringent pollution controls. Variation in damages per ton of SO2 emitted (see Table 2-8) accounts for only
TABLE 2-9 Distribution of Criteria-Air-Pollutant Damages per Kilowatt-Hour Associated with Emissions from 406 Coal-Fired Power Plants in 2005 (2007 Cents)
24% of the variation in damages per kWh.29 A ton of pollution emitted by plants located closer to population centers does more damage than the same ton emitted in a sparsely populated area; however, while plant location is important, coal plants are not located in counties with the highest damages per ton of SO2 in the United States.
To summarize, the aggregate damages associated with criteria-pollutant-forming emissions from coal-fired electricity generation in 2005 were approximately $62 billion (USD 2007), or 3.2 cents per kWh (weighting each plant by the fraction of electricity it produces); however, damages per plant
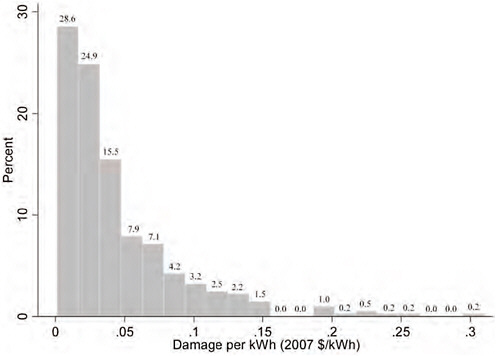
FIGURE 2-7 Distribution of air-pollution damages per kWh for 406 coal plants, 2005 (U.S. dollars, 2007). NOTE: All plants are weighted equally rather than by the electricity they produce.
varied widely. The lowest-damage 50% of plants, which accounted for 25% of net generation, produced 12% of damages, and the highest-damage 10% of plants, which also accounted for 25% of net generation, produced 43% of the damages. Although damages are larger for plants that produce more electricity, less than half of the variation in damages across plants is explained by differences in net generation.
Damages per kWh also varied widely across plants: from approximately half a cent (5th percentile) to over 13 cents per kWh (95th percentile). (These are unweighted figures.) Most of the variation in damages per kWh can be explained by variation in emissions intensity across plants. In the case of SO2, which accounts for 85% of the damages associated with SO2, NOx and PM, over 80% of the variation in SO2 damages per kWh is explained by variation in pounds of SO2 emitted per kWh. Damages per ton of SO2 emitted, which vary with plant location, are less important in explaining variation in SO2-related damages per kWh. (They are, by themselves capable of explaining only 24% of the variation in damages per kWh.)
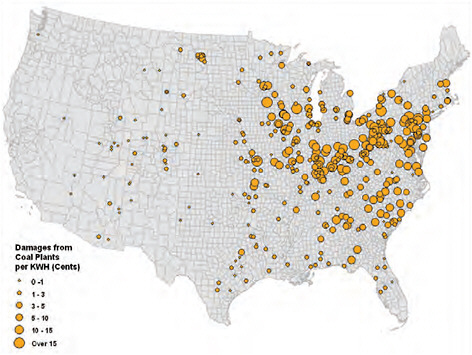
FIGURE 2-8 Regional distribution of air-pollution damages from coal generation per kWh in 2005 (U.S. dollars, 2007). Damages related to climate change are not included.
Of the 14 categories of criteria-air-pollutant damages included in APEEP, 6 relate to human health and the remainder to physical impacts (materials damage, ozone damage to crops and forests, the cost of foregone recreation due to SO2, NOx, ozone, and VOCs, and the cost of reduced visibility due to airborne particulate matter).
Sensitivity Analysis and Comparison with the Literature
The results of any analysis of the damages associated with air-pollution emissions depend critically on (1) the size of the emissions reduction analyzed; (2) the air-quality model used to translate emissions into ambient air quality; (3) the choice of concentration-response function for premature mortality and (4) the VSL used to monetize premature mortality. Premature mortality constitutes 94% of the damages reported above. When a VSL of $2 million is used (Mrozek and Taylor 2002), premature mortality constitutes 85% of total damages, and the weighted-average cost per kWh falls to 1.2 cents. If we had chosen to use Dockery et al. (1993) as the
TABLE 2-10 NOx and SO2 Emissions (2002) from Coal-Fired Electricity Generation by Age of Power Plant
|
a. 2002 NOx Emissions and Share of Generation of Coal-Fired Capacity by Vintage |
|||||||||||||
|
Power Plant Established |
Avg. NOx Emission Rate (lb/MWh) |
% Total NOx Emitted |
% of Coal-Fired Electricity Generation |
% of NOx Emitted per % of Electricity Generateda |
% of Coal-Fired Electricity Capacity |
||||||||
|
Pre-1950 |
5.51 |
0.65 |
0.50 |
1.31 |
0.92 |
||||||||
|
1950-1959 |
5.07 |
15.11 |
12.56 |
1.20 |
14.32 |
||||||||
|
1960-1969 |
4.56 |
21.27 |
19.65 |
1.08 |
20.51 |
||||||||
|
1970-1979 |
4.28 |
39.31 |
38.76 |
1.01 |
38.13 |
||||||||
|
1980-1989 |
3.53 |
21.74 |
25.97 |
0.84 |
23.84 |
||||||||
|
Post-1990 |
3.15 |
1.92 |
2.56 |
0.75 |
2.27 |
||||||||
|
b. 2002 SO2 Emissions and Performance of Coal-Fired Capacity by Vintage |
|||||||||||||
|
Power Plant Established |
Avg. SO2 Emission Rate (lb/MWh) |
% of Total SO2 Emitted |
% of Coal-Fired Electricity Generation |
% of SO2 Emitted per % of Electricity Generateda |
Average Capacity Factor (%)b |
Average Heat Rate (Btu/kWh generated) |
|||||||
|
Pre-1950 |
20.58 |
1.02 |
0.50 |
2.04 |
36.35 |
12,549 |
|||||||
|
1950-1959 |
15.78 |
19.64 |
12.56 |
1.56 |
58.93 |
10,668 |
|||||||
|
1960-1969 |
13.92 |
27.12 |
19.65 |
1.38 |
64.37 |
10,150 |
|||||||
|
1970-1979 |
9.31 |
35.75 |
38.76 |
0.92 |
68.29 |
10,270 |
|||||||
|
1980-1989 |
6.02 |
15.49 |
25.97 |
0.60 |
73.17 |
10,401 |
|||||||
|
Post-1990 |
3.88 |
0.98 |
2.56 |
0.38 |
75.80 |
9,982 |
|||||||
|
c. 2002 NOx Emissions and Share of Generation of Coal-Fired Capacity by NSPSc |
|||||||||||||
|
NSPS Status According to EIA 767 |
Avg. NOx Emission Rate (lb/MWh) |
% Total NOx Emitted |
% of Coal-Fired Electricity Generation |
% of NOx Emitted per % of Electricity Generateda |
% of Coal-Fired Electricity Capacity |
||||||||
|
Unknown |
2.93 |
0.16 |
0.23 |
0.69 |
0.27 |
||||||||
|
Not Affected by NSPS |
4.67 |
65.90 |
59.51 |
1.11 |
62.62 |
||||||||
|
Subject to Aug. 1971 Standards (D) |
3.57 |
26.73 |
31.58 |
0.85 |
29.56 |
||||||||
|
Subject to Sept. 1978 Standards (Da) |
3.50 |
7.21 |
8.68 |
0.83 |
7.56 |
||||||||
|
d. 2002 SO2 Emissions and Performance of Coal-Fired Capacity by NSPSc |
||||||
|
|
Average SO2 Emission Rate (lb/MWh) |
% of Total SO2 Emitted |
% of Coal-Fired Electricity Generation |
% of SO2 Emitted per % of Electricity Generateda |
Average Capacity Factorb (%) |
Average Heat Rate (Btu/kWh Generated) |
|
**Unknown |
4.56 |
0.10 |
0.23 |
0.45 |
56.58 |
11,247 |
|
Not Covered by NSPS |
12.93 |
76.25 |
59.51 |
1.28 |
63.85 |
10,250 |
|
Subject to Aug. 1971 Standards (D) |
6.66 |
20.86 |
31.58 |
0.66 |
71.79 |
10,519 |
|
Subject to Sept. 1978 Standards (Da) |
3.23 |
2.78 |
8.68 |
0.32 |
77.17 |
10,185 |
|
NOTES: All quantities, including percentages of emissions and generation capacity, are calculated with reference only to coal-fired generating units. Percentages (taking account of rounding) add to 100% because other types of generating capacity are not considered. These tables and the associated dataset were constructed by David Evans of Resources for the Future. Data used to make these tables come from three sources: emission data are from EPA’s CEM system database; generation and capacity data are from EIA’s 767 dataset; and information on vintage of generating units is from EIA’s Form 860 dataset. aIf the generators of a particular vintage (or in a particular NSPS category) emitted a particular pollutant in proportion to its share of total electricity generation, the value would be 1. bCapacity factor of units that operated that are strictly associated with boilers in CEM system database. cThe Subpart D standards apply to fossil-fuel-fired steam boilers for which construction began after August 17, 1971. The Subpart Da standards affect those boilers that began construction after September 18, 1978. For boilers not covered by NSPSs construction began before August 17, 1971. A new NSPS for NOx was promulgated in 1998, but no new coal-fired generating facilities have been permitted since this new standard was issued. ABBREVIATIONS: SO2 = sulfur dioxide; NOx = oxides of nitrogen; lb/MWh = pound per megawatt-hour; Btu/kWh = British thermal unit per kilowatt-hour; CEM = continuous emission monitoring; NSPS, new source performance standards. SOURCE: EIA 2004a,b; EPA 2004a. As presented in NRC 2006a. |
||||||
TABLE 2-11 Distribution of Pounds of Criteria-Pollutant-Forming Emissions per Megawatt-Hour by Coal-Fired Power Plants, 2005
|
|
Mean |
Standard Deviation |
5th Percentile |
25th Percentile |
50th Percentile |
75th Percentile |
95th Percentile |
|
SO2 |
12 |
11 |
1.5 |
5.4 |
8.9 |
16 |
33 |
|
NOx |
4.1 |
2.3 |
1.3 |
2.6 |
3.7 |
4.9 |
9.0 |
|
PM2.5 |
0.59 |
0.58 |
0.092 |
0.20 |
0.35 |
0.81 |
1.8 |
|
PM10 |
0.72 |
0.67 |
0.12 |
0.28 |
0.48 |
0.94 |
2.1 |
|
ABBREVIATIONS: SO2 = sulfur dioxide = NOx, oxides of nitrogen; PM = particulate matter. |
|||||||
concentration-response function for premature mortality instead of Pope et al. (2002), our damages would have been approximately three times as large as what is reported above.
How do our estimates of damages compare with the literature? Levy et al. (2009) estimated the criteria-air-pollutant damages associated with individual coal-fired power plants using a methodology similar to what is used here; however, their estimates of damages are much higher, ranging from $0.02 to $1.57 per kWh, with a median estimate of 14 cents per kWh (1999 USD).30 Converting the results of Levy et al. to 2007 USD, their median estimate is almost 6 times as high as our median estimate of 2.9 cents per kWh (Table 2-9).31 It is, however, possible to reconcile the two sets of estimates. Two notable differences are that Levy et al.’s estimates are based on emissions data for 1999 rather than 2005 and their estimates depend on a concentration-response function for premature mortality based on Schwartz et al. (2008) rather than Pope et al. (2002).32 Emissions of NOx from coal-fired power plants were approximately 50% higher in 1999 than in 2005; emissions of SO2 were approximately one-third higher. The concentration-response function in Schwartz et al. (2008) yields about three times more deaths associated with a microgram of PM2.5 than those estimated using Pope et al. (2002)—the concentration-response function used in APEEP. These differences lead to much higher estimates of mortality associated with PM2.5, and over 90% of the damages associated with air emissions in our study come from PM2.5 mortality. Levy et al. (2009) also performed uncertainty propagation involving asymmetric triangular distributions, which would contribute modest upward bias to the median
damage estimates. In short, if Levy et al. (2009) had used the same mortality concentration-response function and the same emissions as APEEP, and had not done uncertainty propagation, the results would have been nearly identical to ours.
Estimates of the benefits of reducing SO2 and NOx emissions under the Clean Air Interstate Rule (CAIR) (EPA 2005b) are also higher than ours because of differences in air-quality modeling. The regulatory impacts analysis of CAIR examined the benefits of reducing emissions of SO2 and NOx at power plants in 28 states in the eastern United States. The analysis predicted that in 2015 a reduction in SO2 emissions of approximately 4 million tons and a reduction in NOx emissions of approximately 1.5 million tons would reduce premature mortality by 17,000 deaths. Our analysis, in contrast, estimates that in those states a reduction in SO2 and NOx that is approximately twice as large would result in 10,000 fewer deaths in 2005. This result is due to differences in air-quality modeling: The use of CMAQ in the CAIR regulatory impact analysis (EPA 2005b) leads to an estimate of 1.15 μg/m3 reduction in population-weighted PM2.5 exposure, a much larger effect than is predicted by APEEP.33 A study evaluating the performance of the version of CMAQ used in the CAIR study (version 4.3) found that it overestimated sulfate PM concentrations at sample locations in the eastern United States by 9% in one sample of largely rural sites (the Interagency Monitoring of Protected Visual Environments) and by 6% in another sample of largely urban sites (Speciated Trends Network) (EPA 2005c). This estimation bias was higher in the summer months, when sulfate concentrations are higher—14%. However, the estimation bias still does not fully account for the difference between the CMAQ and APEEP predictions.
Air-quality modeling results from APEEP agree well with other studies that use Gaussian plume models to model dispersion of pollutants from power plants (Nishioka et al. 2002; Levy et al. 2009), but concentrations of PM2.5 from power plants are lower in APEEP than in CMAQ (EPA 2005c; Fann et al. 2009).34 One of the advantages of APEEP is better spatial resolution in urban counties, but it may still lack the necessary level of spatial detail in urban areas, giving rise to some uncertainty about results.
In contrast to Levy et al. (2009), Muller et al. (2009) report estimates of criteria air-pollutant damages from coal-fired power plants that are slightly lower than those presented here (mean damages of approximately 2 cents
per kWh, on the basis of 2007 USD), using a value of a statistical life year (VSLY) approach.
Downstream CO2Emissions of Electricity Generation from Coal
The emissions of CO2 from coal-fired power are the largest single source of GHG emissions in the United States. The heat rate (energy of coal needed to generate 1 kWh of electricity) varies widely among coal-fired plants; thus the CO2 emissions vary (with an average of about 1 ton of CO2 per MWh of power generated [the 5th-95th percentile range is 0.95-1.5 tons]). The main factors affecting differences in the CO2 generated are the technology used to generate the power and the age of the plant. The effect of CO2 and other GHG emissions on global warming are discussed in Chapter 5.
Externalities Associated with Heavy-Metal Emissions of Electricity Generation from Coal
Heavy metals are toxic both to the environment and to public health. The combustion of coal to produce electricity results in emissions of heavy metals, depending on the source of the coal, the conditions of combustion, and the cleanup technologies used. Among the heavy metals found in coal-combustion wastes are antimony (Sb), arsenic (As), beryllium (Be), cadmium (Cd), chromium (Cr), cobalt (Co), copper (Cu), lead (Pb), manganese (Mn), mercury (Hg), molybdenum (Mo), nickel (Ni), selenium (Se), silver (Ag), thallium (Tl), vanadium (V), and zinc (Zn). To determine the risks for human health and for the environment associated with particular heavy metals, one must consider both the toxicity of the metal and the potential for exposure to the metal.
Information on the toxicity of individual metals and their various metallic species can be found in the Integrated Risk Information System (IRIS) database at the EPA Web site (epa.gov/IRIS). Highly toxic metals for humans and the environment include Hg, As, Cd, Pb, and Se. Major routes of exposure are through air emissions and through leaching of contaminants from landfills or surface impoundments of wastes.
Trace metals, including heavy metals, have been classified according to how they partition among waste streams from coal combustion (EPA 1995):
Class 1. Elements that are approximately equally concentrated in the fly ash and bottom ash or that show little or no small particle enrichment (that do not contain many small particles). Examples include manganese, beryllium, cobalt, and chromium.
Class 2. Elements that are enriched in fly ash relative to bottom ash, or show increasing enrichment with decreasing particle size. Examples include arsenic, cadmium, lead, and antimony.
Class 3. Elements emitted in the gas phase (primarily mercury and in some cases, selenium).
The main concern for human health is the risk associated with metals that end up in small, respirable particles or in the gas phase. Some of the most toxic heavy metals (arsenic, lead, cadmium) are enriched in the smaller particles. Particle control technologies will have limited impact on the emissions of mercury, which is emitted as a gas. Metals are deposited from the atmosphere and enter the food chain, where they can affect humans who eat contaminated organisms, mainly fish, as described in more detail below.
Mercury from coal-fired power plants has been the subject of regulatory attention for some time. In March 2005, the EPA issued the Clean Air Mercury Rule (CAMR) to establish emissions limits and a voluntary cap-and-trade system for mercury from electricity-generating units (EGUs). Concurrently, it “delisted” EGUs as a source of hazardous air pollutants that would be regulated according to the strict requirements of Section 112 of the Clean Air Act as amended. In February 2008, the D.C. Circuit Court vacated both CAMR and the delisting. In February 2009, the EPA withdrew its appeal of this vacatur; instead, it is developing standards for EGU emissions of hazardous air pollutants, including mercury, under Section 112. (A companion rule—CAIR, which was promulgated in May 2005—targets EGU emissions of SO2 and NOx that cross state boundaries. In December 2008, the D.C. Circuit Court decided to remand rather than vacate CAIR, leaving the rule in place while EPA addresses concerns raised in a July 2008 D.C. Circuit Court decision.) This and additional information are at EPA’s Web site (EPA 2009b).
EPA recently developed a draft, site-based, probabilistic (Monte Carlo) risk assessment of onsite coal combustion waste disposal practices at coal-fired power plants across the United States (RTI 2007). The risk assessment includes a screening step to determine if the toxicity of the contaminant and the known routes of exposure constitute a risk of excess lifetime cancer greater than 1 in 105 or a hazard quotient for noncancer end points greater than 1. These risk assessments include those for trace metals, including heavy metals, and should be published soon. The metals exceeding the human health risk criteria described above at the 90th percentile for cancer included arsenic and for noncancer end points included boron, molybdenum, selenium, and cadmium. For ecological receptors, exceedances were found for lead, boron, arsenic selenium, and cadmium at the 90th percentile. A limitation of the risk assessments is that while they take into
account exposure from leachates of landfills and impoundments, they do not appear to take into account emissions into the air nor do they consider speciation of metals.
Unlike most of the other heavy metals, the dominant human exposure pathway for mercury is dietary. Mercury is emitted atmospherically from burning coal in elemental, particle-bound, and reactive forms that are deposited locally, regionally, and globally. After deposition, Hg enters water bodies where it is converted to methylmercury by microbes in the water column and sediment. Methylmercury bioaccumulates in aquatic species, reaching its highest concentration in high trophic-level fish such as shark, swordfish, and tuna; it also is found in many freshwater species. Consumption of fish is the major source of human exposure. Prenatal exposure to methylmercury is associated with subtle cognitive deficits and adult exposure may increase risk of fatal heart attack (Salonen et al. 1995; NRC 2000). Because of the complex pathway that mercury follows from its emission by power plants to its ingestion by people, affected by meteorological, chemical, physical, biological, and behavioral factors, it is difficult to estimate ecological and human health effects, which include impairment of cognitive function due to mercury exposure. Estimating monetary damages is even more difficult because of the lack of information on willingness to pay for reducing the risk of subtle cognitive effects from mercury exposure.
Coal Combustion By-Products
By-products of burning coal to generate electricity include fly ash, bottom ash, flue gas desulfurization (FGD) materials, and fluidized bed combustion (FBC) residues (OSMRE 2009). In 2007, approximately 131 million tons of coal combustion by-products (CCBs) were produced in the United States (ACAA 2008a).35 Of this total, about 56 million tons were reused. CCBs and their reuse by type of CCB in 2007 are summarized in Table 2-12. As shown in Figure 2-9 the tonnage of CCBs produced annually has increased more than fourfold since 1966. Reuse of CCBs also has increased but has not kept pace.
CCBs can contain traces of naturally occurring radioactive materials (regarding NORMs, see USGS 1997), as well as mercury, arsenic, lead, and other toxic materials. While CCBs have not been made subject to hazardous waste regulations under Subtitle C of the Resource Conservation and Recovery Act (RCRA), a 2006 NRC report noted that “CCRs [coal combustion residues] often contain a mixture of metals and other constituents
|
35 |
The osmre.gov Web site distinguishes between CCBs and CCPs (coal-combustion products). The latter are “beneficially used” and are thus a subset of CCBs; however, this nomenclature has not been universally adopted. The more generic term “CCB” is used in this text. |
TABLE 2-12 2007 Coal Combustion Product (CCP) Production and Use Survey Results
|
CCP Categories |
Fly Ash |
Bottom Ash |
Bolier Stag |
FGD Gypsum |
FGD Material Web Scrubbers |
|
Total CCPs produced by category |
71,700,000 |
18,100,000 |
2,072,695 |
12,300,000 |
16,600,000 |
|
Total CCPs used by category |
31,626,037 |
7,303,538 |
1,663,980 |
9,228,271 |
810,080 |
|
Concrete/concrete products/grout |
13,704,744 |
665,756 |
0 |
118,406 |
0 |
|
Blended cement/raw feed for clinker |
3,635,881 |
608,533 |
6,888 |
656,885 |
0 |
|
Flowable fill |
112,244 |
0 |
0 |
0 |
0 |
|
Structural fills/embankments |
7,724,741 |
2,570,163 |
158,767 |
0 |
97,610 |
|
Road base/sub-base |
377,411 |
802,067 |
20 |
0 |
0 |
|
Soil modification/stabilization |
856,673 |
314,362 |
169 |
0 |
0 |
|
Mineral filler in asphalt |
17,223 |
21,771 |
63,729 |
0 |
0 |
|
Snow and ice control |
0 |
736,979 |
44,367 |
0 |
0 |
|
Blasting grit/roofing granules |
0 |
71,903 |
1,377,658 |
0 |
0 |
|
Mining applications |
1,306,044 |
165,183 |
0 |
0 |
299,793 |
|
Gypsum panel products |
0 |
0 |
0 |
8,254,849 |
0 |
|
Waste stabilization/solidification |
2,680,328 |
7,056 |
0 |
0 |
10,378 |
|
Agriculture |
49,662 |
2,546 |
0 |
115,304 |
9,236 |
|
Aggregate |
135,331 |
806,645 |
450 |
70,947 |
0 |
|
Miscellaneous/other |
1,025,724 |
530,574 |
11,932 |
11,880 |
393,063 |
|
Totals by CCP type/application |
31,626,037 |
7,303,538 |
1,663,980 |
9,228,271 |
810,080 |
|
Category use to production rate (%) |
44.11% |
40.35% |
80.28% |
75.03% |
4.88% |
|
Supplemental: Cenospheres sold (pounds) |
12,659,597 |
|
|
|
|
|
SOURCE: ACAA 2008a. Reprinted with permission; copyright 2008, American Coal Ash Association. |
|||||
|
FGD Material Dry Scrubbers |
FGD Other |
FBC Ash (not including ARIPPA FBC Ash data) |
CCP Production/Utilization Totals |
FBC Ash combined with ARIPPA FBC Ash production |
CCP Production/Utilization Totals (including ARIPPA FBC Ash data) |
|
1,812,511 |
2,449,731 |
1,273,061 |
126,307,998 |
6,092,756 |
131,127,693 |
|
150,365 |
113,298 |
323,741 |
51,219,310 |
5,143,436 |
56,039,005 |
|
21,266 |
0 |
5,518 |
14,515,690 |
5,518 |
14,515,690 |
|
0 |
81,801 |
0 |
4,989,988 |
0 |
4,989,988 |
|
12,417 |
2,735 |
0 |
127,406 |
0 |
127,406 |
|
555 |
0 |
46,282 |
10,598,118 |
46,282 |
10,598,118 |
|
0 |
0 |
0 |
1,179,509 |
0 |
1,179,509 |
|
154 |
429 |
199,441 |
1,371,228 |
199,441 |
1,371,228 |
|
0 |
0 |
0 |
102,723 |
0 |
102,723 |
|
0 |
0 |
0 |
781,346 |
0 |
781,346 |
|
0 |
0 |
0 |
1,449,561 |
0 |
1,449,561 |
|
111,195 |
0 |
0 |
1,882,215 |
4,819,695 |
6,701,910 |
|
0 |
0 |
0 |
8,254,849 |
0 |
8,254,849 |
|
1,416 |
28,333 |
72,500 |
2,800,031 |
72,500 |
2,800,031 |
|
3,352 |
0 |
0 |
180,100 |
0 |
180,100 |
|
0 |
0 |
0 |
1,013,373 |
0 |
1,013,373 |
|
0 |
0 |
0 |
1,973,173 |
0 |
1,973,173 |
|
150,365 |
113,298 |
323,741 |
51,219,310 |
5,143,436 |
56,039,005 |
|
8.30% |
4.62% |
25.43% |
40.55% |
84.42% |
42.74% |
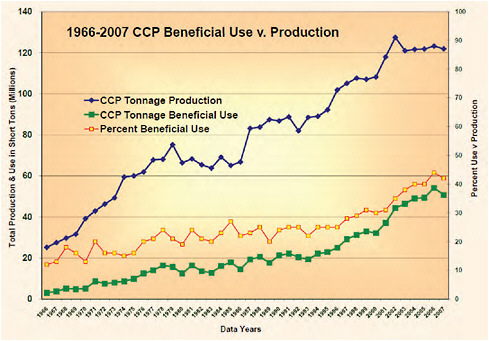
FIGURE 2-9 Coal combustion product beneficial use versus production. SOURCE: ACAA 2008b. Reprinted with permission; copyright 2008, American Coal Ash Association.
in sufficient quantities that they may pose public health and environmental concerns, if improperly managed…. Risks to human health and ecosystems may occur when CCR-derived contaminants enter drinking water supplies, surface water bodies, or biota” (NRC 2006b, p. 3). In addition, while inhalation of dust from CCBs is primarily a worker safety issue, precautions are needed to protect the public from CCB dust if it becomes airborne (EPA 2009c).
Under RCRA, states may regulate CCBs as a solid waste, a special waste, or, on a case-by-case basis, as a hazardous waste; they may do so by statute, generic or specific regulations, policy, or guidance (Archer 2000). States vary widely in the extent to which they regulate CCBs. Unlike disposal of other solid wastes such as household wastes, no uniform practices have been required by federal regulation (Buckley and Pflughoeft-Hassett 2007).
If only because of the quantities of fly ash produced annually (71 million tons in 2007, of which 31 million tons were directed to reuse), fly ash storage and disposal are of particular concern. With the spill in December
2008 of more than 1 billion gallons of fly ash sludge from a retention pond at the Tennessee Valley Authority’s coal-fired plant in Kingston, Tennessee, fly ash became a matter of national attention. Fly ash usually is stored in ponds or landfills on or near to their power plant sites, which typically are located on waterways because of the plant’s need to use and release water. Storing fly ash dry in landfills is considered safer, but even then, fly ash landfills often do not have the liners, leachate collection systems, and caps required under RCRA Subtitle D regulations for municipal solid waste landfills (EPA 2008a).
EPA has identified 431 slurried CCB impoundments through a national survey. Of the impoundments identified, 49 have been given a “high-hazard” rating by EPA (2009d).
Externalities from Coal in 2030
Technology in 2030
It is impossible to consider the future of coal-fired generation without considering the prospect of carbon capture and storage (CCS). CCS is a technology where the CO2 emissions are first separated from the stack emissions, then collected and typically sent for offsite storage via small pipelines. Most current discussions about this nascent technology relates to where the carbon would be stored, with the most prominent discussions suggesting storage in underground geological sites such as aquifers or depleted gas fields, as well as in oil fields via enhanced oil recovery (EOR). CO2 could also be liquefied, with potential storage in oceans. While beyond the scope of this chapter, there are significant risks due to accidental release of sequestered carbon.
The most common coal-fired technology being discussed for the future is IGCC (integrated gasification combined cycle), in which coal is first gasified before being used to generate electricity. IGCC plants are not only the most obvious next step in coal technology, but are more compatible with carbon capture systems. CCS is expected to be able to divert 80-90% of the CO2 generated at these power plants. However, an IGCC/CCS system has an energy penalty in that more energy is needed to run the system, and thus more coal is required per kWh of electricity generated.
The current dominant technology, pulverized coal (PC), is compatible with CCS, but is generally more costly. As PC will remain the dominant technology in the “fleet” of power plants for several decades, and PC plants are being used decades past their original design lifetimes, the need for considering CCS for PC plants is inevitable. It is likely that PC technology will also have CCS and, depending on incentives and motivations, could be the dominant source of sequestered carbon. In general, IPCC estimates the
cost per kWh of electricity from IGCC to be less than PC, including CCS systems (Table 2-13 [IPCC 2005, Table 8.3a]).
There are few IGCC projects in the world as of 2009, and relatively few CCS demonstration projects, especially for geological sequestration other than EOR. If IGCC and CCS technology is to be incorporated into the electricity sector, then ramp-up of siting, design, and construction of these plants needs to begin immediately for it to have any significant impact on air emissions within 20 years.
A relevant scenario is that in a future with 80-90% capture of CO2 from coal-fired power, the upstream air emissions from mining and transportation will become much more significant, and possibly the largest
TABLE 2-13 IPCC Range of Aggregate Costs for CO2 Capture, Transport, and Geological Storage
|
|
Pulverized Coal Power Plant |
Natural Gas Combined Cycle Power Plant |
Integrated Coal Gasification Combined Cycle Power Plant |
|
Cost of electricity without CCS [carbon capture and storage] (US$ MWh–1) |
43-52 |
31-50 |
41-61 |
|
Power plant with capture |
|||
|
Increased fuel requirement (%) |
24-40 |
11-22 |
14-25 |
|
CO2 captured (kg MWh−1) |
820-970 |
360-410 |
670-940 |
|
CO2 avoided (kg MWh−1) |
620-700 |
300-320 |
590-730 |
|
% CO2 avoided |
81-88 |
83-88 |
81-91 |
|
Power plant with capture and geologic storagea |
|||
|
Cost of electricity (US$ MWh−1) |
63-99 |
43-77 |
55-91 |
|
Electricity cost increase (US$ MWh−1) |
19-47 |
12-29 |
10-32 |
|
% increase |
43-91 |
37-85 |
21-78 |
|
Mitigation cost (US$/tCO2 avoided) |
30-71 |
38-91 |
14-53 |
|
Mitigation cost (US$/tC avoided) |
110-260 |
140-330 |
51-200 |
|
Power plant with capture and enhanced oil recoveryb |
|||
|
Cost of electricity (US$ MWh−1) |
49-81 |
37-70 |
40-75 |
|
Electricity cost increase (US$ MWh−1) |
5-29 |
6-22 |
(–5)-19 |
|
% increase |
12-57 |
19-63 |
(–10)-46 |
|
Mitigation cost (US$/tCO2 avoided) |
9-44 |
19-68 |
(–7)-31 |
|
Mitigation cost (US$/tC avoided) |
31-160 |
71-250 |
(–25)-120 |
|
aTransport costs range from 0-5 US$/tCO2. Geological storage cost (including monitoring) range from 0.6-8.3 (US$/tCO2). bTransport costs range from 0-5 US$/tCO2 stored. Costs for geological storage including EOR range from −10 to −16 US$/tCO2 stored. SOURCE: IPCC 2005, Table 8.3a, p 347. http://www.ipcc.ch/pdf/special-reports/srccs/srccs_chapter8.pdf. Reprinted with permission; copyright 2005, Intergovernmental Panel on Climate Change. |
|||
single source of emissions in the coal power life cycle. Further, if the EIA’s long-term scenarios related to electricity mix hold true (that is, still 50% coal in 2030) [EIA 2009e], then significantly more coal will be mined, and these upstream externalities, while still relatively small on a per-kWh basis, will probably grow in magnitude in the local areas where coal is mined and where unit trains of coal deliveries pass through.
Air-Pollution Damages from Coal-Fired Power Plants in 2030
The air-pollution damages associated with electricity generation from coal in 2030 depend on many factors. Aggregate damages depend on the growth in electricity demand and the extent to which coal is used to satisfy this demand, as opposed to other fuels. Damages per kWh are a function of the emissions intensity of electricity generation from coal (for example, pounds of SO2 per MWh), which depends on future regulations governing power plant emissions. The damages per ton of SO2 and NOx depend on the location of coal-fired power plants and on the size of the populations affected by them.
To give a sense of how damages in 2030 might compare with estimates for the year 2005, we use EIA forecasts of electricity production from coal and of SO2 and NOx emissions, together with estimates of damages per ton of pollutant emitted in 2030 from APEEP. The assumptions underlying our analysis are outlined below. Because of the greater uncertainties associated with the 2030 analysis, we focus on estimates of aggregate damages from coal-fired power generation, rather than presenting a detailed distribution of damages, as in the section above.
Methodology The 2030 thermal power-plant analysis relied on EIA’s Annual Energy Outlook 2009 projections (EIA 2009f, Table 72-100) for the growth of net generation and emissions of SO2 and NOx. On average, net generation from coal-fired power plants is estimated to be 20% higher in 2030 than in 2005. Estimates are available by type of generator, fuel type, and North American Electric Reliability Corporation (NERC) region generation. EIA does not project changes in PM2.5 and PM10 emissions. These were imputed as the average of the projected changes in these two species. These regional trends were used to construct multipliers for 2005 net generation by plant and emissions by stack. We applied each regional multiplier to all the plants with a given fuel in that region of the country. We assumed that coal plants in 2030 will be sited in the same locations as current plants.
Our 2030 results therefore embody all the regulatory and technological assumptions made by EIA. We deliberately took this analytical tack because our charge precluded us from considering policies to remedy externalities.
Thus, we did not attempt to substitute our own judgments about future regulatory developments in place of EIA’s projections, which are widely used and generally regarded as authoritative.
We used EIA estimates of SO2 and NOx from electricity generation in 2030, together with estimates of electricity generation by fuel type and emission intensities by fuel type in 2005 to estimate the percentage reduction in tons of SO2 and NOx per MWh at coal plants. On average, pounds of SO2 per MWh are assumed to decrease from 10.1 lb (weighted by electricity generation) in 2005 to 3.65 lb in 2030. The corresponding figures for NOx are 3.42 lb/MWh in 2005 (weighted by electricity generation) and 1.90 lb in 2030.36 Estimates of 2030 emissions intensities together with forecasts of net generation produce estimates of emissions of SO2, NOx, PM2.5, and PM10 at the location of each plant in 2030.
APEEP was used to generate estimates of damages per ton of pollutant by county and effective stack height, in 2030. These estimates assume that the meteorological conditions and other assumptions used in modeling the impact of a change in emissions on ambient air quality are the same in 2030 as in 2005, and that emissions are emitted at the same effective stack heights at each plant as in 2005. The same concentration-response functions used in the 2005 analysis are used to translate changes in ambient concentrations into cases of premature mortality and morbidity in 2030; however, the U.S. population will have changed, according to forecasts from the U.S. Census Bureau. An increase in population size was reflected in the 2030 analysis, but the age structure of the population was not changed. The VSL is assumed to increase with income growth. Using an elasticity of the VSL with respect to income of 0.50 (Viscusi and Aldy 2003) and assumptions in EPA’s national Energy Modeling System (NEMS) about growth in per capita income, the VSL is 27% higher in 2030 (in 2000 USD) than in 2005, as are the unit values applied to other health end points. The combined effect of increases in population and increases in the VSL and other health values is to increase damages per ton of pollution, on average, by over 50% compared with 2005 values. The percentage change, however, varies considerably by pollutant and county. In the counties in which coal plants are currently located—where we assume they will be located in 2030—the mean increase in damage per ton of pollutant emitted is 36% for SO2 and 32% for NOx.
Results Damages from NOx, SO2, PM10, and PM2.5 were calculated, as described above, for each of 406 plants that generated electricity from coal
in 2005. In spite of the fact that net generation is 20% higher in 2030 than in 2005, monetized air-pollution damages (in 2007 USD) are approximately $38 billion—about 40% lower than in 2005. Damages per kWh (weighted by electricity generation) are 1.7 cents per kWh, compared with 3.2 cents per kWh in 2005. The fall in damages per kWh is explained by the assumption that pounds of SO2 per MWh will fall by 64% and that NOx and PM emissions per MWh will fall by approximately 50%. This counteracts the increase in damages per ton.
For future technologies at coal-fired plants, such as IGCC with CCS, criteria-pollutant-forming emissions per kWh are expected to be significantly lower than emissions per kWh from a typical plant in 2030 (NETL 2007). Plants using future technologies would also be expected to have damages at the lower end of current distributions. On the other hand, damages that would be attributable to providing the expected infrastructure (for example, pipelines and geological sites) for long-term geological sequestration of CO2 are much more uncertain.
ELECTRICITY PRODUCTION FROM NATURAL GAS
History and Current Status of Natural Gas Production
Natural gas, a non-renewable energy source that consists primarily of methane, is consumed in the United States for heat, fuel, and electricity. During the mid 20th century, natural gas was predominantly used for residential and commercial space heating, as well as for industrial process heating. Since then, natural gas has taken an increasing share in production of electricity. In 2008, approximately 30% of produced natural gas was used to produce electricity.
U.S. natural gas production matched domestic consumption until the early 1970s. Natural gas productivity (volume of natural gas extracted per well) peaked in 1971 with 119,251 wells producing on average 435,000 cubic feet per day (Figure 2-10). Total annual domestic production reached 22.6 trillion cubic feet in 1973, after which it began to decline (Figure 2-11). By 2007, the United States had 452,768 producing gas wells, nearly four times as many as in 1971, indicating that the mean productivity per well had declined substantially. However, preliminary data from EIA suggest that gross withdrawals in 2008 of natural gas were the highest recorded, exceeding 26 trillion cubic feet; marketed production was 21.4 trillion cubic feet. Currently, more than 75% of domestic NG production comes from Texas, Wyoming, Oklahoma, New Mexico, Louisiana, and the federal offshore Gulf of Mexico.
The United States has increased its reliance on natural gas imports to keep pace with consumption, which was 23.0 trillion cubic feet in 2007
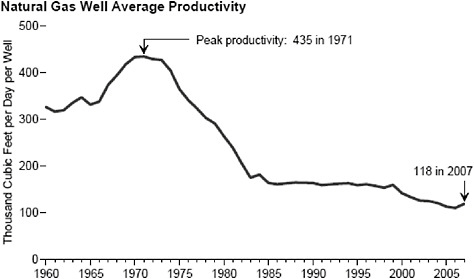
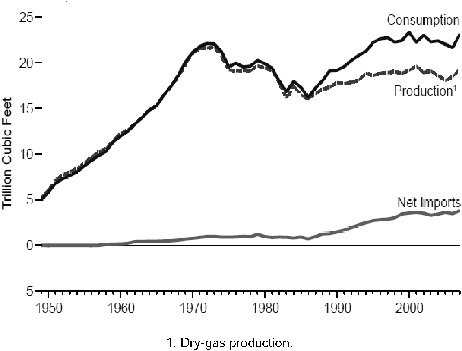
and 23.2 trillion cubic feet in 2008. Imports have increased since 1970. In the past few years (2003-2008), gross imports have averaged around 4 trillion cubic feet annually. Exports have increased from about 0.7 trillion cubic feet in 2003 to just over 1 trillion cubic feet in 2008. More than 90% of imported NG is transported by pipeline from Canada and Mexico. The United States also imports liquid natural gas (LNG) by ocean tankers from Trinidad, Egypt, Norway, Nigeria, and Qatar.
Natural gas is gathered and transmitted from producing fields and storage sites by pipeline. The United States has more than 300,000 miles of inter- and intrastate NG transmission pipelines. Domestic and imported NG is stored underground in natural geologic spaces. The United States had 400 storage sites (depleted fields, aquifers, and salt caverns) with greater than 8,400,000 million cubic feet of storage in 2007.
Upstream Externalities of Electricity Production from Natural Gas
Natural Gas Exploration and Drilling
Exploration and Development Exploratory activities to locate natural gas reservoirs are similar to those for oil. Exploratory drilling for natural gas uses the same rotary equipment and methods for development and production drilling, and it produces wastes mostly in the form of pollutants in water, primarily from the use of drilling fluids. Drilling also produces drill cuttings and mud. Exploration and development of natural gas occurs on-shore and offshore, with potentially different types and levels of pollution. Initial exploration often uses seismic operations—the use of artificial shock waves directed into the earth to assess geologic strata based on reflection of the energy—both onshore and offshore. On land, transportation of the equipment can damage terrestrial ecosystems, especially in roadless areas (NRC 2003a). Offshore seismic exploration can adversely affect fish and marine mammals, especially if explosives are used (NRC 2003a).
For onshore drilling, significant proven reserves in the United States are along the Gulf Coast and in the Rocky Mountain region. Although rotary drilling is generally for exploration and development, cable-tool drilling can be utilized for shallow, low-pressure gas reservoirs. The amount of land required for a typical gas field of approximately 120 wells ranges from 420 to 640 acres depending on the size of the natural gas reservoir (on average 3.5 to 5.33 acres per gas well). This is a smaller area than is required for oil wells, which require approximately 40 acres per well. The primary waste products from gas well exploration and development are oils, heavy metals, and dissolved solids contained in the drilling mud or produced water. Specifically, the waste products are oil and grease, suspended solids, phenol, arsenic, chromium, cadmium, lead, and barium. These drilling wastes do not change significantly from region to region.
Drilling operations potentially create significant amounts of air pollution. Large diesel engines typically power the drilling equipment and emit significant quantities of PM, sulfur oxides, and oxides of nitrogen. These emissions can be substantial during drilling of deep wells requiring large power outputs or in large fields where multiple drilling operations occur simultaneously. Other sources of air pollution include organic compounds that may volatilize from reserve and other holding pits used as waste repositories during drilling operations, although the volume of these compounds is insignificant compared with diesel engine emissions. Oil and gas wells abandoned at the end of their productive life may cause environmental damage to the surrounding land surfaces and underground freshwater aquifers.
A considerable amount of natural gas exploration and development is located offshore on platforms, primarily in the Gulf of Mexico. For offshore drilling operations, drilling rigs may either be stationary or mobile. For drilling in waters up to 300 feet deep and marsh areas, mobile drilling rigs are mounted on barges and rest on the bottom. In water deeper than 300 feet, drilling rigs are mounted on floating or semi-submersible vessels with special equipped hulls that support the drill rig above the water level. To transport drill rigs to marsh areas, canals are dredged to the drill sites to float the rigs into place.
The wastewater from offshore platforms includes production wastes, deck drainage, and sanitary and domestic wastes. It can contain oils, toxic metals, and organic chemicals. Significant pollutants in produced waters include oil and grease, arsenic, cadmium, copper, cyanide, lead, mercury, nickel, silver, zinc, and organic carbon. Spilled oil and grease can adhere to fish and destroy algae and plankton, thereby altering the aquatic food chain. Additionally, damage is likely to occur to the plumage and coats of water animals and fowl. Lead, zinc, and nickel are toxic to fish even in low concentrations. However, offshore drilling rigs attract fish and can reduce fuel costs for recreational fishermen—an economic benefit.
Extraction Natural gas is extracted by using either the existing pressure of the gas reservoir or by using pumps. Gas wells produce not only dry gas but also can produce varying quantities of light hydrocarbon liquid condensates and salt water. The resulting produced water (also known as “formation water” or “brine water”) includes all waters and particulate matter associated with the gas producing formation. Produced water is the primary waste from offshore platforms. It can contain oils, toxic metals, salts, and organic compounds, which can cause environmental damage. For both onshore and offshore extraction, the type of technology used to treat produced water depends on state or local regulations as well as
cost-effectiveness. Additionally, air emissions can include hydrogen sulfide that can be as high as 6% by volume in sour gas (that is, natural gas that contains hydrogen sulfide).
Natural gas is also produced using enhanced gas recovery extraction (EGR) methods. The primary technologies used for EGR are fracturing and directional drilling. Fracturing involves the use of either chemical explosives or water under pressure. Adverse impacts from the use of advanced hydraulic fracturing include air emissions and noise from the pressurized injection process. Preparing the well casing can cause leaks to groundwater or the surface. Water forced into gas-bearing shale can cause contamination or disruption of nearby wells. The use of chemical explosive fracturing has environmental impacts that are similar to those of advanced hydraulic fracturing. When the wells are constructed, noise, air emissions, soil erosion, and aesthetic deterioration may occur. There is also the danger of gas leaks or explosions from pipelines or storage tanks.
Directional or slant drilling (drilling that is not vertical) for recovery of natural gas can result in air emissions and soil erosion during the preparation of the drilling site. Drilling and production activities result in noise and risk of explosions. EGR processes have a considerably greater potential for causing air-quality degradation than do conventional recovery technologies. In both conventional and EGR processes, air-quality impacts result from emissions associated with production and injection pumps and fugitive emissions from wellheads and handling and storage facilities. Additionally, EGR technologies produce emissions from the combustion engines of compressors and from steam boilers in steam flood operations.
Other Impacts The “footprint” for locations for natural gas exploration, development, and extraction is smaller than that for similar oil wells. While the impacts may not be as great for natural gas field operations, there are a number of additional impacts for both land and offshore activities that should be mentioned, in addition to those described above, that can have significant, although difficult to quantify, impacts.
For land-based operations, seismic measurements are a problem due to noise, aesthetics, and land use impacts, although most of these are temporary (for example, NRC 2003a). For the longer term, there are potential impacts related to habitat destruction. Wastewaters from all aspects of operation must be treated or they can cause significant degradation to the surface waters.
Offshore operations have different impacts in some cases. First, there is the overall impact of land degradation along the Gulf Coast. For both land-based, but nearshore operations, and for offshore operations, there is significant deterioration of onshore land, leading to salt water encroach-
ment, land subsidence, and loss of land to the sea. The offshore operations can also have an impact on the surrounding ecosystem. Despite previous comments on benefits to recreational fishermen, natural gas platforms can have deleterious effects on larger ecosystems and can impact commercial fishing operations.
In a life-cycle analysis performed by Dones et al. (2005), it is estimated that approximately 25% of CO2 emissions come from the processes discussed above, as treated as total production emissions (exploration, field production, purification). Other values include 10% of the methane, 50% of the nonmethane volatile organic hydrocarbons, 40% of the particulate matter, 20% of the nitrogen oxides, and 80% of sulfur dioxide emissions for the total fuel cycle.
Occupational Injuries Associated with Oil and Gas Extraction and Transport
Fatal and Nonfatal Injuries in Oil and Natural Gas Extraction37 As in the case of mining, we assume that fatal and nonfatal occupational injuries do not constitute externalities, but we briefly discuss them because of their societal importance. In 2007, oil and gas industry fatalities accounted for almost two-thirds of fatal work injuries in mining. Unlike in coal mining, the number of fatalities in oil and gas extraction has been increasing, reaching in 2006 levels seen only decades ago (Figure 2-12). The incidence of fatalities, approximately 3 per 10,000 workers, is also higher than in coal mining (2 per 10,000 workers). The number of reported injuries has also increased (Figure 2-13).
Fatal and Nonfatal Injuries in Transportation of Natural Gas In 2003, U.S. pipelines moved 590 billion total ton-miles of crude oil and petroleum products, and 278 billion ton-miles of natural gas (Dennis 2005). This includes gathering pipelines, which carry products from production fields; transmission pipelines, which transport products to terminals and refineries; and distribution pipelines, which carry products to final market and consumption points. Electric power plants receive 98% of their natural gas from direct mainline pipeline deliveries; 2% is provided by local distribution companies. In 2007, natural gas transport incurred 2 fatalities and 7 injuries. Natural gas distribution caused 8 fatalities and 35 injuries. Although the number of fatalities from natural gas pipeline activity has fluctuated, averaging 12 annually from 2000 to 2007, related injuries have
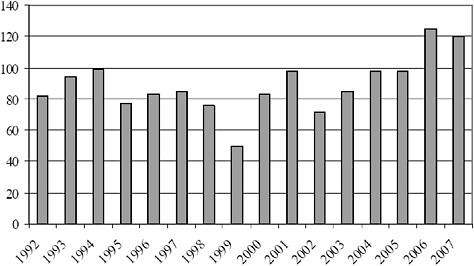
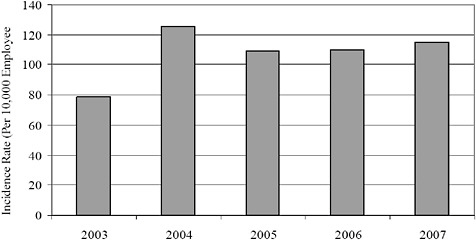
steadily decreased over time (BTS 2009, Table 2-46). The majority of fatal and nonfatal injuries during natural gas transport are occupational and therefore are not treated as externalities.
Upstream GHG Emissions and Other Pollutants
The upstream life cycle of power generation from natural gas includes many relevant activities such as construction of the infrastructure and power plants, but the most significant from a perspective related to GHG emissions and criteria-pollutant-forming emissions are the extraction and transportation of gas. These activities are generally fuel- and energy-intensive, requiring combustion of fossil fuels for drilling and removing the gas from underground and delivering to the power plant. Beyond emissions from engines, there are also significant GHG emissions of methane, which is from fugitive emissions of natural gas.
Of increasing relevance is the use of liquefied natural gas (LNG) to generate power. Over the past decade, a global market has begun for the extraction of gas for export via liquefying it, shipping it by tanker (similar to petroleum), and regasification. Each of these stages increases the energy use and air emissions (related to criteria pollutants and GHG) associated with the life cycle of the power generated.
Transportation of natural gas in the United States occurs via pipelines. While pipelines are a very cost- and energy-efficient transportation mode, they use significant amounts of fuels and electricity to move the gas from well to power plant. In addition, pipelines leak natural gas as methane into the air. As noted above, the transportation of LNG involves ocean tankers.
The prior studies mentioned above for coal also assessed the relative contribution of the upstream life cycle of gas-fired power generation for domestically sourced NG (Jaramillo et al. 2007, Meier et al. 2005, Spath and Mann 2000, ORNL/RFF 1992-1998). As was the case for coal, these studies found that upstream activities lead to relatively small life-cycle effects because of the dominance of criteria-pollutant-forming emissions and GHG emissions from gas-fired power plants (although the percentage share of upstream emissions in the life cycle are higher). For example, Jaramillo et al. (2007) reports that the mid-point GHG emission factors for domestic natural gas combustion (at the power plant) and the entire natural gas life cycle are 1,100 lb CO2-eq/MWh and 1,250 lb CO2-eq/MWh, respectively. Thus in this study we have focused on quantifying the air emissions associated with the burning of gas at power plants. This assumption would need to be revisited in a future scenario that had order-of-magnitude increases in the amount of LNG consumed for power generation (and its higher per unit emissions), but it is not considered in this study.
Downstream Externalities of Electricity Production from Natural Gas
Analysis of Current Air-Pollution Damages from Gas-Fired Power Plants
The air-pollution emissions from gas-fueled power plants constitute a significant portion of the downstream damages associated with electricity generation. In this section, we quantify the impacts of criteria-pollutant-forming emissions from gas-fired power plants on human health, visibility, agriculture, and other sectors, using the methods outlined in the section on coal. The effects of emissions on ambient air quality are calculated for each of 498 facilities that used gas to generate electricity in 2005. These facilities, which include electric utilities, independent power producers and combined heat and power facilities, each generated at least 80% of their electricity from gas and had installed capacity of at least 5 MW. Together they accounted for 71% of electricity generation from natural gas in 2005.38
Damages related to emissions of NOx, SO2, PM10, and PM2.5 were calculated for each of the 498 plants described above. Table 2-14 presents the distribution of monetized damages across the 498 natural-gas-fired power plants. (All plants are weighted equally in the table; hence the mean figures are arithmetic means of damages across all plants.) Most damages are related to directly emitted PM2.5 (56%), followed by NOx (37%), SO2 (4%), and PM10 (3%), unlike coal plants where most damages (85%) are related to SO2 emissions. Damages, however, are much lower than for coal plants. Average annual damages per plant are $1.49 million, which reflects both lower damages per kWh at natural-gas-fired power plants, but also smaller plants: Net generation at the median coal plant is more that 6 times as large as at the median gas facility.39
Some of the variation in damages across plants reflects differences in net generation; hence, we also report damages per kWh of electricity produced.40 Table 2-15 presents the distribution of air-pollution damages per kWh. (All plants are weighted equally in the first five rows of the table; in the last row, plants are weighted by the fraction of electricity they produce.) Mean damages per kWh from the criteria-pollutant-forming emissions are 0.43 cents per kWh if all plants are weighted equally and 0.16 cents per kWh if plants are weighted by the fraction of electricity they generate. Dam-
TABLE 2-14 Distribution of Criteria-Pollutant Damages Associated with Emissions from 498 Gas-Fired Power Plants in 2005 (2007 U.S. Dollars)
TABLE 2-15 Distribution of Criteria-Pollutant Damages per Kilowatt-Hour Associated with Emissions from 498 Gas-Fired Power Plants in 2005 (Cents based on 2007 U.S. Dollars)
ages per kWh are, on average, an order of magnitude lower—0.16 cents per kWh for natural gas compared with 3.2 cents per kWh for coal.41 The lower figure reflects the fact that larger plants are often cleaner.42 It should,
however, be emphasized that the distribution of damages per kWh has a high variance and is very skewed: Although, on average, damages from natural-gas-fired plants are an order of magnitude lower than damages from coal-fired power plants, there are some gas facilities with damages per kWh as large as coal plants.
As Figure 2-14 shows, the distribution of damages across plants is highly skewed. After sorting the plants according to damages, we found that the 10% of plants with highest damages produce 65% of the air-pollution damages from all 498 plants, and the lowest emitting 50% of plants within the lowest damages account for only 4% of aggregate damages. Each group of plants accounts for approximately one-quarter of sample electricity generation. The map in Figure 2-15 shows that the natural gas plants that produce the largest damages are located in the Northeast (along the Eastern seaboard), Texas, California, and Florida.
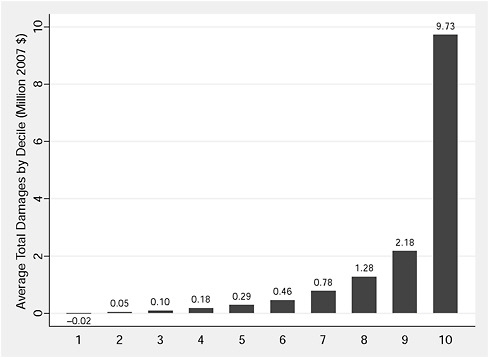
FIGURE 2-14 Distribution of aggregate damages in 2005 by decile: Natural-gasfired plants. NOTE: In computing this graph plants were sorted from smallest to largest based on aggregate damages. The lowest decile represents the 50 plants with the smallest aggregate damages. The figure on the top of each bar is the average across all plants of damages associated with SO2, NOx, PM2.5, and PM10. Damages related to climate change are not included.
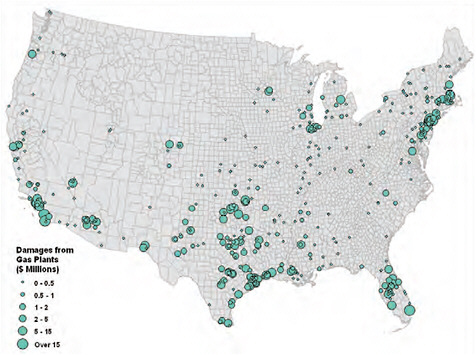
FIGURE 2-15 Criteria-air-pollutant damages from gas generation for 498 plants, 2005 (U.S. dollars, 2007). Damages related to climate change are not included.
Table 2-16 shows amounts of pollutants emitted and Figures 2-16 and 2-17 show damages per kWh. Figure 2-17, which maps damages per kWh for the natural-gas-fired power plants in our sample, shows where these facilities are located. As in the case of coal-fired power plants, variation in damages per kWh across natural gas plants is explained both by variation in emissions of pollution per kWh and also by variation in damages per ton pollutant. In the case of PM2.5, variation in pollution intensity and variation in damages per ton of PM2.5 explain equal amounts of the variation in PM2.5 damages per kWh.43 In contrast to coal plants, natural gas plants are located in areas of high marginal damages per ton of PM2.5 (Table 2-17). However, variation in damages per ton of NOx accounts for only 5% of the variation in NOx damages per kWh, while variation in pounds of NOx
TABLE 2-16 Distribution of Pounds of Criteria-Pollutant-Forming Emissions per Megawatt-Hour by Gas-Fired Power Plants, 2005
|
|
Mean |
Standard Deviation |
5th Percentile |
25th Percentile |
50th Percentile |
75th Percentile |
95th Percentile |
|
SO2 |
0.045 |
0.20 |
0.00069 |
0.0044 |
0.0065 |
0.012 |
0.15 |
|
NOx |
2.3 |
9.0 |
0.052 |
0.17 |
0.48 |
1.7 |
5.5 |
|
PM2.5 |
0.11 |
0.39 |
0.00057 |
0.016 |
0.045 |
0.091 |
0.28 |
|
PM10 |
0.12 |
0.39 |
0.00092 |
0.018 |
0.050 |
0.094 |
0.32 |
|
NOTE: All plants are weighted equally, rather than by the electricity they produce. ABBREVIATIONS: SO2 = sulfur dioxide; NOx = oxides of nitrogen; PM = particulate matter. |
|||||||
emitted per MWh accounts for 75% of the variation in NOx damages per kWh.
To summarize, the aggregate damages associated with criteria-pollutant-forming emissions from the facilities in our sample in 2005, which generated 71% of the electricity from natural gas, were approximately $0.74 billion, or 0.16 cents per kWh (2007 USD); however, damages per plant varied
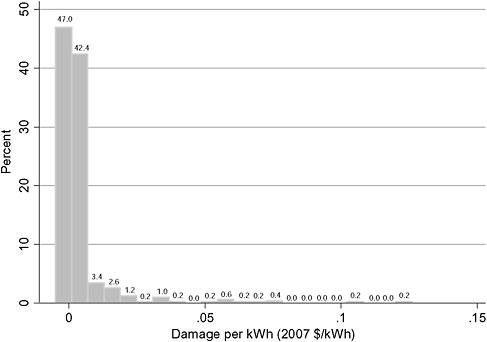
FIGURE 2-16 Distribution of criteria-air-pollutant damages per kWh of emissions for 498 natural-gas-fired power plants, 2005. Damages related to climate change are not included.
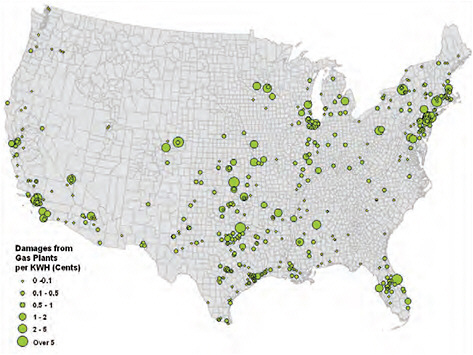
FIGURE 2-17 Regional distribution of criteria-air-pollutant damages from gas generation per kWh (U.S. dollars, 2007). Damages related to climate change are not included.
widely. The 50% of plants with the lowest damages per plant, which accounted for 23% of net generation, produced 4% of the damages, and the 10% of plants with the highest damages per plant, which accounted for 24% of net generation, produced 65% of the damages. Although damages are
TABLE 2-17 Distribution of Damages per Ton of Criteria-Pollutant-Forming Emissions by Gas-Fired Power Plants (2007 U.S. Dollars)
larger for plants that produce more electricity, less than 40% of the variation in damages across plants is explained by differences in net generation.
Damages per kWh also varied widely across plants: from about one-thousandth of a cent (5th percentile) to 0.55 cents per kWh (95th percentile). (These are weighted figures.) Most of the variation in NOx damages per kWh can be explained by variation in emissions intensity across plants; however, for PM2.5, which constitutes over half of the monetized air-pollution damages, variation in damages per ton of PM2.5 are as important in explaining variation in PM2.5 damages per kWh as differences in PM2.5 emissions intensity.
Downstream CO2Emissions from Electricity Production from Natural Gas
The emissions of CO2 from gas-fired power plants are significant. As the heat rate (energy of coal needed to generate 1 kWh of electricity) varies widely among coal-fired plants, so does it vary among gas-fired plants (with an average of about 0.5 ton of CO2 per MWh of power generated (the 5th-95th percentile range is 0.3 to 1.1 tons per MWh).
Externalities from Natural Gas in 2030
Technology in 2030
In comparison to coal, less drastic technological change for central-station power generation by natural gas is expected. However, natural-gas powered fuel cells could become mainstream and generate significant amounts of electricity (such technology exists but is not currently at power-station scale).
Additionally, more natural gas could become available through discovery or more-aggressive development of existing sources. While domestic production has been relatively flat for years, new deposits such as the Marcellus Shale in the eastern United States hint at increasing domestic production. The prospect of this gas, however, is balanced against deeper drilling and more complicated extraction, which would increase the life-cycle energy use and associated emissions of using the resource.
Liquefied natural gas (LNG) is becoming an increasingly likely source of global natural gas-fired power. LNG has significant additional life-cycle stages compared with natural gas, which leads to additional energy use and air emissions. Synthetic natural gas (SNG) from coal is also a possible pathway. LNG and SNG both have substantially higher upstream emissions than natural gas, which would need to be taken into account in assessing their effects for future natural-gas-fired power.
Natural-gas-fired power plants have been discussed as candidates for CCS technology in the future. This combination is generally estimated to have smaller incremental costs (only about 1-2 cents per kWh) than for coal, but it captures less CO2 per kWh than coal. Thus from a cost-effectiveness (and related damage avoidance) perspective, coal-fired plants will continue to be a more desirable target for CCS in the future.
A beneficial feature of natural gas power plants is their ability to quickly increase or decrease power output as needed. Thus they can fill in power demand for intermittent renewables such as wind and solar when other fast-ramping sources such as hydropower are not available. However, today’s gas turbines are not designed to be ramped up and down continuously, and emit more GHG emissions and criteria-pollutant-forming emissions while ramping up and down (Katzenstein and Apt 2009). If a large percentage of renewables is installed by 2030, and natural gas is relied on for fill-in power, then considerable design improvements will be needed for those natural gas plants.
Downstream Air-Pollution Damages from Gas-Fired Power Plants in 2030
Our analysis of the criteria air-pollution damages associated with electricity generation from natural gas in 2030 follows the analysis for coal-fired electricity generation described earlier in the chapter. Specifically we ask how damages at the locations of the 498 facilities examined for 2005 would change if electricity generation were to increase at the rate predicted by the EIA and if emission intensities were to decline at rates consistent with EIA projections of emissions of SO2 and NOx from fossil fuel. These assumptions are combined with estimates of damages per ton of the criteria-pollutant-forming emissions estimated from APEEP.
EIA projections of electricity generation from natural gas were used to estimate net generation in 2030. On average, electricity production from natural gas is predicted to increase by 9% from 2005 levels; hence we assumed that generation at each facility increases by this percentage. Reductions in pollution intensity for natural gas facilities are not as dramatic as for coal plants: pounds of NOx emitted per kWh are estimated to fall, on average, by 19%; emissions of PM2.5 and PM10 per MWh are each estimated to fall by about 32%.44 Damages per ton of pollutant will, of course, rise, as described in section on coal-fired electricity.
The net effect of these changes is to decrease the projected aggregate damages generated by the 498 gas facilities from $0.74 billion (2007 USD)
in 2005 to $0.65 billion in 2030. Average damage per kWh from gas generation falls to 0.11 cents (2007 USD) from 0.16 cents in 2005.
ELECTRICITY PRODUCTION FROM NUCLEAR POWER
Current Status of Nuclear Power Production
In 2009, according to EIA, 104 commercial nuclear generating units are fully licensed to operate by the U.S. Nuclear Regulatory Commission. Their locations are shown in Figure 2-18. In addition, 14 nuclear power reactors are undergoing decommissioning, as shown in Figure 2-19 and listed in Table 2-18.
Of the 104 reactors in operation, 69 are pressurized light-water reactors (PWRs), totaling 65,100 net megawatts (electric45); and 35 units are boiling water reactors (BWRs), totaling 32,300 net megawatts (electric). Other reactor technologies exist or are being developed (see discussion later in this section on new developments in nuclear technology), but as of February 2009 none of these technologies operated commercially in the United States.
There has been no recent construction of nuclear generating plants in the United States. Nuclear generating capacity has been expanded by upgrading or adding capacity at existing power plants; the most recent reactor, Watts Bar No. 1, in Tennessee, was connected to the grid in February 1996.
Brief History of Nuclear Power
Electricity from nuclear fission was first generated in the United States on December 20, 1951, by the U.S. Atomic Energy Commission’s Experimental Breeder Reactor (DOE 2006a). The first commercial electricity-generating nuclear power plant at Shippingsport, Pennsylvania, reached its designed power-production level in 1957. It was shut down in 1982, when decommissioning began.
The growth of nuclear-powered electricity was rapid in the 1960s, though it slowed in the 1970s. In 1986, Ohio’s Perry plant became the 100th U.S. commercial nuclear power reactor in operation. By 1991, the United States had 111 nuclear power units.46 The highest number reached
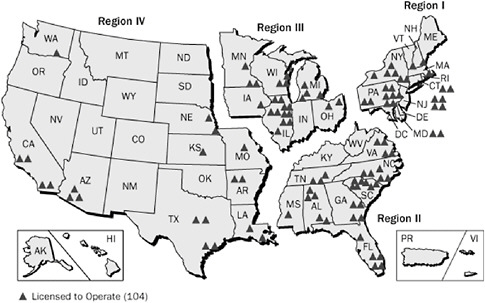
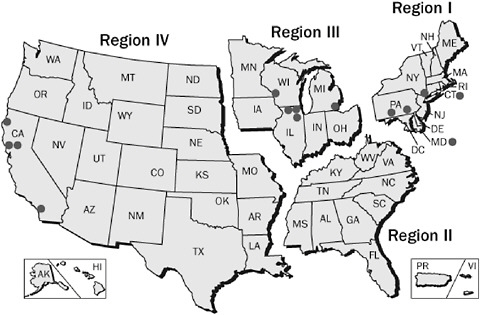
TABLE 2-18 U.S. Nuclear Power Reactors Undergoing Decommissioning
|
|
Name |
Location |
|
1 |
Dresden—Unit 1 |
Dresden, IL |
|
2 |
Fermi—Unit 1 |
Newport, MI |
|
3 |
Humboldt Bay |
Eureka, CA |
|
4 |
Indian Point—Unit 1 |
Buchanan, NY |
|
5 |
LaCrosse boiling water reactor |
Genoa, WI |
|
6 |
Millstone—Unit 1 |
Waterford, CT |
|
7 |
Nuclear Ship Savannah |
Baltimore, MD |
|
8 |
Peach Bottom—Unit 1 |
Delta, PA |
|
9 |
Rancho Seco |
Herald, CA |
|
10 |
San Onofre—Unit 1 |
San Clemente, CA |
|
11 |
Three Mile Island—Unit 2 |
Middletown, PA |
|
12 |
Vallecitos boiling water reactor |
Sunol, CA |
|
13 and 14 |
Zion—Units 1 & 2 |
Warrenville, IL |
|
SOURCE: U.S. NRC 2008b. |
||
was 112 in 1990, then constituting one-fourth of the world’s nuclear power units; they provided almost 20% of the electricity produced in the United States (DOE 2006a, EIA 2008a). By 1998, the number of operating units was 104, as it remained in 2008 (EIA 2008a). Net electricity generation grew from 1.7 GWh in 1961 to 38.1 GWh in 1971, 272.7 GWh in 1981, 612.6 GWh in 1991, 768.8 GWh in 2001, and 806.5 GWh in 2007. The nuclear share of total electricity production reached 19.5% in 1988, and it has since ranged between 17.8% and 20.6% (EIA 2008a).
Upstream Externalities
Uranium Mining
Canada and Australia currently account for 44% of global uranium production, with 18 other countries—notably, Kazakhstan, Niger, Russian, Namibia, and Uzbekistan—for supplying the remainder (IAEA 2008). Reduction in uranium stockpiles for weapons has contributed to an abundance of uranium on the market. The United States currently accounts for 5% of global production, much of the U.S. share coming from Wyoming.
Uranium is produced from open-pit (surface) mining, underground mining, or in situ leaching (ISL) techniques. Surface and underground mining for uranium is similar to mining for coal (described earlier). The ISL technique requires drilling several wells and pumping in a solution to leach the uranium out of the surrounding rock. The uranium-bearing solution is then pumped out of the wells and treated on-site to produce yellowcake (uranium ore). In Wyoming at present, all uranium production occurs at in
situ facilities in the Powder River Basin (Paydirt 1999). Other states where ISL facilities could be located include Nebraska, South Dakota, and New Mexico (U.S. NRC 2008c). In 2006, uranium mining and milling in the United States produced 4,692,000 lbs of U3O8. Of this total, nearly 91% was produced at ISL facilities; with the remainder coming from underground mining (EIA 2008c, Table 2).
With uranium mining in general, radiological exposure can occur in three main ways: through inhalation of radioactive dust particles or of radon gas, ingestion of radionuclides in food or water, and direct irradiation of the body. For surface mine workers, exposure to radon exposure is generally less important than direct irradiation or dust inhalation; however, exposure to radon can be important for underground miners, although occupational radiological exposure is not an externality (see discussion and explanation in Chapter 1). For members of the public, the most significant pathways from an operating mine are radon and other radionuclide ingestion following surface water transport. From a rehabilitated mine, the pathways most significant over the long term are likely to be groundwater as well as surface water transport and bioaccumulation in animals and plants located at the mine site or associated water bodies (Australian Government 2009).
The draft Generic Environmental Impact Statement for In Situ Leach Uranium Milling Facilities (GEIS) released by the Nuclear Regulatory Commission in July 2008 assessed the impacts of four phases of ISL—construction, operation, aquifer restoration activities, and decommissioning—on land use, transportation, geology and soils, surface water and groundwater, terrestrial and aquatic ecology, air quality, noise, historical and cultural resources, visual and scenic resources, socioeconomic characteristics, public and occupational health and safety, and waste management. Impacts were qualitatively evaluated according to whether they were small (“not detectable or so minor that they will neither destabilize nor alter noticeably important attributes of the resource”), moderate (“sufficient to alter the resource noticeably, but not to destabilize, important attributes”), or large (“clearly noticeable and … sufficient to destabilize important attributes”) (U.S. NRC 2008c, p. 4.1-1).
According to the draft GEIS, there is the potential for large impacts on historical and cultural resources, depending on local conditions; on localized ecological resources, especially on a few rare and endangered species, depending on site-specific habitat; and on groundwater. The possibility of groundwater impacts due to leaks and spills, excursions, and deep-well injection of processing waste historically has been an area of particular concern with ISL. The draft GEIS notes that the magnitude of groundwater impacts will depend on factors such as contamination during construction activities, which could be mitigated by best management practices; failure
of well seals or other operational conditions, which could be detected by monitoring and testing; and the potential for impacts on deep aquifers from deep-well injection of processing wastes, which would depend on the state’s permitting process.
Adverse environmental and human health effects can occur from legacy (discontinued) uranium mining and milling sites as well as from some current operations, especially in developing countries and in the former Soviet Union (Waggitt 2007). In the United States, a 1978 law—the Uranium Mill Tailings Remediation Control Act (UMTRCA)—as amended in 1983—provides for the remediation by the U.S. Department of Energy of 26 legacy uranium production facilities. U.S. laws do not classify uranium mining overburden as a radioactive waste, so its placement in radioactive waste disposal facilities is not required; however, EPA has the authority under various legal statues to protect the public and the environment from exposure to the hazardous and toxic characteristics of conventional (open-pit and underground) uranium mining wastes (EPA 2009e). Nevertheless, concern remains about some about the negative effects of both past and current mining practices (see, for example, WISE-Uranium 2009). A law passed by the Navajo Nation Council in 2005 banned uranium mining and milling altogether on sites within Navajo territory (SRIC 2009).
Uranium Conversion and Enrichment
The only uranium conversion facility in the United States is at Metropolis, IL. This facility produces about 14,000 metric tons47 of uranium per year. The process converts uranium oxide (yellowcake) into uranium hexafluoride, which is a gas. At the end of the conversion process, the amount of U-235 in the gas is about 0.7%. In order to enrich the material to that needed for reactor fuel to between 3 and 4%, the material is sent to a gaseous diffusion facility. Currently, the only facility in the United States is at Paducah, KY.
Although this facility is expected to be replaced by other centrifuge facilities being constructed at Piketon, OH, and Eunice, NM, the Paducah facility will remain in operation for several more years. The electricity intensity assumed for such a facility (Dones et al. 2005) is about 2600 kWh/separative work unit (SWU). When the Piketon facility is completed, the electricity use drops to approximately 40 kWh/SWU. The Piketon facility is due to begin operation in 2011; uncertainties about financing made the likelihood of meeting that deadline uncertain (Mufson 2009). The Eunice facility is scheduled to begin production even sooner, but, as of this writing, neither facility is in production. For that reason, it is reasonable to utilize
the analyses by Dones et al. that were based on life-cycle assessments for pressurized water reactor facilities. While these analyses cover the entire life cycle, the majority of the atmospheric emissions come from power plants producing electricity that is needed for part of the enrichment process using centrifuge technology. Thus, the estimated emissions values (all as g/MWh) are as follows:
SO2: 22.5
PM2.5: 5.4
NOx: 33.9
Nonmethane volatile organic hydrocarbons: 7.7
Upstream Emissions of GHG Emissions and Other Pollutants
It is often mentioned that nuclear power produces no air-pollutant emissions. Although that is generally true for the generation of nuclear power, the upstream part of the life cycle of nuclear power generation includes the mining, milling, and processing of uranium; transportation of the nuclear fuel; and construction of facilities, all of which entail criteria-pollutant-forming emissions and GHG air emissions. In short, the non-generation impacts dominate (Dones et al. 2005, Weisser 2007).
Koch (2000) estimated the CO2, SO2, NOx, and PM emissions of nuclear power to be 1-2 orders of magnitude less than those of coal-fired power. Sovacool (2008) summarized a range of studies on the life-cycle GHG emissions of nuclear power and estimated that the mean was about 66 g CO2-eq/kWh. Sovacool also noted that the “frontend” of the fuel cycle (including mining and milling uranium ore, conversion, and enrichment) represented 38% of the total emissions. NAS/NAE/NRC (2009a) cited and agreed with the conclusion reached by Fthenakis and Kim (2007) that life-cycle CO2 emissions for nuclear plants, assuming that the current U.S. nuclear fuel cycle is maintained, could range from 16 to 55 g CO2-eq/kWh. For comparison, coal plants without CCS produce an average of 1,000 g CO2/kWh.
Downstream Externalities
Damages from Routine Plant Operations and Estimated Accident Damages
The main downstream burdens from operations of nuclear power plants are related to radioactive waste, discussed in some detail below. Other routine burdens are related to the release of heated cooling water. There are also land-use and ecological effects associated with nuclear plants, which
are similar to those experienced at other thermal power plants (for example, see Box 2-2).
There have not been significant damages associated with release of radioactive materials from an operating nuclear power plant in the United States, but a few such accidents have occurred elsewhere. Although the potential for such accidents is a public concern—and also a concern to industry and regulatory bodies—the committee has not attempted to monetize or even quantify such potential. Previous studies, such as ORNL/RFF (1992-1998) and ExternE (EC 1995a), estimated the risk of accidents using detailed fault-tree models and found the risks and associated externalities to be small (as summarized later in this chapter). The committee did not undertake a modeling effort because such an analysis would have involved power-plant risk modeling and spent-fuel transportation modeling that would have required far greater resources and time than were available for this study. Also, apparently there were no developments since the earlier studies that would have led to any appreciable increase in the estimated probabilities of a reactor accident (a decrease in the estimate would be more likely).
Nuclear power plants routinely generate not only electricity but also radioactive wastes, including low-level radioactive waste (LLRW); “greater than Class C” (GTCC) wastes; and high-level radioactive waste (HLRW), mainly from spent nuclear fuel.
|
BOX 2-2 Entrainment and Impingement of Aquatic Organisms by Thermal Power Plants Entrainment and impingement of fish and other aquatic organisms in intake structures of thermal power plants has received much attention. Impingement occurs when organisms are trapped by the force of the intake of water at intake screens; entrainment occurs at power plants with once-through cooling systems when the organisms—usually eggs, larvae, and juveniles—are carried with the water through the plant’s heat exchanger and returned to the water body with the discharged water. Mortality from impingement and entrainment can approach 100%. Despite many studies, the population effects of impingement and entrainment usually are not well-known (Heimbuch et al. 2007). It appears that the most likely conditions for serious ecological impacts occur when there are many power plants in an area or when a power plant is sited in an area with a localized population of an organism that could be threatened with serious population consequences. These impacts, which are common to all thermal plants with once-through cooling systems, have not been quantified or monetized. Sovacool (2009a) has more broadly reviewed water-related impacts of thermal power plants and the effects of those plants on water resources. |
Nuclear power plants are a significant source of LLRW; their LLRW may include anything from clothing and rags to ion-exchange resins, filters, tank residues, and irradiated reactor components. LLRW is either stored for decay to background levels before being disposed of as conventional nonradioactive waste (a practice possible only with slightly contaminated materials), or it is disposed of in near-surface engineered landfills. An interstate compact system for the disposal of commercially-generated LLRW was established through the 1980 Low-Level Radioactive Waste Policy Act (LLRWPA) as amended in 1985. Intended to spur the development of regional LLRW disposal sites, the process mandated by the act largely has failed. As of early 2009, there were only three LLRW disposal sites in the nation: one in Barnwell, SC, which is licensed to take Classes A, B, and C LLRW but as of July 2008 was restricted to take only waste generated in the Atlantic Compact states (South Carolina, Connecticut, and New Jersey); one in Richland, WA, which takes Classes A, B, and C waste from the nine states in the Northwest and Rocky Mountain compacts; and one in Clive, Utah, which accepts waste from all states but is licensed for Class A waste only. (Class A waste, which has the lowest concentration of long-lived radionuclides, requires fewer protective measures.) In 2005, approximately 4 million cubic feet of LLRW was shipped for disposal (U.S. NRC 2009). Nuclear power plants have the means to safely store LLRW on-site, including storage for decay to background levels if the waste is only slightly contaminated. Limited access to LLRW disposal sites—especially for Classes B and C waste—is an inconvenience for nuclear power plants, particularly those that are due for rehabilitation, up-rating, or decommissioning, but it is not likely to be an immediate environmental, health, and safety hazard.
The GTCC wastes from nuclear power plants come mainly from highly irradiated reactor components. Under the LLRWPA as amended, the federal government is responsible for all commercially generated GTCC waste (as well as GTCC-like waste generated by federal activities). In 2007, the DOE initiated a scoping process for a draft environmental impact statement to assess the environmental, social, and economic impacts of one or more facilities for GTCC and GTCC-like waste disposal. Disposal methods being considered include enhanced near-surface disposal, intermediate depth borehole disposal, and disposal at a geologic repository (GTCC LLRW EIS 2009).
According to the 1982 Nuclear Waste Policy Act (NWPA), the federal government is required to develop one or more geologic repositories to store HLRW generated by commercial activities and federal defense activities. The DOE is responsible for developing the site, the NRC for licensing it, and the EPA for setting radiation protection standards for humans and the environment. The NWPA was amended in 1987 to designate Yucca Mountain in Nevada as the only candidate for a geologic repository in the United States. After years of investigation and analysis by DOE,
Yucca Mountain was found suitable in 2002 by Energy Secretary Spencer Abraham and President George W. Bush. Nevada Governor Kenny Guinn vetoed the decision, but the veto was overturned by Congress in July 2002. An application for a license is before the Nuclear Regulatory Commission. The future of Yucca Mountain as a repository is unclear, however, because President Barack Obama’s budget for FY 2010 significantly reduced funding for the program, and the Obama administration has generally voiced skepticism about it. DOE is studying alternate strategies for dealing with nuclear wastes that do not involve a repository at Yucca Mountain. With the disposal of HLRW being arguably the most contentious issue concerning nuclear energy, a detailed assessment of the externalities associated with its disposal would be a high priority for future study. Such a study would be extremely complex, given the considerable uncertainties, long timeframe, and severe impacts under certain scenarios.
As of 2002, about 45,000 tons of spent fuel from nuclear power plants were in storage—virtually all on-site. Most of the spent fuel rod assemblies are stored in water pools; less than 5% are stored in dry casks (U.S. NRC 2002). Unlike wet storage, dry cask storage is almost totally passive: It is simpler and uses few human or mechanical support systems. However, it is not suitable until the nuclear rod assemblies have been out of the reactor for a few years, allowing the heat generated by radioactive decay to decline. The NWPA limits the amount of waste to be stored at the geologic repository to 70,000 metric tons of heavy metals, of which 90% (63,000 metric tons) could be attributable to commercial spent nuclear fuel. However, one analysis suggests that Yucca Mountain would be technically capable of storing at least four and possibly nine times that amount (EPRI 2007).
Transportation of radioactive waste is jointly regulated by the U.S. NRC and the U.S. Department of Transportation (DOT). The U.S. NRC sets requirements for packaging radioactive materials; the DOT regulates shipments while they are in transit. For shipping spent fuel, casks or containers that shield and contain the radioactivity and dissipate the heat are required. Many shipments of spent fuel have been made, typically between different reactors of a utility, in order to share storage space. Lacking a geologic repository or its centralized storage equivalent, very little HLRW has been transported for long distances. Low-level waste has been transported long distances without significant incident for decades.
Reprocessing Nuclear Fuel
Since 1977, there has been a moratorium in the United States on the reprocessing of spent nuclear fuel. In limited recycling processes that are commercially available in France, Japan, and the United Kingdom, uranium and plutonium are separated from spent nuclear fuel for eventual reuse as fuel, and the remaining transuranics, along with the fission products, are
converted to vitrified waste for storage (Finck 2005; DOE 2006b). This process reduces the volume of waste to be stored by a factor of 4 but creates a separated pure plutonium product, which could present a proliferation and security risk.
Recently, research has been conducted in France, Japan, and the United States to develop a full-recycle, closed-fuel process to make more efficient use of the nuclear fuel and to avoid large storage problems (Finck 2005; DOE 2006b). This recycling process makes use of advanced separation techniques that can separate out (1) long-lived fission products, such as technetium and iodine, for immobilization and eventual disposal as high-level waste; (2) short-lived fission products, such as cesium and strontium, which can be prepared for decay storage until they meet the requirements for disposal as low-level waste; and (3) transuranic elements, including plutonium, neptunium, americium, and curium, which can be fabricated into fuel for advanced fast reactors (DOE 2006b).
The reprocessing and recycling of spent nuclear fuel through advanced separation techniques and fast reactors increases the efficiency of fuel use and decreases the need for high-level radioactive waste disposal capacity. The DOE has stated that reprocessing offers the opportunity for significant cost reduction (Finck 2005); others, however, have argued that it would be more expensive than current “once-through” practices (von Hippel 2001). It also has been argued that no reprocessing technique is as proliferation-resistant as not reprocessing spent fuel at all and leaving the plutonium mixed with highly radioactive fission products (von Hippel 2001).
Estimates of Aggregate Damages from Nuclear Power Plants
We present here the results of two previous, studies of damages from nuclear power plants, by ExternE (EC 1995b) for France, and by Oak Ridge National Laboratory and Resources for the Future (ORNL/RFF 1995) for two sites in the United States. They are comprehensive and well documented; the range of values they produced and the reasons for the differences are informative.
ExternE (EC 1995b) estimated that the cost of damages for all stages of the nuclear fuel cycle, including reprocessing and accidents, was about 2.5 ECU mils (mECU) per kWh if no discount rate was applied. The ECU, the predecessor of the euro, was worth an average of 0.77 USD in 1995; thus the estimate was about 1.9 mils/kWh, equivalent to about 2.5 mils/kWh in 2007 USD. This is about 10% of the damage estimate in this study for criteria-pollutant-forming emissions from coal. When 3% and 10% discount rates were applied, the damage cost declined to 0.1 and 0.05 mECU/kWh, respectively. The large sensitivity to discount rate results from the adoption by ExternE of a time horizon of 100,000 years for estimating
the total collective radiation dose due to release of radionuclides, and the ExternE estimate suggests that over a short or medium term, the aggregate damages for nuclear power are at least 3 orders of magnitude less than the air-pollutant damages alone from coal.
The contemporaneous study by Oak Ridge National Laboratory and Resources for the Future (ORNL/RFF 1995) produced estimates of the aggregate costs of nuclear operations of an average of 0.25 mils/kWh for two sites, including accidents; and 0.2 mils/kWh without accidents. These numbers are one order of magnitude less than the ExternE values with zero discount rate, and twice and four times as large, respectively, as the ExternE values with 3% and 10% discount rates. However, the U.S. (ORNL/RFF) assessment did not include reprocessing, as that did not then (and does not now) exist in the United States; the conversion, enrichment, fuel-fabrication, and low-level waste disposal stages were considered separately in that study. The ExternE assessment also expanded the physical boundaries to 1,000 km (regional) and to global dimensions. In addition, the technologies and sites in the two assessments are different. When these factors are taken into account, the results of the two studies are directly comparable, and the estimated damage costs of nuclear power remain significantly lower than those for coal.
These results depend in part on the estimated probability of accidents and their probable consequences, and those values are a function of many factors, including reactor design, training and motivation of personnel, population density and distribution, emergency response, and so on. Additional information and experience would likely help to refine those estimates (EC 2005).
New Developments in Nuclear Technology
Nuclear power has the potential to produce large amounts of dependable electricity without emitting CO2. In recent years, nuclear reactors have produced about 20% of U.S. electricity, but this contribution will drop unless new capacity is added. This section considers both updated versions of today’s light-water reactors (LWRs), and possible advanced reactors for the future.
Updated Light-Water Reactors
The current generation of nuclear reactors continues to function reliably, but considerable research has been conducted in recent years to improving designs. New reactors are expected to be simpler, easier to operate, and generally more resilient than current designs, and several utilities are planning on constructing them.
Next-Generation Reactors
There are plans in the United States to build several evolutionary light-water reactors (LWRs). America’s Energy Future estimates that 5 to 9 such reactors could be built by 2020 (NAS/NAE/NRC 2009a). If they are built on time and within budget, perhaps additional similar reactors could follow. Nonetheless, new LWRs will be very expensive. It is important to examine alternative approaches that might have advantages and cost less.
DOE’s Generation IV Program (DOE 2009a) includes research on five reactor concepts. Only one, the very-high-temperature reactor (VHTR) is receiving significant funding, about $70 million requested for FY 2009. It is a helium gas-cooled, graphite-moderated reactor which is an updated redesign of the experimental high-temperature gas reactors (for example, Fort St. Vrain). The technology has significant advantages, including a low probability of a major radioactive release and the amount of heat that it produces. The VHTR is expected to operate above 1000 degrees °C (1800 °F) and could be used for industrial process heat and hydrogen production as well as electricity.
DOE also has a related Nuclear Hydrogen Initiative (NHI), which focuses on thermochemical splitting of water molecules. Such processes, using the VHTR as the energy source, are projected to be significantly more efficient than electrolysis.
According to a 2008 National Research Council review of DOE’s Nuclear Energy programs (NRC 2008a), both Gen IV and NHI are well-designed, and funding should be kept at levels according to progress towards milestones. The result, if successful, could lead to operating reactors before 2030, but probably only a few. Major decisions have yet to be made, including the basic core design.
DOE also is supporting work on a reactor that is intended to consume long-lived components of waste LWR fuel. The reactor could also produce power, but the primary goal is to reduce the nuclear waste disposal problem from tens of thousands to hundreds of years. Given the level of R&D required, and uncertainties in economics and the licensing path, such a reactor is unlikely to be operating by 2030.
ELECTRICITY PRODUCTION FROM WIND
Current Status of Wind Energy
It is difficult to keep current with respect to the status of wind energy in the United States because it is increasing so rapidly. By the end of 2008, the total installed capacity48 in the United States was 25,170 MW (25.17
GW), up from 16,824 MW at the end for 2007 (AWEA 2009). For the 12 months ending November 30, 2008, 44,689 GWh of electricity were generated by wind-powered turbines out of a total of 4,118,000 GWh, or 1.1% (EIA 2009a, Table 1.1a).
The American Wind Energy Association (AWEA) lists 6,922 active turbines as of September 30, 2008, ranging in nameplate capacity from less than 1 KW to 3,000KW (3 MW).49 The number of wind turbines per project ranges from 1 to more than one thousand. The largest project in terms of nameplate capacity is 766 MW. The smallest are many 50 KW installations consisting of single turbines. It is not possible to characterize an “average” wind plant in any meaningful way, but it is common for modern plants to have a nameplate capacity of between 40 and 300 MW and to consist of turbines ranging in individual capacity from about 1.5 to 3 MW. The earliest utility-scale projects were commissioned in California in the early 1980s; a few of those turbines, most on the order of tens of KW to about 100 KW, still are producing electricity.
Brief History of Wind Energy
The first utility-scale wind-energy plants in the United States began operation in 1981, with a total installed capacity of less than 10MW. The increase was rapid at first, reaching 1.2 GW by 1986, but then slowed, with total capacity of only 1.8 GW in 1998. Then a period of rapid increase began again; capacity reached 4.3 GW by 2001, 6.6 GW by 2003, 9 GW by 2005, and more than 25 GW by the end of 2008. Much of the increase is fueled by federal production-tax credits (PTCs), which have been sporadic. The current federal PTC extends through 2009 as of December 2008. State-mandated renewable-energy portfolios, which require the state’s energy use to be based on renewable sources (mainly wind) by target dates, also have affected the penetration of wind-generated electricity, as do general economic conditions.
Future Considerations for Wind Energy
As indicated above, with the passage of time, the most-obvious change in wind-energy plants has been the reduction in total number of turbines and increase in the size (both physical size and nameplate capacity) of the individual turbines. Even some early plants had total nameplate capacities of from 40 to 80 MW, but projects exceeding 100 MW became common only in the late 1990s. These changes are largely technology-driven, result-
ing in larger turbines, and it seems likely that individual turbines of 5 MW will be commercially deployed in the United States soon.
A July 2008 report of the U.S. Department of Energy assessed the possibility of providing 20% of the nation’s electricity from wind by 2030. The report noted that
The 20% Wind Scenario in 2030 would require improved turbine technology to generate wind power, significant changes in transmission systems to deliver it through the electric grid, and large expanded markets to purchase and use it. In turn, these essential changes in the power generation and delivery process would involve supporting changes and capabilities in manufacturing, policy development, and environmental regulation (DOE 2008a, p. 4).
The report also noted (p. 57) that a 20% Wind Scenario would require a substantial development of offshore technology as well as improvements to land-based technology.
As of mid-2009, all U.S. wind-energy plants were on land. A number of offshore projects had been proposed, but none had been permitted. The Cape Wind project proposed for Nantucket Sound in Massachusetts had advanced the furthest: In January 2009, the Minerals Management Service (MMS) of the U.S. Department of the Interior (DOI) released a final environmental impact statement (FEIS) for the project, which was proposed to have 130 3.6 MW turbines located 4.7 miles offshore. Because the project was to be sited in federal waters, a lease with the federal government ws required. (The 2005 Energy Policy Act amended the Outer Continental Shelf (OCS) Lands Act to give the U.S. Department of the Interior authority to issue leases, easements, or rights-of-way for activities supporting renewable energy production; DOI delegated this authority to one of its bureaus, the MMS.) The FEIS identified most impacts as negligible or minor. (For a summary of the impacts cited in the FEIS, see MMS 2009, Table E-1.)
In April 2009, the DOI finalized its framework for renewable energy production on the OCS. In May 2009, the Energy Facilities Siting Board of the Commonwealth of Massachusetts granted a Certificate of Environmental Impact and Public Interest for the Cape Wind project, combining nine state and local permits required into one “super permit.” A Record of Decision from MMS on the Cape Wind application for construction, operation, and eventual decommissioning is expected shortly.
Upstream Impacts of Wind Energy
As noted at the beginning of this chapter, upstream effects of wind-energy generation of electricity differ substantially from those of fossil-fuel
and nuclear plants in that there is no production, refinement, and transportation of fuel. As a result, the effects described below comprise all the upstream effects. Other kinds of EGUs also have such upstream effects, but because of their requirements for fuel, these effects are only a very small part of the total.
Materials and Transportation
Metal components make up nearly 90% by weight and more than one-third by value of a modern wind turbine. For a 150 MW project, transportation requirements have been as much as 689 truckloads, 140 railcars, and 8 ships to the United States (Ozment and Tremwell 2007). Raw materials used include copper, iron (steel), rare earths for permanent magnets in rotors. The metal parts can be cast, forged, or machined. Turbine rotors are made of composites, balsa wood, carbon fiber, and fiberglass. Blades can approach 50 meters in length (and the nacelle of a turbine can be 70-90 meters above the ground). The mining of metals, fabrication and transportation of parts, and the assembly of the components have impacts that have been qualitatively described elsewhere in this chapter.
On-site and Downstream Impacts of Wind Energy
Ecological Effects
Assessment of the ecological effects of generating electricity from wind has focused primarily on deaths of flying animals caused by interactions with turbines. Bird deaths attributable directly to wind generation of electricity probably are less than 100,000 per year in the United States (for example, NRC 2007b; Sovacool 2009b). The only bird deaths considered to potentially reflect a population-level problem currently are of raptors, occurring mainly in older installations in California (NRC 2007b). Total anthropogenic bird deaths probably exceed 100 million per year in the United States,50 and could be as high as 1 billion (NRC 2007b).
Bat deaths caused by wind turbines, especially in the eastern United States, have been higher than expected (NRC 2007b, Arnett et al. 2008), although they are extremely difficult to quantify, because bats are small
and hard to find (Kunz et al. 2007). To date, no member of any bat species listed under the Endangered Species Act has been reported killed by a wind turbine. Bat populations of many species have been declining in the eastern United States, and because so little is known about the demography of bats, and because it is so difficult to quantify bat deaths, it is possible that the number of bats killed by wind turbines is a significant population-level threat to some species in some locations. The concern is intensified to the degree that the number of turbines continues to increase (NRC 2007b).
Although the primary focus of ecological effects of wind has been on deaths of flying animals, wind-generated electricity also can have wider ecosystem and habitat effects. Land-use changes to accommodate wind-energy installations are similar in kind to those for many other kinds of electricity-generating plants, including the need for roads and rights-of-way for transmission lines. The overall footprint of a wind-energy plant tends to be larger than for others, but the intensity of land-use change can be lower, because in many cases, the land between the turbines is not affected. On forested ridge lines in the eastern United States, the forest generally is cleared, or at least cut back, throughout the installation’s footprint (NRC 2007b).
Most studies, including the NRC’s 2007b report, have not identified significant ecological impacts other than those described above. However, the total installed wind-energy capacity when most recent reports were published was less than 12 GW, as compared with the more than 25 GW at the end of 2008. The rapid recent and projected future growth of wind-powered electricity generation in the United States means that ecological assessments probably will need to be repeated.
Aesthetic and Visual Effects
There have been few quantitative studies of aesthetic and visual impacts, although there are well-established methods for assessing them quantitatively (NRC 2007b).
Noise, Flicker, Radar Interference, Other
Adverse effects caused by noise—annoyance, sleep disturbance, and discomfort—have been documented and may be locally significant. Electromagnetic interference with television and radio broadcasting and radar also has been documented (NRC 2007b). Flicker effects have not been documented in the United States. All the above effects appear to be relatively small compared with effects related to other energy technologies considered by the committee.
Assessment of Externalities from Wind Energy
The life-cycle damages associated with wind energy have not been fully quantified, but for those effects for which the committee has information, it is safe to say that, in aggregate for 2009, potential damages associated with wind turbines are small compared with those associated with coal and natural gas as electricity sources. Criteria-pollutant forming emissions and GHG emissions are much smaller per kWh than for coal or natural gas, and wind power produces far less electricity than do coal and natural gas, and so the aggregate emissions are very much smaller. Aggregate land-use effects considered over the entire life cycle are not significantly larger at present than those for other generation types, especially if one considers that in some cases former land uses can continue between wind turbines.
Anthropogenic causes of bird deaths include collisions with power lines, implying contributions from all sources of electric-power generation and use. Collisions with power lines likely account for the deaths of more than 130 million birds each year, dwarfing the estimated number of bird deaths caused by direct collisions with wind turbines (20,000 to 37,000 in 2005) (NRC 2007b and references therein). We do not have enough information to reliably compare the death rates of birds across all electricity-generation sources per kWh,51 but if wind power ever provides 20% of U.S. electricity supply, as some scenarios suggest it will, then its significance as a cause of bird deaths would increase.
Damages associated with bat deaths are difficult to analyze. Bat deaths appear to be largely, if not uniquely, associated with wind generation of electricity, but no good estimate of the numbers of bats killed is available (NRC 2007b). In addition, the lack of understanding of the demography and ecology of bats makes it difficult to assess the importance of bat deaths. It appears likely to this committee that societal damages associated with the killing of bats by wind turbines are currently small by comparison with the aggregate damages associated with electricity generation by coal, natural gas, and the sum of all other sources. We agree with the NRC (2007b) that better information is needed, especially in light of the probable future increase in the number and density of wind turbines.
ELECTRICITY PRODUCTION FROM SOLAR POWER
Background and Current Status
Solar power, a renewable energy source, refers to the capture and conversion of solar radiation (that is, sunlight) into electricity or heat. The use of solar power to generate electricity most commonly involves photovoltaic (PV) modules, or “solar panels,” that are installed in large solar power plants (“solar farms”) or on the walls or roofs of buildings. Other methods also exist to use heat generated by solar collectors or by other technology to generate electricity from steam turbines. The passive use of solar power for heating is discussed in Chapter 4. Concentrating solar power (CSP) systems use optics to concentrate direct incident solar radiation, which is converted into thermal energy that can be used to generate electricity. CSP-system use in the United States is limited, primarily to sites in the Southwest, which have abundant direct solar radiation.
PV- and CSP-system electricity generation by the electricity sector combined to supply 500 GWh in 2006 and 600 GWh in 2007, which constitute about 0.01% of the total U.S. electricity generation. EIA data indicate that the compounded annual growth rate in net U.S. generation from solar was 1.5% from 1997 to 2007 (NAS/NAE/NRC 2009b). However, this estimate does not account for the growth in residential and other small PV installations, which are applications that have displayed the largest growth rate for solar electricity.
U.S. solar panel and module imports increased from 45,313 peak KW in 2002 to 280,475 peak KW in 2007. EIA estimates that 90% of end use for domestic PV shipments is grid-interactive electricity production. Approximately 3% is remote electricity production. The remaining 7% is distributed among uses that include communications, consumer goods, transportation, water pumping, health, and others.
Upstream and Downstream Impacts of Photovoltaic Energy
PV installations have two main parts: the solar panels and the balance of system (BOS) components. Generating electricity from PV modules, which produce direct-current (DC) electricity, requires a BOS to convert the DC power into the more commonly used alternating-current (AC) electricity. As such, upstream life-cycle activities involve mining of materials required for both solar panels and BOS components, panel and BOS manufacturing and construction, and finally the PV system installation.
Solar panels are made of semi-conducting materials similar to those used in the electronics industry. “Solar grade” silicon, derived from quartz
sand, is the most commonly used material to make solar panels. However, emerging thin-film technology, which allow use of solar panels as roof tiles and other building features, can be made of a variety of materials, including amorphous silicon, gallium arsenide (GaAs), cadmium-telluride (CdTe), and copper indium gallium selinide (CIGS). With the exception of silicon and arsenic (for arsenide), the metals required for thin-film technologies are rare, and their use may depend on foreign imports. Materials for both CdTe and CIGS can be obtained from waste streams of zinc and copper smelting (USGS 2008).
Manufacturing these panels is a very high-technology, material- and energy-intensive process. A number of the metals for thin-film PV technology are toxic (for example, arsenic and cadmium), thus raise environmental and public health concerns about metal emissions during the extraction, material upgrading, and manufacturing activities associated with PV systems. The intense energy requirements for upstream PV activities are another concern. Various studies have considered the relevant life-cycle flows of materials, energy, and resources for PV systems. Most studies have focused on the life cycle of solar photovoltaic (PV) systems, specifically on crystalline silicon systems, and on energy and GHG emissions. Fewer studies have considered life-cycle material and substance use, or emerging thin-film technologies like cadmium-tellurium (CdTe) PV panels (Fthenakis and Alsema 2006).
Unlike other energy-generation technologies, for which the underlying technology has not changed significantly over 30 years, the manufacture of PV panels has undergone significant efficiency improvements and material shifts over that time (for example, the cost/watt decreased from $6 to $2 from 1990 to 2005). Studies in Europe that focused on previous generation technology estimated that producing solar power had 30% higher health impacts than natural gas, and GHG emissions of 180 g/kWh—an order of magnitude higher than nuclear (EC 2003). Follow-on studies, including CdTe systems, showed lower but nonzero life-cycle health impacts from PV of about 0.1-0.2 cents per kWh, primarily caused by GHG, lead, and particulate matter emissions (Fthenakis and Alsema 2006). The life-cycle GHG emissions are estimated to be 20-60 g/kWh, comparable to those of nuclear power (Fthenakis and Kim 2007), while NOx and SO2 emissions are estimated at 40-180 and 50-450 mg/kWh respectively, far less than other generation methods (Fthenakis et al. 2008). Fthenakis and colleagues (2008) also evaluated heavy metal emissions (that is, Ar, Cd, Cr, Pb, Hg, and Ni), and found that that they are greatly reduced in comparison to emissions from fossil fuels, even with PV technology that makes direct use of the emitted compounds.
Generally excluded from LCA studies are transport considerations of
raw materials to panel manufacturers in the United States. Transport considerations are important depending on type of PV system. For example, the United States has very little or no domestic production of arsenic, gallium, or indium, and must rely upon imports for these materials (USGS 2008). Because of intense energy requirements for upstream activities, research has begun to evaluate the “energy payback”—the amount of time a PV system must operate in order to recover the energy used to produce a PV system (DOE 2004).
Downstream life-cycle activities include electricity generation, storage, and disposal or recycling of worn-out panels. As with wind power, the production of electricity with PV systems does not emit air pollutants, including GHGs. Externalities associated with downstream PV activities may arise due to intermittency, that is, the need for grid electricity when sunlight is not available. Chapter 6 further discusses grid interruptions associated with renewable energy sources. Other externalities may arise from the disposal of worn-out PV systems. Worn-out solar panels have potential to create large amount of waste, a concern exacerbated by the potential for toxic chemicals in solar panels to leach into soil and water. Many components of solar panels can be recycled, but the United States currently does not have or require a solar PV recycling system.
To capture enough solar energy to produce large amounts of electricity requires a certain amount of land. Much of the United States receives enough solar energy to produce around 1 kWh per square meter of PV panel per day in the summer, less in winter, but more if the panel is tracked to follow the sun. The economic and other values of the land that would be needed to capture enough solar energy to provide substantial amounts of electricity would depend on a host of factors, including the land’s location, ownership, and proximity to population centers, and other potential uses for the land. However, other factors also could affect solar-powered electricity at such a scale.
Future Considerations for Solar Energy
While solar PV and CSP are still developing technologies, they will be an increasing, but still small, part of electricity generation through 2020. Although solar power represents a very small fraction the U.S electricity generation, the energy potential of solar power is enormous. A 2009 NRC report, Electricity from Renewable Resources: Status, Prospects, and Impediments, notes that current domestic solar power potential is 13.9 TWh, more than 3,000 fold greater than current electricity demand (NAS/NAE/NRC 2009b, p. 4).
If solar energy for electricity were to become a significant part of the
U.S. energy mix, more attention would need to be paid to damages resulting from the manufacture, recycling, and disposal of equipment. Land-use issues also would probably be a concern.
ELECTRICITY PRODUCTION FROM BIOMASS
The nature of electricity generated from biomass feedstock is difficult to quantify and, for its externalities, even more difficult to obtain reasonable numbers. This is because the production and utilization of biomass for electricity production is inherently localized, resource-specific, and small scale. In addition, the term “biomass” can refer to a variety of feedstocks. The following discussion addresses issues associated with biomass use for electricity generation; because different feedstocks often are used for ethanol production for transportation fuel, the issues associated with them are somewhat different as well (see Chapter 3).
Feedstock Production
Feedstock comes from forestry and agricultural residues and from harvesting of forest and agricultural products. Some electricity generation uses either industrial biomass residues or municipal solid waste.
In the case of energy crops, land could be used for other activities. For agricultural residues, farming practices and the viability of the land for farming could be affected. In some cases, changes in land use can increase carbon emissions. Other uses can enhance terrestrial carbon sequestration.
Sufficient water is needed to raise crops, forest products, and their residues. Non-point-source runoff can impact surrounding surface-water systems. Use of pesticides can affect water quality through non-point-source runoff. Energy use can have impacts through life cycles for growing biomass feedstock and the related harvesting of crops or agricultural residues.
Use of fertilizers, particularly petroleum-based, constitutes an additional life-cycle issue, since much fertilizer is produced using natural gas. Additionally, there could be an increase in GHG emissions from energy use in the treatment of the fields and emissions of nitrous oxide from the fertilizers.
Labor and related societal issues are related to changes in farming and forestry practices and in harvesting residues. Ecological effects, primarily destruction of habitat, mainly involve taking marginal lands for energy crops and forest products.
Most impacts from the use of municipal solid waste as a feedstock for electricity are expected to be positive, since the need for landfilling waste and the related potential for runoff to surface waters from landfills is
minimized. However, concerns remain about atmospheric emissions from conversion facilities and land use (siting).
Emissions from the combustion of biomass can include polychlorinated biphenyl compounds, although the focus of recent analysis has been primarily on enclosed systems, such as cook stoves (Gullet et al. 2003). Although damages from biomass-generated electricity on a per-kWh basis might equal or even exceed those from other sources in some cases, the committee has not provided detailed analyses because this technology probably will have only limited market penetration in 2030.
Transportation
Similar to the harvesting of biomass feedstock, transportation of feedstocks has localized impacts. Many facilities use biomass as a feedstock, derived from processes and residues generated on site. Where energy crops or biomass residues are collected away from the location of the power plant, the cost of transportation limits how far from the power plant these low-energy-density feedstocks can be obtained. The impacts associated with transportation are similar to standard transportation impacts associated with vehicle miles driven in terms of air quality impacts, energy penalties, and accidents.
Power Generation
In 2008, not quite 40,000 GWh were generated from wood and wood waste, about 0.9% of the total (see Table 2-1 and associated text). Biomass accounted for about 16,000 GWh (0.3%).
The National Electric Energy Data System indicates that in 2003 there was less than 1.6 GW capacity of biomass-fired power plants in the United States (EPA 2004b). This is a small amount compared with overall generating capacity.
Many of the issues facing biomass combustors are similar to issues faced by larger-scale fossil-fuel generation, although they typically are more localized, because the generators are small, which may limit the control technologies placed on the system. In addition, many of these systems have been in operation since 1937, and therefore presumably “grandfathered” in on some environmental rules.
Air quality is a local issue, particularly for particulate matter from smaller, older combustors. Facility health and safety are important for older facilities.
Siting issues, such as aesthetics, are significant for newer facilities, such as those utilizing municipal solid waste. Citizens can be concerned about aesthetics and possible odors from atmospheric emissions.
For potential new technologies such as biogasifiers and use of liquid fuels derived from bio-oils, other environmental issues are unlikely to be a large factor, but there could be a public perception that these facilities will use feedstock from land that has been clear cut for energy crops, such as tropical oils.
TRANSMISSION AND DISTRIBUTION OF ELECTRICITY
Here, we briefly discuss effects and damages associated with electricity transmission lines. Chapter 6 provides a discussion of security issues associated with interruptions or intermittencies in transmission/transport and distribution systems for electricity and for fuels such coal, oil, and natural gas.
Perceptions exist that high-voltage power lines and substations pose health risks (for example, of childhood leukemias and adult cancers, as well as acute effects) through their emission of extremely low frequency (ELF) electromagnetic radiation, but despite many studies, adverse health effects of transmission lines have not been conclusively established. The World Health Organization recently assessed this issue in detail (WHO 2007), and WHO’s International Agency for Cancer Research addressed it further in 2008 (IARC 2008). The reports conclude that the evidence on some impacts of ELF on human health is inconclusive, including childhood leukemias; and that on other aspects the information leads to the conclusion that there are no adverse effects. The IARC report further concludes that if there are any excess cancer cases the number is very small, and that more than 99% of people are not exposed to enough ELF radiation from transmission lines for there to be a possibility of their suffering increased incidence of cancer.
Transmission lines also have raised concerns—as have various electricity-generating facilities—about loss of property values along and near them due to visual impairment and perceived or actual health risks, as well as possible land-use effects. The loss of property values is not an externality, being instead a market-mediated reflection of real or perceived physical damages. However, the visual impairment or any health risks associated with transmission lines are an externality.
Some renewable sources of energy, especially wind and solar, often need to be sited far from end users, thus requiring more new transmission lines than some other sources would need. For these reasons, proposals for new transmission lines often have been controversial, and managing the need for transmission lines and building new ones is thus a significant policy issue. However, because externalities associated with them appear to be very small by comparison with other aspects of electricity generation, the committee has not considered them in detail.
SUMMARY
This chapter has examined information on burdens, effects, and damages associated with electricity generation from coal, natural gas, nuclear power, wind energy, solar energy, and biomass. In the case of fossil fuel and nuclear power, this discussion includes consideration of the exploration, extraction, and processing of fuel, and the transportation of fuel to generating facilities (upstream externalities) as well as electricity generation and distribution (downstream externalities).52 Some burdens and effects have been discussed in qualitative terms, and others have been quantified and, when possible, monetized.
Our main goal is to examine the uncompensated external costs (and benefits) associated with electricity production. Many external costs have been reduced through regulation: For example, the criteria-air-pollutant damages associated with electricity generation from fossil fuel have been substantially reduced by federal and state regulations over the past 30 years. We examine only those damages that remain. Occupational injuries and deaths are of importance to society, but they do not constitute external costs associated with coal mining and oil and gas production. We therefore do not monetize them and do not add them to external costs, such as the health costs associated with air-pollution emissions.
There are at least two reasons for examining the externalities associated with electricity generation. One is to inform the choice among fuel types when increasing electricity production or replacing existing plants. This is typically done by comparing the external cost per kWh of electricity generation across fuel types. Another reason for examining externalities is to help identify situations where additional regulation may be warranted to reduce the external costs produced by current electricity generation. Identifying sources with large aggregate air-pollutant damages can help identify facilities where further analysis of the costs and benefits of reducing emissions is warranted. This chapter helps to inform both issues.
Electricity from Coal and Natural Gas
In the case of electricity generation from coal and natural gas, we have described the upstream externalities associated with fuel extraction and processing and have quantified the air-pollution damages associated with
electricity generation at 406 coal-fired and 498 gas-fired power plants in 2005. This is based on emissions data from the 2005 National Emissions Inventory and estimates of damages per ton of pollutant from the APEEP model. Damage estimates are based on emissions of SO2, NOx, PM2.5 and PM10 and include impacts on human health, visibility, agriculture and other sectors. The average damage associated with these emissions per kWh at coal plants, weighting plants by the electricity they generate, is 3.2 cents per kWh (2007 USD), using a value of a statistical life (VSL) of $6 million (2000 USD).53 The corresponding figure for gas facilities is 0.16 cents per kWh (2007 USD). However, the distribution of damages per kWh is wide for each set of plants, reflecting variation in the emissions intensity of plants and in their location. As a result, the coal plants with the lowest damages per kWh are cleaner than the natural gas plants with the highest damages per kWh. Specifically, the 9% of natural gas plants with the highest damages per kWh exceed the damages per kWh for the 10% of coal plants with the lowest damages.
The aggregate damages associated with emissions of SO2, NOx, PM2.5, and PM10 from coal generation in 2005 were approximately $62 billion (2007 USD), or $156 million per plant on average. The 50% of plants with the lowest damages per plant, which accounted for 25% of net generation, produced 12% of damages, and the 10% of plants with the highest damages per plant, which also accounted for 25% of net generation, produced 43% of the damages. The situation for gas is similar, although damages per plant are lower: the 10% of natural gas facilities in our sample with the highest damages per plant produce 65% of the air-pollution damages associated with the 498 facilities that we examined.
What are criteria air-pollution damages from coal and natural gas plants likely to be in 2030? To examine damages in 2030 we increase electricity generation at the plants analyzed in 2005 by amount consistent with EIA forecasts of electricity production from coal and natural gas. This implies, on average, a 20% increase in electricity produced from coal and a 9% increase in electricity produced from natural gas. We also assume that the emissions intensity of plants will fall in a manner consistent with EIA estimates of total emissions from fossil fuel plants. The APEEP model was used to estimate damages per ton from SO2, NOx, PM2.5, and PM10 in 2030. In spite of increases in damages per ton of pollutant, due to population and income growth, average damages per kWh (weighted by electricity generation) at coal plants are 1.7 cents per kWh (electricity-weighted),
compared with 3.2 cents per kWh in 2005 (also electricity-weighted). The fall in damages per kWh is explained by the assumption that pounds of SO 2 per MWh will fall by 64% and that NOx and PM emissions per MWh will fall by approximately 50%. Average damage per kWh from gas generation falls to 0.11 cents (2007 USD) from 0.16 cents in 2005 (weighting plants by net generation).
Electricity from Nuclear Power
The committee did not quantify damages associated with nuclear power because the analysis would have involved power-plant risk modeling and spent-fuel transportation modeling that would have taken far greater resources and time than were available for this study. Notwithstanding that this modeling was not undertaken, previous studies suggest that the monetized value of these risks are small (ORNL/RFF 1992-1998; EC 1995b). The upstream damages result largely from uranium mining, most of which occurs outside the United States. With uranium mining in general, radiological exposure can occur through inhalation of radioactive dust particles or radon gas, ingestion of radionuclides in food or water, and direct irradiation from outside the body. For surface mine workers, exposure to radon exposure is generally less important than direct irradiation or dust inhalation; however, exposure to radon can be important for underground miners. If radiological exposure is taken into account in the miners’ wages, it would not be considered an externality. For members of the public, the most significant pathways from an operating mine are radon or other radionuclide ingestion following surface water transport; from a rehabilitated mine, the more significant pathways over the long term are likely to be groundwater as well as surface water transport and bioaccumulation in animals and plants located at the mine site or on associated water bodies. Upstream impacts also include air emissions, including GHG emissions, but they are one or two orders of magnitude smaller than the emissions from coal-fired plants.
Downstream burdens are largely confined to the release of heated water used for cooling—such releases occur at any type of thermal plant—and the production of low-level radioactive wastes (LLRW) and high-level radioactive wastes (HLRW) from spent fuel; release of highly radioactive materials has not occurred on a large scale in the United States (but obviously has occurred elsewhere). Either LLRW is stored for decay to background levels and then disposed of as non-radioactive waste (a practice possible with slightly contaminated materials) or it is disposed of in near-surface landfills designed for radioactive wastes.
For spent nuclear fuel that is not reprocessed and recycled, HLRW is usually stored at the plant site. No agreement has been reached on a geologic repository for HLRW in the United States, and therefore little HLRW is transported for long distances. LLRW has been transported for decades without serious incident. The issue of having a permanent repository is perhaps the most contentious nuclear-energy issue, and considerably more study on the externalities of such a repository is warranted.
Electricity from Wind
Because wind energy does not use fuel, no gases or other contaminants are released during the operation of a wind turbine. Upstream effects are related to the mining, processing, fabrication, and transportation of raw materials and parts; those parts are normally transported to the wind-energy plant’s site for final assembly. The committee concludes that these life-cycle damages are small compared with the life-cycle damages from coal and natural gas. Downstream effects of wind energy include visual and noise effects, the same kinds of land-use effects that accompany the construction of any electricity-generating plant and transportation of electricity, and the killing of birds and bats that collide with the turbines.
Far more birds—by at least three orders of magnitude—are estimated to be killed by collisions with transmission lines, which are associated with all forms of electricity generation, than by collision with wind turbines. Therefore, although the detailed attribution of transmission-line-caused bird deaths by electricity source would be difficult, the committee concludes that bird deaths caused by wind-powered electricity generation are small compared with deaths from all other sources.
Wind-energy installations often have larger footprints than nuclear or coal plants, but the land use within the footprint often is less intensive than within the smaller footprints of thermal plants. In most cases, wind-energy plants do not currently kill enough birds to cause population-level problems except perhaps locally, mainly affecting raptors. The numbers of bats killed and the population consequences of those deaths have not been quantified, but could be significant. If wind-powered energy generation continues to grow as fast as it has recently, bat and perhaps bird deaths could become more important.
The committee has not quantified any effects of solar or biomass generation of electricity, but has not seen evidence that, at current generation capacity, there are effects that are comparable to those from larger sources of electricity generation. However as technology and penetration into the U.S. energy market improves, the externalities from these sources will need to be reevaluated.
Research Recommendations
Many of the significant externalities associated with electricity generation can be estimated quantitatively, but there are several important areas where additional research is needed:
-
Although it appears that upstream and downstream (pre- and post-generation) activities are generally responsible for a smaller portion of the life-cycle externalities than the generation activities themselves for some sources, it would be useful to perform a systematic estimation and compilation of the externalities from these other activities, comparable in completeness to the externality estimates for the generation part of the life cycle. In this compilation, damages from activities that are locally or regionally significant (for example, the storage and disposal of coal combustion by-products, in situ leaching techniques for uranium mining) need to be taken into account.
-
The “reduced-form” modeling of pollutant dispersion and transformation is a key aspect in estimating externalities from airborne emissions, which constitute most of the estimated externalities for fossil-fuel-fired power plants. These models should continue to be improved and tested and compared with the results of more complex models, such as CMAQ.
-
The health effects associated with toxic air pollutants, including specific components of PM, from electricity generation should be quantified and monetized. Because of the importance of VSL in determining the size of air-pollution damages, further exploration is needed of how willingness to pay varies with mortality-risk changes and with such population characteristics as age and health status.
-
For fossil-fuel options, the ecological and socioeconomic impacts of coal mining, for example, of mountaintop removal and valley fill, are a major type of impact in need of further research in to quantify their damages.
-
For nuclear power, the most significant challenges in estimating externalities are appropriately estimating and valuing risks when the probabilities of accidents and of radionuclide migration (for example, at a high-level waste repository) are very low but the consequences potentially extreme, and whether the cost to utilities of meeting their regulatory requirements fully reflects these externalities.
-
The analysis of risks associated with nuclear power in the RFF/ORNL study should be updated to reflect advances in technology and science.
-
For wind technologies, the major issues are in quantifying bird, and especially bat deaths; disturbances to both the local animal populations and landscape; and valuing them in terms comparable to economic damages.
-
For solar, an important need is a life-cycle analysis of the upstream activities that quantifies the possible releases of toxic materials and their damages; another is a better understanding of the externalities that would accompany dedicating tracts of land to solar panels.
-
For transmission lines needed in a transition to a national grid system, better estimates are needed of both the magnitude and the spatial distribution of negative and positive externalities that would accompany this transition.


