
Estimating the Accuracy and Precision of the Digital Caliper and Faro Laser
This appendix presents the datasets available to the Committee for assessing the accuracy and precision of the digital caliper and Faro laser as used in measuring backface deformation (BFD) during body armor testing. As discussed in Chapter 5 and Appendix G, both accuracy and precision are important characteristics in determining the suitability of a measurement system for use in a testing process.
During Phase III, two new data sets were presented to the committee: the side-by-side comparisons of BFD measurements made by the Aberdeen Test Center (ATC) (Table M-1) and the side-by-side comparisons of BFD measurements made by Chesapeake Testing (Table M-2).74 The committee also had access to Walton et al. (2008), which is a summary report of the ATC experimental data from the 228-page ATC experimental data report (Hosto and Miser, 2008). The committee evaluated and reanalyzed data from all of these sources.
SIDE-BY-SIDE COMPARISONS
Tables M-1 and M-2 are datasets that were collected by ATC and Chesapeake Testing. Each measures BFDs created during a test of hard body armor. The ATC data (Table M-1, N = 91) were collected in early 2008 as part of a Program Executive Officer Soldier (PEO Soldier) product data management test. The Chesapeake Testing data (Table M-2, N = 83) were collected in February 2011 during routine PEO-funded R&D testing on a developmental design prototype (different from that used for the ATC data). Chesapeake Testing is a National Institute of Justice (NIJ)-certified ballistics laboratory and is also certified by ATC in the use of the Faro laser. Both data sets were collected using standard test operating procedures. Plots of the two data sets appear in Figures M-1 and M-2.
________________________
74The new data contained in Tables M-1 and M-2 were provided via personal communication between U.S. Army PEO Soldier and Larry G. Lehowicz, committee chair, September 7, 2011.
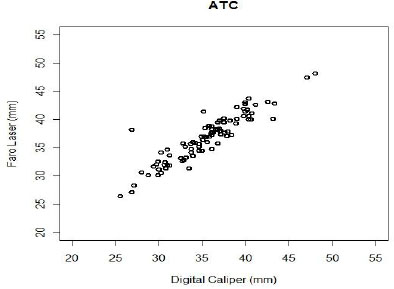
FIGURE M-1 Plot of the paired BFD measurements made by ATC.
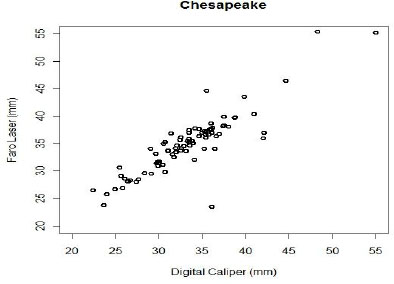
FIGURE M-2 Plot of the paired BFD measurements made by Chesapeake Testing.
Consider first the question of relative accuracy. For the ATC data, the average difference between the laser and caliper measurements is 1.36 mm. Using
a paired t-test, this difference is statistically significantly different from zero (p ![]() .0001). There is an outlier in the data, however, with a difference of 11.647 mm. Removing this data point, the average difference between the laser and caliper measurements is 1.25 mm, with a 95 percent confidence interval of (0.95, 1.54) mm (significantly different from zero, with p
.0001). There is an outlier in the data, however, with a difference of 11.647 mm. Removing this data point, the average difference between the laser and caliper measurements is 1.25 mm, with a 95 percent confidence interval of (0.95, 1.54) mm (significantly different from zero, with p ![]() .0001). For the Chesapeake Testing data, the average difference between the laser and caliper is 1.56 mm, with a 95 percent confidence interval of (0.98, 2.13) mm (significantly different from zero, with p
.0001). For the Chesapeake Testing data, the average difference between the laser and caliper is 1.56 mm, with a 95 percent confidence interval of (0.98, 2.13) mm (significantly different from zero, with p ![]() .0001). These data strongly suggest that the digital caliper and Faro laser may have systematic differences in their measurements of between 1.25 and 1.5 mm, with the laser producing a “deeper” measurement, on average.
.0001). These data strongly suggest that the digital caliper and Faro laser may have systematic differences in their measurements of between 1.25 and 1.5 mm, with the laser producing a “deeper” measurement, on average.
We can also use these data to estimate the precision of the caliper and laser and to test whether the precisions of the two systems are different. A methodology for estimating precision was provided to the committee that depends on making a few assumptions.75 The primary assumption is that the overall variance in each measurement is the sum of the variances of two independent components: that of the underlying “true value,” assumed common to the two measurements, and the method-specific “measurement error.” A second assumption is that the collections of measurements are roughly normal and free from outliers. It is only with roughly normally distributed observations that simple variance calculations can be relied on. Further, if outliers are present, they can distort calculations of variance and lead to incorrect conclusions. This second assumption is reasonable for the ATC data and questionable for the Chesapeake Testing data.
For the ATC data, one can calculate the variance of the laser measurements (18.0), of the caliper measurements (18.9), of the laser measurement less the caliper measurement (3.07), and of the laser plus the caliper measurements (70.7). Assume that
L = T + e
C = T + f
where L and C are the observed laser and caliper measurements, T is the true but unknown measurement value, and e and f are the laser and caliper measurement errors, respectively. Assume that T, e, and f are mutually independent and identically distributed with true variances Var(T), Var(e) and Var(f) respectively. We observe a small systematic difference in the two measurements, which, as long as it is constant, can be absorbed into the mean of the errors. That is, we assume the errors have constant, not necessarily zero means. It is an easy consequence of these equations and assumptions that the following hold:
Var(L) = Var(T) + Var(e),
Var(C) = Var(T) + Var(f),
Var(L - C) = Var(e) + Var(f),
Var(L + C) = 4Var(T) + Var(e) + Var(f)
________________________
75The methodology was suggested by Terry Speed, University of California, Berkeley, to member Thomas Budinger in a personal communication, December 1, 2011.
Now we calculate the observed variances Var(L), Var (C), Var( L - C), and Var(L + C) of these four quantities and use them and the above equations to obtain unbiased estimates of Var(e) and Var(f).We take the difference between Var(L + C) and Var(L - C) and divide by 4: this estimates Var(T). Then we subtract this quantity from Var(L) and Var(C) to give estimates of Var(e) and Var(f).
Using this methodology, the estimate of the variance of the caliper is 1.99; the precision (standard deviation) is 1.41 mm, with a bootstrapped approximate 95 percent confidence interval of (0.38, 2.11) mm. The estimate of the variance of the laser is 1.09; the precision (standard deviation) is 1.04 mm, with a bootstrapped approximate 95 percent confidence interval of (0, 1.52) mm.
Because of the possible presence of outliers, the results from the Chesapeake Testing data are less reliable. However, using the same methodology, one can calculate the variance of the laser + part (29.0), the caliper + part (27.8), laser – caliper (6.9), laser + caliper (106.6). The estimate of the variance of the caliper is 2.83; the precision is 1.68 mm, with a bootstrapped approximate 95 percent confidence interval of (0, 2.47) mm. The estimate of the variance of the laser is 4.09; the precision (standard deviation) is 2.02 mm, with a bootstrapped approximate 95 percent confidence interval of (0, 3.11) mm.
Testing formally for equality of variance between the variances of the two columns (digital caliper and laser arm) in each dataset using the Pitman-Morgan test on the ATC data and nonparametric test of Sandvik and Olsson (1982) on the Chesapeake Testing data, one does not reject the null hypothesis of equal variances.
However, the probability that the data can support a conclusion that there is no significant difference between the variances of the two measurement systems is very low; that is, the statistical power for the design of the side-by-side tests is low. Power is the probability a test will reject the null hypothesis for a specific effect size, and it depends on both the effect size and the sample size. With N = 91, the power to detect the difference in precision (square root of variance) of the laser and the caliper of the size estimated by Walton et al. (2008) is only 12 percent. Thus the currently available data cannot be construed as evidence that the variances of the two measurement systems are similar.
The side-by-side ballistic tests do provide important information about the bias or absolute accuracy of the test instruments. The tests reported here reveal significant differences in accuracy. While they reveal differences in accuracy, side-by-side tests such as those reported here cannot be definitive as to which (if either) system provides desirable accuracy. The consequences of having an inaccurate test instrument on body armor testing are discussed in Chapter 5 and Appendix G. The accuracy issue is separate from the issue of relative precision. Side-by-side procedures can also provide some information about precision of the measurement procedures, although larger and more carefully designed studies are needed to provide definitive results about precision. A formal gauge repeatability and reproducibility study for the laser, caliper, and other potential measuring instruments is needed to provide reliable information about both accuracy and precision (see Recommendation 5-3).
ASSESSMENT OF OTHER TESTING RESULTS
In this section the committee assesses the results from Walton et al. (2008) and Hosto and Miser (2008) and estimates confidence limits for specific quantities. These data were collected using a different experimental design than the side-by-side data. Four BFDs were created in a mounting box using a mold. Quoting from Walton et al. (2008), “These clay molds, made from actual indentations in clay during body armor testing, had very rough surfaces, which showed the individual thread impressions from the Kevlar ‘Soft Body Armor’ backing. The molds also had remnants of small ‘fissures’ that typically form in the clay during the rapid deformation of ballistic testing.” These mold-created BFDs were then repeatedly measured by various operators and instruments.
Faro Laser Precision
The original data for these estimates come from Hosto and Miser (2008). The Faro data, from Tables B-20a (depth, mm, deepest point column) in the report, are shown in Table M-3 of this appendix.
Table 2 of the NRC Phase I letter report (NRC, 2009), using the results of Walton et al. (2008), estimated the precision of the Faro laser as 0.0970 mm:
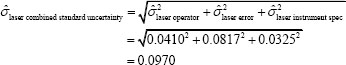
The data contain information only about the variation in the operator and the error. Here the statistical uncertainty of the laser is defined as:
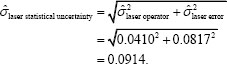
Using a parametric bootstrap, the committee estimates a 95 percent confidence interval for the laser statistical uncertainty as (0.042, 0.141) mm. Taking the upper end of the confidence interval as a worst case estimate, the actual laser precision is highly likely to be less than
![]()
Digital Caliper Precision
The digital caliper data, reproduced from Table B-21a (deepest point, mm, corrected depth column) in Hosto and Miser (2008), are shown here as Table M-4.
Table 2 of the NRC (2009), again using Walton et al. (2008), estimated the precision of the caliper as 0.823 mm:
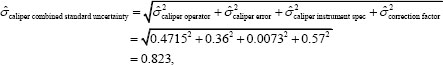
Because the data contain information only about the variation in the operator and the error, the “statistical uncertainty” corresponds to the first two terms. The correction factor term, which is unique to the caliper, accounts for the uncertainty in the correction methodology when the deepest point is different from the aim point. (This difference is called an “offset.”)
The caliper statistical uncertainty is
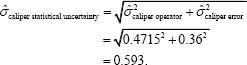
We can estimate a 95 percent confidence interval for the caliper statistical uncertainty of (0.367, 0.825) mm. Taking the lower end point of the interval as the caliper best case for statistical uncertainty, we estimate
![]()
Turning to the correction factor term, consider the 0.57 mm uncertainty associated with the postmeasurement correction made to adjust the caliper measurements (“how a caliper measurement of a deepest point needs to be corrected to find the actual depth to the local pristine surface”). Walton et al. (2008) documents its derivation in that report’s Appendix B. The correction is geometrically derived, and its uncertainty is estimated using the delta method, a standard statistical methodology for estimating the variances from complex functions. Walton et al. (2008) says that “in practice, using aim-points to reference depth measurements introduces multiple uncertainties (see Appendix B for quantification), which are found in the assumed and measured values of slope, offset, shot location on the plate and slope of the impacted surface (not quantified in this analysis).”
The data used by Walton et al. to assess this variation are from the Phase I testing of plates in 2008, not from the data in Hosto and Miser (2008).76 The committee finds the calculation to have been done in a reasonable and correct manner.
Issues with Walton et al.
Resolution of the following issues with Walton et al. (2008) would be accomplished as part of the gauge repeatability and reproducibility studies of measuring instruments mentioned earlier and is embodied in Recommendation 5-3.
Caliper measurements were replicated while laser measurements were not.
Obviously, this is not ideal when trying to assess measurement precision. However, from the data we do have, we can estimate several components of variation. These results are taken from Table 12 of Walton et al. (2008) (with calculations replicated by the committee) or were additionally calculated by the committee.
The variation attributable to the different indentations has standard deviation 5.28 mm, the variation attributable to different operators (σ 2 laser operator) has standard deviation 0.040 mm, and the variation attributable to a lack of repeatability measurement-to-measurement (σ 2 laser error) has standard deviation 0.082 mm. If we calculate a 95 percent confidence interval for the measurement-to-measurement repeatability using these data, it is (0.045, 0.114) mm.
The measurement-to-measurement repeatability of the data is estimated using the measurements that operators make on different indentations. Without replicates, we cannot assess whether the repeatability of the operators is the same when they are measuring the same indentation multiple times as when they are measuring different indentations. However, if we make the assumption that these two variances are the same, then adding replicates does not change our variance estimate.
Sample sizes are small.
The sample sizes in the side-by-side data and the Walton et al. (2008) study are not directly comparable due to differences in study design. However, calculating confidence intervals for precision and accuracy takes into account both sample size and design differences.
________________________
76Rick Sayre, Deputy Director, OSD DOT&E Live Fire Test and Evaluation, and Tracy Sheppard, Executive Officer & Staff Specialist, OSD DOT&E, “DoD In Brief to the National Research Council Study Team,” presentation to the committee, November 30, 2009.
Offsets used by Walton are excessively large.
The offsets reported in the data tables in Hosto and Miser (2008) have different statistical features from those used to calculate precision as reported in Appendix B of Walton et al. (2008). In the latter, it is reported that the 95 percent quantile of N = 654 offsets from an operationally realistic data set made up of XSAPI of all sizes first-shot data is 0.5512 in. (14 mm). The absolute value of the offsets from Realistic Clay III as reported in Hosto and Miser (2008) are shown in Figure M-3. There are two clusters of data: those below 0.5 in. are from measuring Indent 2, and those above 0.5 in. are from measuring the remaining three indents.
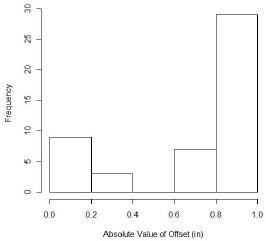
FIGURE M-3 Absolute value of offsets for caliper measurements from Realistic Clay III.
It is difficult to assess the impact that these differences could have on the accuracy and precision estimated for the caliper, although we can use the results of Walton et al. (2008) to explore the effect of some excursions. Appendix B of Walton et al. (2008) derived the 0.57 mm uncertainty associated with the postmeasurement correction using the delta method, a standard statistical approach for estimating the variance of complicated statistics—in this case, the variability for the correction factor.
One way to gain some insight into how other operationally realistic data would have affected the uncertainty estimate is to replace the Walton offset mean and variance used in the Appendix B delta method calculations with the equivalents from the ATC side-by-side data. During live-fire tests in 2008, ATC
listed 41 offset measurements with a mean of 3.7 mm and a standard deviation of 3.6 mm.
Recomputing the correction factor uncertainty using these 41 edge-shot data points in place of the quantities used in Appendix B (offset 14 mm and standard deviation 0.81 mm) actually increases the correction factor uncertainty from 0.57 mm to 0.896 mm. This is because, while the mean offset is larger in Appendix B than for the ATC data, the standard deviation is substantially smaller. The latter drives the magnitude of the estimated correction factor uncertainty more than the former.
The previous calculations included 17 shots with a zero offset. One might suggest that for those shots there is no uncertainty due to the correction factor and, furthermore, that their inclusion artificially inflates the standard deviation for the nonzero offsets. Removing the data for these 17 shots results in a mean offset of 6.3 mm with a standard deviation of 2.4 mm. Recalculating using these values results in a correction factor uncertainty of 0.723, which is still larger than the Walton et al. (2008) value of 0.57 mm.
So, while intuition would suggest that smaller magnitude offsets result in improved caliper precision, using the offset mean and standard deviations from the ATC data, which has a smaller mean offset but a larger standard deviation, results in a larger uncertainty estimate.
Measurements in Walton et al. (2008) were on clay indents produced from molds of clay impressions that were made from ballistic experiments, not on actual ballistically induced clay impressions.
An advantage of this procedure is that the mold becomes a more-or-less permanent artifact that allows replicate measurements by laser, caliper, or other devices after proper validation. In its Recommendation 5-2, the committee suggests that a standard BFD artifact should be developed to assist in the assessment of measurement systems.
The Walton et al. (2008) data were not measured at 100°F.
As discussed in the report, the temperature of the clay can have an impact on the depth of the BFD created during operational testing. However, the temperature of the clay should not have an impact on the measurement precision of either the laser or the caliper because the shape and surface characteristics of the clay impression are determined by the characteristics of the mold. Those characteristics did depend on the temperature of the clay when the indents were made, and they should have been made under operational conditions. But the temperature of the clay should not have an impact on the measurement precision of either the laser or the caliper. This can be empirically verified as required.
The average caliper BFD measurement was greater than the average laser BFD measurement.
This is the reverse of what was observed in the side-by-side analysis and what has been reported to the committee as a generally observed phenomenon. The smoothing algorithm used to generate the Walton (2008) data was not specified:
| Indent 1 |
Indent 2 |
Indent 3 |
Indent 4 |
|
| Laser | 29.8 | 39.8 | 34.5 | 41.4 |
| Caliper | 33.5 | 40.2 | 36.4 | 41.3 |
This demonstrates reversal of the direction. Note that in calculations of precision, the sample means are subtracted from the data as variation is calculated around the sample mean.
Deriving the “Factor of 10” Heuristic
Let Z be the observed BFD, which is the sum of the true (but unobservable) BFD, Y, and the instrument measurement error X: Z = Y + X. Assume that Y does not affect X and vice versa. Then the variance of the observed BFD (Z) is the sum of the variances of the true BFD and measurement error—that is,
![]()
Now, we want instrument precision to have a negligible effect on the variation of the observed BFD. That is, we want σZ ≒ σY. This is achieved when σX![]() 0.1σY (equivalently, 10σX
0.1σY (equivalently, 10σX ![]() σY), as follows. Given we want
σY), as follows. Given we want ![]() divide both sides by σY and substitute σx = 0. 1σY to get
divide both sides by σY and substitute σx = 0. 1σY to get ![]() , or
, or ![]()
So, as long as the precision of the measuring instrument is less than one-tenth of the variation in the actual BFDs, the measurement instrument only negligibly increases the variation in the observed BFD, where “negligible” is defined as ? 0.005. For the current clay process with an observed BFD standard deviation of 3.5-4.5 mm or so, this means the precision of the measuring instrument, in terms of its standard deviation, should be no greater than 0.3 to 0.4 mm.
In Chapter 5, the precision requirement was relaxed to 0.5 mm. The committee estimated something on the order of a 1 percent increase in BFD variation attributable to the measurement instrument ![]() and
and ![]() While that sounds quite small, Appendix G went on to
While that sounds quite small, Appendix G went on to
examine the effect of relaxing instrument precision further on the likelihood of making decision errors under the Office of the Director, Operational Test and Evaluation test protocol. That part of the analysis found that relaxing the precision any further than 0.5 mm unacceptably increased the probability of accepting bad body armor and rejecting good armor.
The committee wishes to emphasize that the above derivation of the heuristic is dependent only on assuming the actual BFDs are independent of the instrument measurement error. It is not dependent on the assumption of normality of the BFDs, nor is it dependent on any information from the Walton (2008) study and its supporting data.
REFERENCES
Hosto, J., and C. Miser. 2008. Quantum FARO Arm Laser Scanning Body Armor Back Face Deformation. Report No. 08-MS-25. Aberdeen Proving Ground, Md.: Aberdeen Test Center Warfighter Directorate, Applied Science Test Division, Materials and Standards Testing Team.
NRC. (National Research Council). 2009. Phase I Report on Review of the Testing of Body Armor Materials for Use by the U.S. Army: Letter Report. Washington, D.C.: National Academies Press.
Sandvik, L. and B. Olsson. 1982. A nearly distribution free test for comparing dispersion in paired samples. Biometrika 69(2):484-485.
Walton, S., A. Fournier, B. Gillich, J. Hosto, W. Boughers, C. Andres, C. Miser, J. Huber, and M. Swearingen. 2008. Summary Report of Laser Scanning Method Certification Study for Body Armor Backface Deformation Measurements. Aberdeen Proving Ground, Md.: Aberdeen Test Center.
TABLE M-1 Side-by-Side Comparison of BFD Measurements by ATC
Data Number |
Digital Caliper (mm) |
Laser Arm, Smoothed (mm) |
| 39.92 | 41.398 | |
| 35.79 | 38.931 | |
| 35.74 | 38.92 | |
| 31.19 | 33.656 | |
| 29.94 | 32.526 | |
| 34.61 | 35.169 | |
| 30.68 | 32.412 | |
| 36.76 | 38.224 | |
| 32.68 | 32.623 | |
| 0 | 36.78 | 35.804 |
| 1 | 26.87 | 38.187 |
| 2 | 34.63 | 35.714 |
| 3 | 37.46 | 39.456 |
| 4 | 28.03 | 30.61 |
| 5 | 37.58 | 37.71 |
| 6 | 35.34 | 38.503 |
| 7 | 30.99 | 34.638 |
| 8 | 37.51 | 40.232 |
| 9 | 40.33 | 43.751 |
| 0 | 34.86 | 37.006 |
| 1 | 40.38 | 40.047 |
| 2 | 30.27 | 34.191 |
| 3 | 35.22 | 37.017 |
| 4 | 29.99 | 31.114 |
| 5 | 33.61 | 35.71 |
| 6 | 33.09 | 33.268 |
| 7 | 36.57 | 38.336 |
| 8 | 39.88 | 43.044 |
| 9 | 38.96 | 42.177 |
| 0 | 37.14 | 37.344 |
| 1 | 31.17 | 31.874 |
| 2 | 28.81 | 30.112 |
| 3 | 30.99 | 31.905 |
| 4 | 38.97 | 40.094 |
| 5 | 43.29 | 42.804 |
| 6 | 38.18 | 39.775 |
| 7 | 36.08 | 37.664 |
| 8 | 39.9 | 42.756 |
| 9 | 35.02 | 36.424 |
| 0 | 36.97 | 39.788 |
| 1 | 39.74 | 40.598 |
| 2 | 35.8 | 37.023 |
| 3 | 42.54 | 43.165 |
| 4 | 27.12 | 28.307 |
| 5 | 40.18 | 41.751 |
| 6 | 34.58 | 34.469 |
| 7 | 29.94 | 30.144 |
| 8 | 48.04 | 48.131 |
| 9 | 36.11 | 38.75 |
| 0 | 33.48 | 31.311 |
| 1 | 30.58 | 31.988 |
| 2 | 30.78 | 31.344 |
| 3 | 36.93 | 38.403 |
| 4 | 29.38 | 31.617 |
| 5 | 37.1 | 38.029 |
| 6 | 36.12 | 37.304 |
| 7 | 34.95 | 34.496 |
| 8 | 34.16 | 35.909 |
| 9 | 32.87 | 32.859 |
| 0 | 36.06 | 34.779 |
| 1 | 26.84 | 27.09 |
| 2 | 33.9 | 33.583 |
| 3 | 33.77 | 34.147 |
| 4 | 30.26 | 30.552 |
| 5 | 29.75 | 32.086 |
| 6 | 33.88 | 35.969 |
| 7 | 47.1 | 47.497 |
| 8 | 36.02 | 37.586 |
| 9 | 40.37 | 40.598 |
| 0 | 35.59 | 35.941 |
| 1 | 38.36 | 37.334 |
| 2 | 32.53 | 33.185 |
| 3 | 25.53 | 26.371 |
| 4 | 33.73 | 34.724 |
| 5 | 37.05 | 37.961 |
| 6 | 40.73 | 41.137 |
| 7 | 33.02 | 35.199 |
| 8 | 36.78 | 39.462 |
| 9 | 40.58 | 39.999 |
| 0 | 40.16 | 41.819 |
| 1 | 37.93 | 37.881 |
| 2 | 37.79 | 37.087 |
| 3 | 39.73 | 41.94 |
| 3 | 43.17 | 40.157 |
| 5 | 35.52 | 36.928 |
| 6 | 35.17 | 41.413 |
| 7 | 36.12 | 38.33 |
| 8 | 32.8 | 35.736 |
| 9 | 36.24 | 37.67 |
| 0 | 38.85 | 39.256 |
| 1 | 41.1 | 42.662 |
TABLE M-2 Side-by-Side Comparison of BFD Measurements by Chesapeake Testing
| BFD Data Number |
Digital Caliper (mm) |
Faro Laser Arm (mm) |
| 1 | 32.9 | 34.6 |
| 2 | 35.7 | 36.7 |
| 3 | 30.5 | 35 |
| 4 | 38.8 | 39.8 |
| 5 | 33.5 | 37 |
| 6 | 35.4 | 36.7 |
| 7 | 33.9 | 35.1 |
| 8 | 35 | 37 |
| 9 | 31 | 33.7 |
| 10 | 31.4 | 36.9 |
| 11 | 29.1 | 29.5 |
| 12 | 32.5 | 33.8 |
| 13 | 26.4 | 28.1 |
| 14 | 33.5 | 35.3 |
| 15 | 33.3 | 35.5 |
| 16 | 25.6 | 29.1 |
| 17 | 32 | 33.5 |
| 18 | 26.1 | 28.6 |
| 19 | 22.4 | 26.5 |
| 20 | 29 | 34.1 |
| 21 | 31 | 33.8 |
| 22 | 26.7 | 28.3 |
| 23 | 34.1 | 32.1 |
| 24 | 30.7 | 29.8 |
| 25 | 36.4 | 34.1 |
| 26 | 37 | 36.8 |
| 27 | 31.6 | 33.1 |
| 28 | 31.9 | 34.2 |
| 29 | 24.9 | 26.7 |
| 30 | 42 | 36 |
| 31 | 32.4 | 35.7 |
| 32 | 48.3 | 55.4 |
| 33 | 37.5 | 39.9 |
| 34 | 34.6 | 36.4 |
| 35 | 30.7 | 35.3 |
| 36 | 35.8 | 37.6 |
| 37 | 37.4 | 38.2 |
| 38 | 27.4 | 28 |
| 39 | 29.7 | 31.4 |
| 40 | 42.1 | 37 |
| 41 | 29.9 | 30.9 |
| 42 | 27.6 | 28.5 |
| 43 | 36.6 | 36.4 |
| 44 | 35.2 | 34.1 |
| 45 | 39.8 | 43.5 |
| 46 | 36 | 38.7 |
| 47 | 25.5 | 30.6 |
| 48 | 31.9 | 33.5 |
| 49 | 32.6 | 34.2 |
| 50 | 30.4 | 31.1 |
| 51 | 36.1 | 23.5 |
| 52 | 25.8 | 26.9 |
| 53 | 28.3 | 29.6 |
| 54 | 24 | 25.8 |
| 55 | 29.8 | 31.6 |
| 56 | 37.5 | 38.3 |
| 57 | 38 | 38.1 |
| 58 | 29.6 | 33.2 |
| 59 | 30 | 31.7 |
| 60 | 38.7 | 39.7 |
| 61 | 35.2 | 37.3 |
| 62 | 23.6 | 23.8 |
| 63 | 32.1 | 34.7 |
| 64 | 31.7 | 32.6 |
| 65 | 33.5 | 35.9 |
| 66 | 44.6 | 46.5 |
| 67 | 36 | 37.6 |
| 68 | 34.6 | 37.7 |
| 69 | 32.5 | 36.2 |
| 70 | 33.8 | 35.5 |
| 71 | 35.4 | 37.1 |
| 72 | 41 | 40.4 |
| 73 | 33.6 | 34.7 |
| 74 | 36.2 | 37.9 |
| 75 | 33.6 | 35.3 |
| 76 | 35.5 | 44.6 |
| 77 | 55 | 55.2 |
| 78 | 34.2 | 37.8 |
| 79 | 33.1 | 33.7 |
| 80 | 36 | 37.7 |
| 81 | 35.4 | 36.1 |
| 82 | 33.5 | 37.5 |
| 83 | 36.1 | 37 |
TABLE M-3 Faro Data
| Operator (i) | Impression (j) 1 |
2 | 3 | 4 |
| 1 | 29.8130440 | 39.753433 | 34.436170 | 41.442090 |
| 2 | 29.8898140 | 39.724725 | 34.581093 | 41.414619 |
| 3 | 29.8399260 | 39.951892 | 34.724191 | 41.442222 |
| 4 | 29.8008041 | 39.828403 | 34.407924 | 41.457630 |
SOURCE: Hosto and Mister, 2008.
TABLE M-4 Caliper Data
| Impression (j) | ||||||
| Operator (i) Operator (i) | 1 | 2 | 3 | 4 | ||
| 1 | a | 33.12 | 40.87 | 36.65 | 42.05 | |
| b | 32.97 | 40.74 | 35.77 | 41.49 | ||
| c | 33.50 | 41.32 | 36.44 | 40.57 | ||
| 2 | a | 33.56 | 39.48 | 37.05 | 41.12 | |
| b | 33.57 | 39.56 | 36.95 | 40.92 | ||
| c | 33.84 | 39.53 | 37.28 | 41.22 | ||
| 3 | a | 33.15 | 40.72 | 35.45 | 41.43 | |
| b | 33.17 | 40.58 | 35.62 | 41.68 | ||
| c | 33.31 | 40.60 | 35.7 | 41.67 | ||
| 4 | a | 33.69 | 39.77 | 36.76 | 40.85 | |
| b | 34.11 | 38.85 | 36.81 | 40.91 | ||
| c | 33.81 | 40.36 | 36.85 | 41.39 | ||
SOURCE: Hosto and Mister, 2008.
This page intentionally left blank.


