
Appendix C
Supporting Material for Chapter 4
The following disclaimer is for Figures C-1, C-3, C-4, C-5, C-12a, C-12b, C13a, C-13b, and C-14a.
Copyright © and (P) 1988-2006 Microsoft Corporation and/or its suppliers. All rights reserved. http://www.microsoft.com/mappoint/. Portions © 1990–2005 InstallShield Software Corporation. All rights reserved. Certain mapping and direction data © 2005 NAVTEQ. All rights reserved. The Data for areas of Canada includes information taken with permission from Canadian authorities, including: © Her Majesty the Queen in Right of Canada, © Queen's Printer for Ontario. NAVTEQ and NAVTEQ ON BOARD are trademarks of NAVTEQ. © 2005 Tele Atlas North America, Inc. All rights reserved. Tele Atlas and Tele Atlas North America are trademarks of Tele Atlas, Inc.
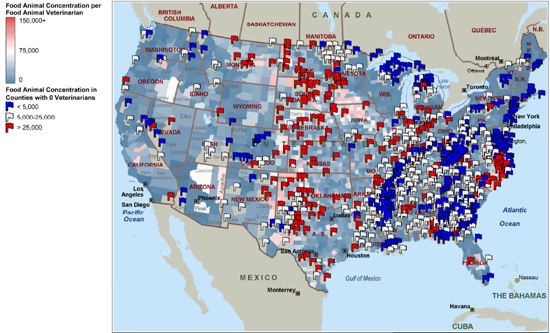
FIGURE C-1 Food-animal concentrations in counties that have no veterinarians. SOURCE: American Veterinary Medical Association (2006b).
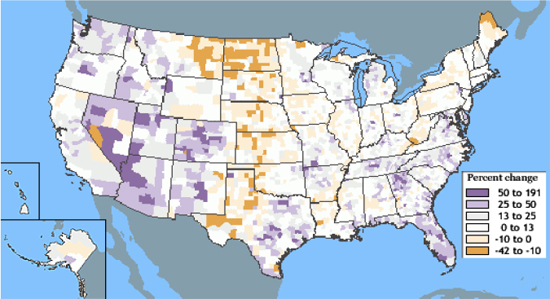
FIGURE C-2 Changes in population growth between 1990 and 2000 for the 3,141 counties and equivalent areas in the United States.1 SOURCE: National Atlas of the United States. 2011. Adapted from U.S. Census Bureau, Population Change and Distribution: 1990 to 2000. M.J. Perry and P.J. Mackun (with J.D. Baker, C.D. Joyce, L.R. Lollock, and L.S. Pearson) in Census 2000 Brief Series. 2001.
_________________________
1 A band of counties that lost population—in some cases declining more than 10 percent—stretches across the Great Plains States from the Mexican border to the Canadian border.
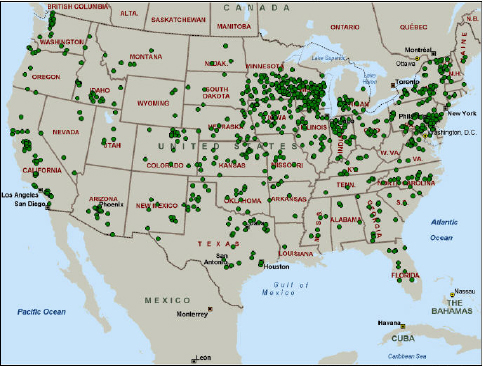
FIGURE C-3 Distribution of the 1,011 food-animal-exclusive veterinarians in the United States, 2007.2 SOURCE: American Veterinary Medical Association (2008).
_________________________
2 Distribution is not uniform but is concentrated in areas of the country with high animal densities, particularly in traditional dairy states. Some 46% are in six leading dairy states: California, Wisconsin, New York, Pennsylvania, Minnesota, and Idaho. That suggests that FAexclusive veterinarians are mainly dairy practitioners. Populations of FA-exclusive veterinarians in Iowa, Illinois, Missouri, and North Carolina correspond to concentrations of swine industry, those in Georgia and neighboring states to broiler industry. Because of low animal densities, there are very few FA-exclusive veterinarians in North Dakota, Montana, and Wyoming.
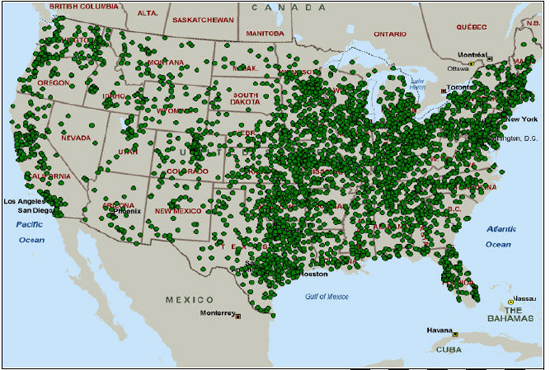
FIGURE C-4 Distribution of the 4,200 mixed-food-animal veterinarians in the United States, 2007.3 SOURCE: American Veterinary Medical Association (2008).
_________________________
3 Distribution closely parallels that of US population.
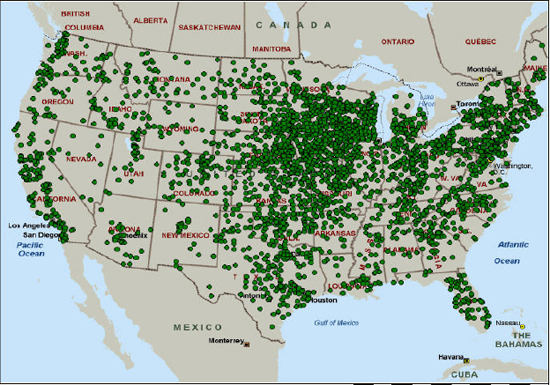
FIGURE C-5 Distribution of the 3,861 food-animal-predominant veterinarians in the United States, 2007.4 SOURCE: American Veterinary Medical Association (2008).
_________________________
4 FA-predominant veterinarians are most numerous in the grain states of Midwest. Largest numbers are in Iowa and Minnesota.
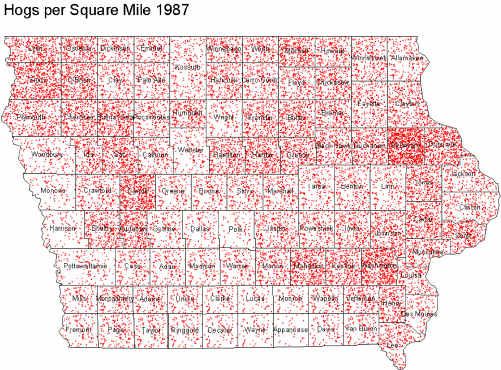
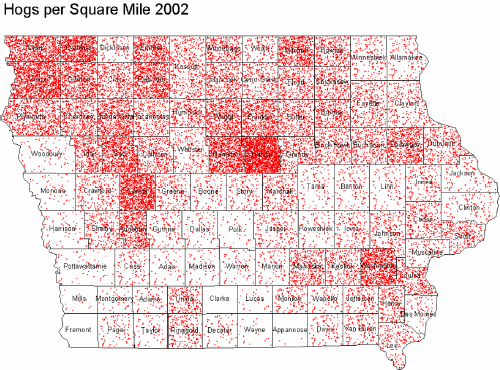
FIGURE C-8 The changing pork industry in Iowa, 1987 and 2002. SOURCE: Honeyman and Duffy, 2006. Reprinted with permission of M. Honeyman, Iowa State University.
TABLE C-1 Food-Animal Workforce, 2001-2007, by State
| State | Food-animal exclusive and food-animal-predominant veterinarians | Mixed-food-animal veterinarians | ||||||
| Year | Year | |||||||
| 2001 | 2007 | Change | % change | 2001 | 2007 | Change | % change | |
| AL | 42 | 27 | -15 | -36 | 70 | 67 | -3 | -4 |
| AR | 46 | 44 | -2 | -4 | 82 | 87 | 5 | 6 |
| AZ | 58 | 51 | -7 | -12 | 35 | 38 | 3 | 8 |
| CA | 304 | 261 | -43 | -14 | 151 | 195 | 44 | 29 |
| CO | 176 | 155 | -21 | -12 | 100 | 115 | 15 | 15 |
| CT | 22 | 18 | -4 | -18 | 18 | 28 | 10 | 55 |
| DE | 2 | 6 | 4 | 200 | 4 | 4 | 0 | 0 |
| FL | 99 | 85 | -14 | -14 | 101 | 114 | 13 | 13 |
| GA | 73 | 69 | -4 | -5 | 99 | 100 | 1 | 1 |
| IA | 439 | 382 | -57 | -13 | 118 | 132 | 14 | 12 |
| ID | 110 | 110 | 0 | 0 | 62 | 64 | 2 | 3 |
| IL | 175 | 133 | -42 | -24 | 123 | 158 | 35 | 28 |
| IN | 136 | 102 | -34 | -25 | 96 | 104 | 8 | 8 |
| KS | 193 | 162 | -31 | -16 | 153 | 172 | 19 | 12 |
| KY | 106 | 93 | -13 | -12 | 111 | 114 | 3 | 2 |
| LA | 42 | 35 | -7 | -16 | 64 | 69 | 5 | 8 |
| MA | 30 | 24 | -6 | -20 | 30 | 33 | 3 | 10 |
| MD | 54 | 42 | -12 | -22 | 40 | 55 | 15 | 37 |
| ME | 18 | 17 | -1 | -5 | 27 | 29 | 2 | 7 |
| MI | 137 | 122 | -15 | -11 | 104 | 97 | -7 | -6 |
| MN | 350 | 320 | -30 | -8 | 84 | 109 | 25 | 30 |
| MO | 217 | 174 | -43 | -20 | 168 | 178 | 10 | 6 |
| MS | 35 | 35 | 0 | 0 | 72 | 76 | 4 | 5 |
| MT | 113 | 97 | -16 | -14 | 55 | 69 | 14 | 25 |
| NC ND | 92 71 | 90 72 | -2 1 | -2 1 | 71 21 | 79 27 | 8 6 | 11 28 |
| NE | 259 | 225 | -34 | -13 | 64 | 75 | 11 | 17 |
| NH | 14 | 12 | -2 | -14 | 32 | 34 | 2 | 6 |
| NJ | 25 | 16 | -9 | -35 | 14 | 24 | 10 | 71 |
| NM | 45 | 36 | -9 | -20 | 53 | 55 | 2 | 4 |
| NV | 20 | 23 | 3 | 15 | 21 | 19 | -2 | -9 |
| NY | 203 | 179 | -24 | -11 | 118 | 128 | 10 | 8 |
| OH | 170 | 148 | -22 | -7 | 141 | 170 | 29 | 21 |
| OK | 161 | 134 | -27 | -16 | 147 | 154 | 7 | 4 |
| OR | 85 | 70 | -15 | -17 | 92 | 120 | 28 | 30 |
| PA | 204 | 208 | 4 | 2 | 114 | 141 | 27 | 24 |
| RI | 2 | 1 | 1 | -50 | 1 | 3 | 2 | 200 |
| SC | 20 | 23 | 3 | 15 | 41 | 35 | -6 | 15 |
| SD | 145 | 144 | -1 | 0 | 29 | 34 | 5 | 17 |
| TN | 73 | 66 | -7 | -9 | 117 | 117 | 0 | 0 |
| TX | 340 | 289 | -51 | -15 | 444 | 452 | 8 | 2 |
| UT | 40 | 40 | 0 | 0 | 25 | 45 | 20 | 80 |
| VA | 82 | 78 | -4- | -5 | 69 | 73 | 4 | 6 |
| VT | 41 | 40 | -1 | -2 | 25 | 48 | 23 | 92 |
| WA | 108 | 94 | -14 | -12 | 106 | 103 | -3 | -2 |
| WI | 496 | 460 | -36 | -7 | 89 | 110 | 21 | 23 |
| WV | 20 | 19 | -1 | -2 | 20 | 23 | 3 | 15 |
| WY | 54 | 43 | -11 | -20 | 57 | 63 | 6 | 10 |
| Total | 5747 | 5074 | 671 | -12 | 3878 | 4339 | 460 | 11 |
SOURCE: American Veterinary Medical Association.
TABLE C-2a Food-Animal-Exclusive Veterinarians: Mean Ages and Percentage Over Age 50, by State
| State | Total | Mean Age | Count over 50 | Percentage over 50 |
| LA | 1 | 31.00 | 0 | 0 |
| MA | 1 | 0 | 0 | |
| NJ | 1 | 47.00 | 0 | 0 |
| VI | 1 | 47.00 | 0 | 0 |
| WV | 2 | 28.00 | 0 | 0 |
| AL | 4 | 40.75 | 1 | 25.0 |
| CT | 4 | 43.00 | 1 | 25.0 |
| MN | 74 | 43.97 | 22 | 29.7 |
| ID | 36 | 44.89 | 11 | 31.4 |
| GA | 12 | 46.83 | 4. | 33.3 |
| KY | 12 | 44.75 | 4 | 33.3 |
| NC | 21 | 50.67 | 7 | 33.3 |
| SC | 3 | 49.00 | 1 | 33.3 |
| AZ | 17 | 45.41 | 6 | 35.3 |
| NE | 22 | 46.36 | 8 | 36.4 |
| MD | 16 | 46.81 | 6 | 37.5 |
| MI | 29 | 45.03 | 11 | 37.9 |
| CA | 89 | 46.13 | 34 | 38.2 |
| CO | 33 | 47.82 | 13 | 39.4 |
| PA | 74 | 44.95 | 30 | 40.5 |
| NM | 11 | 45.82 | 5 | 45.5 |
| WI | 159 | 47.66 | 74 | 47.1 |
| IA | 53 | 46.47 | 25 | 47.2 |
| IL | 26 | 46.19 | 13 | 50.0 |
| ND | 4 | 45.75 | 2 | 50.0 |
| SD | 12 | 46.92 | 6 | 50.0 |
| TN | 6 | 48.93 | 3 | 50.0 |
| WY | 3 | 47.00 | 1 | 50.0 |
| OH | 15 | 47.00 | 8 | 53.3 |
| OK | 13 | 50.38 | 7 | 53.8 |
| KS | 25 | 49.60 | 14 | 56.0 |
| WA | 25 | 50.12 | 14 | 56.0 |
| TX | 48 | 49.67 | 27 | 56.3 |
| NY | 49 | 48.90 | 28 | 58.3 |
| OR | 12 | 51.67 | 7 | 58.3 |
| VT | 17 | 50.82 | 10 | 58.8 |
| FL | 10 | 48.60 | 6 | 60.0 |
| MS | 5 | 43.80 | 3 | 60.0 |
| IN | 40 | 49.18 | 24 | 61.5 |
| VA | 19 | 52.74 | 12 | 63.2 |
| ME | 3 | 45.00 | 2 | 66.7 |
| NH | 3 | 53.33 | 2 | 66.7 |
| MO | 13 | 52.38 | 10 | 76.9 |
| AR | 5 | 55.40 | 4 | 80.0 |
| UT | 5 | 52.60 | 4 | 80.0 |
| MT | 7 | 56.86 | 6 | 85.7 |
| PR | 3 | 58.67 | 3 | 100 |
| Total | 1048 | 47.41 | 484 | 46.5 |
SOURCE: American Veterinary Medical Association.
TABLE C-2b Food-Animal-Exclusive Veterinarians: Mean Ages and Percentage Over Age 60, by State
| State | Total | Mean Age | Count over 60 | Percentage over 60 |
| AL | 4 | 40.75 | 0 | |
| CT | 4 | 43.00 | 0 | |
| LA | 1 | 31.00 | 0 | |
| MA | 1 | 0 | ||
| ME | 3 | 45.00 | 0 | |
| MS | 5 | 43.80 | 0 | |
| ND | 4 | 45.75 | 0 | |
| NE | 22 | 46.36 | 0 | |
| NH | 3 | 53.33 | 0 | |
| NJ | 1 | 47.00 | 0 | |
| TN | 6 | 48.83 | 0 | |
| UT | 5 | 52.60 | 0 | |
| VI | 1 | 47.00 | 0 | |
| WV | 1 | 28.00 | 0 | |
| WY | 3 | 47.00 | 0 | |
| MD | 16 | 46.81 | 1 | 6.3 |
| OH | 15 | 47.00 | 1 | 6.7 |
| IL | 26 | 46.19 | 2 | 7.7 |
| KS | 25 | 49.60 | 2 | 8.0 |
| MN | 74 | 43.97 | 6 | 8.1 |
| KY | 12 | 44.75 | 1 | 8.3 |
| SD | 12 | 45.92 | 1 | 8.3 |
| NM | 11 | 45.82 | 1 | 9.1 |
| MI | 29 | 45.03 | 3 | 10.3 |
| WI | 159 | 47.66 | 18 | 11.5 |
| WA | 25 | 50.12 | 3 | 12.0 |
| CO | 33 | 47.82 | 4 | 12.1 |
| PA | 74 | 44.95 | 9 | 12.2 |
| ID | 36 | 44.89 | 5 | 14.3 |
| IN | 40 | 49.18 | 6 | 15.4 |
| GA | 12 | 46.83 | 2 | 16.7 |
| NY | 49 | 48.90 | 8 | 16.7 |
| CA | 89 | 46.13 | 15 | 16.9 |
| IA | 53 | 46.47 | 9 | 17.0 |
| FL | 10 | 48.60 | 2 | 20.0 |
| TX | 48 | 49.67 | 11 | 22.9 |
| MO | 13 | 52.38 | 3 | 23.1 |
| OK | 13 | 50.38 | 3 | 23.1 |
| AZ | 17 | 45.41 | 4 | 23.5 |
| NC | 21 | 50.67 | 5 | 23.8 |
| OR | 12 | 51.67 | 3 | 25.0 |
| VA | 19 | 52.74 | 5 | 26.3 |
| VT | 17 | 50.82 | 5 | 29.4 |
| PR | 3 | 58.67 | 1 | 33.3 |
| SC | 3 | 49.00 | 1 | 33.3 |
| AR | 5 | 55.40 | 2 | 40.0 |
| MT | 7 | 56.86 | 3 | 42.9 |
| NV | 6 | 53.17 | 3 | 50.0 |
| Total | 1048 | 47.41 | 148 | 14.2 |
SOURCE: American Veterinary Medical Association.
TABLE C-3a Food-Animal-Predominant Veterinarians Over Age 50, by State
| State | Total | Mean Age | Count over 50 | Percentage over 50 |
| RI | 1 | 49.00 | 0 | |
| VI | 1 | 43.00 | 0 | |
| PR | 11 | 46.00 | 2 | 18.2 |
| CT | 14 | 45.21 | 3 | 21.4 |
| NH | 9 | 46.00 | 3 | 33.3 |
| NV | 17 | 47.41 | 6 | 35.3 |
| WV | 18 | 46.78 | 7 | 38.9 |
| NM | 25 | 51.24 | 10 | 40.0 |
| TN | 60 | 49.70 | 26 | 43.3 |
| NC | 69 | 47.35 | 31 | 44.9 |
| SC | 20 | 51.25 | 9 | 45.0 |
| VA | 59 | 48.64 | 27 | 45.8 |
| NJ | 15 | 49.67 | 7 | 46.7 |
| LA | 34 | 48.44 | 16 | 47.1 |
| KY | 81 | 49.35 | 39 | 48.1 |
| PA | 134 | 48.37 | 64 | 48.9 |
| AL | 23 | 49.55 | 11 | 50.0 |
| AZ | 34 | 49.29 | 17 | 50.0 |
| MD | 26 | 48.81 | 13 | 50.0 |
| ND | 68 | 48.43 | 34 | 50.0 |
| FL | 75 | 49.76 | 38 | 50.7 |
| AR | 39 | 49.41 | 20 | 51.3 |
| MI | 93 | 49.29 | 48 | 51.6 |
| OH | 133 | 49.58 | 69 | 52.3 |
| IN | 62 | 49.87 | 32 | 52.5 |
| SD | 132 | 49.73 | 70 | 53.4 |
| KS | 137 | 50.44 | 73 | 53.7 |
| NY | 130 | 49.43 | 70 | 53.8 |
| UT | 35 | 49.91 | 19 | 54.3 |
| GA | 57 | 50.61 | 31 | 54.4 |
| NE | 203 | 49.77 | 112 | 55.7 |
| WI | 301 | 50.07 | 169 | 56.1 |
| OK | 122 | 51.51 | 69 | 56.6 |
| ME | 14 | 48.64 | 8 | 57.1 |
| MS | 30 | 51.00 | 17 | 58.6 |
| CO | 122 | 51.99 | 73 | 59.8 |
| CA | 172 | 50.80 | 104 | 60.8 |
| VT | 23 | 50.35 | 14 | 60.9 |
| MO | 161 | 51.98 | 100 | 62.1 |
| MT | 90 | 51.24 | 56 | 62.9 |
| MN | 246 | 51.81 | 155 | 63.0 |
| IA | 329 | 52.27 | 209 | 63.5 |
| WA | 69 | 51.12 | 44 | 64.7 |
| TX | 241 | 52.08 | 156 | 64.7 |
| ID | 74 | 52.01 | 48 | 64.9 |
| IL | 107 | 52.28 | 69 | 65.1 |
| DE | 3 | 44.33 | 2 | 66.7 |
| OR | 58 | 52.50 | 39 | 67.2 |
| MA | 23 | 51.78 | 16 | 69.6 |
| WY | 40 | 54.58 | 31 | 77.5 |
| AK | 1 | 51.00 | 1 | 100.0 |
| HI | 1 | 67.00 | 1 | 100.0 |
| Total | 4042 | 50.58 | 2289 | 56.8 |
SOURCE: American Veterinary Medical Association.
TABLE C-3b Food-Animal-Predominant Veterinarians Over Age 60, by State
| State | Total | Mean Age | Count over 60 | Percentage over 60 |
| AK | 1 | 51.00 | 0 | |
| DE | 3 | 44.33 | 0 | |
| NH | 9 | 46.00 | 0 | |
| RI | 1 | 49.00 | 0 | |
| VI | 1 | 43.00 | 0 | |
| PR | 11 | 46.00 | 1 | 9.1 |
| WV | 18 | 46.78 | 2 | 11.1 |
| VT | 23 | 50.35 | 3 | 13.0 |
| CT | 14 | 45.21 | 2 | 14.3 |
| NC | 69 | 47.35 | 10 | 14.5 |
| LA | 34 | 48.44 | 5 | 14.7 |
| WA | 69 | 51.12 | 10 | 14.7 |
| VA | 59 | 48.64 | 9 | 15.3 |
| WI | 301 | 50.07 | 48 | 15.9 |
| MI | 93 | 49.29 | 15 | 16.1 |
| ND | 68 | 48.43 | 11 | 16.2 |
| NE | 203 | 49.77 | 34 | 16.9 |
| NV | 17 | 47.41 | 3 | 17.6 |
| AR | 39 | 49.41 | 7 | 17.9 |
| IN | 62 | 49.97 | 11 | 18.0 |
| AL | 23 | 49.55 | 4 | 18.2 |
| NY | 130 | 49.43 | 24 | 18.5 |
| MD | 26 | 48.81 | 5 | 19.2 |
| CA | 172 | 50.80 | 33 | 19.3 |
| OH | 133 | 49.58 | 26 | 19.7 |
| KS | 137 | 50.44 | 27 | 19.9 |
| FL | 75 | 49.76 | 15 | 20.0 |
| NJ | 15 | 49.67 | 3 | 20.0 |
| SC | 20 | 51.25 | 4 | 20.0 |
| UT | 35 | 49.91 | 7 | 20.0 |
| PA | 134 | 48.37 | 27 | 20.3 |
| AZ | 34 | 49.29 | 7 | 20.6 |
| OR | 58 | 52.50 | 12 | 20.7 |
| KY | 81 | 49.35 | 17 | 21.0 |
| GA | 57 | 50.61 | 12 | 21.1 |
| ME | 14 | 48.64 | 3 | 21.4 |
| IL | 107 | 52.28 | 23 | 21.7 |
| MA | 23 | 51.78 | 5 | 21.7 |
| TN | 60 | 49.70 | 14 | 23.3 |
| MT | 90 | 51.24 | 21 | 23.6 |
| MO | 161 | 51.98 | 38 | 23.6 |
| IA | 329 | 52.27 | 79 | 24.0 |
| MS | 30 | 51.00 | 7 | 24.1 |
| CO | 122 | 51.99 | 30 | 24.6 |
| SD | 132 | 49.73 | 33 | 25.2 |
| MN | 246 | 51.81 | 63 | 25.6 |
| TX | 241 | 52.08 | 65 | 27.0 |
| OK | 122 | 51.51 | 33 | 27.0 |
| ID | 74 | 52.01 | 22 | 29.7 |
| NM | 25 | 51.24 | 8 | 32.0 |
| WY | 40 | 54.58 | 16 | 40.0 |
| HI | 1 | 67.00 | 1 | 100.00 |
| Total | 4042 | 50.58 | 855 | 21.2 |
SOURCE: American Veterinary Medical Association.
TABLE C-4a Mixed-Food-Animal Veterinarians Over Age 50, by State
| State | Total | Mean Age | Count over 50 | Percentage over 50 |
| MD | 55 | 43 | 14 | 25.9 |
| ND | 27 | 42 | 7 | 25.9 |
| SD | 34 | 42 | 9 | 26.5 |
| NC | 79 | 44 | 23 | 29.1 |
| WV | 23 | 43 | 7 | 30.4 |
| LA | 69 | 44 | 22 | 32.4 |
| HI | 9 | 47 | 3 | 33.3 |
| PA | 141 | 46 | 46 | 33.3 |
| RI | 3 | 44 | 1 | 33.3 |
| NH | 34 | 45 | 12 | 35.3 |
| KY | 114 | 45 | 40 | 35.4 |
| IL | 158 | 46 | 57 | 36.1 |
| UT | 34 | 45 | 13 | 38.2 |
| OH | 170 | 46 | 66 | 38.8 |
| CT | 28 | 47 | 11 | 39.3 |
| AK | 15 | 46 | 6 | 40.0 |
| GA | 100 | 48 | 40 | 40.0 |
| NY | 128 | 47 | 52 | 40.9 |
| VA | 73 | 47 | 30 | 41.1 |
| MN | 109 | 47 | 45 | 41.3 |
| OR | 120 | 47 | 50 | 41.7 |
| AR | 87 | 47 | 37 | 43.0 |
| ID | 64 | 47 | 28 | 43.8 |
| FL | 114 | 48 | 50 | 44.2 |
| NE | 75 | 48 | 32 | 44.4 |
| AZ | 38 | 47 | 17 | 44.7 |
| TN | 117 | 46 | 52 | 44.8 |
| CO | 115 | 47 | 52 | 45.2 |
| KS | 172 | 47 | 78 | 45.9 |
| MO | 178 | 49 | 82 | 46.6 |
| MS | 76 | 48 | 35 | 46.7 |
| OK | 154 | 48 | 73 | 47.4 |
| MT | 69 | 48 | 33 | 47.8 |
| IA | 132 | 49 | 63 | 48.1 |
| NM | 55 | 49 | 26 | 48.1 |
| ME | 29 | 49 | 14 | 48.3 |
| SC | 35 | 47 | 17 | 48.6 |
| DE | 4 | 49 | 2 | 50.0 |
| NJ | 24 | 48 | 12 | 50.0 |
| VT | 22 | 48 | 11 | 50.05 |
| TX | 452 | 48 | 227 | 50.2 |
| AL | 67 | 48 | 227 | 50.7 |
| IN | 104 | 49 | 52 | 51.0 |
| CA | 195 | 50 | 100 | 51.5 |
| WI | 110 | 47 | 56 | 51.9 |
| NV | 19 | 47 | 10 | 52.6 |
| WA | 103 | 49 | 54 | 52.9 |
| MA | 33 | 47 | 17 | 53.1 |
| MI | 97 | 49 | 52 | 53.6 |
| WY | 63 | 49 | 34 | 54.0 |
| Total | 4345 | 47 | 1908 | 44.2 |
SOURCE: American Veterinary Medical Association.
TABLE C-4b Mixed-Food-Animal Veterinarians Over Age 60, by State
| State | Total | Mean Age | Count over 60 | Percentage over 60 |
| DE | 4 | 49 | 0 | |
| WV | 23 | 43 | 1 | 4.3 |
| WI | 110 | 47 | 5 | 4.6 |
| MD | 55 | 43 | 3 | 5.6 |
| SD | 35 | 42 | 2 | 5.9 |
| KY | 114 | 45 | 8 | 7.1 |
| ND | 27 | 42 | 2 | 7.4 |
| SC | 35 | 47 | 3 | 8.6 |
| TN | 117 | 46 | 10 | 8.6 |
| UT | 34 | 45 | 3 | 8.8 |
| VT | 22 | 48 | 2 | 9.1 |
| ID | 64 | 47 | 6 | 9.4 |
| MA | 33 | 47 | 3 | 9.4 |
| VA | 73 | 47 | 7 | 9.6 |
| FL | 114 | 48 | 11 | 9.7 |
| CO | 115 | 47 | 12 | 10.4 |
| OR | 120 | 47 | 13 | 10.8 |
| HI | 9 | 47 | 1 | 11.1 |
| WY | 63 | 49 | 7 | 11.1 |
| OH | 170 | 46 | 19 | 11.2 |
| NC | 79 | 44 | 9 | 11.4 |
| NH | 34 | 45 | 4 | 11.8 |
| PA | 141 | 46 | 18 | 13.0 |
| MT | 69 | 48 | 9 | 13.0 |
| LA | 69 | 44 | 9 | 13.2 |
| IL | 158 | 46 | 21 | 13.3 |
| AK | 15 | 46 | 2 | 13.3 |
| AL | 67 | 48 | 9 | 13.4 |
| KS | 172 | 47 | 23 | 13.5 |
| WA | 103 | 49 | 14 | 13.7 |
| ME | 29 | 49 | 4 | 13.8 |
| AR | 87 | 47 | 12 | 14.0 |
| CT | 28 | 47 | 4 | 14.3 |
| MN | 109 | 47 | 16 | 14.7 |
| NM | 55 | 49 | 8 | 14.8 |
| OK | 154 | 48 | 23 | 14.9 |
| NY | 128 | 47 | 20 | 15.7 |
| NV | 19 | 47 | 3 | 15.8 |
| NJ | 24 | 48 | 4 | 16.7 |
| TX | 452 | 48 | 76 | 16.8 |
| GA | 100 | 48 | 17 | 17.0 |
| MI | 97 | 49 | 17 | 17.5 |
| AZ | 38 | 47 | 7 | 18.4 |
| MS | 76 | 48 | 14 | 18.7 |
| NE | 75 | 48 | 14 | 19.4 |
| MO | 178 | 49 | 35 | 19.9 |
| CA | 195 | 50 | 39 | 20.1 |
| IA | 132 | 49 | 28 | 21.4 |
| IN | 104 | 49 | 23 | 22.5 |
| RI | 3 | 44 | 1 | 33.3 |
| Total | 4345 | 47 | 1908 | 44.2 |
SOURCE: American Veterinary Medical Association.
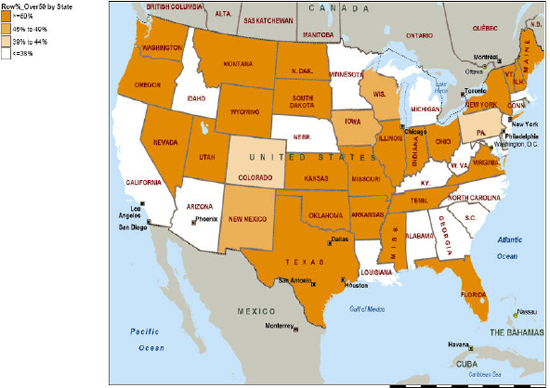
FIGURE C-12a Distribution of food-animal-exclusive veterinarians over age 50.5 SOURCE: American Veterinary Medical Association (2008).
_________________________
5 States vary widely in food-animal-veterinary populations; in 24 of 48 coterminous states, over 50% of food-animal-exclusive veterinarians are over 50 years old.
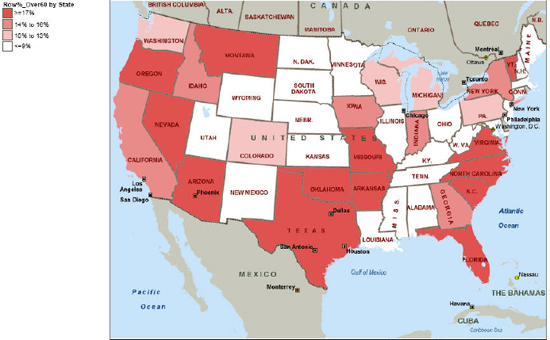
FIGURE C-12b Distribution of food-animal-exclusive veterinarians over the age 60.6 SOURCE: American Veterinary Medical Association (2008).
_________________________
6 In 13 states, over 17% of food-animal-exclusive veterinarians are over 60 years old.
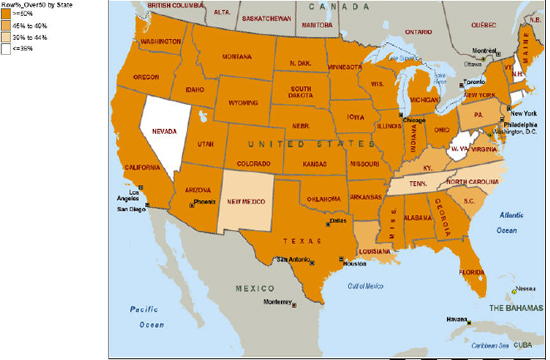
FIGURE C-13a Distribution of food-animal-predominant veterinarians over 50.7 SOURCE: American Veterinary Medical Association (2008).
_________________________
7 There is considerable uniformity in age across the United States. In 36 states, more than 50% of food-animal-predominant veterinarians are over 50 years old.
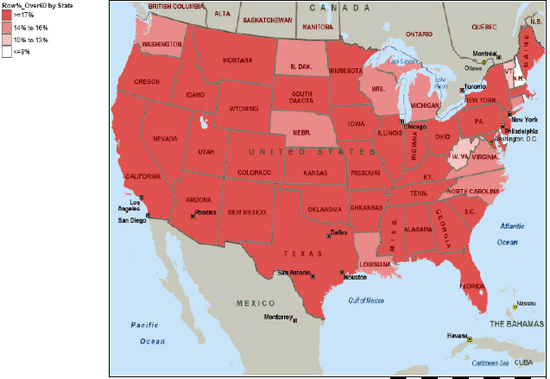
FIGURE C-13b. Distribution of food-animal-predominant veterinarians over age 60.8 SOURCE: American Veterinary Medical Association (2008).
_________________________
8 In 36 states, 17% are over 60 years old.
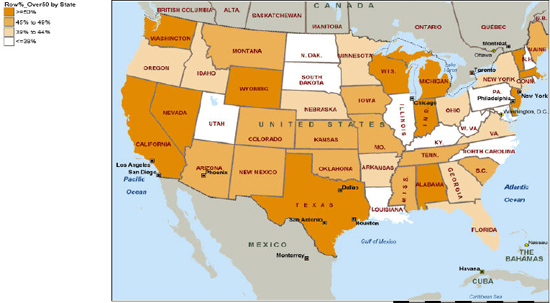
FIGURE C-14a Distribution of mixed-food-animal veterinarians over the age 50.9 SOURCE: American Veterinary Medical Association (2008).
_________________________
9 In contrast with food-animal-predominant veterinarians, only 12 states have more than 50% of mixed-food-animal veterinarians over the age of 50 years.
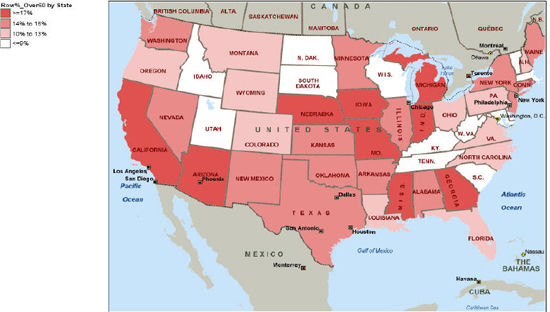
FIGURE C-14b Distribution of mixed-food-animal veterinarians over age 60.10 SOURCE: American Veterinary Medical Association (2008).
_________________________
10 Nine states have more than 17% of mixed-food-animal veterinarians over the age of 60 years.
REFERENCES
AVMA. 2008. Food Supply Veterinary Medicine. Available online at http://www.avma.org/fsvm/maps/default.asp#us_animal_vet.
Honeyman M., and M. Duffy. 2006. Iowa’s Changing Swine Industry. AS Leaflet R 2158 in Iowa State University Animal Industry Report 2006. Ames: Iowa State University Department of Animal Science.
National Atlas of the United States. 2011. Population Change and Distribution: 1990 to 2000. Available online at http://www.nationalatlas.gov/articles/people/a_popchange.html#five.


