
4
Design and Estimation Options
LESSONS FROM THE NATIONAL SURVEY OF CHILDREN’S HEALTH
Michael Kogan (U.S. Department of Health and Human Services, Maternal and Child Health Bureau) provided an in-depth overview of the National Survey of Children’s Health (NSCH).
The Maternal and Child Health Bureau (MCHB) has directed and funded two related surveys in the past, the NSCH and the National Survey of Children With Special Health Care Needs (NS-CSHCN), and these two surveys are being combined as part of an overall redesign. The NSCH was fielded in 2003, 2007, and 2011-2012, with the goal of producing national and state-based estimates on the health and well-being of children, their families, and their communities. Each sample included approximately 100,000 children. The NS-CSHCN was fielded in the intervening years, that is, in 2001, 2005, and 2009-2010, and its purpose was to assess the prevalence and impact of special health care needs among children and to evaluate changes over time. Each administration of the survey included approximately 40,000 children.
Both the NSCH and the NS-CSHCN were conducted in partnership with the Centers for Disease Control and Prevention and were fielded as a module of the State and Local Integrated Telephone Surveys. Both surveys began as random-digit dial surveys, limited to landlines, but recently began including a cell phone sampling frame, due to the challenges with landline-only telephone interviews. In the case of both surveys, the data are parent- and caregiver-reported.
Data from these surveys are used extensively by the federal government and others. One use is in Healthy People, a federal initiative that provides science-based, 10-year national objectives for improving the health of Americans. There are 15 Healthy People 2020 objectives that have been derived on the basis of the data from these surveys. These surveys have also been used for federal policy and program development in a number of areas. In cooperation with states, MCHB funds most of the maternal and child health services in the country through Title V block grants.1 States are required to spend 30 percent of their funds on children’s special health care needs, and the data from the surveys are used extensively in the Title V needs assessments.
The availability of state-level data from these surveys also enables other state-level planning and program development efforts. In addition, the data are used for scientific research. The MCHB also has systems and life-course indicators on a variety of topics and has published chart books devoted to mental health conditions.
Enabling easy access to the data has always been a priority, and the program has had an online data query system from its beginning. The query system is used extensively by researchers, policy makers, the media, and states.
The objective of the surveys was never limited to just health conditions. In addition to general health and specific health conditions, the surveys collect data about various aspects of children’s lives, such as their families, their neighborhoods, and their health care experiences.
There are three versions of the instruments, for different age groups: birth to age 5, school-age children between the ages of 6 and 11, and adolescents between the ages of 12 and 17. The instruments have eight core content areas and include age-specific content. For example, as has been discussed earlier, school readiness has emerged as an important area in a number of countries, so an extensive set of questions was added on that topic.
The NSCH asks about the prevalence of a number of medical conditions, specifically, whether a doctor or other health care provider has ever told the parent or caregiver that the child had the condition. The list of conditions includes anxiety problems, depression, behavioral or conduct problems, substance abuse disorder, developmental delay, intellectual disability, speech or other language disorder, learning disability, attention deficit disorder or attention deficit hyperactivity disorder (ADD/ADHD), autism and autism spectrum disorder, and Tourette syndrome, as well as a fill-in-the-blank question for any other mental health condi-
______________
1For more information on the Title V Maternal and Child Health Services Block Grant Program, see http://mchb.hrsa.gov/programs/titlevgrants/ [October 2015].
tion. The survey also asks about treatment, including the receipt of any treatment or counseling from a mental health professional, problems receiving needed mental health treatment or counseling, and several other treatment-related questions.
The survey also includes several questions about functioning. Among these are the frequency and degree of limitations and missed school days, as well as related items on parental concern about development or behavior, a developmental screening scale for those between 9 and 71 months (up to age 6), and school readiness.
As part of the redesign that is combining the NSCH and the NS-CSHCN, a major change is targeted at addressing the issue of declining response rates. When these surveys were first fielded, almost everyone had a land line. By 2014, more than 50 percent of households with children did not have land lines. Although the agency recently began including cell phones, cell phone households are much more difficult to survey, in part because there is no national registry, and they are more expensive to include. Consequently, the surveys simultaneously faced declining response rates and increasing costs. Due to these developments, the survey is currently being transitioned from a land line and cell phone sampling frame to an address-based sample. The first contact will be by email, and sample members will be encouraged to complete the survey online. They will also have the option to return the questionnaire by mail or call a telephone number if they prefer to complete the survey by phone.
Finally, another goal of the redesign is to provide more timely data. In the past, each survey was conducted every 4 years. Because states would like to have the data more frequently, the new combined survey will be conducted annually, with a smaller sample. The redesigned survey is currently undergoing testing, including for mode effects, and MCHB anticipates that it will be ready to be fielded in the summer and fall of 2016, with a public data release scheduled for spring 2017.
CONSIDERATIONS IN MULTIPHASE STUDIES
Steven Heeringa (University of Michigan) discussed design and estimation considerations for multiphase studies of child serious emotional disturbance, primarily focusing on the statistical objectives, multiphase design choices, and measurement error. Earlier presentations and discussion had focused on the psychometric properties of some of the available measures, and Heeringa’s talk focused on the statistical implications of the various levels of sensitivity and specificity associated with the measures. Heeringa also discussed examples of estimation and inference across a variety of settings in which existing data sources (longitudinal
surveys, cross-sectional surveys, or administrative datasets) have varying degrees of richness.
From a statistical perspective, it is important to distinguish between two objectives for a screening study. One potential objective is simply to estimate prevalence and population size, in other words, to be able to report the number of affected children. However, invariably, when this type of data is collected, researchers want to turn to a second level of analysis, to conduct an in-depth subpopulation study, to better understand the characteristics of the population, the age of onset, the associated factors, the life course and development of the disorder, and so on. It is important to distinguish between these objectives because they have different optimal properties in terms of research design.
In multiphase studies, researchers are incrementally refining the information they have on the units of observation. Figure 4-1 illustrates a multiphase design framework.
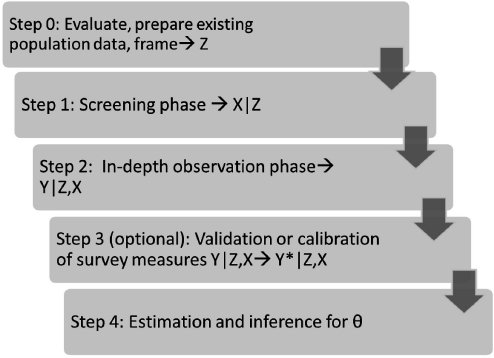
FIGURE 4-1 Multiphase design framework.
NOTES: Z is existing population data, frame; X is phase 1 screening data; Y is phase 2 measurement of outcome of interest; Y* is validated, calibrated outcome of interest; θ is population parameter.
SOURCE: Workshop presentation by Steven Heeringa.
Heeringa said that the discussion during the workshop underscored the importance of beginning the process with an evaluation of what is already available (Step 0). A multiphase survey is expensive, and if one is needed, the best design optimizes inferential efficiency based on the existing data sources. The initial research will lead to variables Z, which are the existing data on the population or a large representative sample of that population.
The next step in the process is a screening phase (Step 1), to obtain additional screening data, potentially based on some of the screening measures that were discussed earlier in the workshop. This screening can be completed at relatively low cost for the screening observation, on the entire sample or on a set of observations.
A second-phase data collection is then carried out (Step 2), which is typically limited to a subsample due to high costs for each observational unit. At this stage, the measurement X is refined to get closer to the measurement of interest, Y, which might be a diagnosis, an index of severity, or an index of limitation. If Y is an imperfect measure, it can be further validated or calibrated (Y*), for example, against a clinical standard. The final step is the estimation and inference of population attributes.
Heeringa noted several key cost considerations that come into play for multiphase designs. One is the expected prevalence rate in the target population. The expected prevalence rate for serious emotional disturbance will drive the sample size requirements to obtain certain levels of precision. If the aim also includes the second objective, he noted, which is to identify a subpopulation to study in depth as a domain of analysis or to follow longitudinally, the population prevalence for the characteristic of interest will determine the number of cases needed to ultimately achieve the appropriate sample size of eligible individuals.
In some cases, a first-phase screening (Step 1) might not be necessary, especially if sufficient information is available from the existing data used for a sampling frame. In these cases, a screening status could be assigned on the basis of the existing data. Most of the double sampling theory in the relevant literature is based on designs in which the cost for the screening is low relative to the cost of the in-depth observation phase (Step 2). This approach is often used in medical screening studies, when an in-depth clinical interview is used in the second phase.
The sensitivity (true positive rate) of the Step 1 screener is another cost factor because a high false positive rate—particularly if the objective is to identify a sample of individuals who meet the criteria of interest for further study—will necessitate starting with a larger sample size simply to observe a certain number of individuals who meet the criteria. Finally, whether a calibration study will be conducted is also a consideration.
The error factors complement the cost factors, Heeringa noted. Again,
the prevalence of the target group is relevant because it drives the sampling variance. It also matters what the strength of association is between the data from the Step 1 screening and the data from the sampling frame, as well as between the final outcome measures of interest and both the sample frame data and the Step 1 screening data.
Another error factor is the specificity (true negative rate) of the screener, because in order to ensure coverage of all true cases in the population, a second-phase subsampling is needed of persons who are negative screens. A high false negative rate based on the Step 1 screener implies a need for variable weighting of Step 2 in-depth observations. When the subsampled negative screen cases are followed up, some of them will, in fact, turn out to be positive, and this means that variable weighting will be needed. Variable subsampling and weighting of Step 1 positive and negative screens increases the variance of population prevalence estimates and inflates variances of estimates for analyses of true subpopulation cases. Finally, if a calibration is needed, there is a potential for classification bias.
Table 4-1 illustrates the effects of sensitivity and specificity on the sampling variances of the estimates that are derived (or modeled) on the basis of screening data. The rows show the screening assessment from Step 1 or from a modeled assignment based on an administrative dataset. Some individuals are classified as negative screens and others as positive screens. For simplicity’s sake, the table assumes a dichotomous measure, but the measure can also be continuous. Samples of individuals are drawn on the basis of the information from Step 1. Typically, a stratified subsample of the negative screens would be generated, and all of the positive screens would be included (sampled with a probability of 1. A follow-up is then conducted to obtain an observation on the true status or the proxy of the true status, Y. In the Table 4-1 example, the screener specificity and screener sensitivity are both 0.8.
TABLE 4-1 Measurement Example: Sensitivity/Specificity of Step 1 Screening
| Step 1 Screening or Model Assignment | Step 2 Observed Status (Y) | |||||
| NO (0) | YES (1) | Total | ||||
| NO (0) | P00 = 0.64 | P01 = 0.04 | P0+ = 0.36 | |||
| YES (1) | P10 = 0.16 | P11 = 0.16 | P1+ = 0.64 | |||
| Total | P+0 = 0.80 | P+1 = 0.20 | P++ = 1.00 | |||
NOTES: True prevalence, 0.20; screener sensitivity, P11/P+1 = 0.8; screener specificity, P00/P+0 = 0.8.
SOURCE: Workshop presentation by Steven Heeringa, June 2015.
TABLE 4-2 Examples of Weighting Loss in Variance of Estimates of Population Prevalence Due to Step 2 Subsampling of Step 1 Negative Screens
| Step 1 Positive Screens (fpos) | Step 2 Subsampling of Step 1 Negative Screens (fneg, sub) | Percent Increase in Variance (p) |
| 1.0 | 0.50 | 8 |
| 1.0 | 0.33 | 22 |
| 1.0 | 0.25 | 36 |
| 1.0 | 0.10 | 130 |
NOTE: True prevalence, 0.20.
SOURCE: Workshop presentation by Steven Heeringa, June 2015.
Heeringa noted that to compensate for the differential subsampling, conditional on the Step 1 determination, some weights are carried forward, and there is going to be a loss in the precision of the prevalence estimates. Table 4-2 provides examples of weighting loss in the variance of population prevalence estimates due to Step 2 subsampling of Step 1 negative screens. In the case of a first-stage screening with sensitivity of 0.8 and specificity of 0.8, if all of the positive screens are included in the follow-up and 50 percent of the negative screens are subsampled, there would be a relatively small increase in variance, approximately 8 percent. However, this subsampling rate would be more expensive due to the high fraction of Step 1 negative screens that require the higher cost Step 2 assessment. As the subsampling rate is lowered, the impact on the variance of the estimates starts to increase substantially, eventually reaching well over 100 percent in the case where Step 1 negative screens are subsampled at a rate of 1 in 10.
When researchers use these types of designs, there is a tendency to subsample the negative screens at a very low rate “just to check.” But a very low subsampling rate for the negative screens is only reasonable when there is a very high degree of specificity to the Step 1 design and measurements, Heeringa said. Typically, a follow-up rate of one in four, one in three, or one in two is needed for the negative screens.
Table 4-3 shows formulas for the expected disposition of Step 2 eligible cases in a two-phase design. When thinking about the second objective of trying to identify a subsample of individuals for in-depth study, one example would be a longitudinal study of children to determine whether at a particular developmental stage they meet the criteria of a serious emotional disturbance. The variance loss is going to be a little different in longitudinal studies because the differential weights are carried forward.
TABLE 4-3 Formulas for Expected Disposition of Step 2 Eligible Cases in a Two-Phase Design
| Step 1 Screening or Model Assignment | Step 2 Expected Eligible Cases | |
| Expected Sample Size Eligible True Cases | Relative Design Weight Step 1 Is Equal Probability of Selection Method | |
| NO (0) | ||
| YES (1) | Wi=1.0 | |
NOTES: E(m) is expected sample size; Wi is relative design weight. See text for discussion.
SOURCE: Workshop presentation by Steven Heeringa, June 2015.
Moreover, Heeringa noted, once it is introduced at baseline, the weighting penalty on variance is persistent.
Table 4-4 shows examples of weighting loss in the variance of estimated means for a Phase 2 subpopulation sample. In this case, the variance is a function of both the subsampling rate for the Step 1 negative screens and of the specificity of the Step 1 screener. The table shows that there would be an increase of more than 50 percent in variance if the specificity was 0.8 and one in four of the negative Step 1 screens were sampled.
Heeringa also talked about a framework for how to think about the process of integrating survey data with existing data, such as information from administrative sources. The pyramid in Figure 4-2 illustrates this framework. The top of the pyramid is characterized by a state of relatively little existing information. There may be a small amount of information on the survey frame, but very little or no information about Step 1 measures and most likely no information at all on Step 2 measures. Further down the pyramid, there is increasingly more information from existing data sources, including not only data needed for sampling purposes, but also information that would make it possible to effectively prescreen cases on the basis of an administrative data source, and the data source might even contain some measures of Y. This might be the case, for example, if another survey had been completed in prior years.
Heeringa explained that the top box in Figure 4-2 is the domain of traditional survey designs. Double sampling involves selecting a probability sample based on the frame information. Based on the limited data available, a Step 1 screening is conducted to ascertain a set of preliminary information. That information is then used to perform stratified subsampling and to follow up with the subsample for in-depth data collection.
TABLE 4-4 Examples of Weighting Loss in Variance of Estimated Means for the Step 2 Eligible Subpopulation Sample
| Step 1 Positive Screens (fpos) | Step 2 Subsampling of Step 1 Negative Screens (fneg, sub) | Step 1 Screen Specificity, in Percent | |||||
| 1.0 | 0.9 | 0.8 | 0.7 | 0.6 | 0.5 | ||
| Percent Increase in Variance (p) | |||||||
| 1.0 | 0.50 | 0 | 11 | 13 | 12 | 11 | 10 |
| 1.0 | 0.33 | 0 | 30 | 34 | 33 | 30 | 20 |
| 1.0 | 0.25 | 0 | 50 | 56 | 54 | 50 | 46 |
| 1.0 | 0.10 | 0 | 180 | 203 | 194 | 180 | 265 |
NOTES: True prevalence, 0.20; sensitivity, 0.8.
SOURCE: Workshop presentation by Steven Heeringa, June 2015.
In some situations, more information may be suitable to incorporate into the survey design and inference from the survey data collection, which is often referred to as model-assisted survey sampling: this is shown in the second box of the pyramid. Survey-assisted modeling, shown in the third box in the pyramid is the direction many of the survey programs may take in the future. This box covers situations in which there is a large amount of existing data, such as administrative data, but the data do not contain all of the measures of association and covariates that may be needed: the survey is used to measure and “fill in” missing information in a model framework. Finally, the bottom box of the pyramid represents a pure modeling environment in which the existing data make it possible to model estimates directly through data mining and analytics.
Heeringa offered an example of a double sampling approach (top box of the pyramid)—the Flint Men’s Health Study, which collected data to inform decisions about levels of prostate-specific antigen (PSA) among African-American men.2 In Step 0, the only information available to the researchers was an area probability sample frame for Flint, Michigan, households. Step 1 involved screening a probability sample of households for African-American men over age 40, with some disproportionate sampling of census tracts to improve efficiency. As part of the same process, a health history interview was conducted and a blood sample was obtained
______________
2Heeringa, S.G., Alcser, K.H., Doerr, K., Strawderman, M., Cooney, K., Medbery, B., and Schottenfeld, D. (2001). Potential selection bias in a community-based study of PSA levels in African-American men. Journal of Clinical Epidemiology, 54(2), 142-148.
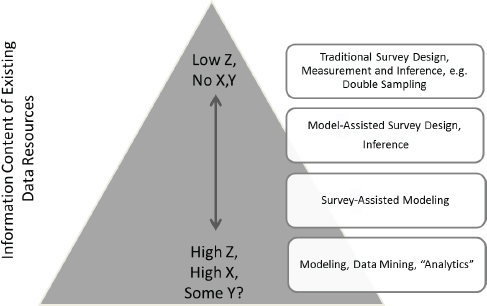
FIGURE 4-2 Integrating survey and administrative data: Adaptation to information content of available data.
SOURCE: Workshop presentation by Steven Heeringa, June 2015.
for a PSA test. In Step 2, stratified subsamples were selected, based on the PSA data that were obtained in Step 1, and the men who were selected into the sample were referred for further testing to determine probable cancer. The Step 3 validation involved an actual biopsy to confirm the findings from Step 2.
Heeringa next offered an example of a model-assisted survey design, the Aging Demographics and Memory Study (ADAMS).3 For this project, more information was available in Steps 0 and 1. In Step 0 rich longitudinal data were available from the Health and Retirement Survey (HRS), which enabled the researchers to estimate a logit model of the probability of dementia on the basis of an external dataset. Given the existing information in the HRS and the externally derived model of dementia, the HRS panel frame was stratified by age, gender, and cognitive score. Step 1 involved screening and stratified subsampling for follow-up of the HRS panel, which was based on a stratification that used an externally estimated model relating probability of dementia to age, education level,
______________
3Langa, K.M., Plassman, B.L., Wallace, R.B., Herzog, A.R., Heeringa, S.G., Ofstedal, M.B., Burke, J.R., Fisher, G.G., Fultz, N.H., Hurd, M.D., Potter. G.G., Rodgers. W.L., Steffans, D.C., Weir, D.R., and Willis, R.J. (2005). The Aging, Demographics and Memory Study: Study design and methods. Neuroepidemiology, 25, 181-191.
and cognition test scores. Step 2 involved in-home neurocognitive assessment and collection of medical records, which was followed by a consensus diagnostic conference review by an expert medical panel to assign a diagnosis category. Step 3 was a 2-year follow-up to refine probable or possible dementia into cognitive impairment with no dementia and dementia categories. These steps essentially involved direct estimation, and the key benefit of the existing cognitive information was the ability to use it in the HRS panel to establish strata for disproportionate sampling.
Heeringa also discussed how survey-assisted modeling was used as part of the same study. The analysis was not limited to the 850 cases who cooperated as part of the process described above, and for which the Z, X, and Y data were obtained. For approximately 10,000 cases of HRS panel members over the age of 70, Z and X data were available, including cognitive scores and covariate information from the HRS. For these cases, it was possible to use the relationships observed in ADAMS to draw strength from the data available on Z and X.
From the ADAMS survey data (training set), a “best” predictive model, f(Y|Z,X) of the probability of dementia was estimated. The predictive model estimated from the multiphase ADAMS survey was then used to predict the probability of dementia for each eligible member of the larger HRS panel. Using the predicted or “imputed” probabilities of dementia generated for all eligible HRS panel members, estimates of population prevalence for dementia were produced using methods that properly reflected the uncertainty associated with the modeled values of Y*.
Heeringa concluded the discussion of survey-assisted modeling by saying that predictive modeling approaches assign classification probabilities to all elements in the population frame (or weighted sample). Clinicians may always want a diagnosis, in other words a 0 or 1, but from a statistical perspective, a decision has to be made on whether to conduct the analyses on a probability scale or use the probabilities to impute discrete classifications. It is also important to ensure that inferences reflect the prediction (imputation) inherent in modeled values. Once the uncertainty associated with the predictor is incorporated, either through multiple imputation or some other method, these predicted probabilities can then be added to the data file and used not just as dependent variables, but also as independent variables. In the case of child serious emotional disturbance, once these probabilities are assigned to a child’s data record, for example, in the National Survey on Drug Use and Health (NSDUH), the data can be used both to analyze prevalence and to look at the impact on other outcomes for that particular individual.
Jonaki Bose (SAMHSA) asked Heeringa to comment on the number of predicted probability values needed. Heeringa replied that Bose’s ques-
tion captures the uncertainty in the training model from Step 2, when the imputation is performed, or even if the second-stage investigation was used to set a cut point for everyone else in the first stage. Ideally, it is important to incorporate a measure of the uncertainty in setting that cut point. It can be treated as a missing data problem, where X is available for each case, and Y is only available for some cases. This is a structured missing dataset, so Y is imputed for everybody who has X but not Y. Heeringa added that he found that five imputations generally provided stability, but it depends on the fraction of the missing information. Some researchers are dealing with 5 or 10 imputations; others are recommending as many as 20 or 100.
Graham Kalton (Westat) commented on the question about whether to retain the probabilities, which was done in the example, or dichotomize the data. He noted that dichotomizing at the beginning of a multiple imputation would involve swapping between 0s and 1s, and that would contribute a lot of extra variance. Heeringa agreed that working directly with the probability scale is more efficient, but added that in practice the concept of a probability of having a disorder or holding an attribute is complicated to explain to researchers who want to use the data, and because of that a discrete classification may be needed.
Bose asked Heeringa whether he would consider the probability scale a true continuous measure. Heeringa replied that he would, at least in these cases. It would be important, however, to look at the distributional properties, in other words, at normality and censoring of the tails at 0 or 1 in the case of linear regression modeling.
MODEL-BASED ESTIMATES OF PREVALENCE IN A NATIONAL SURVEY
Heather Ringeisen and Jeremy Aldworth discussed research that RTI International conducted on behalf of SAMHSA to develop model-based methods for use in an existing national survey to estimate the prevalence of serious emotional disturbance in children and serious mental illness in adults. Ringeisen discussed the work related to serious emotional disturbance in children, and Aldworth described some of the technical details and lessons learned from both efforts.
The Child Serious Emotional Disturbance Pilot Study
To provide some background on the model-based estimation project for children, Ringeisen said that in 2006, SAMHSA convened an advisory panel that made several recommendations about what a study to estimate child serious emotional disturbance might look like. At that time, it was
decided that the short version of the Strengths and Difficulties Questionnaire (SDQ) included in the National Health Interview Survey would be used to generate a score to be used as a predictor variable. The NHIS version of the SDQ is different from the one described by Goodman (see Chapter 3) because it is a five-item version that also includes an additional impact item that asks parents to report whether the child has minor, moderate, or severe difficulties. Because this is a standardized tool that offers a continuum of scores and at least a proxy indicator for impairment, this instrument and the NHIS appeared to be the best option for the project at that time. The added benefit of the NHIS was that it could collect this information for children as young as 4.
On the basis of the recommendations of the advisory panel, SAMHSA, and later the National Institute of Mental Health (NIMH), funded a pilot study with the primary objective to explore the development of a model-based procedure to estimate serious emotional disturbance in children, using data collected on the NHIS. The study was a collaboration with the National Center for Health Statistics (NCHS). RTI International conducted the pilot study in partnership with Duke University.
Ringeisen explained that the pilot study method was based on developing predictive models in which the five-item SDQ and a sixth impact item from the SDQ were the independent variables that predicted serious emotional disturbance, which was then determined on the basis of “gold standard” clinical interview data. The sample for the pilot study included two groups, both taken from participants in the final three quarters of the 2011 NHIS and the first quarter of the 2012 NHIS: one group was the parents of children aged 4-17; the other was youth aged 12-17 who reported about themselves. The sample was limited to children whose parents completed the NHIS interview in English, provided complete contact information and SDQ responses, and indicated the child had no history of intellectual disability, developmental delay, autism, or Down syndrome (in order to dovetail with the SAMHSA definition of serious emotional disturbance in children). The sampling strata were defined by NHIS SDQ scores and then sampled proportionally to the size of the standard error of a proxy measure of child mental disorder distributed across the strata.
Of the 1,187 identified parent respondents, 217 (18 percent) completed interviews. Interviews were also conducted with the youth group, which resulted in 78 cases where both a parent and a child interview were completed. From among the remaining cases, 195 were ineligible due to a competing study using the NHIS sample, 277 were not locatable, and 239 were not contactable. An additional 200 refused to complete the interview or ended participation before completing it.
A low response rate was one of the main challenges for the study. One of the reasons for the low rare was the 18-month delay between the NHIS
data collection and the pilot study, so by the time the follow-up study was conducted many sample members were not locatable. In addition, several cases were pulled from the study after the initial work of preparing the sample was completed because they were needed for another project. The final response rate of around 18 percent was not high enough to give the researchers sufficient confidence in the statistical results, and therefore they are not included in her presentation, Ringeisen said. Rather, she focused on lessons learned and possible ideas for moving forward.
The delays in fielding the study were primarily due to negotiations about ethical and security concerns that are related to these types of studies. One issue was whether it was appropriate to interview children about mental health issues by telephone. Initially, the intent was to conduct telephone interviews with both parents and children in a broad age range, but feedback from the relevant institutional and ethics review boards resulted in limiting the child interviews to those between the ages of 12 and 17. There were also questions about whether it would be advisable and operationally feasible to report individual results to the participants. NCHS generally prefers to share survey results with the respondents by providing a summary of their data at the end of the interview or at a later time, but this approach is not typical in the mental health field. Finally, some of the delay was associated with developing an appropriate protocol for handling distressed child respondents during this type of telephone-based study. The negotiations were hindered by the lack of a clear precedent, Ringeisen noted.
Once the data collection could commence, a “gold standard” clinical interview was used as part of the study to ascertain serious emotional disturbance status. The instruments used were a shortened version of the Child and Adolescent Psychiatric Assessment (CAPA) for children age 8 and over and the Preschool Age Psychiatric Assessment (PAPA) for children between the ages of 4 and 7. The short version of the instruments included five modules: depression, anxiety, attention deficit hyperactivity disorder (ADHD), oppositional defiant disorder, and conduct disorder. The instruments also included an incapacities module that assessed impairment for all endorsed symptoms (absent, partial, or severe). Serious emotional disturbance status (positive or negative) was determined on the basis of responses to the five CAPA/PAPA modules as well as scores on the incapacities module. These instruments were the only diagnostic interviews that were designed to be complementary across the wide age range included in the study. However, Ringeisen said, using two versions of the instrument had implications for statistical modeling (which were discussed later by Aldworth).
Using the data available, a series of analyses were conducted to determine the issues associated with modeling the children’s status using
independent variables from the NHIS. There was no apparent consensus in the field about the appropriate cut point for impairment, so the decision was made to use the CAPA incapacities section to model three different possible definitions, based on three different impairment cut points: (1) presence of any disorder assessed and any partial or severe impairment rating, (2) presence of any disorder assessed and at least three partial or one severe impairment rating, and (3) presence of any disorder assessed and any severe impairment rating. The first definition was the most general, and the third one was the most restrictive, while the middle one was similar to the definition in the National Comorbidity Study Adolescent Supplement. As would be expected, Ringeisen said, the different cut points resulted in very different prevalence rates.
The models examined various ways to use the NHIS SDQ to predict child serious emotional disturbance. One approach was based on the total five-item SDQ score, which Goodman had earlier said that he does not think works very well. Another approach was based on the five individual SDQ item scores, both with and without the SDQ impact item. The idea was to try to determine which combination would perform best at predicting serious emotional disturbance status on the basis of the CAPA and PAPA interviews. The researchers also examined the impact of age on the calibration models, Ringeisen said, but due to small sample sizes, the results of these exploratory analyses were ambiguous.
As had been discussed earlier during the workshop, research indicates that obtaining more than one report on these topics is very useful, but due to institutional review board concerns, telephone interviews were only possible with children 12 and older. This approach meant that cases in the age groups where two reports were available had a higher probability of a positive serious emotional disturbance status. In addition, Ringeisen reminded the workshop participants that the data that included only parent interviews were collected with two different instruments, the PAPA for children aged 4-7 and CAPA for children aged 8-11. The CAPA was also the instrument used for the oldest age group (ages 12-17). Thus, from a statistical perspective, reconciling different age-dependent measures and definitions was also difficult.
Ringeisen said that there are several issues that still need resolution before attempting to implement model-based estimation of serious emotional disturbance in children. One issue is that there are difficulties with matching reference periods between screening and diagnostic assessments. The Federal Register definition of child serious emotional disturbance requires the presence of a past year mental disorder (see Chapter 1), and there are a number of diagnostic assessments that ask about the past year. The SDQ asks about behaviors exhibited in the past 6 months, while the CAPA and PAPA ask about symptoms in the past 3
months. Thus, there was a mismatch between the screening and clinical interview reference periods in the pilot study.
Another challenge, as several of the speakers noted, is that there is no consensus for how serious impairment should be measured or defined as an explicit cut point within particular measures. In the pilot study, three definitions were examined, each varying in the degree of severity required to meet the definition of serious impairment. These definitions each resulted in very different prevalence estimates across age groups, Ringeisen noted.
There are also several instrument limitations. The 1993 Federal Register definition is designed to cover children from birth to 18 years, but complementary diagnostic and impairment tools do not exist to measure the presence of an impairing mental disorder across this entire age span. There are also instrument limitations with regard to updates for DSM-5, because most clinical interview tools have not yet released updates, and some instruments will not have a DSM-5 update available. In addition, Ringeisen said, there are no studies that directly compare the impact of administration mode (e.g., telephone or in-person administration) for the leading lay-administered child diagnostic interviews, such as the CIDI, the Diagnostic Interview Schedule for Children, or CAPA.
Future research of this type will need to have sufficiently large sample sizes for each age group to support age-specific models. Additional thought will also need to be given to reconciling discontinuities between the three age groups (4-7, 8-11, and 12-17) and their implications for estimating serious emotional disturbance across ages. The ramifications of different types and numbers of reporters (parents, children, teachers) for statistical modeling also need to be better understood.
Aldworth provided additional technical details about the model-based estimation effort for serious emotional disturbance in children. He began by listing the assumption underlying the method. The first assumption is that the there is a “gold standard” measure that is based on a diagnosis from a clinical interview, and that this measure has yes/no values. To use a model-based method, which is cheaper than administering the clinical interview to everyone in the sample, it is assumed that the gold standard measure is the truth, even if the truth is not measurable or knowable. If there is any deviation between the gold standard measure and the truth, this is not accounted for using this method.
The steps in a model-based method to estimate child serious emotional disturbance can be described as follows:
- Administer a predicting scale, such as the SDQ, to all eligible respondents in the main survey.
- Select a subsample from among the eligible respondents in the
-
main survey and administer the clinical interview to obtain the gold standard measure for the subsample.
- For the subsample, use a logistic regression model to “match” the gold standard measure to the scale administered in the questionnaire. The gold standard measure is the response variable, and the scale from the questionnaire that was administered is the predictor variable. Other covariates associated with serious emotional disturbance can also be included in the model.
- Select a cut point to dichotomize predicted probabilities of serious emotional disturbance (yes/no) based on model.
- Extrapolate the model (and cut point) to all eligible respondents in the main survey to determine serious emotional disturbance status for each respondent, and obtain prevalence estimates, using the full power of the main survey
Aldworth noted that the purpose of the model-based method is to provide prevalence estimates overall and within subgroups, and not to provide an individual diagnosis. Consequently, minimizing bias is crucial, while minimizing the error rate is not as important. For more nuanced analyses, the error rates may become more important. In contrast, for individual diagnostic tests, the needs are very different and depend on the disease. For example, in the case of a disease such as Ebola, a false negative might be a death sentence, and so it is critical for the false negative rate to be near zero, irrespective of the false positive rate. In other words, in this case, bias is not as important.
The Adult Serious Mental Illness Study
Aldworth also discussed the work RTI has performed to model serious mental illness in adults. The project, referred to as the Mental Health Surveillance Study (MHSS), used data from the NSDUH, which included the Structured Clinical Interview for the DSM-IV. The methodology was similar to that used by RTI to estimate child serious emotional disturbance, but while the child study required three distinct serioius emotional disturbance measures that varied by age group and led to the decision to develop three different statistical models by age, the serious mental illness study involved a single measure for the entire adult age span.
Aldworth said that one challenge with the adult project was the effect of the weights. Optimizing the design to select a subsample led to large weights because the weights from the subsample were multiplied with the weights from the full NSDUH. One concern related to large weights is that they may have undue influence on determining the position of the cut point. The approach may work well in a subsample and produce an
unbiased estimate, but it could become a problem when extrapolated to a main survey, which is used to produce the prevalence estimates. A more practical concern was that a large weight straddling the neighborhood of the cut point could make it difficult to equalize the false positive and false negative counts, resulting in bias in either direction, depending on the location of the cut point. To counteract some of these problems, Aldworth said, the research team modified the subsample design by “reversing” selected undersampling and oversampling in the main survey. This technique helped reduce that weight variability.
In addition to the impact of the weights, sample size limitations represented the other major challenge in the project to model serious mental illness in adults. The size of the subsample affected the gold standard estimates, as well as the model-based analyses and estimates. For the gold standard estimates, the measure is assumed to be truth for the selected respondents. However, Aldworth noted, if the subsample size is too small, the gold standard prevalence estimates may be subject to large design-based sampling error, particularly at the subgroup level. A model is used to match the gold standard prevalence estimates made available by sample design, but a model cannot address design-based sampling error, regardless of how good the model is.
A small subsample size can also affect model-based analyses and estimates. The weighted model-based analyses and estimates are subject to the same design-based sampling error, again, particularly at the subgroup level. The model-based bias and classification error are statistics that play an important role in determining the model, and they are conditional on the subsample prevalence estimates. If the subsample is small, the bias and classification error could also be affected. In addition, Aldworth noted, a small sample size could also affect regular model-based errors. There may not be enough data to identify the best model, resulting in unmeasured bias at the subgroup level, and the standard errors associated with the beta estimates of the model may be larger.
In the MHSS study, after 1 year of data collection, the researchers had a sample size of 750, and they developed a two degrees of freedom model using the Kessler Psychological Distress Scale (K6) and the World Health Organization Disability Assessment Schedule (WHO-DAS) as predictors. By the end of 5 years, data had been collected on 5,000 cases, which allowed determination of an improved five degrees of freedom model, including an age variable, past year major depressive episode, and past year suicidal thoughts, in addition to the K6 and WHO-DAS data. The age variable allowed for a substantial reduction in bias within age groups. Adding past year major depressive episode and past year suicidal thoughts resulted in large reductions in classification error. In
other words, this is an example of a better specified model, in which the model error was reduced.
Aldworth noted that model misspecification error and model error will be transferred to the error in the prevalence estimates. However, these errors are not accounted for in the standard errors associated with model-based prevalence estimates obtained from the main study data, which only take the design-based sampling error into account. This is especially a problem with smaller sample sizes, where the errors that are not accounted for are larger, so more work is needed to address these technical difficulties.
Another challenge discussed by Aldworth was the unintended consequence associated with adding covariates. Although the model was improved by adding past year major depressive episode and past year suicidal thoughts, problems arose in any joint analyses with serious mental illness and the two new predictive variables. For example, trying to determine the proportion of adults who had both a major depressive episode in the past year and a serious mental illness tended to result in overestimates. One way to address this problem is to formulate the final model taking into account the list of variables assumed to be important in terms of planned joint analyses and create alternative models. The alternative versions of the final model can then exclude the covariates required for joint analyses from the model, as needed. The RTI team is working on this for the adult mental health project, and it could also be considered for the child study.
Aldworth concluded by saying that although predicted probabilities are theoretically continuous in a (0,1) interval, in practice there are only as many distinct values as there are in all combinations of the predictor variables. For example, if there is one predictor variable in a model with six levels, then there will be only six distinct predicted probabilities possible. If there are too few distinct predicted probabilities, gradations between them may be too coarse to identify a minimum-biased cut point. In practice, the cut point can occupy any value within the interval between gradations (consecutive predicted probabilities), which leaves some indeterminacy if the interval is large.
Next Steps
After Aldworth’s presentation, Ringeisen summarized some of the next steps needed, particularly for prevalence estimates of child serious emotional disturbance. She said that a priority is to develop a welloperationalized definition of the concept, amenable to estimation in a national study. Such a definition should include recommended cut points for various age groups on available impairment measures. Operational-
izing existing measures of impairment with concrete, developmentally grounded and culturally sensitive anchors is also needed to increase the accuracy of assessments. Tools are especially needed to assess impairment in the youngest children, she noted. The research community as a whole needs to build agreement around the best predictive and gold standard measures to use in estimating the national and state prevalence of serious emotional disturbance in children from birth to 18 years. As discussed, existing datasets could be leveraged to conduct analyses that can assess the power of various candidate tools for prediction in statistical models.
It would be useful to better understand how to address the seam effects that result from change in instrument type across the age span and in the required number of informants by child age. It would also be useful to have more information on the effects of data collection modes, in the context of both data quality and cost efficiency. Finally, it will be important to address challenges associated with the varying reference periods that exist between the Federal Register definition of child serious emotional disturbance, predictive tools embedded in candidate national surveys, and “gold standard” clinical assessment tools.
Kalton asked whether it would be necessary to include the respondent’s state of residence as one of the variables in the model, such as the one used in the MHSS, in order to accomplish the goal of producing state-level estimates. Aldworth replied that it is yet to be determined whether there is bias at the state level. If there is, it might be possible to create a few state categories, instead of adding all 50 to the model. Bose added that given the sample size limitations, the assumption had to be made that the model would hold for all states. Ideally, there would be a large enough sample size to examine potential biases at the state level, but that may not be practical due to cost considerations. She added that the model that was used for producing estimates of serious mental illness in adults was found to be acceptable by SAMHSA and data users.
Dean Kilpatrick (Medical University of South Carolina) asked the group whether it would be worthwhile to reexamine whether the clinical interviews conducted by trained mental health professionals are truly the gold standard, as is generally assumed. Research on mode effects shows that the perceived anonymity associated with self-administered questionnaires often results in different responses. Bose replied that if the decision is made to use model-based estimation, a discussion of the gold standard would definitely be needed. Szatmari commented that he and his colleagues used a questionnaire that was widely criticized for not having the same credibility as a clinical interview, but when the correlates of classification by questionnaire were compared with the correlates of classification by clinical interview, the results were the same. In other words, both methods led to the conclusion that attention deficit hyperactivity
disorder (ADHD) is associated with similar characteristics, including boys and poverty. The children may not be exactly the same, but the conclusion was that the two methods have the same construct validity. Bose added that fitness for use is an important consideration. The estimates of serious mental illness have an approximately 4-5 percent misclassification rate, and some users are worried about that. SAMHSA would like guidance on the advantages and disadvantages of structured lay interviews in comparison with semistructured lay interviews and with clinical interviews.
Canino said that if the goal is not only to produce prevalence rates but also to measure DSM disorders with substantial impairment, the choice of measures is more limited. Bose agreed that if a model is used one is not really measuring those concepts, but instead using a proxy. In these cases, face validity is very important. Canino added that in this sense the definition could be interpreted as meeting the criteria for a disorder or a probable disorder.
SMALL-AREA ESTIMATION OF PREVALENCE
Alan Zaslavsky (Harvard Medical School) discussed a small-area estimation project to estimate the prevalence of serious emotional disturbance among children in schools.4 Small-area estimation is useful when sample sizes are inadequate to produce direct estimates. The project involved using a short scale to collect detailed domain data, and a limited amount of data collected based on a calibration survey with a validated longer instrument. Models were developed relating the instruments at the individual and school levels, and the relationships were used to build predictions from the short scale for school-level prevalence rates and individual-level screening.
One of the measures used for the study was the CIDI, which is used for the assessment of mental disorders and is administered by trained lay interviewers. The version used in this study was the adolescent version, which includes both a child interview and a parent questionnaire. As others mentioned in the first half of the workshop, whether parent reports or child reports are more accurate depends in part on the disorder. For example, parents can observe ADHD, while children may be unaware of it. The CIDI contains most of the information required to determine serious emotional disturbance. What is missing is an assessment of func-
______________
4Li, F., and Zaslavsky, A.M. (2010). Using a short screening scale for small-area estimation of mental illness prevalence for schools. Journal of the American Statistical Association, 105(492), 1323-1332; Li, F., Green, J.G., Kessler, R.C., and Zaslavsky, A.M. (2010). Estimating prevalence of serious emotional disturbance in schools using a brief screening scale. International Journal of Methods in Psychiatric Research, June 19, Suppl. 1, 88-98.
tioning, but it can be imputed from the CIDI diagnosis and other items. In the study Zaslavsky described, this was done based on a model estimated from 347 clinical validation interviews, using the Children’s Global Assessment Scale (CGAS), which were conducted as part of the study.
The other measure included in the study was the K6. The K6 can also be administered by lay interviewers or self-administered and includes six items focused on internalizing disorders. Because the scale is geared toward adults, it addresses the most common internalizing disorders among adults, such as depression and anxiety. In order to supplement the K6 for an adolescent population (ages 14-18), Zaslavsky said, the researchers considered 18 additional items for possible inclusion, including some screeners and some questions about symptoms of behavior disorders. These additional measures focused on disorders with earlier onset, and externalizing disorders, such as oppositional defiant disorder (ODD), conduct disorder, and ADHD. After testing, five items were selected to predict the disorders that are not very well predicted by the K6, and these included screeners for ADHD, ODD, and intermittent explosive disorder, as well as two personality items: “I can stay out of trouble” and “I have a strong temper.”
Zaslavsky said that the predictive power of the K6 scale increased when the five items were added (K6+5). In the case of mood disorder and anxiety disorder, the area under the receiver operating characteristic curve increased slightly, from .77 to .81 for mood disorder and from .73 to .75 for anxiety disorder. However, in the case of any behavioral disorder, the increase was considerably larger, from .67 to .82. For serious emotional disturbance with an associated behavioral disorder, the increase was from .53 to .78.
Data collected in the National Comorbidity Survey Adolescent Supplement (NCS-A), discussed by Merikangas (see Chapter 2), was used to develop the methodology to estimate the small-area prevalence of serious emotional disturbance among schoolchildren in the United States. For this study, the school-based component of the NCS-A was used, which is based on a stratified national probability proportional to size sampling method. As a result of a highly complex model that allows for the replacement of schools that refused to participate, the number of schools included was 320. However, for this study, data from 282 schools were used, with at least 10 students per school. The number of adolescents included in the study was 9,244, which represented a 74.7 percent participation rate. The parent response rate, conditional on a child response, was 83.7 percent.
Zaslavsky explained that he and his colleagues fitted a Bayesian bivariate multilevel regression model with correlated effects for the probability of serious emotional disturbance and the augmented K6 (K6+5) score at
the individual and school levels. For two continuous outcomes (Y1, Y2), the following two-level bivariate random effects model was assumed:
![]()
where i is cluster (school, neighborhood, etc.); j is individual; m = 1, 2 = measure (K6 or CIDI); X is covariates; v is cluster-level random effect; and e is individual-level random effect. The random effects for the two measures are related at both individual and school levels: (vi1, vi2)′~N(0,∑v), and (eij1, eij2)′~ N(0,∑e).
The outcome can be treated as a dichotomized outcome, in which case the Yij2 is the latent variable that determines whether the dichotomized variable is 1 or 0 (whether serious emotional disturbance is present or not):
![]()
where Y1 is the screener score, Y2 is Φ(P(SED)), and Y3 is the presence of serious emotional disturbance.
Alternatively, Zaslavsky said, it is possible to make use of the probability obtained from the CIDI as the outcome. Either of these approaches works in the model, but using a dichotomized outcome means throwing away some information in the data about which of the “noncases” are close to “caseness” and which ones are far from it.
The covariates available were age, sex, race, and ethnicity, as well as age of school entrance in order to distinguish children who entered school at an early age from those who entered when they were older. Information on the schools included whether it was a public or private school and the size (fewer than 50 teachers or 50 or more teachers).
Figure 4-3 illustrates the model relationships. The top level in the diagram shows the school-level effect, and it includes both the K6+5 and the serious emotional disturbance diagnostic procedure. They are related by a covariance matrix that provides information on how strongly they are correlated with each other. In other words, the school’s mean level of children with a serious emotional disturbance and the school’s mean level of K6+5 are related to each other, but they are not the same thing. Below that, there are the student-level effects, which are distinct for each individual: they are also related to each other, but distinct. Children who have a high score on the K6+5 will tend to have a high probability for serious emotional disturbance, but those are only related through a covariance. The covariate effects are shown on the sides of the diagram, Zaslavsky noted. The covariates that contribute to the responses of the student on the K6+5

FIGURE 4-3 Model diagram for estimating serious emotional disturbance among children in schools.
NOTE: See text for definitions of variables.
SOURCE: Workshop presentation by Alan Zaslavsky, June 2015.
are on the left, and the covariates (possibly the same) that contribute to the responses on the diagnostic interview are on the right.
The coefficients and variance components in the model were estimated from the data that were available from the 282 schools, and Zaslavsky next discussed those data. Table 4-5 shows variances, using continuous outcomes. The left column shows the school-level variances, and those are variances on the scale of the 0 to 44 coding of the results from the K6+5 scale. The right column shows the individual-level variances for the same quantities.
The individual-level variances are 15 to 20 times larger than the school-level variances, which is not surprising, because the emotional status of different children in the same school can vary greatly, Zaslavsky said. The last line of the table shows the correlation between the K6+5 variation and the serious emotional disturbance variation, and the correlation for the school-level component is very high (.845). This correlation means that although the school’s overall mean for serious emotional disturbance and K6+5 scores are not perfectly related to each other, they are strongly correlated, which is a measure of the validity of the K6+5 scale as an approximation or proxy for serious emotional disturbance. The correlation at the individual level is much smaller (.544), but still fairly substantial. Finding much stronger correlations at an aggregate level than at the individual level is not unusual in surveys, Zaslavsky noted.
Figures 4-4 through 4-6 show several different predictions. Figure 4-4 shows an out-of-sample prediction, which involves collecting data from
TABLE 4-5 Variances of K6+5 and Serious Emotional Disturbance Data at the School and Individual Levels
| Variance | v (School Level) | e (Individual Level) |
| Variance for K6+5 (σ 12) | 0.019 | 0.371 |
| Variance for serious emotional disturbance (σ 22) | 0.037 | 0.597 |
| P (Correlation) | 0.845 | 0.544 |
NOTE: See text for discussion.
SOURCE: Workshop presentation by Alan Zaslavsky, June 2015.
a subsample of students in the school and using those data to make a prediction for the remainder of the school. If K6+5 data are collected for a subsample of the students, it is possible to get an approximate inference for the school-level effect on the K6+5 scale, knowing that the mean of the individual-level effects tend to average out with large samples (as noted above, the correlation was .845). For another group of students who were not included in the survey, the prediction, vi2, was estimated, shown at the top of the diagram. One source of error is introduced because the students who were surveyed using the K6+5 have some individual variation around the school mean, ē, but with a large enough sample size, that variation is reduced. An additional amount of variation originates from the fact that the K6+5 mean for the whole school and the serious emotional disturbance mean for the whole school are correlated but not perfectly related. And finally, Zaslavsky noted, there is some additional variation associated with the prediction for the children who were not in the original sample. The average of that variation will tend to be close to zero with large samples.
Figure 4-5 shows a naive individual-level prediction. If the school information was not available, it would be possible to use the individual K6+5 data and random effects to predict the serious emotional disturbance scores for the same children, ignoring the clustering. This scenario flattens out the model and lumps together school-level variation and individual-level variation within the school. The correlation across the top of the diagram is close to the .544 of the individual-level effects because most of the variation for a single individual is at the individual level. The school-level variation does not carry much weight. This might not work well, Zaslavsky said.
Figure 4-6 shows an in-sample prediction, which involves collecting the K6+5 data for a sample of children, estimating their individual- and
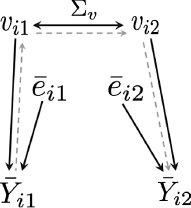
FIGURE 4-4 Out-of-sample prediction.
NOTE: This scenario involves collecting K6+5 measures in the school subsample and predicting serious emotional disturbance scores for the remainder of the school.
SOURCE: Workshop presentation by Alan Zaslavsky, June 2015.
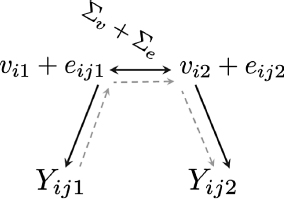
FIGURE 4-5 Individual-level prediction (naive).
NOTE: This scenario involves collecting K6+5 measures for individuals and predicting serious emotional disturbance scores for the same individuals; clustering is ignored.
SOURCE: Workshop presentation by Alan Zaslavsky, June 2015.
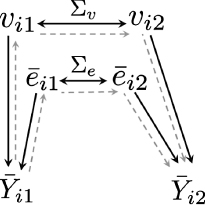
FIGURE 4-6 In-sample prediction.
NOTE: This scenario involves collecting K6+5 measures for a sample and predicting serious emotional disturbance scores for the same sample. The design with sampling within school combines in- and out-of-sample prediction.
SOURCE: Workshop presentation by Alan Zaslavsky, June 2015.
school-level mean effects on the K6+5, and then predicting serious emotional disturbance levels for the same sample of children based on the individual- and school-level effects on the serious emotional disturbance evaluation. In particular, this describes the situation in which every child in the school is administered the K6+5 scale and then serious emotional disturbance rates are estimated for the same group of children. This approach will enable a prediction of what the children’s scores would have been on the diagnostic evaluation. Again, if the sample size is large enough, the mean individual-level variation will tend to be close to zero. The correlations will be mostly determined by the correlation between K6+5 and serious emotional disturbance at the school level, which was very high.
The prediction for individuals, that is, predicting children’s serious emotional disturbance scores on the basis of their K6+5 scores, is a special case of in-sample prediction. However, the school-level random effect has a substantial effect on predictions for an individual, so it is helpful to make use of the information that a given child is in a school with a certain overall level of serious emotional disturbance, in addition to making use of the child![]() s K6+5 score. For example, a child with an average score on the K6+5 in a school that is one standard deviation above the median school-level random effect will have a probability of serious emotional disturbance of 12.7 percent; in a school that is one standard deviation below the median school-level random effect, the child will have a probability of serious emotional disturbance of 6.3 percent.
s K6+5 score. For example, a child with an average score on the K6+5 in a school that is one standard deviation above the median school-level random effect will have a probability of serious emotional disturbance of 12.7 percent; in a school that is one standard deviation below the median school-level random effect, the child will have a probability of serious emotional disturbance of 6.3 percent.
Zaslavsky discussed several limitations of the study. He acknowledged that there are measurement concerns related to the scales used, including the augmented K6, as well as the CIDI used as a proxy for serious emotional disturbance, which required some imputation of the clinical assessment of impairment. The use or development of other possible short scales could have been investigated. Furthermore, it is not clear whether these items would function in the same way in a different context. For example, the K6+5 was part of a lay interview that asked about a full range of DSM diagnoses, and it is possible that these measures would perform differently if they were included in a school health survey for which the context was not mental health.
Another limitation was that although the validation sample was fairly large in terms of these types of interviews, it was still not large enough to provide very precise estimates of the parameters of these models, particularly the variance/covariance parameters. More school-level covariates would have also been useful, especially if assignment policies and practices lead to higher rates of serious emotional disturbance in some schools.
There were also problems with the model fit at the high end, which Zaslavsky said has been seen in some of the other models. If the goal is
to rank schools or even to just try to get a rough idea of which schools have the most children with needs, this may not be a very big problem. However, it could be an issue when estimating absolute prevalence rates.
Zaslavsky mentioned that he and his colleagues did another study in which they used neighborhood characteristics (poverty, homelessness, racial/ethnic composition, stability, religion, urbanicity) as covariates. This approach was more similar to that of some of the studies described by the other speakers, but the covariates available were weaker. The study also included some additional school-level data, based on a principal questionnaire, on items such as frequency of depression reports, attacks, and fights.
Zaslavsky concluded by saying that it is technically possible to combine a short screening scale with a calibration survey, and the calibration survey can be something that is practical to administer. The short screening scale could be integrated with the collection of school health information or some other activity, and it could even be done online. In the case of his study, the scale only included 11 items, so it would be feasible to carry it out for a large number of children, in a large number of schools.
In summary, Zaslavsky noted that there was substantial improvement relative to a purely synthetic model based on demographics. In addition, the multilevel model was also better than a single-level regression from the K6+5 mainly because the multilevel model adjusted the coefficients on the basis of the amount of data available for each school. This approach provides more efficient estimates when the amount of data available varies across schools. With the parameter estimates in this study, a sample of 100 children would be fairly close to what is needed to obtain the best possible information from a school, so this approach may be feasible to implement in most schools.


