
4
Corridor Geography and
Interregional Transportation
As explained in Chapter 3, the supply of interregional transportation services is not uniform across the country, except for the widespread availability and use of the automobile. High rates of car ownership, a low per passenger cost of driving, and the distinct service attributes of the car help explain its prevalence. There are marked regional differences in the availability of the other modes of interregional transportation—airlines, buses, and trains—especially in the case of passenger trains. These differences arise from many factors. One that is emphasized in this chapter is corridor geography, because it can be especially germane to the ability of a railroad to supply competitive passenger train service.
A generally favorable condition for both intercity rail and bus service is the existence of commercially vibrant, densely populated downtowns where train and bus terminals are connected to extensive public transit systems that make service access convenient. Some populous but relatively remote U.S. cities, such as Minneapolis and Denver, have strong downtowns and good public transit systems; however, they have minimal intercity train service in particular. For reasons explained in this chapter, their local conditions may be supportive of intercity train service, but their regional geography is not. Unlike buses, which can operate with competitive schedule frequencies with about 40 passengers per departure, competitive train service requires traffic volumes capable of filling 200 to 300 seats, or five- or six-car sets.1 As discussed in the previous chapter, the density of train service is high in the Northeast Corridor (NEC), which contains some
________________
1 For example, the service-competitive Amtrak trains operating on Northeast Corridor routes average about 220 passenger miles per train mile and require trains sets of about 300 seats. See Federal Railroad Administration Rail Service Metrics and Performance: Quarter Ended June 2015, Table 5 (https://www.fra.dot.gov/eLib/Details/L17088).
closely spaced large cities as well as many smaller cities whose travelers can share the same train. The geography of the NEC thus favors the provision of efficient, single-line rail service with high traffic densities.
When large cities are dispersed and distant from one another, more interregional corridors are created, which are generally longer and less suited to efficient train service. They favor other modes such as airplanes that can collect and consolidate traffic in longer corridors and across a wide landscape. The positioning of cities in this dispersed manner is common in the United States, particularly in the interior. The significance of corridor geography for interregional transportation is apparent from the location of the country’s 200 most heavily traveled interregional markets. In some parts of the country, numerous city-pair markets overlap to create densely trafficked corridors that, in turn, shape the interregional transportation system. In other parts of the country, the transportation system is shaped by a more dispersed traffic pattern. This chapter profiles the major corridors connecting cities in five large geographic regions—the Northeast, Midwest, South Central, Southeast, and West. The review does not account for all relevant factors, but it offers insight into why some interregional markets, especially those in the Northeast, have sustained significant intercity train service while others have not.
GEOGRAPHIC PROFILE OF U.S.
INTERREGIONAL CORRIDORS
As discussed in Chapter 2, U.S. statistics on interregional travel are based largely on the American Travel Survey (ATS) conducted in 1995 and are therefore outdated. To compensate, the Federal Highway Administration (FHWA) provided the study committee with tables that estimate the number of long-distance person trips between city pairs in 2008. The estimates make use of airline and Amtrak ticket data and a model that calculates highway trips on the basis of relationships observed in the ATS and changes in population, households, and employment.2 Despite data
________________
2 As noted in Chapter 1, when used in this report, “city” refers to the core-based statistical area (CBSA). The city identified (e.g., New York City) is the core city in the CBSA, but all travel, demographic, and economic statistics are based on CBSA values. The methods used by FHWA to estimate trip tables are described in the Appendix.
shortcomings and modeling error, these calculated trip tables offer a general indication of where the country’s most heavily traveled interregional corridors are located and how their traffic is distributed among modes.
The tables suggest that about 200 interregional (100- to 500-mile) city-pair markets in the United States generate at least 1,000 person trips per day. A map of the 200 markets shows how they cluster in five broad geographic regions (Figure 4-1). Nearly one-quarter (48) are in the Northeast, which is defined as spanning New England to Virginia. An additional 28 are in the Midwest, centered on Chicago and involving other cities in states along the Great Lakes and the Upper Mississippi River (Figure 4-2). Atlanta and Miami anchor most of the 26 markets in the Southeast, and all 34 markets in the South Central are located in Texas and its neighboring states of Oklahoma and Louisiana. The remaining 64 are in the West, which encompasses the desert Southwest, California, and the Pacific Northwest.
Northeast
The Northeast has the country’s oldest cities. The importance of rivers and ports for the country’s early industry and transportation is evident in the urban geography of the region, which has many closely spaced cities along the Atlantic seaboard. Nearly all of the cities in this region matured during the 19th century, when railroads dominated interregional travel.
The close spacing of cities in the Northeast creates many short interregional markets. Straight-line distances range from 100 miles (Atlantic City–New York City) to 394 miles (Boston–Washington, D.C.), with a median of only 137 miles. Because of its size and central location in the region, New York City generates substantial traffic in pairings with the other large cities to the north (Boston, Providence, and Hartford) and south (Baltimore, Washington, and Richmond). New York also generates significant traffic flows with smaller inland cities such as Binghamton, Syracuse, and Rochester. Overall, New York City dominates interregional travel in the Northeast. It is part of 26 of the top 48 city-pair markets.
The central position and role of New York City are evident in Figure 4-3. The axis running from Boston through New York to Washington
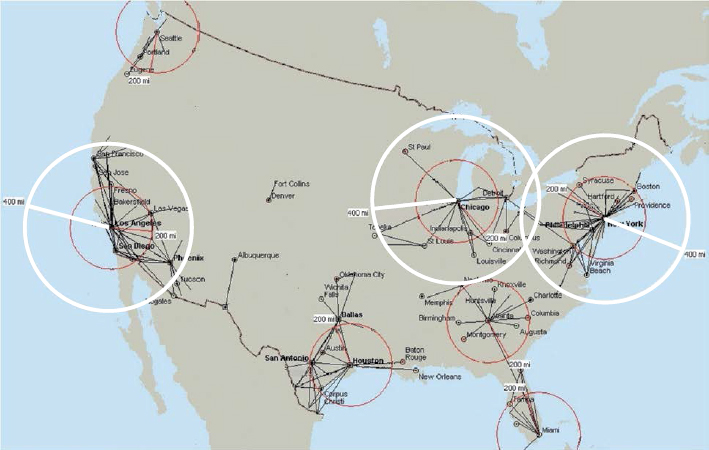
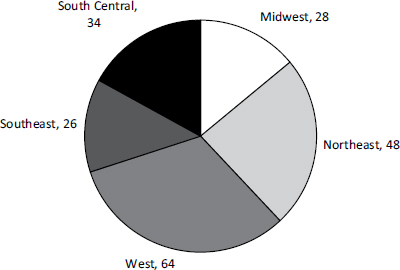
FIGURE 4-2 Regional distribution of 200 of the most heavily traveled interregional city-pair markets.
is the spine of the 400-mile NEC. Of the 48 travel markets concentrated in the region, 21 contribute to the traffic flowing through the NEC. Seven of the eight most heavily traveled markets in the Northeast are among these 21.3 Because so many trips begin or end in centrally positioned New York, interregional trips in the NEC average less than 175 miles.
The many overlapping Northeastern markets create traffic densities on the NEC that allow the frequent scheduling of train service. The Northeast has the highest use of passenger trains in the country, with 11 of the country’s top 15 rail markets being in the region. The New York–Washington market has the highest rail mode share (25 percent) in the country. There are several other interregional markets in the NEC that span less than 100 miles (and are thus not included among the 48 interregional markets) but have similarly high ridership, including New York–Philadelphia and Baltimore–Philadelphia.
________________
3 The 21 markets only include those in which both cities in the pair are in Massachusetts, Connecticut, Rhode Island, New Jersey, or Maryland or those involving one of the following cities: New York, Washington, Philadelphia, or Richmond. Markets involving locations north, west, and south of the NEC, such as Harrisburg, Scranton, Albany, Portland (Maine), Virginia Beach, Syracuse, Rochester, and Buffalo, are not included among the 21.
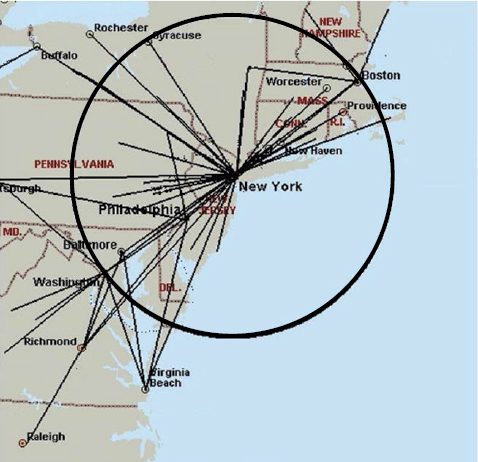
FIGURE 4-3 Top 48 interregional markets in the Northeast (radius of circle = 200 miles).
As has been noted, factors besides the close spacing and linear alignment of cities contribute to the high levels of train ridership in the NEC. They include good public transit systems, relatively low car ownership among center-city residents, and downtowns that have remained densely populated and a locus of commercial activity. Nevertheless, even with these favorable local conditions and a dense travel corridor, the automobile is dominant in the NEC. For example, the combined markets of Washington–Philadelphia, Baltimore–New York, and Washington–New York generate more than 20 million trips per year, but about 85 percent are made by car.
Midwest
Like New York City in the Northeast, Chicago has a dominant role in interregional travel in the Midwest (Figure 4-4). Chicago’s dominance results from its large population and base of economic activity and from its historical position as a regional rail and Great Lakes transportation center. Chicago was a junction for more than a half dozen railroads during the late 19th century and prospered as a hub for rail movements of passengers and freight. Many of the largest cities in the Midwest, such as Indianapolis, Kansas City, and Saint Paul, benefited from being junctions on major rail lines linked to Chicago.
In the same manner as New York, Chicago attracts large numbers of travelers from small and medium-size cities within 150 miles, such as Fort Wayne, Grand Rapids, and Madison. A key difference is that most of the large cities in the Midwest are relatively far from Chicago. For the most part, they are dispersed outside a circle that radiates 225 miles from
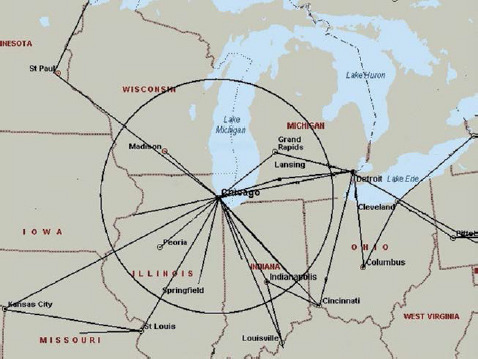
FIGURE 4-4 Top 28 interregional markets in the Midwest (radius of circle = 200 miles).
the city. Milwaukee is less than 100 miles from Chicago, and Indianapolis is 165 miles to the southeast. Detroit is the nearest large city, 240 miles to the east. Cincinnati to the southeast, Saint Louis to the south, Kansas City to the southwest, and Minneapolis to the northwest are all more than 250 miles from Chicago. In comparison, New York’s position in the middle of the linear corridor between Boston and Washington places it within 200 miles of nearly all of the Northeast’s largest metropolitan areas.
Perhaps because of longer distances between major cities in the Midwest, Chicago’s largest markets have relatively high airline use. Six of the 15 interregional markets involving Chicago have air mode shares of 15 percent or more. Only five of the 26 New York markets have comparably high air mode shares. The two Chicago markets with significant rail mode shares are Saint Louis and Detroit, at 8 and 10 percent, respectively. Mainly because of these two markets, passenger rail accounts for nearly 3 percent of all trips in the 28 Midwest markets.
Southeast
Atlanta and Miami dominate the 26 Southeast markets (Figure 4-5). The 11 Atlanta markets have a spatial pattern similar to the Chicago markets. Both cities are encircled by smaller “spoke” cities that are among the country’s earliest rail junctions. Many of the cities encircling Atlanta, including Chattanooga to the north and Birmingham to the west, grew from small towns after they were connected to railroads converging in Atlanta. These cities are located only 100 to 175 miles from Atlanta, a manageable distance for travel by train as well as by car and bus. However, all of these markets are dominated by highway travel, and there is virtually no passenger rail service in the region. The largest cities in the Southeast that are within 500 miles of Atlanta are Charlotte and Orlando. These cities generate significant travel to and from Atlanta both by automobile and by airplane because of the long distances involved (225 to 400 miles).
Florida is its own subregion. It accounts for 14 of the 26 markets in the Southeast (Figure 4-5). Most are anchored by Miami; three exceptions are Orlando–Atlanta, Orlando–Sarasota, and Tampa–Jacksonville. Unlike Atlanta, Miami did not rise to prominence as a railroad terminal, even though rail lines were extended to South Florida during the late 19th century.
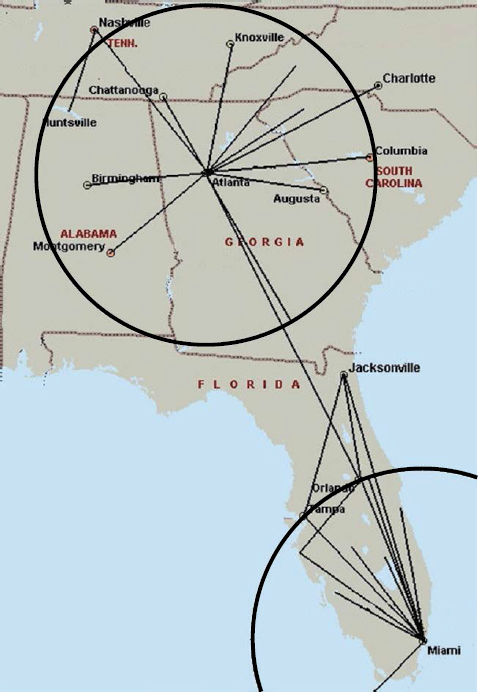
Miami and two of Florida’s other largest cities, Orlando and Tampa, prospered during the middle of the 20th century after passenger railroads were no longer a primary mode of interregional transportation. These cities are located far from the population centers of the East Coast and developed later than most others in the East, after the jet airplane made them more accessible and air-conditioning made them more livable.
Thus, the effects of past transportation technologies continue to be felt in the interregional markets farther north, but they are largely absent from the markets of Florida. Rail accounts for 2 to 3 percent of Miami–Tampa and Miami–Orlando trips, but otherwise trains are not widely used for travel in Florida. Automobiles account for more than 90 percent of trips in all but two of the 11 Miami markets, while one-quarter of Miami–Jacksonville and Miami–Tampa trips are made by air.
South Central
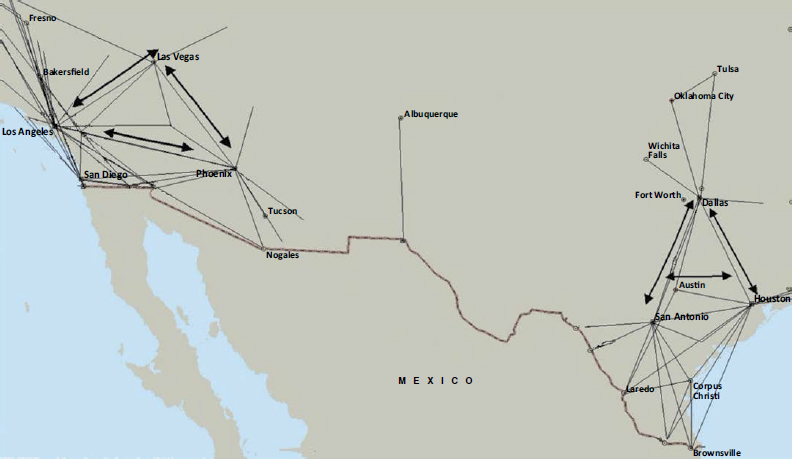
Except for Tulsa–Oklahoma City, all of the 34 heavily traveled interregional markets in the South Central region involve cities in Texas (Figure 4-6). The dominant cities in the region are Houston, Dallas, and San Antonio. The three are sometimes referred to as the “Texas triangle,” with each city pair forming a triangle side that is 190 to 250 miles long. All three were important rail hubs during the late 19th century; however, they experienced their greatest population and commercial growth during the 20th century after the introduction of the automobile and development of the Interstate highway system. Today, several major Interstate highways converge in Dallas, Houston, San Antonio, and Oklahoma City. The 34 South Central markets generate the highest automobile mode shares among the 200 markets examined, with a median automobile mode share exceeding 97 percent.
Automobile use is especially high between the large Texas cities and the many smaller cities bordering Mexico. Rail accounts for only 0.1 percent of total trips, the lowest regional rail mode share in the country. In total, fewer than 100,000 trips were made by rail in 2008 in the South Central markets, which is equivalent to less than 5 percent of the annual ridership between New York and Washington alone. The region’s largest rail market, Dallas–Oklahoma City, accounted for half of these rail trips. The Dallas–Oklahoma City rail mode share is slightly more than
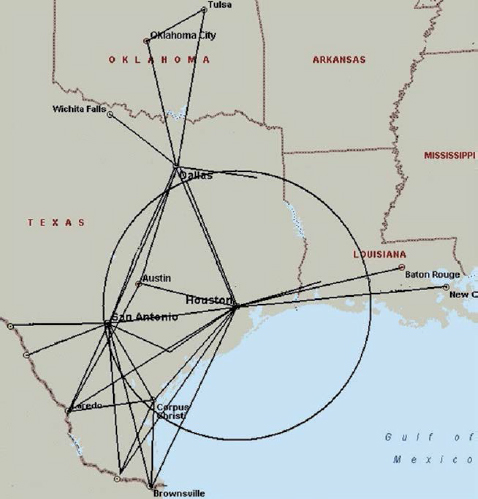
FIGURE 4-6 Top 34 interregional markets in the South Central United States (radius of circle = 200 miles).
3 percent; the next highest, for Dallas–San Antonio, is less than 1 percent. Airlines are a major means of transportation between the hub cities of Dallas and Houston and the spoke cities of Austin, New Orleans, Brownsville, San Antonio, and Tulsa.
West
The West encompasses by far the greatest area of the five regions examined. It consists of three major subregions: the desert Southwest, the
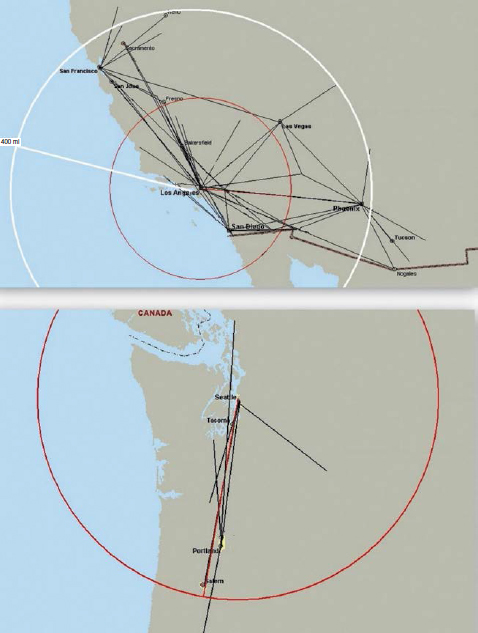
California coast, and the Pacific Northwest. The region contains some of the country’s oldest cities, such as San Francisco, as well as some of its newest and fastest-growing ones, such as Las Vegas and Phoenix. The latter cities are located far from navigable waters and railroad hubs. Unlike the Northeast and Midwest, no single city dominates the 64 markets (Figure 4-7). The most heavily traveled interregional corridor in the West is the short-haul (110-mile) San Diego–Los Angeles market.
Because of high traffic volumes between San Diego, Los Angeles, and Riverside, the short-haul Southern California markets account for 20 percent of the trips in the 64 interregional markets in the West. More than 94 percent of them are made by automobile. Nevertheless, Los Angeles–San Diego has the region’s highest rail ridership. Arizona also contains a number of very short-distance markets, such as Phoenix–Flagstaff and Phoenix–Tucson. However, Phoenix lacks passenger rail service. Most of the short-haul trips in Arizona are made by car.
Only 14 percent of all trips made in the 64 Western markets are between the populous northern (San Francisco, Sacramento, and San Jose) and southern (Los Angeles, Riverside, and San Diego) cities of California. Although the Los Angeles–San Francisco market accounts for the second-largest number of trips among city pairs in the region (after Los Angeles–San Diego), the long distance (350 miles) between the two cities deters travel by surface mode. As discussed in Chapter 3, airline service in this market is extensive. Nearly 60 percent of Los Angeles–San Francisco trips are by airline, and most of the rest are made by car.
Further to the north, Seattle and Portland are the principal cities in a half dozen markets accounting for about 13 percent of trips in the West region. Because most of the cities in the Pacific Northwest are separated by less than 150 miles, demand for air travel is limited, and the rail and highway modes account for most trips. Seattle–Portland has the highest rail mode share, at 7 percent, among the 64 markets in the West.
COMPARISON OF CORRIDOR GEOGRAPHIES
The length, shape, and traffic densities of the corridors formed by the relative position of cities in a region can affect the viability and service levels of the interregional transportation modes. The effects are evident
in the NEC and in other parts of the world. The classic corridor for passenger rail service is the Tōkaidō in Japan. This corridor, created by a series of large cities that line central Japan’s Pacific coast, is often referred to as a “string of pearls” (Nash 2014). Figure 4-8 shows the 350-mile routing of central Japan’s high-speed railway, the Tōkaidō Shinkansen, as it connects the large cities located between Tokyo and Osaka. Among these cities are six with metropolitan populations of more than 1,000,000 and two with populations of more than 500,000.
The Shinkansen was built more than 50 years ago specifically for high-speed service (speeds exceeding 150 miles per hour). It was developed to replace a circuitous and poor-quality narrow-gauge rail line that had become overcrowded with both passenger and freight traffic (Kurosaki 2014). The high-speed line was expected to be competitive with airlines and to create a large increase in transportation capacity in one of the most densely traveled corridors in the world (Nash 2009). Only 5 years after service was inaugurated, the line transported more than 80 million passengers per year. Subsequent additions to the line connecting cities to Osaka’s south and the addition of new high-speed lines to the north and west of Tokyo have increased annual ridership by tens of millions. The Japanese high-speed system now transports more than 150 million riders per year (Kurosaki 2014; Nash 2014). This high-speed network now spans most of Japan. Because of high traffic densities, the original Tōkaidō line and its southern extensions are believed to earn revenue sufficient to cover their operating expenses and to pay for asset maintenance and renewal.4
The term “string of pearls” has been used to describe linear, multimarket travel corridors in the United States, including the NEC and California’s north–south intrastate corridor. However, the demographic and geographic conditions of Japan’s Tōkaidō corridor have no strong parallels in the United States. In Figure 4-9, the metropolitan population of the Tōkaidō corridor is compared with the metropolitan populations of several linear travel corridors in the United States. The Japanese
________________
4 Whether subsequent line additions have produced revenues sufficient to cover capital replacement costs is less clear, but the independent railway companies that operate them are able to earn offsetting revenues from other sources, such as real estate investments near train stations (Kurosaki 2014, 121).
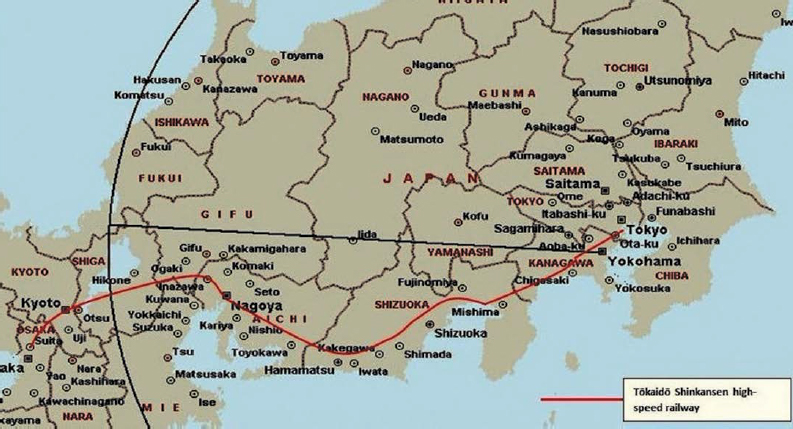
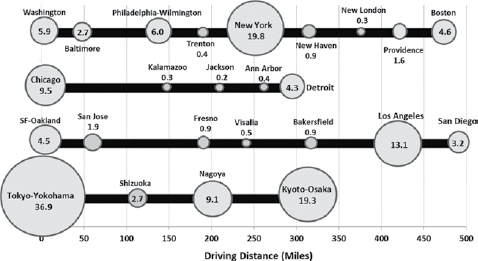
FIGURE 4-9 Populations and distances of metropolitan areas in selected interregional corridors in the United States compared with Japan’s Tōkaidō corridor. [Populations are in millions. (Adapted and updated from GAO 2009, 13–14.)]
corridor is much denser, since it connects about 65 million people, which is roughly twice as many as the NEC and California corridors.
Many other U.S. corridors have even less in common with the Tōkaidō or its string-of-pearls configuration. In most regions of the United States, cities tend to be dispersed rather than linear, and the resulting corridors are more aptly described as having radial (i.e., hub-and-spoke) or triangle-like shapes. The traffic corridors in the five regions already discussed are grouped according to these patterns below.
The NEC and Other Linear Corridors
The NEC contains five of the country’s 25 largest metropolitan areas: New York, Philadelphia, Washington, Boston, and Baltimore. It contains three other cities—Providence, Richmond, and Hartford—with metropolitan populations of more than 1 million. The longest distance separating any two neighboring cities among the eight is less than 150 miles. This conurbation creates corridor traffic densities unmatched by any other region of the country. As shown in Figure 4-10, the region has many city pairs with rail mode shares of 5 percent or more.
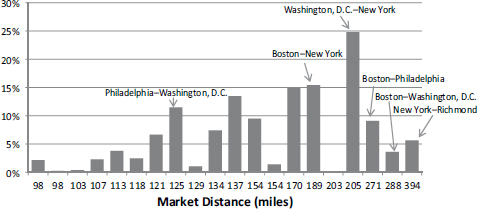
FIGURE 4-10 Rail mode shares in the NEC by market distance. [Horizontal axis is not to scale. (Estimates are based on FHWA trip tables, 2008.)]
Several linear corridors can be found in other regions, as shown in Figure 4-11. None is as densely populated or traveled as the NEC. California’s north–south corridor bears some resemblance to the NEC.5 It runs from San Diego and Los Angeles in the south through the Central Valley to San Jose, San Francisco, and Sacramento in the north. Its length is comparable with that of the NEC, but the two corridors differ in some respects. The NEC has two of the region’s largest cities, Boston and Washington, anchoring its ends, and New York is in the middle. Most interregional trips in the NEC are fairly short (less than 200 miles), because they either start or end in centrally positioned New York.
The central position of the heavily populated New York metropolitan area differentiates the NEC and California corridors. New York’s position creates many 100- to 200-mile markets, which are well suited to conventional rail service. In contrast, California’s corridor lacks a large, centrally located city, and therefore the corridor’s market distances tend to be longer. Its traffic flows are generated mostly from the northern and southern endpoint cities, which are separated by 300 to 500 miles.
________________
5 The 21 California corridor markets include all city pairs between San Diego, Riverside, and Los Angeles; between these cities and cities in the Central Valley; and between San Francisco, San Jose, and Sacramento and the Central Valley, San Diego, Riverside, and Los Angeles.
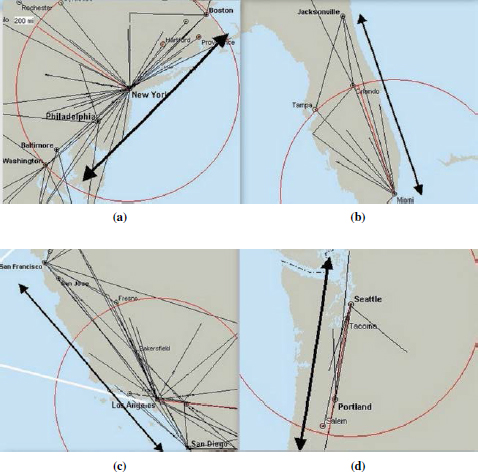
FIGURE 4-11 Linearly aligned interregional corridors in (a) the Northeast, (b) Florida, (c) California, and (d) the Pacific Northwest (radius of circles = 200 miles).
The potential for generating the many shorter-haul trips conducive to conventional rail is therefore smaller in the California corridor, where the longer interregional trip distances have stimulated interest in higher-speed rail.
Figure 4-12 shows that trips in California tend to occur in either the very short (≤125-mile) or very long (≥300-mile) markets, whereas trips in the NEC are more evenly spread among short- and middle-distance markets (100 to 250 miles). Only the NEC’s Boston–Washington (394-mile) market spans a distance comparable with those separating
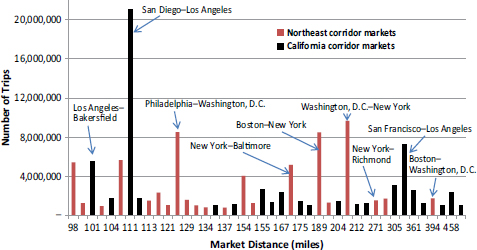
FIGURE 4-12 Total annual trips, all modes, in 2008, by market distance in NEC and California corridor. [Horizontal axis is not to scale. (Estimates are based on FHWA trip tables, 2008.)]
the major cities of southern and northern California. Like the California markets, this NEC market has a high airline mode share (61 percent).
Another string-of-pearls corridor configuration can be found in the Pacific Northwest, which has a north–south corridor extending from Bellingham, Washington, to Eugene, Oregon (Figure 4-11). Five of the six largest interregional markets in the Pacific Northwest are located on this corridor. The Pacific Northwest corridor is 325 miles long, but the average interregional trip is only 133 miles because most trips are between Portland and Seattle. The short distance between these two large cities, as well as the presence of a few other cities in between, helps explain the relatively high rail mode shares in the region.
Florida has a straight-line interregional corridor that extends along the Atlantic Coast for 325 miles from Miami to Jacksonville and encompasses the intermediate point of Orlando (Figure 4-11). However, this corridor accounts for only about one-quarter of the trips in Florida’s 14 largest interregional markets. Many more trips are made between Miami and the Gulf Coast cities that fan out to the city’s west and northwest. Three of the five most heavily traveled markets in Florida are between Miami and the cities of Naples, Fort Myers, and Tampa–Saint
Petersburg. Most of Florida’s cities are not configured in a string-of-pearls alignment.
Radial Corridors in the Midwest and Southeast
Although Chicago is the dominant city in the 28 large markets in the Midwest, it neither centers (as in New York) nor anchors (as in Los Angeles) a densely trafficked linear corridor connecting most of the largest cities in the region. Instead, Chicago is encircled in nearly all directions by many small, medium, and large cities (Figure 4-13). As noted earlier, the largest Midwestern cities are generally located at least 225 miles away, and they are far from one another. Furthermore, their connecting routes to Chicago have few intermediate cities that can add substantial rail traffic volumes.
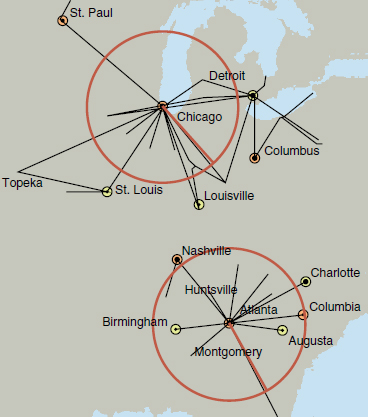
FIGURE 4-13 Radial shape of Chicago and Atlanta interregional corridors (radius of circles = 200 miles).
In the Southeast, Atlanta’s largest markets fan out in a manner similar to those of Chicago and create a radial configuration. Atlanta’s spoke corridors involve mostly smaller cities located 100 to 175 miles away (Figure 4-13). The potential traffic densities in the spoke corridors are reduced by the small size of the encircling cities and high use of the automobile, which is also well suited to distances of 100 to 175 miles.
Texas and Desert Southwest “Triangles”
The markets in the South Central region are not dominated by a single city but by the three largest cities in Texas: Houston, Dallas, and San Antonio. As noted earlier, the three form the vertices of a triangle, sometimes called the Texas triangle (Figure 4-14). Because the three cities are located 190 to 250 miles apart, they generate a mix of highway and air traffic. Each is also the largest city in pairings with a number of smaller cities positioned to the north (e.g., Oklahoma City), east (e.g., Baton Rouge), south (e.g., Corpus Christi), and southwest (e.g., Laredo). With the exception of Austin’s location between Dallas and San Antonio, none of the smaller cities falls within one of the Texas triangle’s sides, which limits the concentration of traffic in a corridor.
A corridor geometry that resembles the Texas triangle is formed in the desert Southwest by the roughly 200-mile corridor legs that join Los Angeles, Phoenix, and Las Vegas (Figure 4-14). As in Texas, the three do not include many intermediate markets to create overlapping traffic.
Comparisons of the most heavily traveled interregional markets in the United States indicate that their size and relative position within interregional corridors can affect the modes of transportation available. The region with the most modal diversity is the Northeast. The preservation in the NEC of rail lines devoted largely to passenger service is unique to this region, and it has contributed to passenger rail being an important mode of interregional transportation. Rail service there also benefits from the region’s large cities being closely spaced and aligned linearly to create a series of relatively short (less than 200 miles) and overlapping interregional markets that can be served in a single rail corridor.
New York City’s central position in the NEC is particularly important, because it has created many short-distance (100- to 200-mile) markets that can be served by rail.
The Japanese experience with passenger rail has particular relevance to the NEC. It confirms that the relative position of cities in a corridor can be important in providing frequent and efficient train service. The closely spaced and linearly aligned large cities along the east coast of Japan, sometimes referred to as a string of pearls, is the classic configuration for efficient passenger train service and the site of the world’s most heavily used passenger railway. The Tōkaidō high-speed line was built more than 50 years ago to serve travelers in this corridor after the existing poor-quality line became overcrowded with passenger and freight traffic.
In many parts of the United States, cities are distant from one another and dispersed. They form multiple and lengthy travel corridors that are not as conducive to passenger rail as the overlapping, short-haul markets that characterize the NEC. The interregional corridor in California that runs from the southern cities of San Diego and Los Angeles to the northern cities of San Francisco and Sacramento is most comparable with the NEC in overall length and in the size and number of city-pair markets, but not in their close spacing. In particular, the California corridor lacks a large metropolitan area centering it in the same manner as New York City, whose large size and central position generate many short-haul trips suited to service by rail. Currently, air travel is dominant in the California corridor because of the long distances between the state’s southern and northern population clusters. In addition, many airports serve the state’s large metropolitan areas, and their dispersed locations, more so than downtown train stations, tend to reflect the state’s decentralized urban populations and sites of tourism and commerce.
REFERENCES
Abbreviation
| GAO | Government Accountability Office |
GAO. 2009. High Speed Passenger Rail: Future Development Will Depend on Addressing Financial and Other Challenges and Establishing a Clear Federal Role. GAO-09-317, March. http://www.gao.gov/new.items/d09317.pdf.
Kurosaki, F. 2014. Shinkansen Investment Before and After JNR Reform. In The Economics of Investment in High-Speed Rail, Organisation for Economic Co-operation and Development, pp. 107–128.
Nash, C. 2009. When to Invest in High-Speed Rail Links and Networks? Discussion Paper 2009-16. Organisation for Economic Co-operation and Development–International Transport Forum Joint Transport Research Center.
Nash, C. 2014. When to Invest in High-Speed Rail. In The Economics of Investment in High-Speed Rail, Organisation for Economic Co-operation and Development, pp. 45–72.


