


Below is the uncorrected machine-read text of this chapter, intended to provide our own search engines and external engines with highly rich, chapter-representative searchable text of each book. Because it is UNCORRECTED material, please consider the following text as a useful but insufficient proxy for the authoritative book pages.
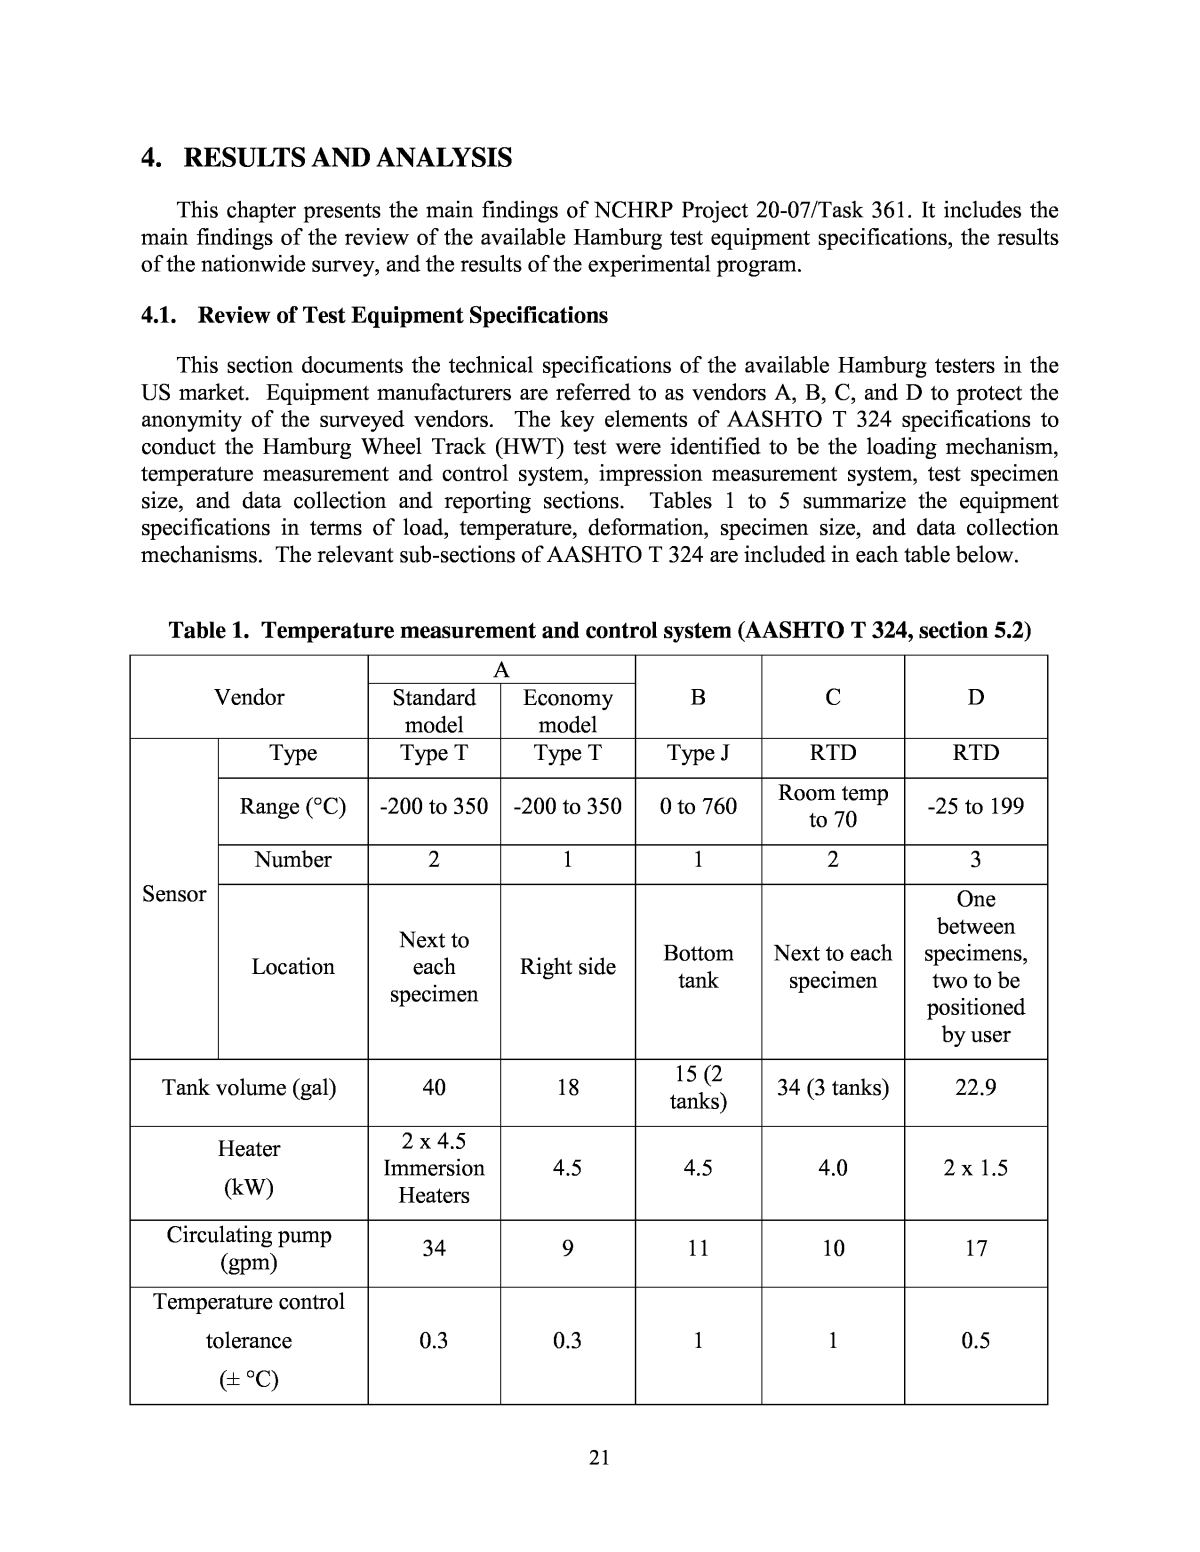
21 4. RESULTS AND ANALYSIS This chapter presents the main findings of NCHRP Project 20-07/Task 361. It includes the main findings of the review of the available Hamburg test equipment specifications, the results of the nationwide survey, and the results of the experimental program. 4.1. Review of Test Equipment Specifications This section documents the technical specifications of the available Hamburg testers in the US market. Equipment manufacturers are referred to as vendors A, B, C, and D to protect the anonymity of the surveyed vendors. The key elements of AASHTO T 324 specifications to conduct the Hamburg Wheel Track (HWT) test were identified to be the loading mechanism, temperature measurement and control system, impression measurement system, test specimen size, and data collection and reporting sections. Tables 1 to 5 summarize the equipment specifications in terms of load, temperature, deformation, specimen size, and data collection mechanisms. The relevant sub-sections of AASHTO T 324 are included in each table below. Table 1. Temperature measurement and control system (AASHTO T 324, section 5.2) Vendor A B C D Standard model Economy model Sensor Type Type T Type T Type J RTD RTD Range (°C) -200 to 350 -200 to 350 0 to 760 Room temp to 70 -25 to 199 Number 2 1 1 2 3 Location Next to each specimen Right side Bottom tank Next to each specimen One between specimens, two to be positioned by user Tank volume (gal) 40 18 15 (2 tanks) 34 (3 tanks) 22.9 Heater (kW) 2 x 4.5 Immersion Heaters 4.5 4.5 4.0 2 x 1.5 Circulating pump (gpm) 34 9 11 10 17 Temperature control tolerance (± °C) 0.3 0.3 1 1 0.5
22 Table 2. Loading mechanism (AASHTO T 324, section 5.1) Vendor Load Sinusoidal Wheel Speed Drive Schematic A Deadweight No Slider- crank B Pneumatic cylinder Yes Scotch- yoke C Deadweight Yes Two indep- endent motors and drives D Deadweight Yes Scotch- yoke
23 Table 3. Impression measurement system (AASHTO T 324, section 5.3) Vendor A B C D Standard model Economy model Sensor type LVDT LVDT Magnetostrictive LVDT Potentiometric position sensor Range (mm.) 50.8 50.8 101.6 50.8 50.0 Tolerance (± mm) 0.15 0.15 0.0762 0.1 0.045 Location Mounted on the side of the specimen Mounted on the side of the specimen Top of cylinder Attached to the back of loading arm Mounted on side of frame in line with wheel Table 4. Specimen and track length (AASHTO T 324, section 6.4.2) Vendor A B C D Standard model Economy model 10.671 inch 10.671 inch 10.100 inch 10.700 inch 10.700 inch 9.000 inch 9.000 inch 9.000 inch 9.000 inch 9.060 inch
24 Table 5. Data collection and reporting Vendor A B C D Standard model Economy model Number of data points collected across specimen 11 11 5 Selectable up to 21 227 Range (± from midpoint), inch 4.5 4.5 4.5 4.5 4.45 A/D resolution (bit) 16 16 12 17 16 4.1.1 Loading Mechanism The four HWTs identified apply the load to the specimen using either a dead weight or by using a pneumatic cylinder. The effect of using these two methods of load application was investigated as part of the experimental program. 4.1.2 Wheel Speed The existing HWT devices can be broadly classified into sinusoidal (Vendors B, C, and D) and non-sinusoidal loading testers (Vendor A). Due to the geometry of the loading mechanism, the speed of the travelling wheel varies sinusoidally (in the case of Vendors B, C, and D) or in a non-sinusoidal fashion (Vendor A). The geometry of the non-sinusoidal test machine is shown in Figure 13. This mechanism is identical to the crankshaft-connecting rod-piston mechanism used in automobiles and the wheel (crank circle) speed equation can be obtained from automotive engineering texts. Figure 13 Crank-slider mechanism
25 There are three consequences of a non-sinusoidal wheel speed: [1] the total time of loading of the front half of the specimen is less than that of the rear half of the specimen; [2] the average speed on the front half of the specimen is more than the average speed on the rear half of the specimen; and [3] the maximum speed is not achieved at the mid-point of the stroke, but rather at some point on the front specimen. 4.1.3 Temperature Measurement and Control System AASHTO T 324 test specification currently requires the water bath to be able to control the temperature from 25 to 70°C (±1.0°C) using a mechanical circulating system. Vendors A and B use thermocouples while vendors C and D use Resistance Temperature Detectors (RTDs) as sensors to measure and control bath temperature. Both sensor technologies (thermocouples and RTDs in conjunction with signal conditioning electronics and analog-to-digital converters) meet the accuracy requirement of the test method and the text in AASHTO T 324 section 5.2 should continue to remain technology neutral. The HWTs employ an immersion type heater(s) to heat and maintain the temperature in the water bath. A pump circulates the water continuously to minimize the temperature gradient. 4.1.4 Impression Measurement System In the current version of the AASHTO T 324 test method; there is a requirement of a specific type of sensor (an LVDT, or Linear Variable Differential Transformer) to measure the rut depth. The minimum range of this sensor is specified as 20 mm, with an accuracy requirement of 0.15 mm. Table 3 lists the details of the impression measurement systems as implemented by the evaluated vendors. The sensing technologies used include LVDT, magnetostrictive, and potentiometric methods. The ranges of these sensors vary between 50 and 100 mm. Table 3 also shows the locations of these sensors in the various vendorsâ designs. Some of the designs incorporate side-mounts or mounting on the back of the loading arm, while others mount them on top of the loading arms or the pneumatic loading cylinders. The readings from the various designs should provide similar results, provided there are no compliance issues. 4.1.5 Specimen Length and Track Length The cylindrical specimen mounting system in AASHTO T 324 allows some dimensions to be set by the test system vendor (Figure 2 of T 324). Table 4 shows the total specimen length, without any gap, for each of the four vendors. The molds provided by vendors A, C, and D allow a total specimen length of 10.7 in. while the corresponding dimension for vendor B is 10.1 in. Currently, the track length in most of the test machines is close to 9.0 in. These dimensions were verified as part of the experimental program. 4.1.6 Data Collection and Reporting Table 5 summarizes the data points collected per cycle and the range of travel covered by the surveyed vendors. The number of data points collected varies from five (Vendor B) to 227 (Vendor D). These data points can be collected over the entire range of travel of the wheel. For example, the range of ± 4.5 in. from the center of the specimen equates to a total 9.0 in. track length that can be covered. The impression measurement requirement in the current version of AASHTO T 324 specifies that the system be capable of measuring the rut depth âat the center (± 1/2 in.) along the length of the wheelâs path.â However, the report section (10.1) of AASHTO T 324 stipulates that the âmaximum impressionâ be reported.
26 4.2. Findings of the Nationwide Survey A nationwide survey was conducted to collect information from state agencies on the use of HWTs. The survey was posted online and distributed through various list serves; it was also announced at related TRB committees. The research team complemented statesâ responses with a review of state specifications available online as well as through email communications, which allowed a 100% response rate. References are provided for the following state specifications: Iowa (2), Montana (3), Colorado (4), Utah (5), Texas (6), Oklahoma (7), Wisconsin (8), Louisiana (9), California (10), Illinois (11) and Washington (12). A copy of the survey and the contact information of survey respondents are also provided in Appendix A. Figure 14 presents the current use of HWTs by the different states. While 21 out of 50 states indicated that they use HWT (Figure 14), further evaluation of state specifications showed that only 12 states use it for acceptance of asphalt mixes. Nine states are currently using HWT for research purposes or are in the process of implementing HWTs in their specifications (e.g., New Mexico). Of the remaining states, 17 states reported that they use the Asphalt Pavement Analyzer (APA), which is another type of laboratory wheel-tracking device standardized by AASHTO T 340 but is not within the scope of this research project. Figure 14 States Using HWT and APA The states that currently use HWTs in acceptance of asphalt mixes are California, Colorado, Illinois, Iowa, Louisiana, Massachusetts, Montana, Oklahoma, Texas, Utah, Washington, and Wisconsin. It is noted that Wisconsin DOT contracts out HWTs testing but the test is included in their specifications. It appears from the responses that many states are in the process of adopting this test in their specifications and one would expect the number of states using the HWT to increase significantly in the next five years. For instance, Vermont, Georgia, New York, and South Carolina indicated in their responses the possibility of adopting this test in the near future.
27 4.2.1 Type of HWTs Used The second question in the survey related to the HWT brands used by the states. Available vendors are Troxler Electronic Laboratories, Inc.; Pavement Technology, Inc. (PTI); James Cox & Sons, Inc.; and InstroTek, Inc. Among those 12 states that specify HWT, a Troxler is used; however, it is noted that the other products are relatively newer and the states may acquire HWTs from the other vendors in the future. Since HWTs can be conducted on one-wheel or two-wheel devices, states were asked how many wheels they use. While Massachusetts uses one- wheel, all other states indicated that they are using two wheels devices. 4.2.2 Test Methods Used States were polled on the test method used to conduct Hamburg wheel testing in their specifications. Since AASHTO T 324 does not specify a test temperature, all states need to modify the test method to reflect local environmental conditions. While Texas, Colorado, and Montana DOT are using their own state specifications (Tex-242F, CP-L 5112, MT-334, respectively), all other states use AASHTO T 324 or modified AASHTO T 324 as their specifications. Kansas and Florida mentioned they use Tex-242F state specifications as designation if needed. The survey also polled the respondents on how often their states calibrate their HWT devices. Based on the responses, seven states indicated that they calibrate the devices every 12 months. Colorado, Illinois, and Oklahoma indicated that they calibrate the water bath temperature every six months and all other components every 12 months. Texas and Washington calibrate all HWT components every six months (Figure 15). It is noted that results presented in Figure 15 are only for the states that use HWTs for acceptance of asphalt mixes and not for research purposes. According to AASHTO T 324, water bath temperature needs to be calibrated every six months. Wheel-load and LVDTs should be calibrated based on manufacturerâs recommendations. AASHTO T 324 also requires âverifying that the wheel is reciprocating on the test sample at 52 ± 2 passes per minuteâ but does not mention how often it should be calibrated. Based on the survey responses, all states calibrate load, LVDTs, and temperature. Oklahoma is the only state that documents a detailed procedure on how to calibrate HWT for temperature, load, LVDTs, and wheel frequency. From these responses, it appears that HWT calibration needs to be more detailed in AASHTO T-324 to allow for comparable precision between the states. The states were also asked whether their laboratory is AMRL certified for AASHTO T 324 or not. Among those 12 states that specify HWT, Colorado, Wisconsin, and Massachusetts are not AMRL certified for AASHTO T-324. Results were verified from the AMRL website: http://www.amrl.net/amrlsitefinity/default/aap/r18labs.aspx
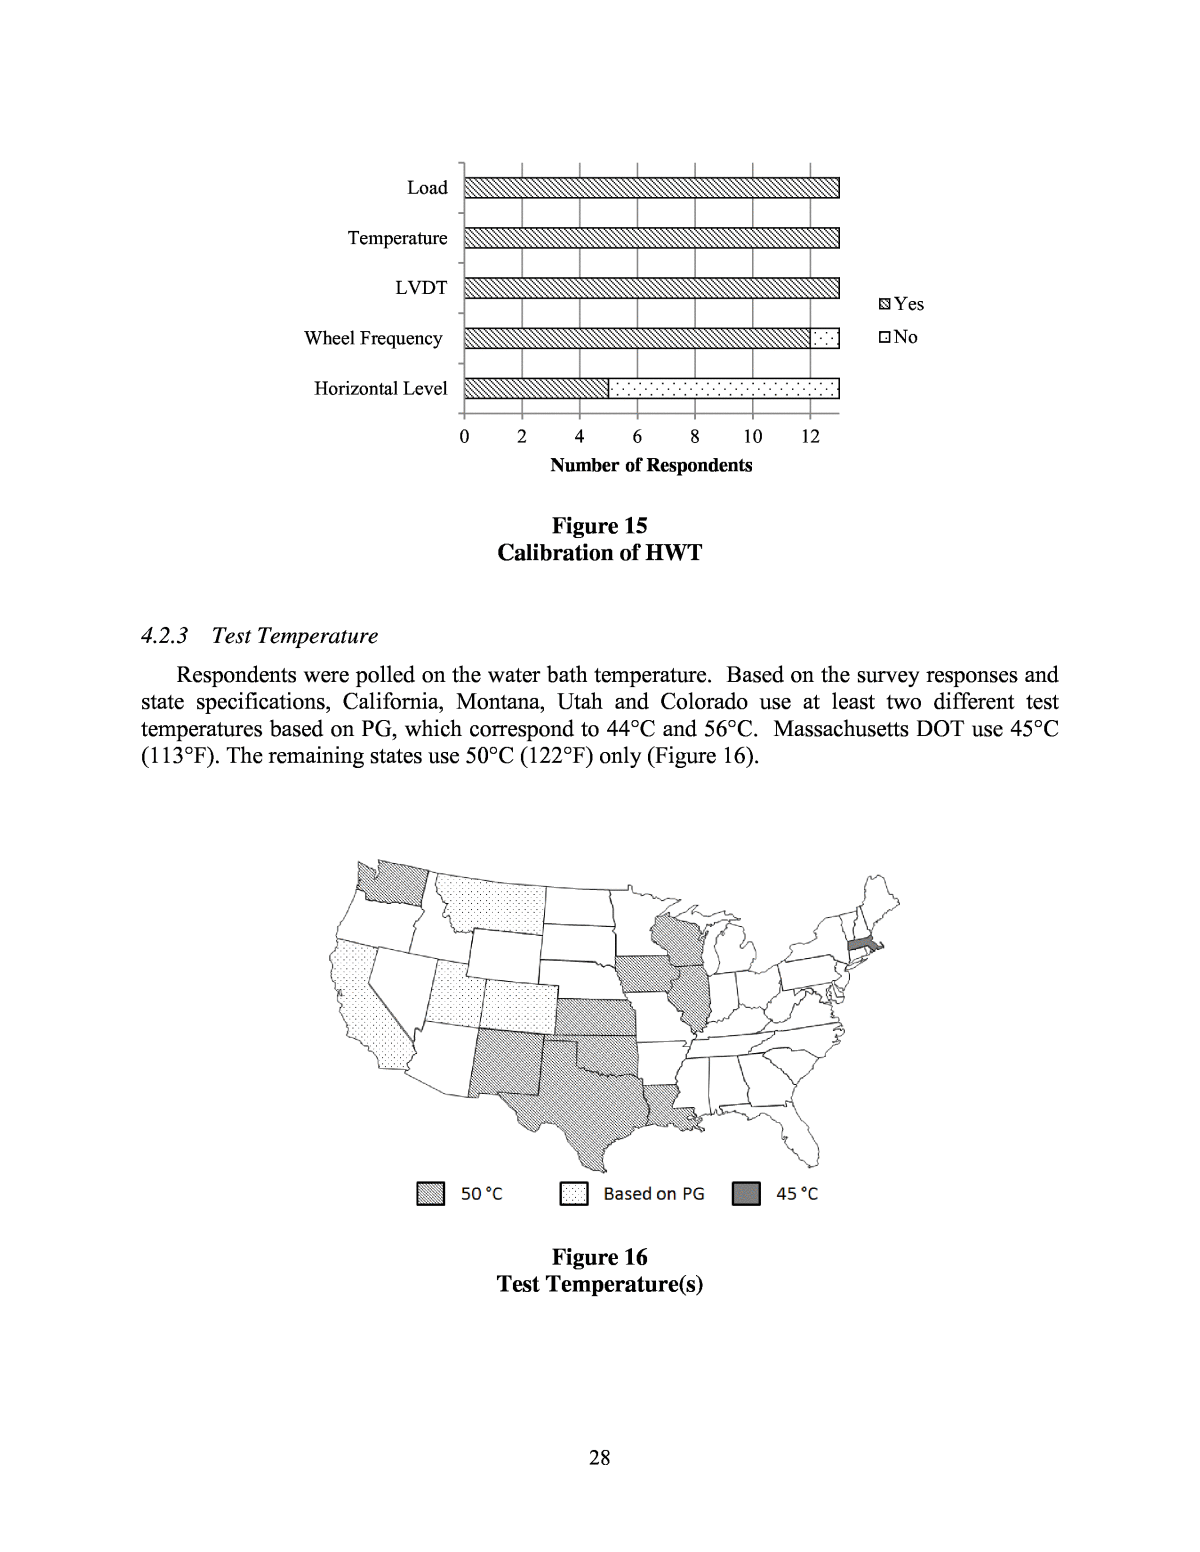
28 Figure 15 Calibration of HWT 4.2.3 Test Temperature Respondents were polled on the water bath temperature. Based on the survey responses and state specifications, California, Montana, Utah and Colorado use at least two different test temperatures based on PG, which correspond to 44°C and 56°C. Massachusetts DOT use 45°C (113°F). The remaining states use 50°C (122°F) only (Figure 16). Figure 16 Test Temperature(s) 0 2 4 6 8 10 12 Horizontal Level Wheel Frequency LVDT Temperature Load Number of Respondents Yes No
29 4.2.4 Mix Acceptance Criteria Mix acceptance criteria based on HWT varies among the states. The main results from the HWT are the maximum rut depth and the stripping inflection point (SIP). Based on the state specifications, only California, Wisconsin, and Iowa use both maximum rut depth and stripping inflection point as acceptance criteria (Figure 17). The remaining states use only the maximum rut depth as acceptance criterion. California specifies the minimum number of passes at SIP for different PG. Iowa and Wisconsin specify that the ratio of stripping slope to creep slope should be equal or larger than 2.0. Illinois states that âIt may be useful to run every test for 20,000 wheel passes to collect additional data on moisture sensitivityâ (11) and Oklahoma states that SIP may optionally be computed and reported for information. The maximum allowable rut depth varies among states. Colorado specifies that a maximum rut depth greater than 4 mm (1.57 in) before 10,000 passes be considered a failure. Illinois restricts the minimum number of wheel passes when maximum rut depth reaches 12.5 mm, which shall be selected based upon the PG Grades. Among state specifications, California, Colorado, Texas, Louisiana, Iowa, Montana, Wisconsin, and Illinois clearly list the requirement for the minimum number of passes at a specific rut depth or the max rut depth at a specific number of passes. Other state specifications just mention that the criteria shall be selected based upon PG grade or based on specifications but do not list a specific rut depth. The details of the state specifications are provided in Appendix A. Figure 17 Acceptance Criteria Used by the States States were also polled on the type of specimens. Montana, Utah, and Colorado allow using either slab or cylinder; other states use cylindrical specimens only given their convenience. Agencies were also queried whether they specify certain requirements for the test specimen fabrication. Among the 12 states, only Washington, California, and Louisiana do not specify requirements for specimen fabrication.
30 4.2.5 Reporting of Test Results The method adopted to calculate the maximum rut depth varies among state agencies. Since AASHTO T-324 requires reporting the maximum depression only, seven states report the maximum rut depth only (California, Colorado, Massachusetts, Utah, Washington, and Wisconsin). For the other states, the rut depth is calculated by taking the average of several readings. Texas and Oklahoma use the average of the three centered sensor readings. Illinois also uses the average of three sensor readings, which include the sensor at which the maximum rut depth is measured and the two sensor readings around it. Louisiana takes the average of the five center points. Montana reports the average of the seven center sensor readings. For Iowa, if the average rut depth at the final pass is larger than 12 mm, they use the average of the five sensor readings. On the other hand, if the average rut depth is smaller than 12mm, they use the average of 10 sensor readings. 4.3. Wheel Position Waveform, Frequency, and Maximum Speed Section 5.1 of AASHTO T 324 specifies the movement of the wheel over the specimen. The wheel is required to reciprocate over the specimen such that its position varies sinusoidally over time. The frequency of this movement is specified to be 52 ± 2 passes per minute. Additionally, the maximum speed is specified to be 0.305 m/s (1 ft./s) and is expected to be reached at the midpoint of the specimen. An extensive evaluation of the HWTs identified in the project proposal was undertaken to assess compliance with the specifications of section 5.1. Details of the experimental program were presented in section 3. 4.3.1 Test Results 4.3.1.1 Wheel Position Analysis Figure 18(a) presents a plot of the recorded ruler readings or the wheel position as a function of time for the machine from Vendor A. The fitted curve was plotted using the equation for a sinusoidal wave. The resulting plot shows differences between the expected and the measured position readings. This was expected as the HWT from Vendor A is designed to follow the equation for the slider-crank mechanism and not a sinusoidal wave. This procedure of recording and processing video data was repeated for the scotch-yoke mechanism incorporated by Vendor B and the results are presented in Figure 18(b). Results are compared to the sinusoidal wave. Table 6 presents the equations for the pure sinusoidal and non- sinusoidal waveforms. The difference between a pure-sinusoidal machine and a non-sinusoidal machine can be observed in Figure 18. In the case of a pure-sinusoidal machine, the wheel spends equal amounts of time on the front and back halves of the track. However, in the case of the non-sinusoidal machine, the wheel spends more time on the back half of the track (55%) as compared to the front half (45%). Figure 18(c) shows the results obtained for the HWT from Vendor C. The wave shape is characterized by a linear region in the middle (shown as region âAâ), followed by a slow-down, and finally by a small stationary duration (shown as region âBâ) at the track ends. It should be noted that the wheel travels at a constant rate of speed in the region shown by âAâ on the graph.
31 The waveform obtained for the machine from Vendor D is shown in Figure 18(d). This machine also uses the scotch-yoke mechanism and produces a pure-sine position waveform. Because of this configuration, the wheel in this machine spends equal amounts of time on the front and back halves of the track.
32 (a) Vendor A (b) Vendor B (after upgrade to 9-inch track length) (c) Vendor C (d) Vendor D Figure 18 Wheel position analysis
33 Table 6. Equations for the position of the wheel Vendor Mechanism Slider-crank (non-sinusoidal) Scotch-yoke (sinusoidal) A ð¥ð¥ = ðððððððð �2ðððð ðð � + �ðð2 â ðð2ððð ð ð ð 2(2ðððð ðð ) B, C, and D ð¥ð¥ = sin (ðð) where, x = horizontal position of the wheel (in), t = time (min), T = cycle time (=1/26 cycles per minute), l = length of the connecting rod (in), and r = radius of the crank circle. Since LTRC is in possession of two identical machines from Vendor A (referred to A-1, A- 2), the position analysis experiment was performed on both machines to examine the repeatability of results. Both machines are of the same model type with two-wheel configuration. Figure 19 presents the results obtained. It can be observed that the curves were very close to each other, indicating that the results were repeatable. Figure 19 Wheel position analysis on machines from Vendor A
34 In an effort to quantify the deviations from a pure-sinusoidal waveform, a goodness-of-fit measure, RMSE (root mean square error), was computed for all the waveforms. The equation used for computing RMSE is shown in Equation (1) and an example of the computed error is shown in Figure 20. The results of the computation are shown in Table 7. The pure-sinusoidal machines from Vendors B and D had the lowest RMSE, followed by the machine from Vendor C, while the non-sinusoidal machine from vendor A exhibited the highest RMSE values. ð ð ð ð ð ð ð ð = �âðððð2 ð ð (1) where, ei = deviation from a pure sinusoidal curve, and n = number of data points. Figure 20 Illustration of Root Mean Square Error computation The absolute mean deviation (AMD) was calculated according to the following equation: ð´ð´ð ð ð´ð´ = 1 ð ð �|ð¥ð¥ðððð â ð¥ð¥ð ð ðð|ðð ðð=1 (2) where, xmi = measured distance along track, and xmi = theoretical distance along track for a sinusoidal wave.
35 Table 7. AASHTO T 324, section 5.1 parameters Vendor A-1 Vendor A-2 Vendor A-3 Vendor B Vendor C Vendor D Waveform RMSE (mm) 13.21 14.48 13.21 1.02 3.05 1.02 Waveform AMD (mm) 11.43 14.48 13.20 0.88 3.05 1.01 Frequency (passes per minute) 51.8 52 52 51.2 52.1 52.2 Speed Midpoint (m/s) 0.33 0.33 0.30 0.27 0.31 0.31 Maximum (m/s) 0.33 0.33 0.30 0.27 0.31 0.31 Distance of maximum speed location from midpoint (mm) 17.02 8.89 14.22 0.00 0.00 0.51 4.3.1.2 Frequency The number of passes of the wheel over the specimen is specified to be 52 ± 2 passes per minute. The video of the wheel reciprocating over the specimen was recorded for one minute and the data were analyzed to compute the frequency of traversal as follows: ðð = 52 â 60 ðð (3) where, f = frequency (passes per minute); and t = time for completion of 52 passes (seconds). Table 7 presents the results obtained for the machines evaluated. It should be noted that all the machines performed within the current tolerance of 52 ± 2 passes per minute. 4.3.1.3 Maximum speed and location of maximum speed The speed of the wheel travel was obtained by computing a moving linear fit of the data. Figure 21 presents an example of speed computation at the midpoint of the traversal. In this case, the slope was computed using five data points around the midpoint of the track. Table 7 presents the results for all the machines evaluated. It can be observed that the maximum speed
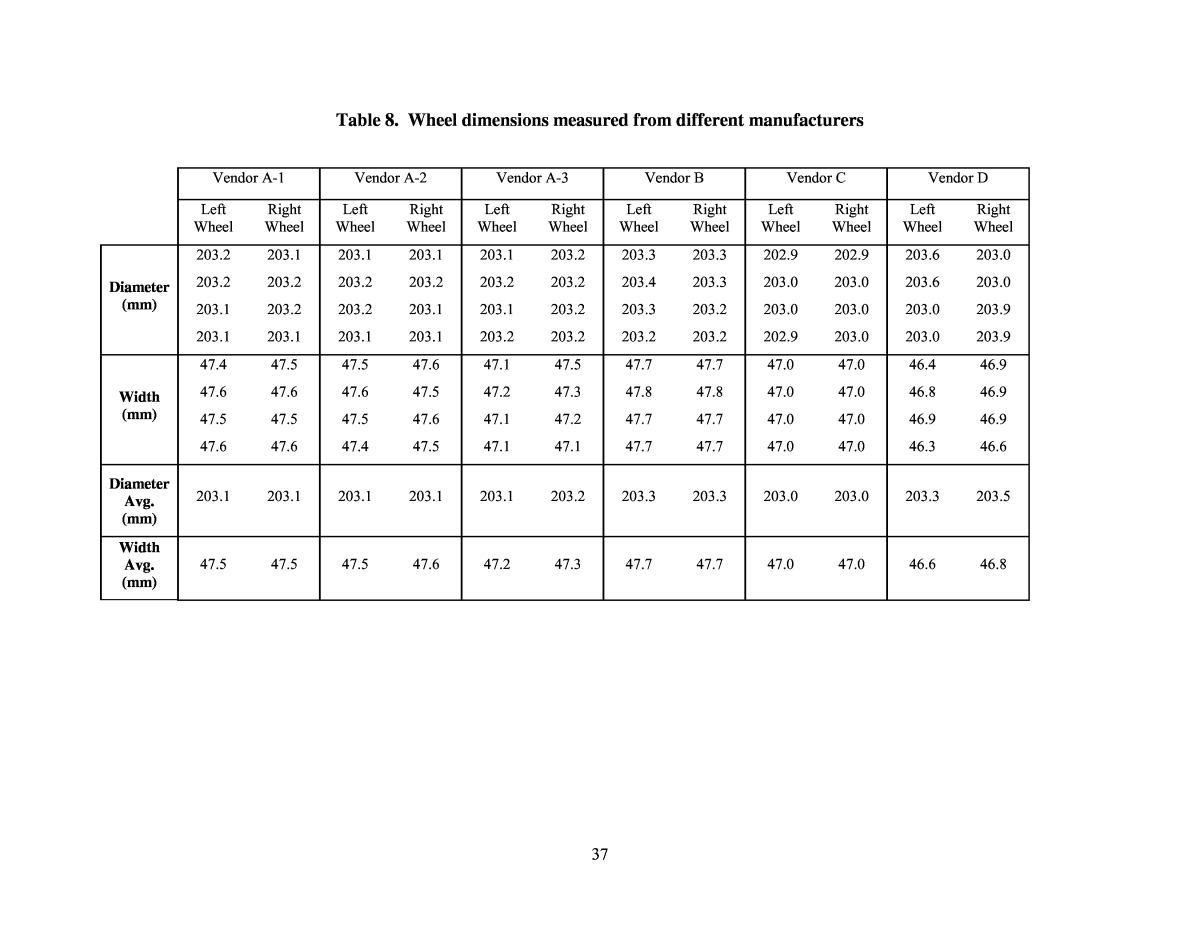
36 for the machines evaluated was 0.305 m/s (1 ft/s). The current specification in AASHTO T 324 states that the maximum speed be âapproximately 1 ft/sâ and that it be reached at the midpoint of the specimen. The locations of the maximum speeds were close to the midpoint of the specimen for the machines from Vendor B, Vendor C, and Vendor D while for the machine from Vendor A, it was obtained at a distance of 13.5 mm (0.53 in) on average from the midpoint of the track. These results are in conformance with the theoretical computations for the sinusoidal (maximum occurs at midpoint) and non-sinusoidal configurations. The theoretical location for the maximum velocity for the non-sinusoidal geometry used by Vendor A is 15.5 mm (0.61 in) from the midpoint of the track. This is due to the property of the slider-crank mechanism used by Vendor A, where the maximum velocity occurs when the coupling link is tangential to the crank circle. The numerical analysis involved solving for the derivative of the velocity equation and equating it to zero as presented in Appendix C. Figure 21 Speed computation at center of track 4.4. Experiment I â Wheel Dimensions Results of the measurements for vendors are shown in Table 8. It is noted that the research team had access to three machines of Vendor A (referred to A-1, A-2, and A-3), which the first two are standard model machines and the last one is the economy model machine. Therefore, the same testing protocol was applied to the three machines to assess whether consistent measurements are obtained for different equipment from the same vendor. As shown in this table, some of the wheelsâ diameters were slightly below the specified diameter (203.2 mm) in AASHTO T 324 because of normal wear. The width (47.0 mm) was also slightly greater than the specified width in AASHTO T 324 due to normal wear, as the wheel tends to bulge with time.
37 Table 8. Wheel dimensions measured from different manufacturers Vendor A-1 Vendor A-2 Vendor A-3 Vendor B Vendor C Vendor D Left Wheel Right Wheel Left Wheel Right Wheel Left Wheel Right Wheel Left Wheel Right Wheel Left Wheel Right Wheel Left Wheel Right Wheel Diameter (mm) 203.2 203.1 203.1 203.1 203.1 203.2 203.3 203.3 202.9 202.9 203.6 203.0 203.2 203.2 203.2 203.2 203.2 203.2 203.4 203.3 203.0 203.0 203.6 203.0 203.1 203.2 203.2 203.1 203.1 203.2 203.3 203.2 203.0 203.0 203.0 203.9 203.1 203.1 203.1 203.1 203.2 203.2 203.2 203.2 202.9 203.0 203.0 203.9 Width (mm) 47.4 47.5 47.5 47.6 47.1 47.5 47.7 47.7 47.0 47.0 46.4 46.9 47.6 47.6 47.6 47.5 47.2 47.3 47.8 47.8 47.0 47.0 46.8 46.9 47.5 47.5 47.5 47.6 47.1 47.2 47.7 47.7 47.0 47.0 46.9 46.9 47.6 47.6 47.4 47.5 47.1 47.1 47.7 47.7 47.0 47.0 46.3 46.6 Diameter Avg. (mm) 203.1 203.1 203.1 203.1 203.1 203.2 203.3 203.3 203.0 203.0 203.3 203.5 Width Avg. (mm) 47.5 47.5 47.5 47.6 47.2 47.3 47.7 47.7 47.0 47.0 46.6 46.8
38 It is noted that AASHTO T 324 does not currently set a tolerance for the wheel dimensions and only specifies the averages. This may need to be revised, as the user has currently no indication on how much the wheel dimensions can deviate from the specified values. Figure 22 and Figure 23 present the average measurements (diameter and width) as well as their deviations from the specified values in AASHTO T 324. Figure 22 Wheel diameters for the different manufacturers Figure 23 Wheel width for the different manufacturers 4.5. Experiment II â Wheel Loads The results of the measurement of load wheel are shown in the Figure 24. Both left and right wheel load were measured. As shown in Figure 24, except for the Vendor B right wheel, all the test wheel loads were within the 703 ± 4.5 N (158 ± 1 lbs.) as required by AASHTO T 324. It is 202.0 202.2 202.4 202.6 202.8 203.0 203.2 203.4 203.6 203.8 204.0 A-1 A-2 A-3 B C D Di am et er (m m ) Vendor ID Left Wheel Right Wheel 40.0 41.0 42.0 43.0 44.0 45.0 46.0 47.0 48.0 49.0 50.0 A-1 A-2 A-3 B C D W id th (m m ) Vendor ID Left Wheel Right Wheel
39 noted that all vendors use pound as the unit when calibrating the wheel loads. In this case, Vendor B right wheel load was 157 lbs., which is within the load requirement. Figure 24 Wheel loads for the different manufacturers 4.6. Experiment III â Free Circulating Water on Mounting System AASHTO T-324 specifies that the mounting system needs to provide at least 20 mm (0.8 in.) of free circulating water on all sides. The measurements of each vendorâs free water length are presented in Table 9. As shown in this table, a number of machines did not meet the requirements set forth by AASHTO T-324 and requires modifications. It is also noted that Machine A-3 was a different model than Machines A-1 and A-2. Table 9. Free circulating water depth Vendor A-1 Vendor A-2 Vendor A-3 Vendor B Vendor C Vendor D Top (mm) 38.1 22.3 34.9 17.5 27.3 20.6 Bottom(mm) 108.0 108.0 98.4 22.2 88.6 90.5 Left(mm) 44.5 47.6 6.4 73.0 71.2 71,4 Right(mm) 227.0 227.0 0.0 0.0 108.0 69.9 Front (mm) 257.2 266.7 217.2 98.4 70.62 196.9 Back(mm) 231.8 231.8 101.6 152.4 179.8 82.6 4.7. Experiment IV â Temperature Measurement and Control System The goals of this experiment were twofold: (1) to determine if the currently specified preconditioning duration was sufficient and (2) to determine the temperature uniformity in the bath. To accomplish this, instrumented hot-mix-asphalt cylindrical specimens were used, with embedded Resistance Temperature Detector (RTD) sensors. The locations of the sensors and the labelling convention are presented in Appendix D. Eight RTDs were used, two in each 650.0 660.0 670.0 680.0 690.0 700.0 710.0 720.0 A-1 A-2 A-3 B C D W he el L oa d (N ) Vendor ID left wheel right wheel703.0 ± 4.5 N
40 cylindrical specimen. Details of the specimen preparation and instrumentation are also presented in Appendix D. The temperature evaluations were initially conducted at 50°C (122 °F), the temperature used by the majority of users of this equipment. Later, at the request of the panel, 25°C (77 °F) and 70°C (158 °F) (the extremes in the current specification) were added to the evaluation. 4.7.1 Evaluation at 50°C Figure 25 and Figure 26 present the data collected from the embedded temperature sensors for the machines evaluated. Results are shown for two standard model and the economy model machine from Vendor A. Table 10 presents the details of the temperature experiment at 50°C. In this experiment, the data collection system was turned on prior to immersing the specimen in the water bath (time = 0). The conditioning period time started once the water in the temperature bath has attained the target test temperature, which is 50°C in this case (Time for the water bath to reach 50°C shown in Table 10). If the temperature of the incoming water is cooler than the setpoint, the machine heater(s) heat the water up to target temperature, during which time the specimens are also heating up, albeit with a slight delay. The temperatures at the end of 30 and 60 minutes of conditioning are shown in Figure 27 and Figure 28. The average temperature after 30 min of conditioning is presented in Table 10. As shown in Table 10, the average temperatures at the end of 30 minutes of conditioning were within the specification limit of 50 ± 1°C, even though some of the readings (one sensor for vendor A and four for vendor Dâs machine) were slightly below the 49°C limit. At the end of 60 minutes of conditioning, all sensors were within the tolerance limits. Table 10. Details of the temperature experiment at 50°C Vendor Start time of experiment (min) Time for the water bath to reach 50°C (min) Time at the end of the 30 min conditioning (min) Average temperature after 30 min of conditioning (°C) A-1 5 10 40 49.3 A-2 7 13 43 49.7 A-3 5 33 63 50.0 B 10 70 100 49.3 C 0 119 149 49.8 D 1 7 37 49.1
41 (a) Vendor A-1 (b) Vendor A-2 (c) Vendor A-3 Figure 25 Temperature versus time graphs at 50°C (machines from Vendor A)
42 (a) Vendor B (b) Vendor C (c) Vendor D Figure 26 Temperature versus time graphs at 50°C (Vendors B, C, and D)
43 (a) Vendor A-1 (b) Vendor A-2 (c) Vendor A-3 Figure 27 Temperatures after 30 and 60 minutes of conditioning, 50°C (Vendor A)
44 (a) Vendor B (b) Vendor C (c) Vendor D Figure 28 Temperatures after 30 and 60 minutes of conditioning, 50°C (Vendors B, C, and D)
45 4.7.2 Evaluation at 25°C Figure 29 presents the results of the temperature evaluation at 25°C. The data acquisition was turned on prior to filling the bath of the HWTs. The hot water inlets were turned off and only water from the cold-water faucets was allowed to fill the bath. In the case of machines from Vendors A and B, the incoming water temperature was 28.3°C. Even after several hours, the ambient air temperature of the laboratory/trailer was not sufficient to cool the water to 25 ± 1°C. For machines from Vendors C and D, the incoming water temperatures were 20 and 24°C, respectively. Therefore, obtaining 25°C in the bath is highly dependent on the incoming water temperature. The machines from Vendors A and B were located in Louisiana, where summertime cold-water temperatures frequently exceed 26°C. Figure 30 presents snapshots of the temperatures after a conditioning interval of 30 minutes. The machines from Vendors A and B were not able to attain the set target temperature of 25°C due to high incoming water temperature, while machines from Vendors C and D reached their target test temperature after 30 minutes. It should be noted that the HWTs from Vendors A, B, and C do not include a cooling system whereas Vendor D does include a cooling system. However, the cooling system was not functional at the time of the temperature experiment.
46 (a) Vendor A (b) Vendor B (c) Vendor C (d) Vendor D Figure 29 Temperature versus time graphs for various vendors (25°C)
47 (a) Vendor A (b) Vendor B (c) Vendor C (d) Vendor D Figure 30 Temperatures after 30 minutes of conditioning (25°C)
48 4.7.3 Evaluation at 70°C Figure 31presents the data gathered from the sensors in the HMA specimens after they were placed in HWT baths. The data collection system was switched on prior to immersing the specimens in the bath. In the case of machines from Vendors A and C, the time required for the bath to heat up to 70°C depended on the temperature of the incoming hot water. The incoming water temperatures were 52.4°C and 50.0°C for the machines from Vendors A and C, respectively. As the water is heated up to test temperature, the specimens also heat up, with a minor delay. The machine from Vendor B incorporates two tanks, a lower conditioning tank and an upper testing tank. The water is heated up to test temperature in the lower tank and is circulated into the upper tank at the beginning of the test. Figure 32 shows the specimen temperatures after 30 and 60 minutes of conditioning. At the end of 30 minutes, the average temperatures were 69.1°C, 68.4°C, 69.2°C, and 69.7°C for the machines from Vendors A, B, C, and D, respectively. Two of the sensors showed temperatures less than 69°C for Vendors A and D, while all the sensors for Vendor B were below the lower temperature limit of 69°C. It should be noted that all except one sensor were within the allowable tolerance of 70 ± 1°C at the end of 60 minutes of conditioning. In an effort to increase the water movement in the machine from Vendor D, a small water circulator was added in the water bath after the 60 minutes conditioning. The results, presented in Figure 33, show that all the readings were within the 70±1°C specification after the addition of the circulator.
49 (a) Vendor A (b) Vendor B (c) Vendor C (a) Vendor D Figure 31 Time versus temperature graphs at 70°C
50 (a) Vendor A (b) Vendor B (c) Vendor C (d) Vendor D Figure 32 Temperatures after 30 and 60 minutes of conditioning, 70°C
51 Figure 33 Temperatures at 30 and 60 minutes and after the addition of a water circulator (Vendor D) 4.8. Experiment V â Impression Measurement System An aluminum specimen with a curvature mimicking a rutted specimen was designed and fabricated to enable verification that the impression readings were being recorded at the locations specified by the vendors. Two metal specimens were fabricated during the course of this study. The first one was used only in the first quarter of the study. The second metal specimen had a longer curved track length to avoid the problem of the wheel âclimbing outâ of the track. All results presented herein were obtained with the second specimen. The machine drawing of this metal specimen and the analytical solution of the wheel and metal-specimen interaction are presented in Appendix C. Figure 34 presents a picture of this curved specimen. Since the curvature or ârutâ of this specimen is machined per the drawing in the appendix, the depression at any location along the track is precisely known. The maximum depression of the manufactured specimen is 19.05 mm (0.75 in.) and is located at the midpoint of the track. The aluminum specimen allows for verification of LVDT readings and confirms if the readings are being recorded at the locations specified by the vendors.
52 Figure 34 Metal specimen for verifying locations of deformation readings 4.8.1 Test Results The fabricated metal specimen was used to obtain rut measurements from the HWT machines. The data obtained from the HWT machines were compared to the reference rut profile of the metal specimen. Figure 35 presents the results of the experiment for HWT machines from Vendor A. As can be seen, there are significant deviations from the reference profile, with a marked skew to the right. These results suggest that the deformation readings from the LVDT are not being recorded at the pre-determined locations along the track. The locations of these readings as specified by the manufacturer are -114, -91, -69, -46, -23, 0, +23, +46, +69, +91, and +114 mm with 0 being the midpoint of the track (a total of 11 readings, 22.9 mm (0.9-in.) spacing between readings).
53 Figure 35 Impression measurement system results from HWT machine (Vendor A) Figure 36 presents the results for the HWT machine from Vendor B. The vendor-specified locations of the readings are -97, -32, 0, +32, and +99 mm, with zero being the midpoint of the track. The results show a reasonably good agreement with the expected rut depths. Figure 36 Impression measurement system results from HWT machine (Vendor B)
54 Figure 37 shows the results of the evaluation for the machine from vendor C. This machine records data at 23 equally-spaced locations across the track (-110, -100, -90, -80, -70, -60, -50, - 40, -30, -20, -10, 0, +10, +20, +30, +40, +50, +60, +70, +80, +90, +100, and +110 mm). The data shows good agreement with the metal-profile in the region from -80 to +80 mm. Outside of this region; the readings seem to deviate slightly from the expected rut-depths. Figure 37 Impression measurement system results from HWT machine (Vendor C) Figure 38 shows the results of the evaluation for the machine from vendor D. For this machine, the readings were spaced 1 mm apart and were taken from -113 to +113 mm along the track, resulting in 227 readings. The readings are very close to the expected metal-profile, with a slight deviation towards the right end of the graph. It is possible that the metal specimen was not completely level with respect to the deformation measuring system.
55 Figure 38 Impression measurement system results of HWT machine (Vendor D) In an effort to quantify the deviations of the readings from the metal profile, the root mean square error (RMSE) was computed for measurements from each machine. Table 11 shows the RMSE values for each of the four vendors. In line with the visual observations, the RMSE values for Vendors B, C, and D, were lower compared to that for Vendor A, with the lowest value obtained for Vendor Dâs machine.
56 Table 11. RMSE values for impression measurements of metal profile Vendor RMSE (in.) AMD (in.) A-1 0.10 0.08 A-2 0.14 0.12 A-3 0.08 0.06 B 0.02 0.01 C 0.02 0.01 D 0.01 0.00 4.9. Data Collection and Reporting AASHTO T 324 requires the following five parameters to be collected and reported to quantify the performance of a mix to rutting and moisture susceptibility (stripping): 1. Number of Passes at Maximum Impression: At a fixed maximum impression value (e.g., 12.5mm), an asphalt mixture with a larger number of passes is more resistant to rutting (13). 2. Maximum Impression: The maximum impression obtained at the completion of the test is reported to quantify the rutting resistance. 3. Creep Slope: The creep slope is the inverse of the deformation rate in the creep phase. The creep phase starts after the consolidation phase and ends before the stripping starts. In this phase, the rut depth starts to increase steadily due to viscous flow. A mixture with a larger creep slope value is more sensitive to rutting (14). 4. Strip Slope: The strip slope is the inverse of the deformation rate at where the rut depth increases tremendously as moisture damage occurs. A mixture with a larger strip slope value is more sensitive to moisture damage. Furthermore, the ratio of the creep slope to the strip slope has been used to quantify moisture sensitivity in some states (15, 16). 5. Stripping Inflection Point (SIP): The stripping inflection point is usually reported in wheel passes. This point occurs where the curve has a sudden increase in rut depth and reflects the phase where the asphalt binder starts to strip from the aggregate. Graphically, the SIP is the intersection of the creep slope and the strip slope (17, 18). Upon review of the current requirements detailed in AASHTO T 324, one may note that not enough specifics are provided to allow for consistent analysis and reporting of the five aforementioned performance indicators. For example, AASHTO T 324 does not define how to find the âsteady-state portionâ to plot the creep slope. At least seven computer programs, developed by four manufacturers and two state DOTs, were identified for analyzing HWT test data and reporting the necessary parameters. The methods are briefly discussed below:
57 ⢠In vendor Aâs software, the user specifies the locations of the creep and strip regions. In this approach, the user chooses the âstartâ and âendâ pass numbers for the creep and strip regions and the software draws straight lines using these points to obtain the creep and strip lines. ⢠For vendor B, the user specifies a âcriterion of changeâ defined as a given amount of change over a certain number of passes, e.g., 1 mm over 1,000 passes. The program then computes the stripping inflection point and subsequently draws the creep and strip lines. ⢠Vendor Câs program truncates the data to 15 mm rut depth and fits a fourth-degree polynomial through the rut data. The location of the minimum of the first derivative of the curve-fit is then determined. A tangential line is drawn at this location to obtain the creep slope. The maximum value of the first derivative between this point and the end of the data is used to obtain the strip slope. ⢠Vendor Dâs analysis program involves finding the minimum error from a fitting line. At the request of Vendor D, details of the approach are not to be presented. However, the results obtained from this approach will be presented in the next section. In addition to the HWT manufacturers, several state DOTs and research institute are developing their own analysis programs to process the data. Iowa DOT has developed a method to determine the SIP, the details of which are published in Iowa DOT specification âMoisture Sensitivity Testing of Asphalt Mixtureâ (2). Oklahoma DOT uses a modification of the Iowa DOT test method (7). Texas DOT has adopted a new method based on research published by Yin et al. (19) and uses a program developed by Thunderhead Testing, LLC that implements this approach. These methods are briefly described below: ⢠Iowa DOTâs program uses a 6-degree polynomial to fit the rut data. The minimum of the first derivative of this fitted curve nearest the end of the test is obtained. The tangent line at that point is the strip slope. The creep slope is located by equating the second derivative to zero where prior to the strip pass point. It should be noted that the program calculates the strip slope prior to the creep slope (2). ⢠The procedure used by Oklahoma DOT is similar to Iowaâs method. However, a sixth- degree polynomial is used to fit the data. Next, the rut depth at a 1000 passes is determined. The program then adds 1 mm to this rut depth and finds the number of passes where this second rut depth occurs. A line drawn through these two points is defined to be the creep line. To find the strip line, the program determines the minimum value of the first derivative between 1,000 passes and the end of data. The tangent at this point is defined to be the strip line (7). ⢠Texas DOT defines three new parameters in its analysis approach: LCSN, LCST, and âÆ10,000ð£ð£ð£ð£ . The number of passes at which the second derivative is equal to zero is defined to be LCSN. Then, the rut depth is separated after LCSN to two parts: accumulation of viscoplastic strain from reciprocate load cycles and from stripping. Viscoplastic strain from loading can be predicted using Tseng-Lytton model. As a result, the deformation from stripping is the total rut depth (natural log fitted curve) minus the deformation under loading (Tseng-Lytton model). In this approach, the number of passes needed to reach the predicted stripping strain after LCSN is defined as LCST. In Texas DOT, the predicted stripping strain is 12.5mm. The third parameter is determined by taking the derivative of the projected viscoplastic strain using the Tseng-Lytton model at 10,000 cycles (19). Since the TTI method of analyzing moisture sensitivity is not consistent with the performance parameters defined in AASHTO T 324, the results of this approach are not discussed in this report.
58 4.9.1 Test Materials Two mixes, which were tested using the HWT manufactured by Vendor A, were selected for analysis by the various methods. While Vendor A recorded rut data at 11 points across the wheel track, the rut data corresponding to the center reading, or Point Number 6, was used in the analysis and is presented in Figure 39. As shown in Figure 39, two contrasting mixes were selected; a poor performing mix that stripped during testing and a good performing mix that did not strip during testing. Figure 39 Rut Depth versus Number of Passes for the Selected Mixes 4.9.2 Results and Analysis Section 9 of AASHTO T 324 requires the following parameters to be reported: the maximum impression, the number of passes at the maximum impression, creep slope, strip slope, and the stripping inflexion point. However, the specification leaves the details of the determination of these parameters up to the vendor/user. The absence of clear definitions for these parameters could lead to widely varying results being reported. The following summarizes the results obtained by processing the selected data sets using the various analysis methods. The analysis techniques used to obtain SIP location from the HWT data were obtained by requesting details from each of the four vendors. This involved several email communications with each of the vendors to get a better understanding of the algorithms used. In each of these cases, the analysis procedures were independently verified by performing the individual steps of the procedure. The analysis results for Mix 1 are presented in Figure 40. -25 -20 -15 -10 -5 0 0 5000 10000 15000 20000 Ru t d ep th (m m ) Number of Passes Mix 1 with Stripping Phase -25 -20 -15 -10 -5 0 0 5000 10000 15000 20000 Ru t d ep th (m m ) Number of Passes Mix 2 without Stripping Phase
59 Figure 40 Data Analysis for Mix 1 Based on Different Approaches -25 -20 -15 -10 -5 0 0 5000 10000 15000 20000 ru t d ep th (m m ) number of passes Vendor A data creep slope strip slope -25 -20 -15 -10 -5 0 0 5000 10000 15000 20000 ru t d ep th (m m ) number of passes Vendor C data creep slope strip slope -25 -20 -15 -10 -5 0 0 5000 10000 15000 20000 ru t d ep th (m m ) number of passes Vendor D data creep slope strip slope -25 -20 -15 -10 -5 0 0 5000 10000 15000 20000 ru t d ep th (m m ) number of passes Iowa DOT data creep slope strip slope -25 -20 -15 -10 -5 0 0 5000 10000 15000 20000 ru t d ep th (m m ) number of passes Oklahoma DOT data creep slope strip slope
60 As shown in Figure 40, for Vendor A, the creep region ranged from 2,000 to 6,000 passes and the strip region from 11,500 to 12,800 passes. Since these regions are not automatically determined by the program, the results reported could vary by the user. Vendor Câs program truncates the data to 15 mm rut depth so the curve is shorter than the rest. Vendor Dâs program also truncates 50% of data set after the SIP based on the user input. As a result, the SIP location for Vendor D had lower number of passes than the other methods. Iowa DOT and Oklahoma DOT methods are very similar and the methods for obtaining the strip slope are the same. Results for the non-stripping mix (Mix 2) are presented in Figure 41. Vendor A requires the user to identify the creep and strip region. Because the no-stripping data set has no strip region, the analyze results is not classified here. Vendor Câs program locates the SIP at the end of the data set. It should be noted that Vendor D clearly identifies the data set with no stripping, as shown in the graph. In addition, if the ratio of the creep to strip slopes is less than two, the Iowa DOT program concludes that no stripping occurred, as is shown in Figure 41. ODOT method identifies the SIP at the beginning of the data set. It should be noted that the Vendor C and ODOT procedures reported a SIP even though stripping did not occur. -25 -20 -15 -10 -5 0 0 5000 10000 15000 20000 ru t d ep th (m m ) number of passes Vendor A data
61 Figure 41 Data Analysis for Mix 2 Based on Different Approaches Table 12 and Table 13 summarize the stripping and no-stripping data sets results from the different analysis methods. For Mix 1, substantial differences were observed in the reported SIP. Furthermore, a number of methods could not identify a non-stripping mix such as Mix 2. In addition to these discrepancies, the approach adopted by Iowa DOT can only analyze HWT results obtained from the machine manufactured by Vendor A. It is also noted that all programs provide the rut depth at a 5,000 passes interval. However, two approaches, which are Vendor B and Oklahoma DOT, did not report the maximum impression and the number of passes at the maximum impression as required by AASHTO T-324. Furthermore, Iowa program only reports the rut depth as an average of all 11 data points. For the non-stripping mix, because the maximum number of passes was 20,000 passes and all seven programs were able to report the rut depth at every 5,000 passes, number of passes at maximum impression was the same for all -25 -20 -15 -10 -5 0 0 5000 10000 15000 20000 ru t d ep th (m m ) number of passes Vendor C data creep slope strip slope -25 -20 -15 -10 -5 0 0 5000 10000 15000 20000 ru t d ep th (m m ) number of passes Vendor D data No Stripping Phase -25 -20 -15 -10 -5 0 0 5000 10000 15000 20000 ru t d ep th (m m ) number of passes Iowa DOT data creep slope strip slope No Stripping Phase -25 -20 -15 -10 -5 0 0 5000 10000 15000 20000 ru t d ep th (m m ) number of passes Oklahoma DOT data creep slope strip slope
62 seven approaches. AASHTO T 324 also requires reporting the creep slope and the strip slope. The program provided by Vendors A and B do not report the creep and strip slopes. As shown in Table 13, only the program provided by Vendor D and the approach adopted by Iowa DOT successfully identified this mix as a non-stripping mix. Table 12. Summary of Programs Reporting Parameters (Mix 1) Number Of Passes at max impression Max Impression (mm) Creep Slope (*10-4) Strip Slope (*10-4) SIP Vendor A 12,800 25 N/A N/A 10,712 Vendor B N/A N/A N/A N/A 473 Vendor C 12,800 25 64 34 9,471 Vendor D 12,850 26 8 25 9,104 Iowa DOT 12,806 25 4 53 10,552 Oklahoma DOT N/A N/A 6 107 11,295 Table 13. Summary of Programs Reporting Parameters (Mix 2) Number Of Passes at max impression Max Impression (mm) Creep Slope (*10-4) Strip Slope (*10-4) SIP Vendor A 20,000 2.1 N/A N/A N/A Vendor B 20,000 2.1 N/A N/A -3,211 Vendor C 20,000 2.1 0.07 0.07 19,892 Vendor D 20,000 2.1 No stripping No stripping No stripping Iowa DOT 20,000 1.9 0.3 0.4 No stripping Oklahoma DOT 20,000 2.1 1 3 180 Table 14 compares the seven approaches in terms of the reporting parameters that are required by AASHTO T 324. As shown in Table 14, Vendor C, Vendor D, and Iowa DOT report all five indices, as required by AASHTO T 324. However, Vendor B and Oklahoma DOT do not report the maximum impression and final passes values. Vendor A and B do not provide the creep and strip slopes.
63 Table 14. Summary of Seven Programs Reporting Parameters Number Of Passes Max Impression (mm) Creep Slope Strip Slope SIP Vendor A Y Y N N Y Vendor B N N N N Y Vendor C Y Y Y Y Y Vendor D Y Y Y Y Y Iowa DOT Y Y Y Y Y Oklahoma DOT N N Y Y Y Y: The program provides this parameter N: the program does not provides this parameter 4.10. Proposed Modifications to AASHTO T324 Specifications Based on the results of the experimental program, revisions to AASHTO T 324 are proposed to incorporate the equipment capabilities, components, or design features that ensure proper testing and accurate, reproducible results. The key elements of AASHTO T 324 specifications to conduct the Hamburg Wheel Track (HWT) test were identified to be the loading mechanism, temperature measurement and control system, impression measurement system, test specimen size, and data collection and reporting sections. The following issues need to be addressed in the current specification: ⢠Section 5.1: It is proposed to define a tolerance for the wheel dimensions. Based on the results of the experimental program and assuming an acceptable deviation of 1% around the mean value, it is recommended to specify a 203.2 ± 2 mm diameter, 47.0 ± 0.5 mm wide steel wheel. It is noted that wheel dimensions tend to change with wear and deviation from the recommended specifications will necessitate the replacement of the loading wheel. ⢠Section 5.1: AASHTO T 324 specifies that the wheel be required to reciprocate over the specimen such that its position varies sinusoidally over time. Since not all the machines available in the market are able to produce a perfectly sinusoidal wave, a maximum level of deviation from a perfectly sinusoidal wave should be specified in AASHTO T 324. Based on the results of the experimental program, the greatest root-mean square error (RMSE) should be set at 2.54 mm. ⢠Section 5.1: AASHTO T 324 does not set a tolerance for the maximum speed of the wheel. It is recommended to add a tolerance of ± 0.02 m/s. ⢠Section 5.2: AASHTO T 324 specifies the use of a water bath capable of controlling the temperature within ±1.0°C over a range of 25 to 70°C (34°F over a range of 77°F to 158°F). Results of the temperature experiment revealed major shortcomings in this part of the specification:
64 ï§ Since three of the four machines available on the market do not have a cooling system, it is virtually impossible to set the target temperature to 25°C, especially during summer time. It is recommended to modify the low range to 35°C (95°F). ï§ The upper range of 70°C is too high and is not encountered in any region of the US. Test temperature is usually selected based on the 50% reliability 7-day average maximum high pavement temperatures computed using the LTPPBind software (20). In NCHRP Project 9-29, the highest pavement temperature was calculated based on LTPPBind to be 58°C for Phoenix, AZ (21). Furthermore and based on the results of the survey, the highest test temperature used by the states was 56°C. Therefore, the recommended upper range should be changed to 64°C. ï§ The 30-min preconditioning time specified in Section 8.9.2 is not sufficient to ensure that all areas of the test specimen have reached the specified temperature within ±1.0°C. It is recommended to increase the preconditioning time to 45 min. ⢠Section 5.3: AASHTO T 324 does not currently specify the locations of the deformation readings or the number of deformation readings. Current specification has resulted in major discrepancies among manufacturers, as some machines record deformations at only five locations while others record deformations at 227 locations. Results also suggest that the deformation readings are sometimes not being recorded at the pre-determined locations along the track. To this end, two major modifications are recommended: ï§ Specify that deformation readings should be recorded at 11 locations along the length of the track. These locations should be set at -114, -91, -69, -46, -23, 0, +23, +46, +69, +91, + 114 mm with zero being the midpoint of the track. The midpoint of the track should be marked by the different manufacturers to assist the user. While a manufacturer may elect to record deformations at more than 11 locations, these locations should be kept consistent to allow for comparisons between the measured rut depths among different LWT machines. ï§ Specify that the locations of the deformation readings should be verified experimentally using the aluminum apparatus developed in this study and presented in Figure 33. The maximum total RMSE at the 11 pre-set locations should be set at 1.27 mm. ⢠Section 9.2: A coherent method of reporting the measured rut depth is needed and is currently not provided in AASHTO T 324. The availability of a consistent method of reporting the rut depth would allow for comparisons between the measured rut depths among different vendors. To this end, it is recommended that the average rut depth be calculated based on the five middle deformation sensors (i.e., sensors located at -46, -23, 0, + 23, and + 46 mm). This recommendation is similar to the work reported by Schram, Williams, and Buss (22). This study suggested reporting the average measurements of locations 5 through 9 when the average rut depth at the final pass is greater than 12 mm. Results were based on statistical analysis over 135 test runs on cylinder specimens. ⢠Section 9.3: The recommended method to calculate the stripping inflection point (SIP) and other reporting parameters is not clearly defined in the current specification. Furthermore, it may result in discrepancies in calculating this parameter. It is recommended that an approach similar to the one adopted by Iowa DOT be implemented in the revised AASHTO T 324 specifications.
65 4.11. Laboratory Experimental Plan for Validation of Proposed Changes A laboratory experimental plan was developed to validate the proposed equipment modifications and specifications proposed in this study. The objective of the proposed laboratory plan is to evaluate proposed modifications to the Hamburg test equipment as well as the modified AASHTO T 324 developed in this study. The research team envisions that results obtained from all Hamburg test equipment should be comparable. Currently, there is no guarantee that this is the case as the methods of measurement and calculation are different. After addressing the proposed modifications to the equipment configurations and to the specifications, a laboratory experimental program shall be conducted to compare statistically the results obtained with different Hamburg test equipment from various manufacturers when testing the same asphalt mixture. The experimental program should test contrasting asphalt mixtures using the four main types of Hamburg test equipment available in the US market. Furthermore, the selected mixes shall include good and poor performers against rutting. To this end, the following factors should be considered in the proposed laboratory plan: ⢠Mixture Characteristics: ï§ Four contrasting dense-graded asphalt mixture types (small and large NMAS, low and high binder contents, two binder types [e.g., PG 58-22 and PG 76-22]) ⢠Specimen Types and Sizes: ï§ Plant-mixed laboratory-compacted (PL) and plant-mixed field-compacted (PF) specimens; ï§ Two specimen configurations (core and slab specimens). ⢠Test Conditions: ï§ Three test temperatures (35, 50, and 64°C) ⢠Test Protocols: ï§ Original and modified AASHTO T 324 specifications ⢠Equipment Manufacturer: ï§ Four brands of Hamburg test equipment that conform to the revised specification Considering that a minimum number of three replicates would be required for each test condition, it is clear that a complete factorial design for the proposed test matrix will not be achievable given possible time and financial restrictions. Therefore, a fractional factorial statistically based design should be developed in order to consider the most important combinations, which will allow the proposed experimental plan to characterize the accuracy, repeatability, and proposed test configurations. To minimize variability due to mix preparation, a single technician shall be fabricating all specimens in the experimental program. Upon finalization of the specifications for the Hamburg test equipment, the research team envisions that a protocol that complies with ASTM E1169, Standard Guide for Conducting Ruggedness Tests, will be used for systematic evaluation of the Hamburg test equipment available from different manufacturers. The results of the five performance parameters obtained with different HWT equipment would be compared statistically to assess whether observed differences are statistically significant.
