


Below is the uncorrected machine-read text of this chapter, intended to provide our own search engines and external engines with highly rich, chapter-representative searchable text of each book. Because it is UNCORRECTED material, please consider the following text as a useful but insufficient proxy for the authoritative book pages.
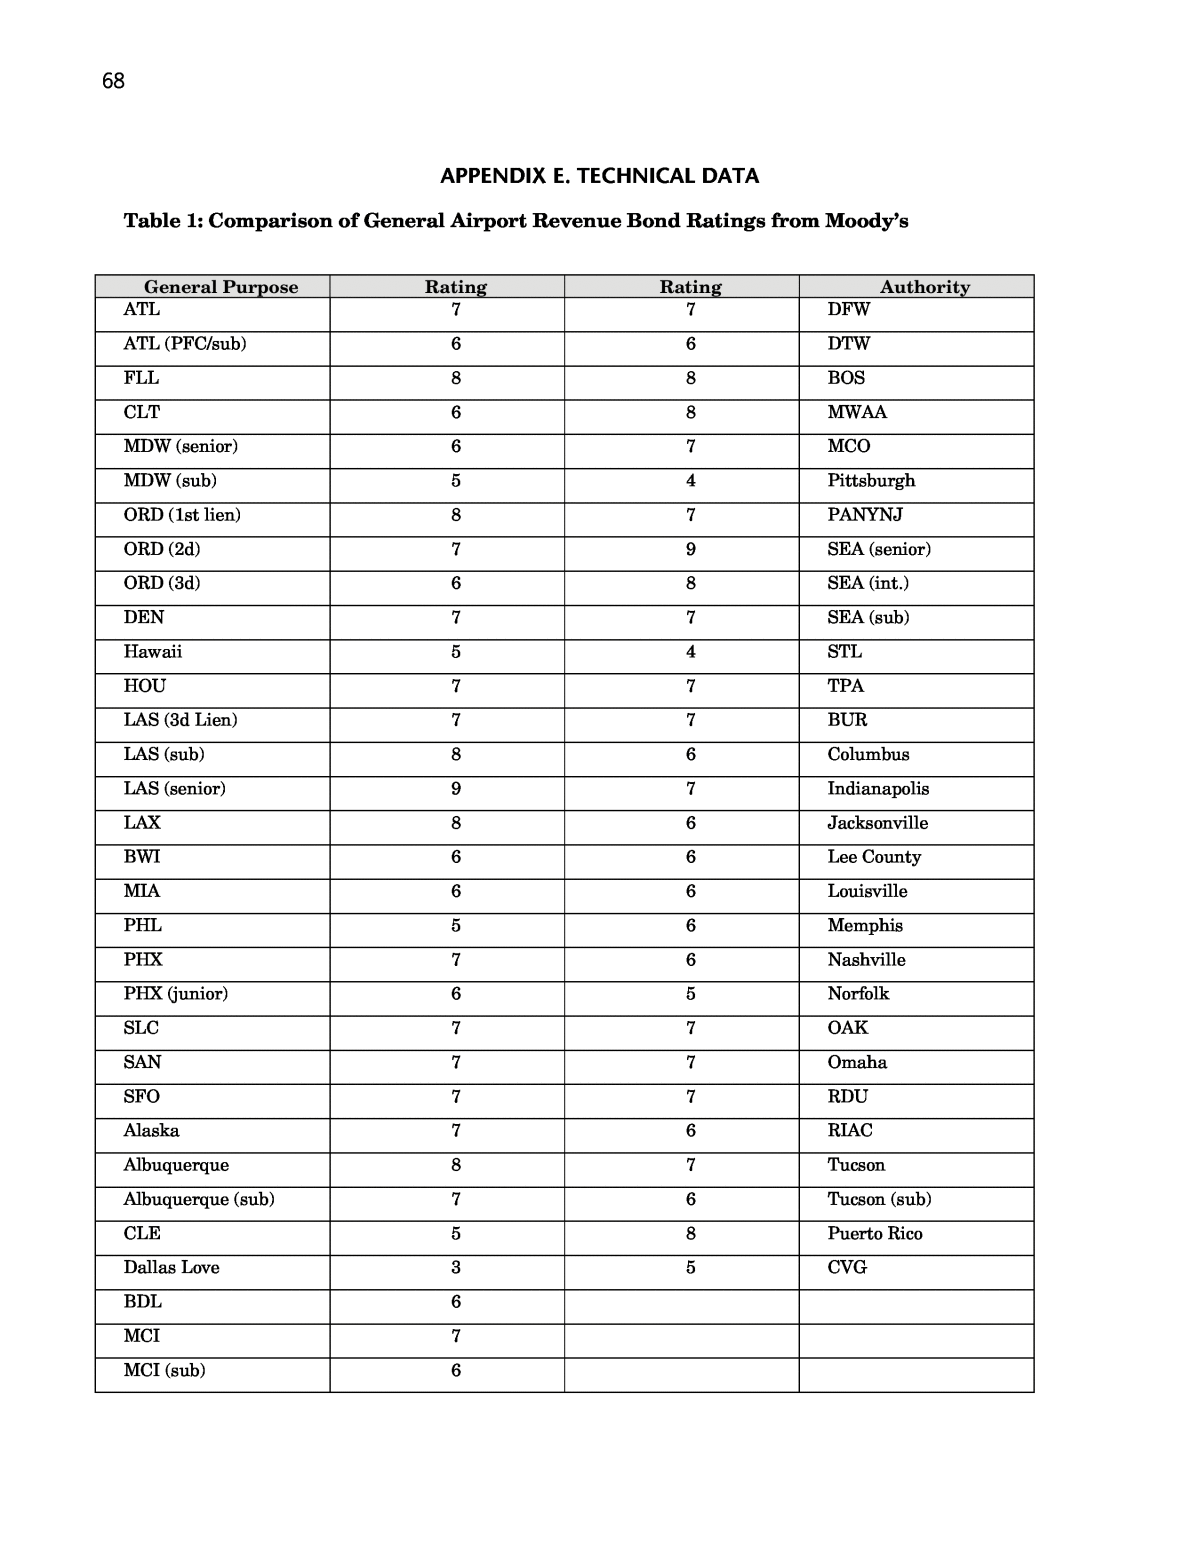
68 APPENDIX E. TECHNICAL DATA Table 1: Comparison of General Airport Revenue Bond Ratings from Moodyâs General Purpose Rating Rating Authority ATL 7 7 DFW ATL (PFC/sub) 6 6 DTW FLL 8 8 BOS CLT 6 8 MWAA MDW (senior) 6 7 MCO MDW (sub) 5 4 Pittsburgh ORD (1st lien) 8 7 PANYNJ ORD (2d) 7 9 SEA (senior) ORD (3d) 6 8 SEA (int.) DEN 7 7 SEA (sub) Hawaii 5 4 STL HOU 7 7 TPA LAS (3d Lien) 7 7 BUR LAS (sub) 8 6 Columbus LAS (senior) 9 7 Indianapolis LAX 8 6 Jacksonville BWI 6 6 Lee County MIA 6 6 Louisville PHL 5 6 Memphis PHX 7 6 Nashville PHX (junior) 6 5 Norfolk SLC 7 7 OAK SAN 7 7 Omaha SFO 7 7 RDU Alaska 7 6 RIAC Albuquerque 8 7 Tucson Albuquerque (sub) 7 6 Tucson (sub) CLE 5 8 Puerto Rico Dallas Love 3 5 CVG BDL 6 MCI 7 MCI (sub) 6
69 General Purpose Rating Rating Authority Manchester 6 Milwaukee 7 ONT 6 Orange County 8 Palm Beach 3 Sacramento 7 San Antonio 7 San Jose 7 Portland, ME 3 AVERAGE 6.43902439 6.55172414 Source: Jacobs Consulting, Credit Update Bond Ratings (Aug. 2007). Note Baa 3 rating is scored as 2, while Aal is scored as 10.
70 Table 2: Comparison of 2008 JD Power Scores for Large and Medium AirportsâSum of Seven JD Power Categories General Purpose Authority CLT 25 21 DTW ORD 21 20 DFW DEN 17 26 JFK IAH 29 14 MSP ATL 24 24 EWR LAX 22 31 MCO LAS 31 14 SEA MIA 27 20 BOS PHL 30 28 LGA PHX 28 21 STL SFO 15 26 MEM BWI 27 14 OAK MDW 32 17 PDX CLE 20 26 DCA FLL 22 26 SAN HNL 21 28 TPA MCI 29 26 IAD SMF 24 27 CVG SLC 22 SJC 16 AVERAGE 24.1 22.7222222
