
5
Sustainable Food Systems
Gerald Nelson, professor emeritus, University of Illinois at Urbana-Champaign, addressed indicators and metrics associated with the transition to sustainable food systems. Dr. Nelson opened his discussion by highlighting progress made globally in reducing hunger and sustaining the demand for food as population has continued to increase. The 2005 Millennium Ecosystem Assessment (MEA) is representative of the advances made in understanding food security. 1 The MEA projected that global agricultural demand will double by 2050, largely driven by population and income growth. Agriculture may be able to meet such demands given the increases in yields for most crops; nevertheless, a number of challenges remain that would affect the projected demand in 2050, including impacts of climate change on crop yields, increased obesity worldwide (i.e., sustainable food systems could address both malnutrition and over nutrition), overuse of antibiotics in agriculture, and expanding “big data” to influence sustainable agricultural management.
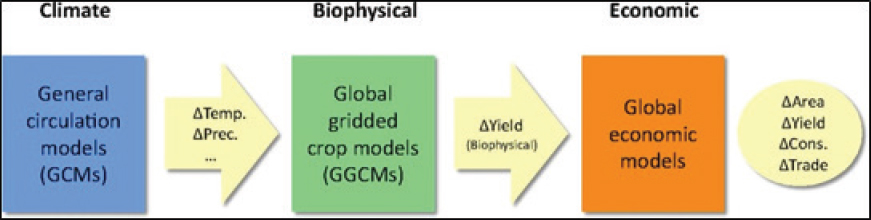
Elaborating on the major challenges that would affect projected demand for food in 2050, Dr. Nelson discussed climate change risks to food supply. A number of researchers are working on comprehensive analyses of how food systems may be affected by climate change with advances in models that link biophysical and social systems, along with coordinated efforts to compare agricultural models, such as AgMIP (Figure 5-1).2 In one study, Dr. Nelson and colleagues examined the effects of climate change on global crop yields by 2050 using nine global economic models linked to both crop yield models and global climate models.3 On average, crop yields decreased by 17 percent and crop prices increased by 20 percent. There is uncertainty in these models, he said, due to large variability in regions and crops (Figure 5-2). Higher prices lead to adaptive behaviors, such as changes in farm management that increased the area under cultivation by 11 percent, reduced consumption by 3 percent, and moderated effects of the drop in yield such that global supply was only reduced by 11 percent on average.
___________________
1 Millennium Ecosystem Assessment (MEA). 2005. Ecosystems and Human Well-being: Synthesis. Washington, DC: Island Press. The Millennium Ecosystem Assessment was initiated by then-UN Secretary Kofi Annan in 2000. From 2001 to 2005, the MEA assessed the consequences of ecosystem change for human well-being, and provided a scientific appraisal of the condition and trends in the world’s ecosystems and the services they provide, as well as the scientific basis for action to conserve and use them sustainably.
2 The Agricultural Model Intercomparison and Improvement Project (AgMIP) is a major international effort linking the climate, crop, and economic modeling communities with cutting-edge information technology to produce improved crop and economic models and the next generation of climate-impact projections for the agricultural sector.
3 Nelson, G. C. et al. 2014. Climate change effects on agriculture: Economic responses to biophysical shocks. Proceedings of the National Academy of Sciences 111(9):3274–3279.
SOURCE: Nelson, et al. 2014. Climate change effects on agriculture: Economic responses to biophysical shocks. Proceedings of the National Academy of Sciences 111 (9):3274–3279.
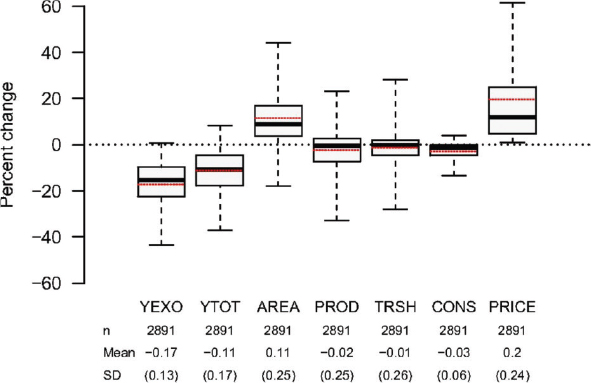
NOTE: Box-and-whiskers plots for key crop and economic model results. The variables YEXO (initial shock on yields of coarse grains, oil seeds, wheat, and rice), YTOT (final yields), AREA (crop area), PROD (crop production), CONS (crop consumption), and PRICE (market price effects) are reported as percentage change for a climate change scenario relative to the reference scenario (with constant climate) in 2050. TRSH is the change in net imports relative to reference scenario production in 2050. Boxes represent first and third quartiles, and the whiskers show 5–95 percent intervals of results. The thick black line represents the median, and the thin red dotted line, the mean value. (Nelson, et al. 2014. Climate change effects on agriculture: Economic responses to biophysical shocks. Proceedings of the National Academies 111(9) 3274–3279.)
SOURCE: Gerald Nelson, Presentation, National Academies of Sciences, Engineering, and Medicine Workshop, January 15, 2016, Newport Beach, California.
Discussing the remaining needs to address challenges to sustainably feeding the world in 2050, Dr. Nelson noted that while it is important to model issues in agriculture and food systems in an integrated biophysical-social framework, more research is needed to further develop a transition to sustainable food systems. He emphasized a need to look more closely at regional and smaller-scale variations in data. Using recent model results disaggregated by region as an illustrative example, India experiences a much larger price increase than Europe; however, results vary significantly by crop and model (Figure 5-3). Similar types of data help further our understanding of how food systems respond at scales that are relevant to decision makers. In addition, changes in weather extremes and climate variability impact crop yields and food systems more than changes in mean temperature and precipitation. Furthermore, gaps remain in understanding the effects of climate variability and change in fruits and vegetables’ nutrient content, factors that are important for human nutrition. There are also gaps in understanding how disease and pest pressure may change with climate change and affect changes in food production and nutrition. Finally, better communication of science to multiple audiences is needed.
Dr. Nelson next turned to metrics and indicators, indicating that complacency, low levels of investment into agricultural research, and low levels of strategic thinking about indicators and metrics are barriers to understanding and addressing threats to food systems. Increasing yields over the last few decades are the consequence of major advances in agricultural research, a growth in the use of biotechnology, and the opening up of commodity markets through free-trade agreements; however, such progress contributed to the perception that food supply is no longer a priority issue, leading to a decline in agricultural research globally. Agricultural trade negotiations have stalled globally and may become more problematic as variability in agricultural production increases because of climate change. Dr. Nelson highlighted a need for increased efforts in advancing biotechnology to address future food security risks. In addition, he stressed the importance of cultivating better strategies for developing goals and indicators for sustainable food systems and improving data collection to support sustainability indicators. Although other researchers argue for a limited number of goals and indicators, a broader set of goals and indicators may be important in order to measure progress for different audiences, sectors, or spatial scales.
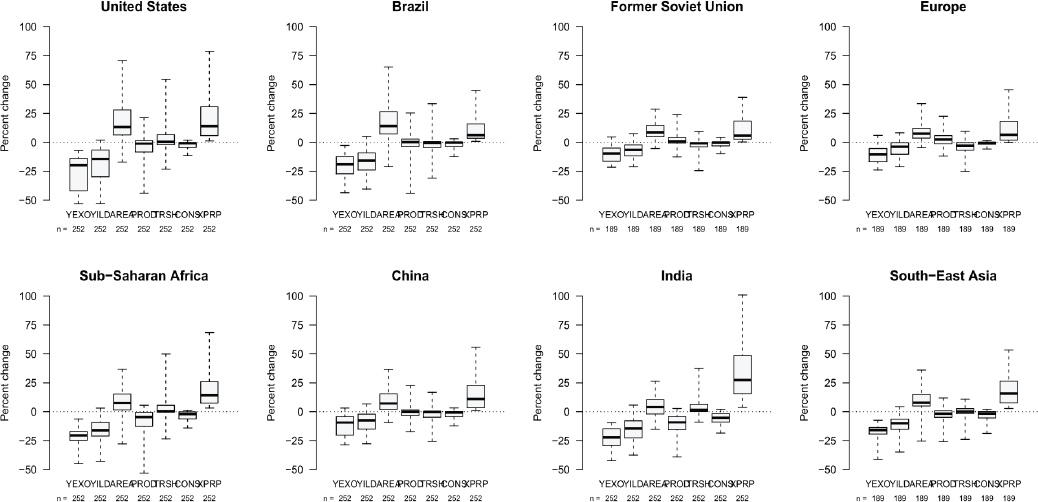
NOTE: Boxes represent first and third quartiles, and the whiskers show the 5–95 percent range of results. The black line represents the median. Abbreviations are the same as in Figure 5-2.
SOURCE: Gerald Nelson, Presentation, National Academies of Sciences, Engineering, and Medicine Workshop, January 15, 2016, Newport Beach, California.
Dr. Nelson concluded by pointing out a large gap in data collection remains and further analysis is needed to develop indicators for sustainability benchmarking, including:
- Data on how crops respond to climate variability and change
- Remotely-sensed data that can be utilized to scale up local observations
- Commonly agreed-upon and widely implemented data collection standards
- A mechanism or platform to report and store data
- Tools to facilitate the development and tailoring of indices
- A transparent system that links calculated indices directly back to data
Mark Howden, chief research scientist at Australia’s Commonwealth Scientific and Industrial Research Organisation’s Agriculture Flagship and director of the Australian National University’s Climate Change Institute, provided insight on progress and barriers to using models to promote the sustainability of agriculture and food systems and how models have been used to inform policy decisions. Dr. Howden said that although there has been progress in using models to support decision making, the modeling community needs to further develop models with the potential to move agriculture toward sustainability. In the late 1980s, the Bruntland Report outlined a number of conditions for research and modeling to better serve food security, including less centralized research, models sensitized to decision makers’ priorities and industry/farmer innovations, and improvements engaging the research community with place-based and adaptive research.4 These challenges are still relevant, Dr. Howden said, noting that the evidence is “patchy” on whether models have delivered on improvements to decision making related to food system sustainability.5,6, 7
One of the overarching reasons for why models fail to meet goals for informing management and policy is that models have historically been developed by researchers to inform research-oriented questions. Although there are engineering-oriented models designed to more explicitly address decision making, much of the modeling effort in the sustainability field over the past few decades was constructed around models designed primarily to self-educate modelers and researchers. Several other reasons current models have fallen short in terms of making desired impacts on decision making include the following:
- Models are an expression of modelers’ world views, assumptions, and values
- Models are embedded into the social and institutional processes and contexts in which decisions are made
- Models by definition focus on explicit, codifiable knowledge, rather than tacit knowledge
- Modeling frameworks are designed to address a problem rather than to identify solutions or opportunities
- Models ignore social, cultural, and biological diversity issues
- Model development focused on farm-level production or yields instead of value or value chains
- Models are susceptible to political capture or marginalization
- There are large uncertainties associated with the outputs of many models
Despite these barriers, Dr. Howden highlighted several successful modeling efforts, and drawing from these examples, described a number of success factors. In one example, an integrated pest management framework was used with a pest-monitoring, data-interpretation, and decision-analysis package aggregated into a simulation model. The success of the model was due, in part, to transparency that allowed farmers to see the data and relationships incorporated into the models, which they could eventually utilize in their own soft models of tacit understanding.8
___________________
4 Brundtland, G., et al. 1987. Our Common Future. Oxford: Oxford University Press.
5 Hayman, P. 2004. Decision support systems in Australian dryland farming: A promising past, a disappointing present and uncertain future. In New Directions for a Diverse Planet: Proceedings of the 4th International Crop Science Congress, Brisbane, Australia, September 26–October 1, 2004.
6 Matthews, K. B., et al. 2008. Wither agricultural DSS? Computers and Electronics in Agriculture 61(2):149–159.
7 Carberry, P. S., et al. 2002. The FARMSCAPE approach to decision support: Farmers’, advisers’, researchers’ monitoring, simulation, communication and performance evaluation. Agricultural Systems 74(1):141–177.
8 Hearn, A. B., and M. P. Bange. 2002. SIRATAC and CottonLOGIC: persevering with DSSs in the Australian cotton industry. Agricultural Systems 74(1):27–56.
The application of seasonal climate forecasts in Australia also illustrates an example where farmers used model results in scenario planning and “management gaming” to construct action rules for responding to different circumstances.9 Additionally, nutrient models that inform farm nitrogen budgets have been designed to integrate data from farm and regional models with additional information about compliance levels.10,11 Dr. Howden noted that an important element in many of these examples is the effort to make sure that “hard” models (e.g., numerical models) are embedded into “soft” models (e.g., systems of tacit understanding). A broader participatory process that addresses salience, credibility, legitimacy, and power is necessary to achieve this integration. In some cases, researchers are the minority knowledge holders and there is evidence that indicates that incorporating user knowledge through such participatory research may expand the range of actionable options.
Dr. Howden stressed that the value in such modeling efforts can serve as a way of convening different groups to discuss potential changes in food systems—these social processes may contribute to more successful models. Dr. Howden said that several “new horizons” in modeling have the potential to further increase the application of models to food systems and sustainability. The effective incorporation of extremes into models, improvements in the treatment of crop pests and diseases and their interaction with biophysical factors, improved quantification of uncertainties, and a focus on nutrition security all encompass potential innovations that can improve sustainable food systems modeling. In addition, Dr. Howden emphasized a need for the development of models promoting innovation and cross-fertilization of ideas, simulation of models that accelerate technological advances, and monitoring and indicators for decision support.
Prabhu Pingali, professor in the Charles H. Dyson School of Applied Economics and Management and founding director of the Tata-Cornell Agriculture and Nutrition Initiative at Cornell University, discussed improvements in the design of sustainability metrics and the path forward in closing remaining data gaps. Dr. Pingali said that without indicators that are relevant to policy decisions, and without sufficient data and data quality to calculate these indices, it will be difficult to transition from knowledge to action on sustainable food systems. A large share of current research efforts focuses on frameworks, methodology, and analysis. In contrast, minimal efforts focus on managing data, improving data systems, or ensuring that indicators are giving the right signals to policy makers. As a result, both data uncertainties and counterproductive metrics may represent the largest challenges to making advances toward food system sustainability.
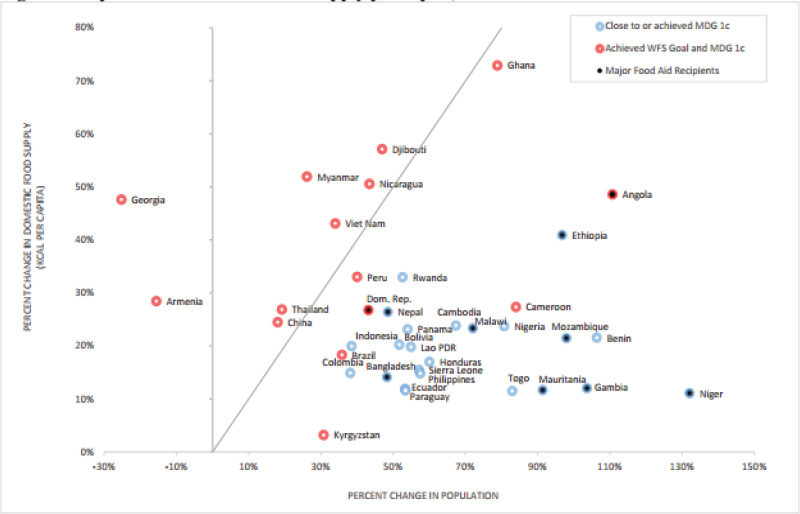
As an example of counterproductive metrics, Dr. Pingali shared an analysis of the UN Millennium Development Goals (MDGs) on global hunger.12 According to these metrics, there has been progress made on addressing hunger since 2002. The MDGs articulated a goal of cutting global hunger by half of 1990 levels by 2015; however, the metric used to measure progress toward addressing hunger is misleading, he said. The number of hungry people in the world has not dropped nearly as much as the percentage of hungry people. Furthermore, some countries have met or almost met the MDG goal despite a number of other sobering statistics on the state of their food security, including increases in the absolute number of people who are hungry, failure to increase food supply at the same rate as population growth, and number of chronic recipients of international food aid (Figures 5-4 and 5-5). The current hunger metric may have led to an overly optimistic message on the state of world hunger.
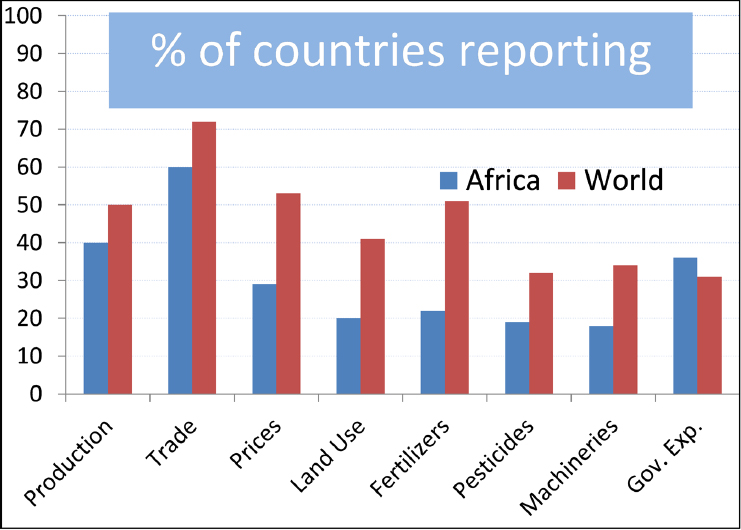
Dr. Pingali emphasized that any indicator or metric, even if well formulated, is only as strong as the data used to calculate it, and in many cases, the scientific community is far from having sufficient data to accurately measure progress. He gave an example of food balance sheets from the UN Food and Agriculture Organization (FAO) where much of the data used to assess food production and food security was drawn from an FAO database; however, in collecting data, the FAO sends questionnaires to each country every year and enters the results into an FAO database. Although a large number of countries provide information on trade, reporting may be poor for
___________________
9 McCown, R. L., et al. 2012. Farmers use intuition to reinvent analytic decision support for managing seasonal climatic variability. Agricultural Systems 106(1):33–45.
10 Leach, A. M., et al. 2012. A nitrogen footprint model to help consumers understand their role in nitrogen losses to the environment. Environmental Development 1(1):40–66.
11 de Vries, W., et al. 2011. Comparison of land nitrogen budgets for European agriculture by various modeling approaches. Environmental Pollution 159(11):3254–3268.
12 The eight Millennium Development Goals (MDGs) form a blueprint agreed to by all the world’s countries and all the world’s leading development institutions.
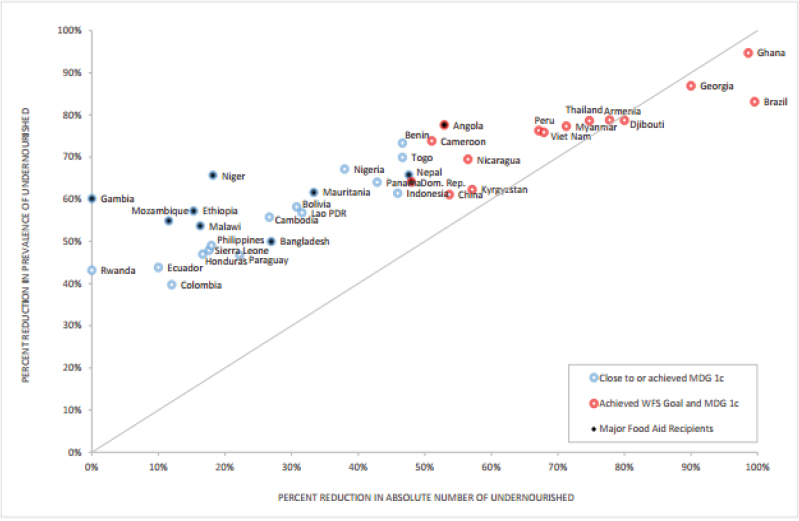
SOURCE: Prabhu Pingali, Presentation, National Academies of Sciences, Engineering, and Medicine Workshop, January 15, 2016, Newport Beach, California. Adapted from: Pingali, P.L. 2016. Opinion: The hunger metrics mirage: there’s been less progress on hunger reduction than it appears. Proceedings of the National Academy of Sciences 113(18):4880-4883.
SOURCE: Prabhu Pingali, Presentation, National Academies of Sciences, Engineering, and Medicine Workshop, January 15, 2016, Newport Beach, California. Adapted from: Pingali, P.L. 2016. Opinion: The hunger metrics mirage: there’s been less progress on hunger reduction than it appears. Proceedings of the National Academy of Sciences 113(18):4880-4883.
other important aspects of the food system—for example, only 50 percent of countries report on food production, prices, and land use (Figure 5-6). Nevertheless, the data are aggregated or extrapolated and presented as continuous time series for each country.
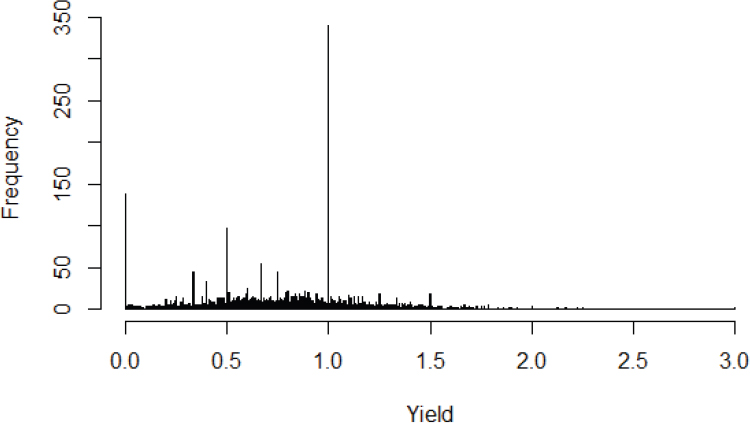
Even when data are available, he said, poor data quality can be a major problem. The Intergovernmental Panel on Climate Change included projections about the impacts of climate change on crop production and food supply under different climate-change scenarios, but the data utilized for such estimates are often of poor quality. Data on sorghum production and yields from India, for example, appear to be largely estimated, given the very uneven distribution of these frequencies, and the very high frequency of yields reported at one half, two-thirds and one ton, rather than measured, given the unlikely distribution of yield measurements from India’s agricultural districts (Figure 5-7). The meteorological data used to establish a relationship with crop production may be equally as questionable.
Similar discrepancies exist for other types of measurements. In another example, Dr. Pingali compared remote sensing versus government reporting data on Indian water use and irrigation and found a 100 percent difference in the amount of land under irrigation, illustrating the importance of data quality, ground truthing, and data validation. It may be likely that these data gaps and counterproductive metrics are not confined to the agricultural sector or to developing economies. Nonetheless, such gaps could be addressed as the world attempts to develop metrics to measure progress toward the Sustainable Development Goals, which have a much more extensive set of indicators. The benefits of providing better data could be further clarified and communicated, and public education may also be important—knowledge of why data collection and management is important to sustainability could be highly beneficial to the public.
Dr. Pingali lastly addressed leveraging new technologies to improve data collection. Remote sensing may have much potential, but several challenges remain for using remote sensing to estimate crop productivity in different regions. Cheap, local sensors are increasingly available for providing field-level estimates of soils and moisture levels. Crowd-sourcing approaches to estimating prices and access to food may also hold promise, although barriers remain in accessing data that reflect food access by households rather than by men. Other challenges remain in
SOURCE: Prabhu Pingali, Presentation, National Academies of Sciences, Engineering, and Medicine Workshop, January 15, 2016, Newport Beach, California.
SOURCE: Prabhu Pingali, Presentation, National Academies of Sciences, Engineering, and Medicine Workshop, January 15, 2016, Newport Beach, California.
scaling up these technologies, such as the difficulty in collecting social data. In his concluding remarks, Dr. Pingali reiterated the need for further progress in data access, data interoperability, and adequate metadata collection.
In the question-and-answer session, Dr. Pingali was asked about how societal data could be aggregated to the same extent as data from the biophysical world. Dr. Pingali responded that data on social topics, such as differences in gender and access to food, are all going to be big challenges. Researchers are still dependent on household surveys for much of that socioeconomic data. The World Bank recently partnered with the Gates Foundation to invest in The Living Standards Measurement Study (LSMS) in order to develop systematic data in Africa at the household level. The goal of the LSMS is to facilitate the use of household survey data for evidence-based policy-making. Participants were interested in crowdsourcing as a way to develop data, but Dr. Pingali commented that there have been some attempts, such as giving farmers rain gauges and having farmers send a text message on amounts of rain each day.
Dr. Howden was asked about participatory modeling and involving stakeholders in the design and construction of the models related to agricultural production. He responded that there have been modeling efforts that engaged stakeholders with a narrow focus, such as the investigation of pesticide application, as well as broad applications that focused on farm tourism and off-farm income. Models serve to help synthesize information about the systems being examined and explore multiple options. The processes of developing these models and research can be taken to other modeling communities and significantly increase the utility and productivity of many models.


