
8
Past and Future Fiscal Impacts of Immigrants on the Nation
8.1 INTRODUCTION
Chapter 7 described accounting approaches for assessing the fiscal impact of immigration and outlined the conceptual challenges involved in its measurement given that the counterfactual scenario (no immigration) is unobservable. In this chapter, the panel applies these concepts to estimate the fiscal impacts of immigration at the national level. In so doing, the underlying variation across geographic regions that is important for a full understanding of the impacts of immigration is ignored at this point. These national estimates incorporate the U.S. federal government budget in its entirety and a single aggregation of budgets in the 50 states and their localities. Chapter 9 explores variation in state and local fiscal impacts across states in detail.
The panel chose to set geographic variation aside (for the time being) in order to focus on how fiscal impacts of immigrants have changed over time. As described in Chapter 9 and elsewhere in this report, over time there has been considerable change both in states’ fiscal policies and practices and in geographic patterns of immigrant receiving and internal migration. These are important features that mediate impacts on particular geographic regions. But the aggregated national analysis may be more directly useful for national immigration policy, and it provides a feasible method of assessing trends in fiscal impacts over time.
In the sections that follow, the panel first documents the path of net annual fiscal impacts and the relevant characteristics among immigrants and natives during a recent historical period for which good coverage in
annual cross-sectional data exists. Covering 20 years of immigrants’ experiences, from 1994 to 2013, these data allow annual fiscal effects to be decomposed into amounts attributable to different immigrant generations. However, it is important to note that these cross-sectional estimates of fiscal impacts are heavily influenced by the age distribution of the underlying groups at the time of data collection. Thus, although such cross-sectional “snapshots in time” are instructive, they do neglect the evolution of fiscal costs and benefits over time that occurs as these groups age—an evolution that we know to be important (see Chapter 7). After children are born, their average fiscal impacts remain negative for many years because they absorb benefits in the form of public education and other support while paying little or no taxes. But children eventually become adults, many of whom work and, for sustained periods, pay more in taxes than they receive in expenditures on benefits. In old age, the fiscal-impact pendulum typically swings back the other way. To some extent, today’s older immigrants may be taken as proxies for today’s young immigrants observed in future periods. But simply assuming an older age group in a cross section is identical to a younger age group observed at a later time is likely to offer a misleading portrait of the cumulative fiscal impacts of any particular cohort of immigrants over that cohort’s life span.
The above limitation of the cross-sectional analysis establishes the rationale for estimating life-cycle fiscal impacts. The second task undertaken in this chapter is to formalize conjectures about future life-cycle fiscal impacts in a systematic way. The panel presents a longitudinal forecast of the future national fiscal impacts of immigrants arriving today, using updated methodologies developed for the 1997 New Americans report (National Research Council, 1997) and updated data and assumptions about future growth rates, interest rates, and demography. Because the children of immigrants play an important role in the fiscal impact of immigration, we pay special attention to fertility rates and intergenerational patterns of educational attainment, and we factor in return-migration behavior. The forecast aims to answer the following question: In today’s dollars, what is the predicted long-term net benefit to domestic governments of an additional immigrant and that immigrant’s descendants?
8.2 HISTORICAL FISCAL IMPACTS OF IMMIGRATION, 1994-2013
This section provides cross-sectional estimates of the fiscal impact of immigration for the nation at specific points in recent history. These estimates are possible because data essential for this kind of analysis have now been available for an extended period. The addition of questions about parents’ places of birth to the annual demographic supplement to the Current Population Survey (CPS) enabled The New Americans to explore the
current and future fiscal impacts of first and second generation immigrants, which tended to differ significantly (National Research Council, 1997). At that time, only samples for 1994 and 1995 were available with sufficient data fields to identify generational status, so pooling these years to allow for sufficient sample size generated a dataset for a single cross-sectional analysis. With almost two decades of additional data now available, the current panel was able to create a sequence of multiple cross-sectional samples. Thus, we can examine the impacts of immigration, taking into account both the first and second generation, during this historical time interval.
Notes on Measurement
As in the national fiscal projections for the 1997 report, the analyses in this chapter focus on individual immigrants rather than immigrant households (although, when the costs of children are allocated to adults in the same households, as is done much of the time here, a quasi-household structure is created). While many studies of the fiscal impacts of immigration adopt immigrant-headed households as the unit of account, measuring benefits and taxes at the individual level facilitates longitudinal calculations of the type presented in Section 8.3, where the future fiscal impacts of immigration are explored. Households may change their composition over time through marriage and divorce, deaths, births, adoptions, move-ins and move-outs, additions or subtractions of members beyond the nuclear family, and so forth. Also, immigrant-headed households often contain nonimmigrant members. Following individuals is simpler because decision rules for allocating fiscal flows in the face of some of these family-dynamic complications can be avoided.
Within the data analysis approaches used in this chapter, fiscal positives (taxes) and fiscal negatives (expenditures on program benefits) are first allocated to the individuals most closely linked to them. In some cases this individual allocation creates some additional interpretive tasks, relative to household analyses, in order to identify the fiscal impact of a particular population group defined by nativity and generation. The costs of educating the U.S.-born children of immigrants are particularly important in this regard. In a household-based analysis, public education unambiguously creates a cost attributable to the immigrant-headed household. For an individual-based analysis, the cost of public education is detected due to the presence of a child in the household and is initially assigned to that child. In some of the analyses below, we present data in such a way that the age- and individual-specific timing of fiscal impacts (both positives in the form of taxes and negatives in the form of program costs) can be shown—even for children. In other analyses, the fiscal impacts of individuals and their dependents are combined and the impacts of the latter are attributed their parents’ genera-
tional groups. Details about which allocation procedure is used are provided for each of the accounting exercises reported on below.
Age profiles—indicating average flows of taxes or benefits by education, by immigrant generation, and in some cases by time since the immigrant’s arrival—are central to the accounting and forecast methods used here. To generate these profiles, the panel used data from the Annual Social and Economic (March) Supplement of the CPS, which provides annual estimates of program utilization as well information on the characteristics (such as education and nativity) of respondents. These age profiles are used in both the historical static and lifetime forecast analyses presented in this chapter.1 Single-year age profiles were constructed by averaging three adjacent years’ worth of data for smoothness. These age profiles are then rescaled for each middle year so that—when applied to population estimates by age, education, immigrant generation, and time-since-arrival in that middle year—they capture the total flows for a given program in that year in an estimate that is consistent with administrative sources.2 Details
___________________
1 The main alternative to the CPS that could have been used is the Survey of Income and Program Participation (SIPP), conducted by the Census Bureau. The CPS and SIPP each have advantages and disadvantages. While ultimately choosing not to use it for other reasons, The New Americans (National Research Council, 1997) panel concluded that the greatest strength of SIPP is that it contains more accurate monthly data on program participation and expenditures and richer information on wealth and income sources than does the March CPS. The current panel, like the panel that authored the 1997 report, chose to use the CPS due its substantially larger sample size. Because the analyses in this report required cells defined by age, immigrant generation, and education, as well as some separate analyses at the state level, sample size was critical. The March CPS also has an oversample of Hispanics (and a number of other groups, including Asians), which increases representation of immigrant and second generation households. In addition, because the March CPS is conducted every year, it is possible to combine across years to further increase the sample size. Moreover, the state-level analysis in Chapter 9 would not have been possible using the SIPP, and the panel felt it was important to use a consistent data source across analyses. Timeliness was also an issue. The lags in release of new SIPP data are much longer than those for the March CPS, which is available in the fall of each survey year. Current immigration research based on SIPP is using the data from the 2008 panel. The immigrant population had a different composition by 2011-2013 relative to 2008—specifically, the more recent period has lower percentages of unauthorized immigrants, fewer Mexican immigrants, and more Asian immigrants. Also, program use and employment change over time. Regarding potential bias, both data sources are known to underreport income and program use. And although internal panel calculations indicated that SIPP shows higher program use than does the CPS, the differences were about the same for immigrants and natives, so the bias was not related to immigrant status but rather just an overall feature of the CPS. Thus, adjustment to administrative totals for income and program use addresses much of the known underreporting problem.
2 The analyses in this chapter make the de facto assumption that immigrants are represented in the CPS roughly proportionally to their representation in the population. For each benefits program, CPS data are adjusted for under- or over-reporting by scaling each record by a single multiplicative factor for that particular program so that the accumulated aggregate over all records match program totals from National Income and Product Accounts. However, there is
about the estimation methods for specific programs are listed in the Technical Annex to this chapter.
To assess the robustness of the panel’s historical estimates, we conducted a sensitivity analysis by varying assumptions about program utilization and about how public expenditures are attributed. We broadly followed the methodology of Dustmann and Frattini (2014), who specified two overarching cost scenarios in which immigrants incur either the average cost or the marginal cost of public goods, plus a number of subscenarios within each of these two. Their baseline specification has immigrants incurring the average cost of public goods. For our analysis, we used the eight scenarios listed in Box 8-1, the first of which is the average-cost baseline, consistent with Dustmann and Frattini (2014).
Dustmann and Frattini (2014) explained the rationale for examining these particular scenarios. In theory, as explained in Chapter 7, pure public goods can be enjoyed by an unlimited number of citizens, implying that the cost of providing them to an additional immigrant should be zero (the marginal cost scenario). But in practice one expects most services provided by governments to be susceptible to congestion. As described in detail in Chapter 7, assigning to immigrants the average cost of public goods—like defense spending, or total defense outlays—calculated across all U.S. residents is a conservative assumption in that it generates estimates that may overstate the net cost of an additional immigrant. Thus, to examine robustness of findings based on the average-cost approach, the panel included scenarios (5 through 8) that assign a marginal cost of zero for public goods, under the assumption that an additional immigrant does not increase the total cost to the nation of services such as national defense.
Scenario 1 includes interest payments as a component of public goods spending, along with defense, foreign aid, and state and local spending
___________________
likely a differential undercount of the unauthorized component of the immigrant population. Based on a residual method that compares survey estimates of the resident population with administrative data on legal immigration, a number of researchers (e.g., Baker and Rytina, 2013; Passel and Cohn, 2014; Warren and Warren, 2013) have estimated the characteristics of the unauthorized population, including its fiscal impacts. These estimates suggest that unauthorized immigrants as a group may have a more positive fiscal impact than authorized immigrants, but only because of their age structure. The average undocumented immigrant is of younger working age than the average documented immigrant (there are very few undocumented immigrants of retirement age); thus, the net fiscal impact of the former is more positive at the federal level and overall. Also, as detailed in Chapter 3, undocumented individuals, young unauthorized immigrants who qualify for the Deferred Action for Childhood Arrivals Program, temporary visa holders, and recent legal permanent residents are ineligible to receive benefits from some programs; and unauthorized immigrants do not qualify for the earned income tax credit. Nonetheless, since, at any given age, unauthorized immigrants tend to earn less than their authorized counterparts, controlling for age, they are less of a benefit to public finances than authorized immigrants.
categories such as subsidies and interest payments. In scenarios 2 and 6, we remove interest payments from the public goods calculation because they represent the cost of servicing debt attributable to past spending and deficits from which new immigrants did not benefit.3 Scenarios 3 and 7 follow The New Americans (National Research Council, 1997) in estimating the consumption of immigrants by assuming a constant real amount of income is remitted to the country of origin and thus not spent in the United States. Based on a conservative reading of a study using data on Germany, Dustmann and Frattini (2014) assumed that immigrants send remittances back to their home countries at levels that affect consumption such that U.S. sales and excise taxes paid by them are reduced by 20 percent relative to the average for the general population. This adjustment factor is used in scenarios 3 and 7 to provide another robustness assessment that is consistent with their methodology. In scenarios 4 and 8, the panel explores
___________________
3 Interest payments, the vast majority of which go to servicing the debt, are not raised right away by an immigrant entering the country—they represent the current cost of servicing past deficits to which new immigrants did not contribute. Over time, an additional immigrant may affect the level of debt and thus debt payments, depending on his or her net fiscal impact. But, particularly for the intergenerational projection exercise (in the second part of this chapter), this calculation would be very complicated as each lifetime profile of marginal fiscal net contribution or cost uniquely affects the debt and debt service costs. Treating the marginal contribution of immigrants to debt service as either zero or average cost as we do provides a range of possible results, although given the impact of discounting on future flows, the true impact would be much closer to the zero cost than the average cost scenario.
the effects from assigning zero capital income taxation to immigrants who have been in the United States for less than 10 years. In the other scenarios, the implicit assumption is that ownership of company shares is distributed similarly across native- and foreign-born populations. But scenarios 4 and 8 assume that recent immigrants do not own shares of U.S. companies and therefore do not make capital tax payments. Although new arrivals do have lower ownership than the general population, this simplifying assumption is clearly an overstatement of the difference in stock equity between natives and immigrants. Nonetheless, it is useful for understanding the potential impact of assumptions about capital ownership by immigrants.
In the sections that follow, the panel first describes the policy environment, and then explores the age structure and number of children of U.S. immigrants, and trends in education, working, and earnings among immigrants. We then examine the effects of variations in patterns of program utilization, receiving government benefits, and paying taxes, by age. Because the assumption about how the costs of public goods are assigned varies across scenarios, our initial analysis of age-related patterns (which follows immediately below) omits them—this allows the discussion to focus first on fiscal impacts linked to age structure. In the subsequent sections, we reintroduce public goods in order to present complete fiscal impact estimates for immigrants and natives for scenario 1 and, to test for robustness, across the other seven scenarios.
A Changing Policy Environment
The New Americans (National Research Council, 1997) was released immediately after passage of welfare reform via the Personal Responsibility and Work Opportunity Reconciliation Act of 1996 (PRWORA). PRWORA was one of the largest changes in fiscal policy in recent decades. The 1997 report attempted to estimate the effects of PRWORA on the fiscal impacts of immigrants, bearing in mind that the law denied certain means-tested benefits to noncitizens. Its authors assumed immigrants received no such transfers until after 5 years of residence.4 The changes in net fiscal impact of immigration associated with PRWORA, although modest, were found to make immigrants less costly to states and localities and more beneficial to federal finances (National Research Council, 1997). Subsequent analyses by Bitler and Hoynes (2013), Borjas (2002), and others indicated that, in the aftermath of PRWORA, participation rates at the national level of immigrants declined for a number of programs relative to those of natives
___________________
4 The affected programs were Supplemental Security Income, Aid to Families with Dependent Children (AFDC), food stamps (SNAP), nonemergency Medicaid, energy assistance, rent subsidies, and public housing.
(see discussion in Chapter 3). Borjas (2002) found that much of the national decline was attributable to immigrants living in California, who experienced “a precipitous drop in their welfare participation rate (relative to natives).”
In the years since welfare reform, there have been other significant changes to U.S. fiscal policy that likely factor into the fiscal impacts of immigrants. In particular, other income support programs have grown to fill the gaps left by welfare reform. The Earned Income Tax Credit has been expanded several times over the past three decades, rising more than fivefold from an $11 billion program in 1994 to a $58 billion program in 2013. Similarly the child tax credit, introduced in the late 1990s, has grown into a $22 billion program that aims to support working families. Participation in the Supplemental Nutrition Assistance Program (SNAP), also known as food stamps, declined initially after welfare reform before rising strongly due to policy reforms prior to the Great Recession, during which SNAP participation rates rose even more (Ganong and Liebman, 2013). In 2013, SNAP assistance totaled $75 billion, up from $23 billion in 1994.
Other changes in the federal safety net during this period included the addition of a prescription drug benefit to Medicare starting in 2006, the expansions of Medicaid, and introduction of health insurance subsidies in 2014 via the Affordable Care Act (ACA), which also aimed to rein in future Medicare spending. Undocumented immigrants are explicitly omitted from coverage and subsidies under the ACA, but authorized immigrants are fully eligible. Because the panel’s period of historical data ends in 2013, we do not include the ACA in our historical analysis. In the longitudinal forecast of the future fiscal impacts of immigrants (Section 8.3), we model the effects of the ACA following the assumptions of the Congressional Budget Office (CBO).
There were also changes in tax policy during the historical period. Income tax rates were cut across the board in 2001 but partially reinstated for high-income households in 2013. Tax rates on capital gains and dividends were cut in 2003 and were also partially reinstated for high-income households in 2013. By 2011, these tax cuts had reduced average federal tax rates on all income groups, but by more in the lowest four quintiles (Congressional Budget Office, 2014b).
By 2013, most of the federal policy responses to the Great Recession, which significantly lowered taxes and raised spending starting in 2008, had run their course. In particular, payroll tax rates, which were lowered in 2011 and 2012, returned to their precrisis levels. However, usage of means-tested benefits remains elevated compared to prerecession levels (Congressional Budget Office, 2015).
In addition to these changes at the federal level, state and local fiscal policies have also been in flux during the historical period. Chapter 9 provides details about differences across states in the effect of immigration on subnational fiscal situations.
The Age Structure of Immigrant and Native Populations
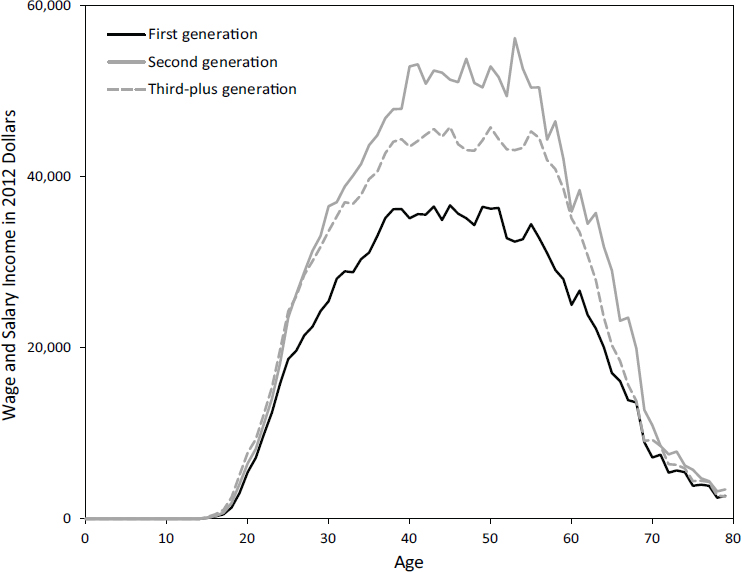
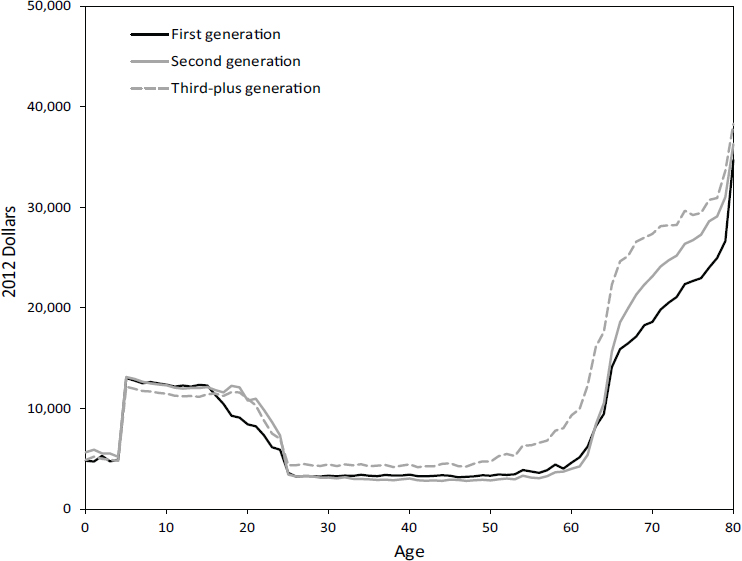
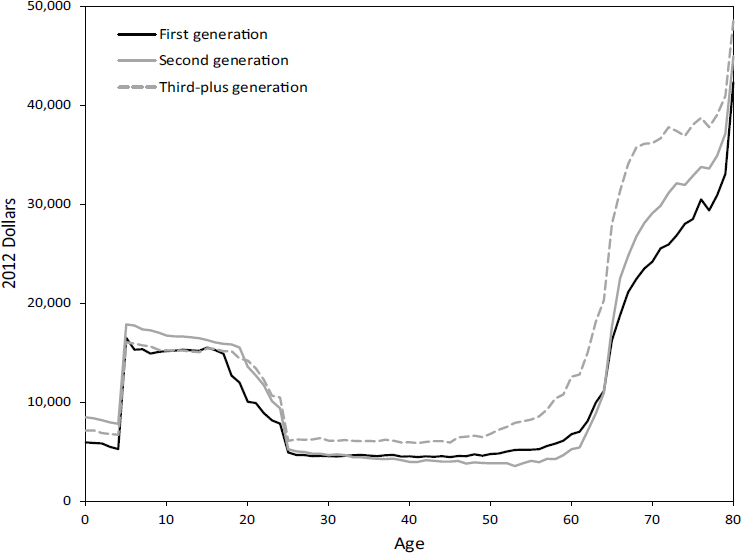
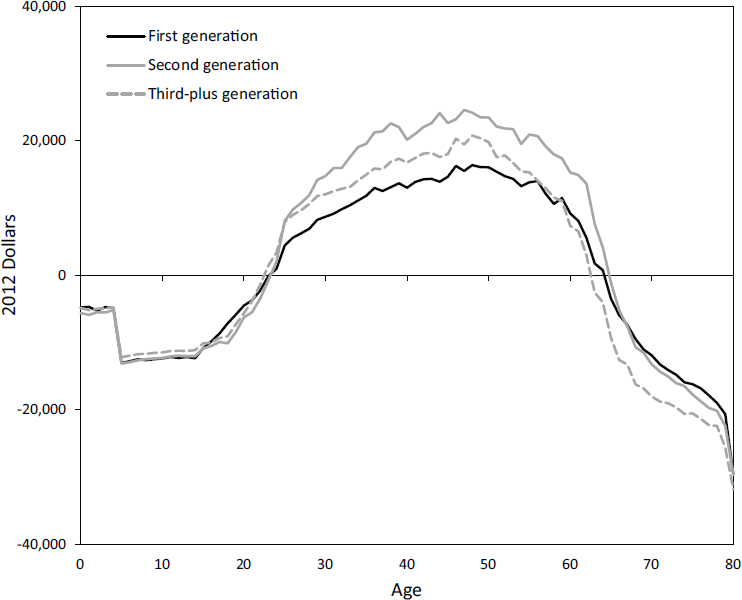
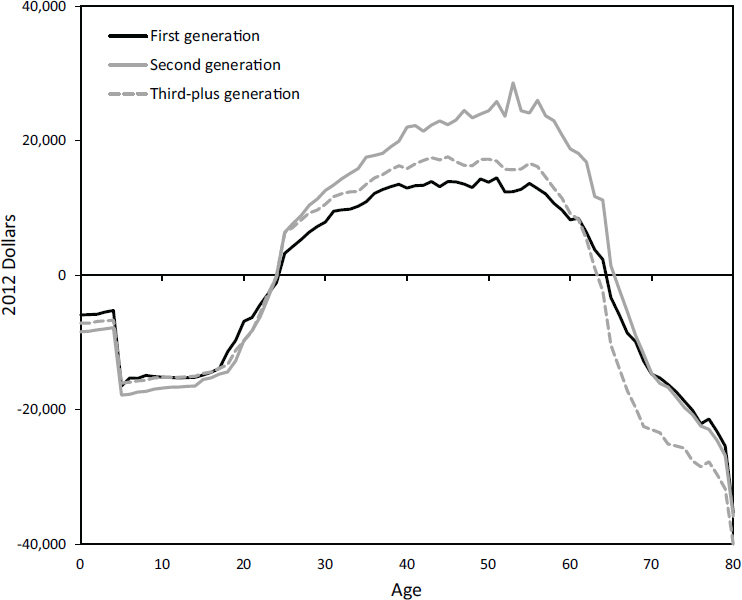
Immigrants and their children differ from natives in a variety of ways, but perhaps most notably in terms of age structure. Figure 8-1 shows the age structure in 1995 of first generation immigrants (the foreign-born) and their native-born children (the second generation), both plotted against the left vertical axis, and the rest of the native-born population (referred to here as the third-plus generation) plotted against the right axis. Figure 8-2 shows the age distributions of these three groups in 2012.
To repeat the definition of immigrant generations given in Chapter 1, “first generation” refers to foreign-born persons, excluding those born abroad and granted citizenship at birth because their parents are U.S. citizens. The second generation consists of U.S.-born persons who have one or more first generation parents. The third-plus generation includes U.S.-born persons of two U.S.-born parents and those born abroad but granted citizenship at birth because their parents are U.S. citizens. Note that persons born in U.S. outlying areas such as Puerto Rico are considered U.S. born
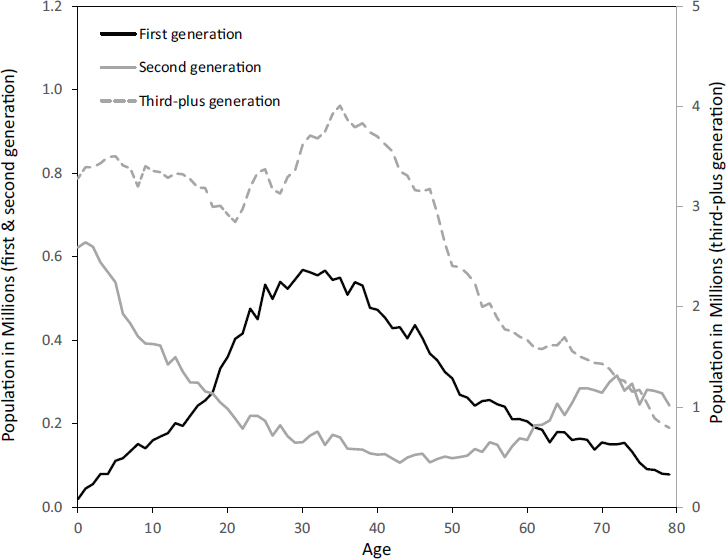
NOTE: “Third-plus generation” includes third and higher generations since ancestors arrived in the United States.
SOURCE: Data are from the 1994-1996 March Current Population Surveys.
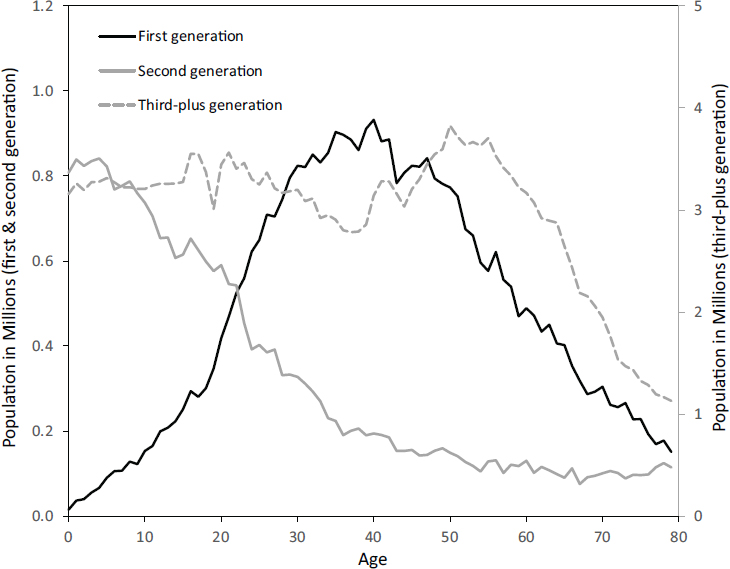
NOTE: “Third-plus generation” includes third and higher generations since ancestors arrived in the United States.
SOURCE: Data are from the 2011-2013 March Current Population Surveys.
in this analysis because they are citizens at birth and thus, barring legal changes in citizenship, their movement to or from the 50 states would not be affected by immigration policy.
As both figures reveal, the first generation is heavily concentrated at working ages and does not contain many very young or very old people—the latter reflects the unusually small numbers of immigration arrivals during the mid-20th century. The second generation, which in 1995 still included children of early 20th century immigrants, is nearly the mirror image of the first generation, with comparatively few members of working age and higher shares of children and the elderly. By 2012, the second generation had become more concentrated at young ages, including younger adults, reflecting the substantial growth in their parents’ population—first generation immigrants of working ages—and the mortality of the second generation children of earlier immigrant waves. By contrast, the age structure of the third-plus generation has remained more stable. However, the aging of the Baby Boom generation has produced a more rectangu-
lar (rather than pyramidal) age distribution than was typical in the past, roughly equalizing the shares of young, working-age, and older third-plus generation Americans.
Age structure is crucially important for contextualizing fiscal impacts of a group with a particular nativity status at a point in time—or cross sectionally. While lifetime fiscal impacts may turn out to be more similar across groups, the short-term impact of a group that is concentrated at working ages when tax contributions are high will be more positive than that of a group that is, at that time, either relatively young or elderly or both, because the latter age ranges typically receive more transfers than they contribute in taxes. Given the patterns evident in Figures 8-1 and 8-2, if tax payments are attributed to the first generation, many of whom are of working age, and the use of public expenditures on education are attributed to their second-generation children, one would expect the current net fiscal impact of the first generation to be positive and the impact of the second generation to be negative. The net fiscal impact of the third-plus generation could be positive or negative, but is likely to have become less positive with the aging of the Baby Boom cohorts. After 20 more years, the age distribution of those currently in the first generation will look a lot more like the current third-plus generation.
However, when the costs of dependent children are attributed to their parents—which, for many questions, will be the most relevant allocation—estimates of the current-year fiscal impact generated by first generation immigrants change dramatically. There are large counterbalancing fiscal impacts in an “immigrant household” grouping scheme. When a population is disproportionately of working ages, and therefore paying taxes and creating a positive fiscal impact, they are also likely to be disproportionately parents of children creating a fiscal negative, primarily in the form of public education costs. As shown below, this demographic characterization accurately describes first generation immigrants for the 1994-2013 period. In 2013, first generation immigrant households had a weighted average of 0.95 children in their households (see Figure 8-3)—much higher than the weighted averages of 0.29 and 0.48 for second generation and third-generation households. As indicated in Figure 8-3, some of this difference is accounted for by the fact that immigrants have had higher fertility over the past 17 or so years (suggested by the higher position at early parenting ages of the red line representing the first generation) and are also more likely to live in multigenerational households as elders.5 But these children-in-households profiles do not account for the full difference in the weighted averages across the
___________________
5 This is mostly “explained” by Hispanic ethnicity and family reunification policies that brought many older first generation immigrants to join their first generation children. Second generation persons have the lowest fertility, and in Figure 8-3 the whole curve for that generation is shifted a few years to the right compared with either the first or third-plus generation.
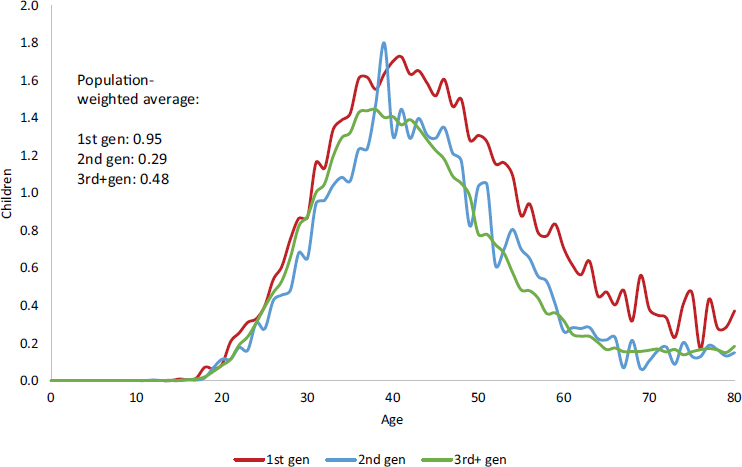
NOTE: Figures based on the Integrated Public Use Microdata Series (IPUMS)imputed child variable, which includes biological and adopted children and stepchildren of any age or marital status. Second generation includes persons with one or two foreign-born parents. “Third-plus generation” includes children with parents who are second or higher generation since ancestors arrived in the United States.
SOURCE: Data are from the March 2013 Current Population Survey.
three generational categories; in fact most of the difference can be attributed to the much higher percentage of immigrants in the parenting age range relative to other populations. The average number of children for the first generation is expected to decrease as the group grows older due to slower replacement (with new immigrants arriving) than in the past.
Trends in Education, Employment, and Earnings by Immigrant Status
In addition to age and number of dependents, an individual’s education level and employment status are also important determinants of fiscal impact. Earnings and thus tax contributions tend to rise strongly with age and experience. They also rise with the level of education, and they track employment patterns in a predictable fashion. Benefits may vary inversely with education and employment to the extent that the safety net compensates need, but old-age entitlements also tend to rise with lifetime earnings and longevity, which are correlated positively with education.
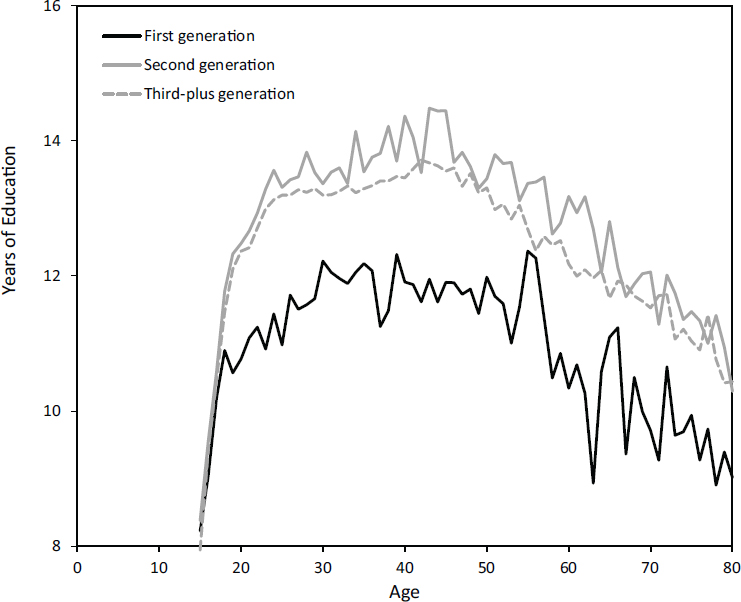
SOURCE: Data are from the March 1994 Current Population Survey.
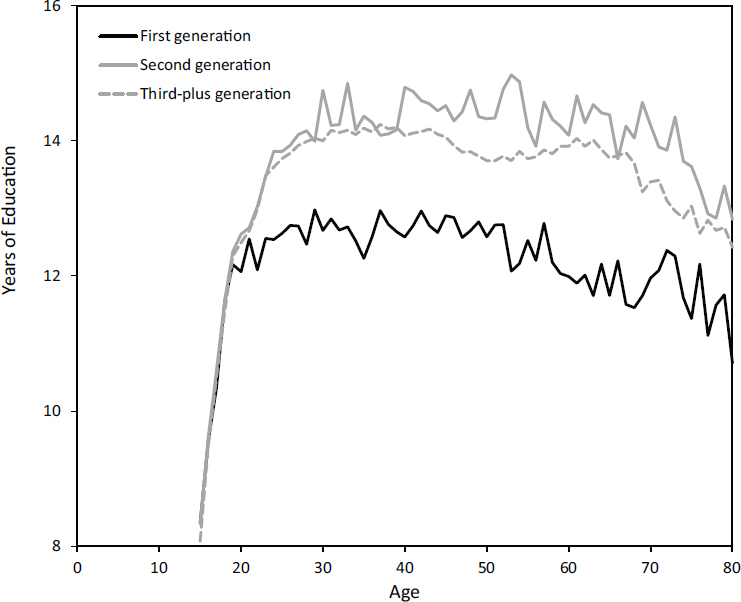
Figure 8-4 shows average education levels across age by immigrant generation in 1994 as measured in the CPS.6 Average education declines for all groups beyond age 40 because earlier birth cohorts were less well educated. On average, first generation immigrants in 1994 had 1.5 fewer years of education than either the second or third-plus generations. Second generation education in 1994 was similar to but higher than that of the third-plus generation by 0.35 years; the children of immigrants tended to have higher education levels than other natives at every age.
Age-specific education levels have been changing over time for all U.S. residents as younger cohorts with more education have replaced older cohorts with less. Figure 8-5 depicts the same age patterns of educational attainment as Figure 8-4 but for immigrant generations in 2013. Each line is higher than it was in 1994 by roughly 1 year. The gap between the first
___________________
6 We transformed educational attainment categories in the CPS into years of attainment using the crosswalk method suggested by Jaeger (1997).
SOURCE: Data are from the March 2013 Current Population Survey.
and third-plus generations has narrowed slightly during this interval from 1.5 to 1.25 years, while the second generation maintained the same 0.35 year advantage over the third-plus generation.
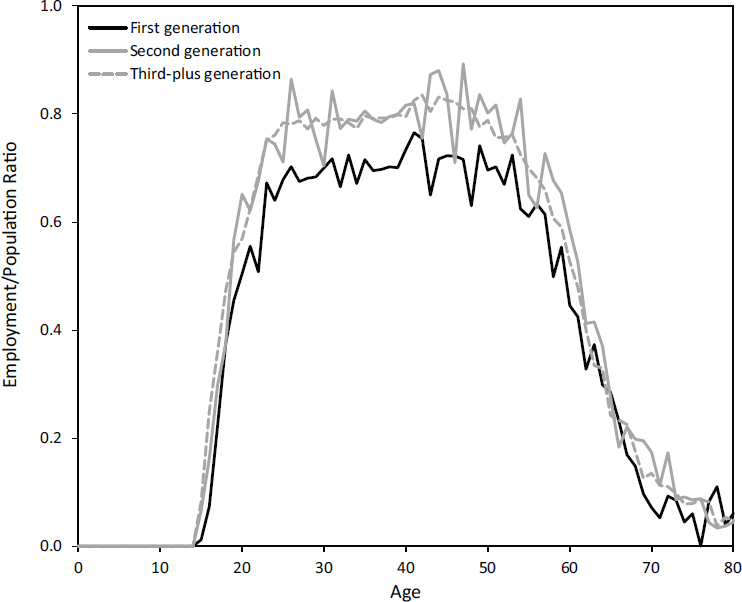
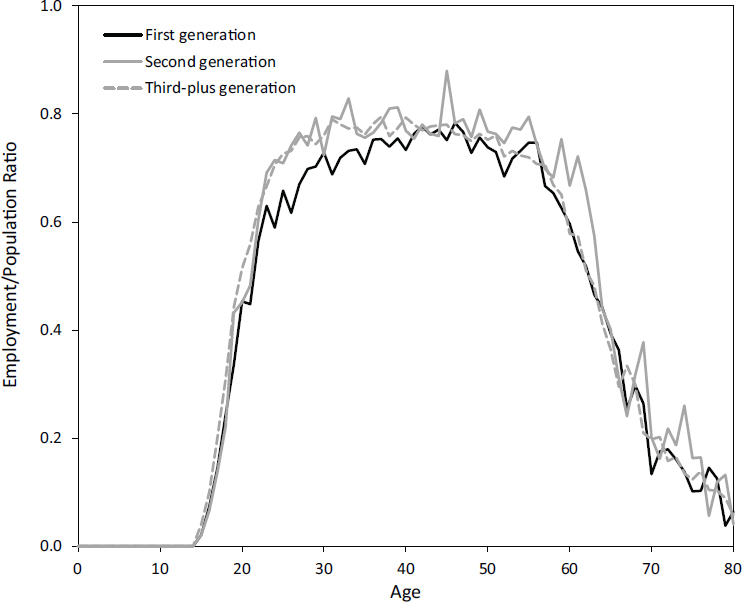
Patterns in employment across age also vary by immigrant status and have shifted somewhat over time. Figure 8-6 shows that in 1994, employment for all groups followed the expected inverted-U shape with increasing age and that immigrants worked less, at a given age, than natives (i.e., the first generation worked less than the second and third) except at some typical retirement ages.7 On average, immigrants ages 20 and older were about 5 percentage points less likely to be employed than the second or third-plus generations. But by 2013, as depicted in Figure 8-7, that gap had
___________________
7 As detailed in Chapter 3, the lower employment ratio of immigrants has historically been driven by lower participation of foreign-born women in the labor market. After an adjustment period, immigrant men often have employment ratios equivalent to natives and for some groups (e.g., low-skilled categories) they are considerably higher.
SOURCE: Data are from the March 1994 Current Population Survey.
narrowed to 2 percentage points—mostly as a result of increasing employment of immigrant women (see Chapter 3), with lingering differences by immigrant status only under age 40. Employment rates by age among the second generation have remained broadly similar to those of the rest of the native-born population.
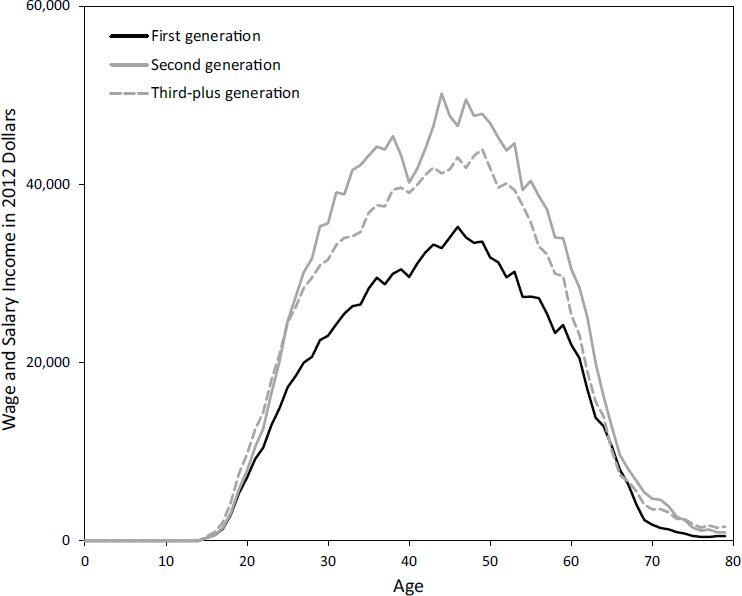
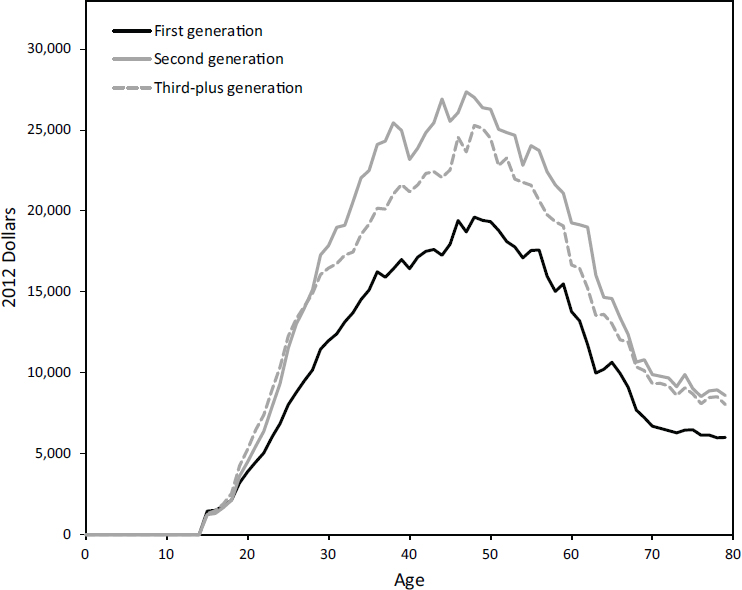
Although employment patterns of immigrants and natives have converged somewhat over time, if one adds the impact of wages the trends in relative earnings are more similar to trends in relative education, which display less convergence. Figure 8-8 shows large differences by immigrant generation in wage and salary income in 1995, measured in 2012 dollars and including those with zero earnings. On average, immigrants ages 20 and older in 1995 earned about $5,500, or 23 percent, less than natives of comparable age. In contrast, the second generation earned roughly $3,000, or 12 percent, more than the third-plus generation. Estimates vary, but an additional year of schooling may raise earnings by 10 percent (Card, 2001). Relative to that baseline, the immigrant earnings penalty is larger than
SOURCE: Data are from the March 2013 Current Population Survey.
might be expected, given their education disparities, but the remaining difference could be explained by reduced employment rates or hours worked. The earnings advantage of the second generation relative to the third-plus generation appears larger than would be explained by educational differences alone.
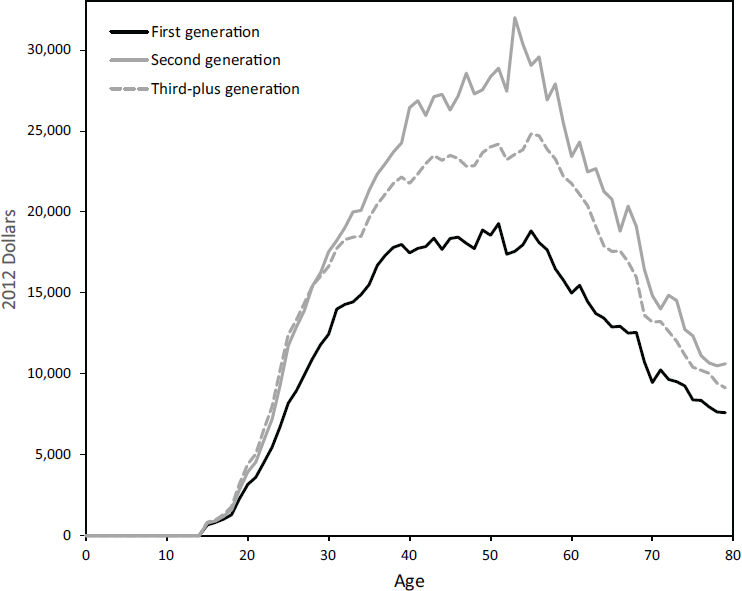
Figure 8-9, which shows earnings by age and immigrant status in 2012, visually suggests the second generation had pulled further away from the third, which is true. Note that these estimates are the average wage and salary income over people who are working and who are not. If one takes the average wage and salary income for the peak earning ages of 35-55 years old, earnings grew by about 12-13 percent for first and second generation persons but only by 9 percent for third-plus generation persons. So compared to third-plus generation wage and salary earnings, the second generation is pulling ahead and the first generation is catching up.
SOURCE: Data are from the March 1994-1996 Current Population Surveys.
Trends in Fiscal Flows by Age and Immigrant Generation
Now that we have considered many of the relevant characteristics of each generational group, we put this all together to examine fiscal flows. In this section we continue to take the individual as the unit of analysis, attributing tax receipts and benefit cost flows—which, when combined, yield net fiscal impacts—to each individual across the full age spectrum. This approach is useful for showing how fiscal flows vary by age and, controlling for age, across generational groups. However, such an approach disregards that children and other dependents are linked to independent adults, often from a different generational group. For this reason, in the section after this one, our analysis shifts focus by redefining generational groups to include dependents; so, for example, the first generation immigrant (the foreign-born) group includes foreign-born individuals ages 18 and older, plus their dependent first and second generation children (see Box 8-2). For now, in
SOURCE: Data are from the March 2011-2013 Current Population Surveys.
this section, we continue to look at the fiscal flows associated with individuals without taking their dependents into account.
The cost of educating the young dominates fiscal flows early in the life cycle; contributions in the form of taxes paid dominate the middle years, and the cost of health care dominates the later years. This pattern is illustrated for first generation immigrants in Figure 8-10. Given that taxes and fiscal transfers in the United States are largely based on earnings, one would expect the persistent earnings disadvantage of immigrants and the persistent advantage of the second generation to be mirrored in patterns of tax payments and program utilization. This is certainly true in the case of taxes paid to all levels of government, which is shown in Figure 8-11 for the year 1995 and in Figure 8-12 for the year 2012. In both years, tax contributions strongly track the age profiles of wage and salary income shown in Figures 8-8 and 8-9 up to retirement ages. Because retirees continue to pay taxes on wealth and on some forms of income, their tax contributions remain positive even after their earnings cease. Immigrants ages 20 and
older contributed about 23 percent less than the third-plus generation8 in both years, while the second generation contributed 12 percent more than the third-plus in 2012 versus 10 percent in 1995.
Comparison of the data shown in Figures 8-8, 8-9, 8-11, and 8-12 also reveals relatively moderate increases over time in tax contributions relative to the growth in earnings. Between 1995 and 2012, per capita taxes paid rose 10 percent for immigrants, 13 percent for the second generation, and 11 percent for the third-plus generation. This is about half as fast as the growth in earnings during this period; if all taxes were levied on earnings, it would imply reductions in average tax rates of about 10 percent as well. One can see by comparing the graphs in Figures 8-11 and 8-12 that all of
___________________
8 Again, throughout this report, “third-plus generation” refers to all persons in the third and higher generations after immigration. In short, anyone resident in the United States who is not first or second generation is in the “third-plus generation” as defined for this chapter.
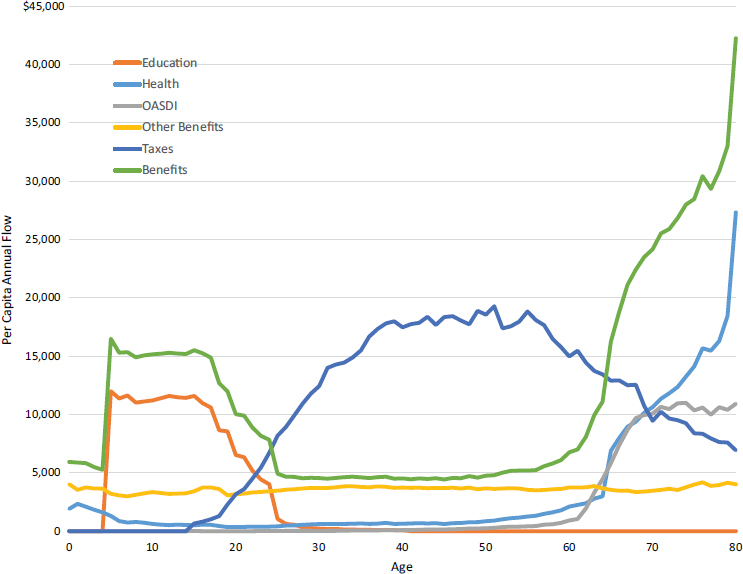
NOTE: All public spending is included, except pure public goods (defense, interest on the debt, subsidies). The “Health” category includes Medicaid and Children’s Health (CHIP) programs. Data are Current Population Survey (CPS)-based per-capita age schedules, smoothed and adjusted to National Income and Product Accounts (NIPA) annual totals.
SOURCE: Data are from the March 2011-2013 Current Population Surveys.
the increase in inflation-adjusted tax contributions came from increases at older ages.
In contrast to the tax picture, per capita government benefits have risen in real terms across all age and nativity groups at an average rate that was slightly faster than the growth in earnings. This is largely attributable to the influence of current economic conditions compared to those in the 1990s: employment and wages have grown slowly in the wake of the Great Recession, while federal spending was increased to respond to the crisis. While the levels may have changed, Figures 8-13 and 8-14 (which attribute program costs of education at the age points of the children being edu-
SOURCE: Data are from the 1994-1996 March Current Population Surveys, normalized to program totals.
cated9) show that little change has occurred in the shape of the age profiles of benefits over time, nor has there been much change in the distribution of benefits across groups defined by immigrant status. But each age profile has risen, with growth most apparent (by comparing the lines in Figures 8-13 and 8-14) at the youngest and oldest ages.
Growth in per capita benefits from 1995 to 2012 was most rapid for those under age 20, where outlays increased 31 percent for immigrants, 38 percent for the second generation, and 33 percent for the third. But the second-most rapid rate of growth in benefits was actually among individuals of working ages, 20 to 64, which is not easy to see in the figures.
___________________
9 For other programs where the benefit depends on household size or that require the presence of children to qualify, the benefit is allocated equally to all members of the family unit receiving the benefit. These programs include AFDC, other welfare programs, and the Earned Income Tax Credit (EITC).
SOURCE: Data are from the 2011-2013 March Current Population Surveys, normalized to program totals.
Benefits absorbed in the working-age range rose 33 percent for immigrants, 34 percent among the second generation, and 32 percent for the third-plus generation. Increases in benefit amounts at these ages were considerably less than the increases in benefit amounts for other age groups because benefits started from a smaller base. Benefit levels in retirement were already the highest of any age group, and they increased the most in dollar terms during this period. But the percentage growth in benefits for the retirement age group was only 16 percent for immigrants, 12 percent for the second generation, and 18 percent for the third-plus generation.
Another noteworthy aspect of these trends is that per capita benefits absorbed by the third-plus generation exceed those for the first and second
SOURCE: Data are from the 1994-1996 March Current Population Surveys, normalized to program totals.
generations at all ages past the typical years of college attendance.10 To the extent that receipt of some government benefits is contingent on years spent in the country, some of this is to be expected. But it is striking that the U.S.-born second generation absorbs fewer benefits than other natives at all such ages in both 1994 and 2012. The underlying patterns of program use contributing to differential benefit receipt by native-born children of immigrants and other natives at adult ages are primarily twofold. Up until about age 50, the third-plus generation uses means-tested programs such as Medicaid, unemployment benefits, food stamps, and the Earned Income
___________________
10 This finding is consistent with those in the peer-reviewed research literature. Sevak and Schmidt (2014), for example, link Health and Retirement Study survey data to restricted Social Security administrative data to show that immigrants have lower levels of benefits than do natives. The amount included here as state and local retirement benefits includes defined benefit plans but not defined contribution plans. The latter are typically not categorized as a public benefit and should be distinguished from payments out of tax revenues.
SOURCE: Data are from the 2011-2013 March Current Population Surveys, normalized to program totals.
Tax Credit (EITC) more intensively than does the second generation. After age 50, the third-plus generation absorbs more old-age benefits, such as Social Security pensions and disability payments, federal retirement payments, and state and local retirement benefits.
These patterns of program use are also revealed in Figure 8-15, which shows receipt of benefits associated with federal old-age support programs (Social Security, Medicare, Medicaid payments to nursing homes, federal worker retirement, and other programs), and in Figure 8-16, which shows federal means-tested programs for the poor (the rest of Medicaid, Supplemental Security Income, unemployment insurance, food stamps, the EITC, and other support); data are shown for 2012 in both figures. Old-age benefits are nonzero prior to retirement because of the inclusion of disability insurance, but they rise rapidly for all groups after age 62. Immigrants receive less Social Security than natives because they have typically paid less into the system or have immigrated after working ages. Prior to age 62, the excess spending generated by the third-plus generation relative to the second generation is
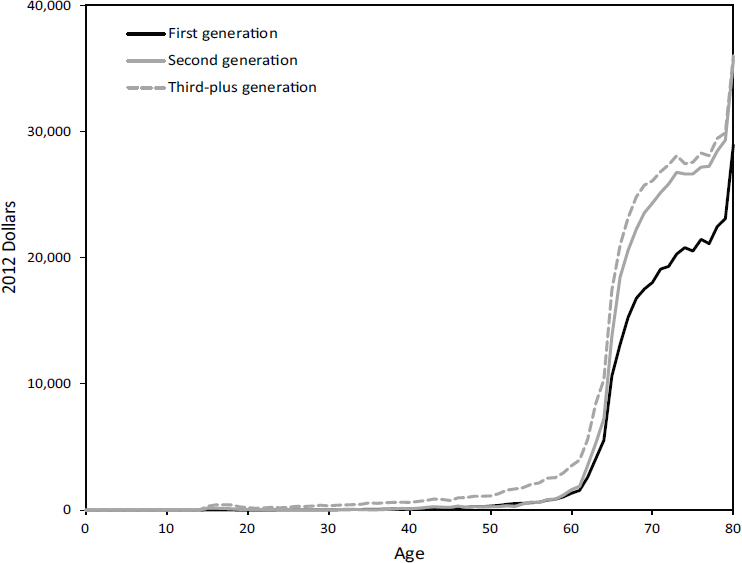
SOURCE: Data are from the 2011-2013 March Current Population Surveys, normalized to program totals.
due to federal disability insurance, whereas after age 62 it is attributable to federal retirement benefits (i.e., Social Security), which rise steeply with age.
For working-age individuals, the means-tested federal antipoverty benefits tracked in Figure 8-16 show the third-plus generation as receiving the highest per capita benefits. At young ages, per capita benefit receipt is highest for the second generation (the children of immigrants). A similar conclusion can be drawn from the data on program participation rates. As detailed in Chapter 3, U.S.-born children with two immigrant parents have higher program participation rates than those with one or two native-born parents because they are likely to live in households with lower than average incomes and, since they are U.S. born, they are eligible for various safety net programs. At the oldest ages, the first generation absorbs the most means-tested antipoverty benefits on a per capita basis.11
___________________
11 Of course, the aggregate expenditure amounts are greatest for natives because they are by far the largest group.
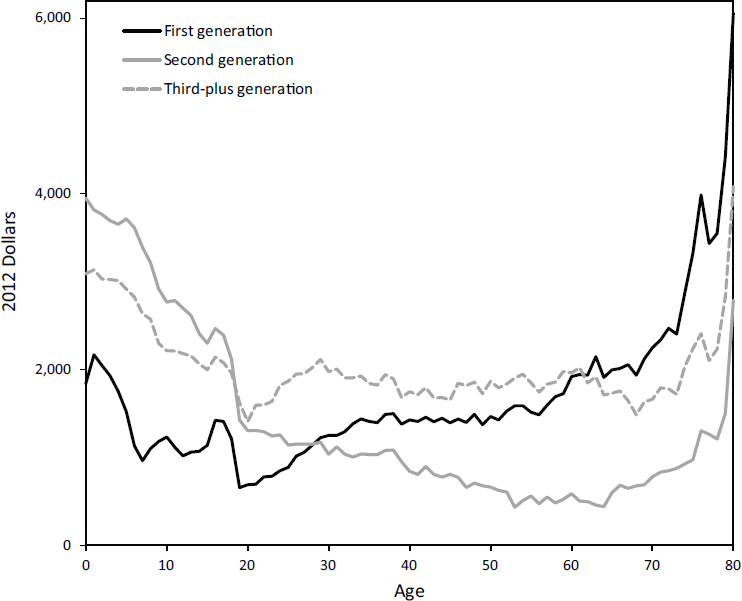
SOURCE: Data are from the 2011-2013 March Current Population Surveys, normalized to program totals.
Medicaid and Supplemental Security Income, which are included here and are typically characterized as means-tested, effectively serve as substitutes for Medicare and Social Security for older immigrants, many of whom do not qualify for those old-age entitlements because of abbreviated domestic work histories. Differences by nativity in usage of means-tested programs at working ages are partially mechanical in nature; recent arrivals do not qualify for many of these programs initially. But program eligibility cannot explain the differences between the second and third-plus generations during working ages, so these differences are likely instead driven primarily by more favorable socioeconomic status among the second generation.
Net fiscal impacts by age and immigrant status are depicted for 1995 and 2012 in Figures 8-17 and 8-18, respectively. These graphs reveal that the second generation has had a more positive net fiscal impact at almost every age than either the first or third-plus generation. Individuals of the
SOURCE: Data are from the 1994-1996 March Current Population Surveys, normalized to program totals.
second generation contribute considerably more in taxes during working ages than either of the other generational groups, although they also absorb slightly more benefits at younger ages. By contrast, at least prior to around age 60, the net fiscal impact of the first generation has been consistently less positive than the other two generational groups.
Although the third-plus generation contributes more in taxes during working ages than does the first generation, and thus its net fiscal impact during working ages is more positive than immigrants, this pattern switches in retirement. In old age, the third-plus generation has consistently been more expensive to government on a per capita basis than either the first or second generation, despite the higher per capita utilization of means-tested benefits in old age by the first generation.
Net fiscal impacts at the state and local level by age and immigrant status (not shown, but based on the data sources cited for the figures)
SOURCE: Data are from the 2011-2013 March Current Population Surveys, normalized to program totals.
broadly conform to these patterns, with larger deficits at younger ages for the first and second generations, followed by larger surpluses at working and older ages. Federal net fiscal impacts (not shown in the figures) are also similar in pattern to those illustrated but, because transfers to the young are primarily channeled through states and localities, the negative net impacts for individuals positioned in the pre-working ages of the life cycle are smaller (in absolute terms).
Annual Fiscal Impacts by Immigrant Status
In this section, the panel considers the fiscal impact of different population subgroups defined by immigrant status. The total net fiscal impact of a subpopulation depends on its age structure, depicted earlier in this chapter, and on the age profile of net fiscal impacts, as presented in the preceding
discussion. Because U.S. subpopulations identified by nativity are so different in size, their aggregate fiscal impacts also vary widely in magnitude, which complicates comparisons. Thus, it is useful to recast the net fiscal impacts of immigrant groups either on an average (per capita) basis, as was done above, or as the ratio of government receipts contributed (taxes paid) to expenditures on benefits received, as was done by Dustmann and Frattini (2014). When this “fiscal ratio” is greater than unity, the group pays more in taxes than it receives in benefits, whereas a fiscal ratio less than unity indicates that the group pays less in taxes than it receives in benefits. However, this approach does not control for a group’s age structure, which we have seen is quite important—this is a topic to which we return later in the chapter when we examine the fiscal impact of the foreign born and native born controlling for their characteristics.
We begin by examining the annual fiscal impacts of all age cohorts of three broadly defined generational groups as identifiable in our pooled March CPS data samples for the 1994-2013 analysis period. Our definitions of first, second, and third-plus generation are unchanged from earlier in the chapter. However, for the analysis here—and in contrast to the analyses up to this point in the chapter—we have created groupings that are partially mixed. The first group consists of first generation immigrants (the foreign-born) ages 18 and older, plus their dependent first and second generation children (see Box 8-2). The second group consists of independent individuals (those ages 18 and older) in the second generation plus their dependents (who typically are third generation by nativity status). The third group consists of independent individuals in the third and higher generations, plus their dependents.12 The rationale, in this exercise, of grouping dependents with their parents is so that the full fiscal impact created by an immigrant or a native born person (which includes their family members, or other dependents) can be estimated for a given year; without the presence of the independent persons to which they are linked, dependents could not factor into the fiscal picture. Later in this chapter, we analyze the impact of these same three generational groups on fiscal impact, adjusting for age, education, and other characteristics; this analytical framework allows for assessment of the net fiscal impacts, at the federal and state levels of government, of these first and second-generation groups separately, in comparison to the third-plus generation group, specified as the reference group.
Associating dependent children with an independent individual responsible for them entails assigning the children to the generational group
___________________
12 For all three groups, dependent children—identified at the individual level in the CPS data—are included in their parents’ generational group. Therefore, some second generation individuals (i.e., dependent children) appear in the first generation group; the same logic applies to the membership of the groups labeled “second generation” and “third-plus generation.”
defined by the nativity status of that individual (typically their parent(s)); this is done for the dependent children of independent individuals in each of the generational groups. Dependent children are assigned to the parental generation if one or more independent parents are present in the household.13 If there are no parents in the household, then the generational group of the oldest co-resident independent relative is assigned. Defining generational groups in this way attributes the costs to governments associated with dependent children—most notably, in terms of magnitude, public expenditures on education—to the generation of a parent or relative responsible for raising the child.14 Of course, dependent children of any population subgroup, foreign-born or native-born, generate a net fiscal cost (they are not yet working and they need to be educated). As expected, and as shown quantitatively below, the fiscal costs associated with dependent children to some extent counterbalance the positive fiscal impact for the first generation (see Figures 8-17 and 8-18) created by the fact that, during the analysis period at hand, this generation was disproportionately of working age and hence paying taxes (refer to Figures 8-1, 8-2, 8-11, and 8-12).
Table 8-1 reports subpopulation size, per capita fiscal impacts, and fiscal ratios for these groups of independent-persons-plus-dependents at different levels of government in 1994 and 2013. The cost of public goods is assigned on an average cost basis as specified in scenario 1 (defined in Box 8-1, above); results for the alternative scenarios are discussed later in the chapter. Recall, that these may be considered relatively conservative estimates because the addition to government costs associated with public goods (like national defense) created by one addition (or a small number of additions) to the population may be close to zero. The calculations reveal that the population group consisting of immigrants (first generation) and their dependent children has a lower fiscal ratio than either of the groups composed of native-born independent individuals and their dependent children. The overall fiscal ratio of the second generation (independents plus their dependents) is more similar to that of the first generation group in 1994 but more similar to that of the third-plus generation group in 2013; we provide an explanation of this observation below. A major source of the overall differential between the first generation group and the two native-born groups originates from the considerably lower fiscal ratio at the state
___________________
13 It is possible for a dependent to be associated with independent persons in different generational groups (e.g., a child of a first generation mother and third-plus generation father). In order to sort the group of children with this ambiguous generational identification, a randomly selected half are assigned to the mother’s generation and the other half to the father’s. This is done instead of splitting the flows of each child to avoid ending up with a group-weighted per capita flow that does not match the total population per capita flow.
14 In those few cases where there was no independent co-resident parent, the associated independent person was usually a grandparent.
| 1st Generation and Their Dependents (population: 29.9 million) | 2nd Generation and Their Dependents (population: 20.8 million) | 3rd Generation and Their Dependents (population: 212.2 million) | |||||||
|---|---|---|---|---|---|---|---|---|---|
| 1994 | Outlays | Receipts | Receipts/Outlays | Outlays | Receipts | Receipts/Outlays | Outlays | Receipts | Receipts/Outlays |
| Federal | 8,408 | 5,769 | 0.686 | 13,853 | 8,022 | 0.579 | 8,996 | 7,734 | 0.860 |
| State and Local | 5,104 | 3,215 | 0.630 | 4,601 | 4,659 | 1.013 | 4,621 | 3,901 | 0.844 |
| Total | 13,511 | 8,985 | 0.665 | 18,454 | 12,681 | 0.687 | 13,617 | 11,635 | 0.854 |
| 1st Generation and Their Dependents (population: 55.5 million) | 2nd Generation and Their Dependents (population: 23.3 million) | 3rd Generation and Their Dependents (population: 237.3 million) | |||||||
| 2013 | Outlays | Receipts | Receipts/Outlays | Outlays | Receipts | Receipts/Outlays | Outlays | Receipts | Receipts/Outlays |
| Federal | 9,767 | 7,117 | 0.729 | 13,093 | 9,495 | 0.725 | 12,050 | 9,473 | 0.786 |
| State and Local | 6,141 | 3,769 | 0.614 | 6,101 | 5,039 | 0.826 | 5,844 | 4,813 | 0.823 |
| Total | 15,908 | 10,887 | 0.684 | 19,194 | 14,534 | 0.757 | 17,894 | 14,286 | 0.798 |
NOTE: “Dependent” and “independent” are defined as in Box 8-2. Outlays include all government spending, including interest payments and public goods, which are allocated equally to all groups on a per capita basis. Population counts are the sum of independents and dependents in each group. Data are from March Current Population Surveys. Estimates are for scenario 1 (see Box 8-1) which assigns the average costs of public goods to new immigrants, as opposed to the marginal cost, and includes interest payments.
and local level of government for the former group whose adult members, during the analysis period, were more likely to be of parenting age and who also experienced higher fertility rates.15 These differentials in state- and local-level fiscal impacts largely reflect differences in the groups’ total cost of educating dependents.16 In the longer term, these dependent children will grow up to be contributing adults and thus these educational expenditures may reasonably be considered an investment in their future productivity.
The first generation group displays a lower fiscal ratio than does the third-plus generation group at the federal level. This fiscal effect, and a portion of the fiscal difference at the state and local level as well, reflects the lower average education levels—and, related to these, the lower wages and employment—of the first generation independent persons compared to the second and third-plus generation independents in the other two groups (see the cross-sectional results presented in the previous section). Interestingly, the fiscal ratios in Table 8-1 at the federal level actually rose for the first and second generation groups between 1994 and 2013, whereas they fell for the third-plus generation group. To some extent, this may reflect new programs and expansion of others (such as EITC) that some native-born individuals are eligible for and some immigrants are not, as well as declining fertility rates among immigrants. But the trend is mainly driven by the aging of the native-born population. In 2013, the third-plus generation (as defined by nativity status) population included a higher proportion of elderly persons than it did in 1994. The second generation population, in contrast, had a relatively much higher concentration of individuals in the fiscally expensive retirement age groups in 1994 than in 2013 (refer back to Figures 8-1 and 8-2). As described in Chapter 2, at the beginning of the 1994-2013 analysis period, a large portion of the second generation consisted of the children of earlier heavy waves of immigrants who arrived around the beginning of the 20th century and were thus an older group. The elderly are, of course, associated with increased federal outlays. By 2013, more of the children of newer waves had reached adulthood and were thus more heavily represented among second-generation independent persons, reducing the average age of this group.
Readers will note that the figures in Table 8-1 translate into quite large fiscal shortfalls overall—the fiscal ratio (Receipts/Outlays columns) falls well below 1.0 for all three groups. For 2013, the 55.5 million first generation independent persons and their dependents, 23.3 million second
___________________
15 We stress again that these are averages; the foreign-born are an extremely heterogeneous group along many of the dimensions being considered here, and consequently they are also heterogeneous in their per capita fiscal ratios.
16 The per-child cost of education in our estimates is the same for all groups. The differences referenced here are due to differences in the average number of dependent children per independent individual in the three groups.
generation independent persons and their dependents, and 237.3 million third-plus generation independent persons and their dependents yield a total fiscal shortfall of $1,243 billion. The total fiscal burden is $279 billion for the first generation group (average outlays of $15,908 minus average receipts of $10,887, multiplied by 55.5 million individuals), $109 billion for the second generation group (average outlays of $19,194 minus average receipts of $14,534, multiplied by 23.3 million individuals), and $856 billion for the third-plus generation group (average outlays of $17,894 minus average receipts of $14,286, multiplied by 237.3 million individuals). Under this scenario, the first generation group accounts for 17.6 percent of the population but 22.4 percent of the total deficit. In contrast, the second generation group accounts for just a slightly higher share of the total deficit (8.7%) than its share in the population (7.4%). The third-plus generation group, with 75 percent of the population, accounts for just 68.9 percent of the deficit. Note that, while the fiscal shortfall for the average person in the first-generation group (i.e., the per capita shortfall) was larger than was the per capita shortfall in either native-born group, the shortfall for the latter two groups would have been larger without the presence of the first generation group. This is because federal expenditures on public goods such as national defense (assigned to immigrants on an average cost basis in scenario 1) would have to be divided among a smaller population of second and third-plus generation individuals.
Cross-checking against alternative sources indicates that, although the overall deficit numbers in Table 8-1 are large, the totals (for all three groups) are consistent with actual deficit figures in the National Income and Product Accounts for the federal and state-and-local level budgets combined: The difference in 2013 between total taxes and contributions for government social programs ($4,332 billion) and total expenditures including all public goods ($5,584 billion) was $1,252 billion. The consolidated deficit for that year was actually smaller by about $400 billion because, on the revenue side, government asset income (which immigrants are assumed to not pay) and current transfer receipts (mainly fines and fees) are not included in the panel’s estimates.
To elaborate on trends in net fiscal impacts since The New Americans (National Research Council, 1997), Figure 8-19 plots the total fiscal ratio of receipts to outlays for the three generation groups, as defined for Table 8-1, across all years since 1994. Crucially, there is no correction made here (or in Table 8-1) for different age distributions across groups and over time. The net impact of each group grows more positive during the boom of the late 1990s before falling and rising during and after the mild recession of 2001, then falling and rising again during and after the financial crisis of 2008
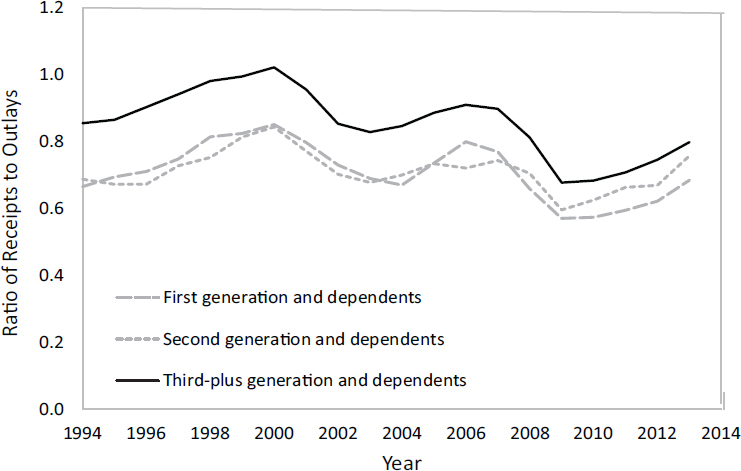
SOURCE: Data are from the 1994-2013 March Current Population Surveys normalized to program totals. Estimation is for scenario 1, which assigns the average costs of public goods including interest payments to both immigrants and the native-born.
which precipitated the Great Recession.17 In addition to this cyclical variation, a noteworthy pattern here is the reduction in the gap between the first and second generation groups, represented by the two dashed lines, and the third-plus generation group, shown by the solid line. As the Table 8-1 data show, the second generation group in particular becomes quite similar by 2014 to the third-plus generation group.
While all part of the same story, the data representations in Figure 8-19 and in Table 8-1 reveal determinants of the fiscal impact of generational groups that are quite distinct from those previously captured in Figures 8-5 through 8-12. The earlier figures show the second generation (including independents and dependents of that generation together) exceeding even the third-plus generation along a number of dimensions, including years of education, per capita wage and salary income, and per capita taxes paid.
___________________
17 The recession of the early 2000s began in March 2001 and ended in November 2001; the Great Recession began in December 2007 and ended in June 2009. These dates are determined by the National Bureau of Economic Research’s Business Cycle Dating Committee at http://www.nber.org/cycles/cyclesmain.html [November 2016].
However, the data in the earlier figures provide estimates of these variables for individuals in each generation group by age, regardless of calendar year. In contrast, Figure 8-19 and Table 8-1 present data in a way that prominently reflects group demographic composition and changes therein over the 1994-2013 analysis period. In Table 8-1 and Figure 8-19, the comparatively low fiscal ratios for the second generation group, relative to the third-plus generation group, in the beginning of the period reflect the former group’s comparatively high concentration in the (fiscally expensive) retirement ages of the distribution at that time. The closing gap in fiscal ratios between the generations shown in Figure 8-19 reflects the more recent profile, which is now younger for the second generation, as well as the relative aging of the third-plus generation into retirement. In other words, the second generation has been gaining something of a demographic advantage from a fiscal perspective as the composition of its adult population has become younger while the third-plus generation has been growing older. The aging of the third-plus generation has also reduced the gap in fiscal ratios between the first and third-plus generation groups. The elderly are associated with increased federal outlays regardless of nativity status. The higher number of dependent children among the first generation, and the associated fiscal costs particularly at the state and local levels, offset this reduction of the fiscal ratio gap between the first generation group and the native–born groups somewhat. This interpretation of the relative fiscal impacts of the first, second, and third-plus generation groups (as defined for Table 8-1) becomes clearer below, where fiscal impacts of these groups are compared while controlling for age and other characteristics. The more favorable fiscal situation of the second generation group compared to the first is germane to a consideration of the impact of immigration since many people think of this group as part of the immigrant stock.
We now turn to the set of alternative scenarios defined in Box 8-1 above (following the approach of Dustmann and Frattini, 2014). Table 8-2 repeats the estimates for 2013 under scenario 1 (from the lower panel of Table 8-1) and then presents the estimates for 2013 under the seven alternative scenarios. For each scenario, the changes from scenario 1 are applied to all members of a defined generational group. For example, in the subset of scenarios developed to assess changes in magnitude when assuming a marginal-cost allocation of public goods (scenarios 5 through 8), instead of the average cost allocation in scenarios 1 through 4, the marginal-cost allocation is applied to all members of the first generation group, including the second-generation dependent children of first generation independents. In these scenarios, the total net fiscal impact of the first generation group becomes much more favorable, as it must mathematically. In each of scenarios 5 through 8, the total fiscal ratio for the first generation group now exceeds that for the second and third-plus generation groups. The main
| 2013 | 1st Generation and Their Dependents (population: 55.5 million) | ||||
|---|---|---|---|---|---|
| Outlays | Receipts | Receipts/Outlays | |||
| Scenario 1 | Immigrants pay average cost of public goods | Federal | 9,767 | 7,117 | 0.729 |
| State and Local | 6,141 | 3,769 | 0.614 | ||
| Total | 15,908 | 10,887 | 0.684 | ||
| Scenario 2 | Scenario 1, but interest costs are excluded | Federal | 8,466 | 7,117 | 0.841 |
| State and Local | 5,517 | 3,769 | 0.683 | ||
| Total | 13,983 | 10,887 | 0.779 | ||
| Scenario 3 | Scenario 1 but immigrants’ sales taxes are 80% | Federal | 9,767 | 7,051 | 0.722 |
| State and Local | 6,141 | 3,475 | 0.566 | ||
| Total | 15,908 | 10,525 | 0.662 | ||
| Scenario 4 | Scenario 1, but new immigrants’ corporate taxes are zero | Federal | 9,767 | 6,937 | 0.710 |
| State and Local | 6,141 | 3,769 | 0.614 | ||
| Total | 15,908 | 10,706 | 0.673 | ||
| Scenario 5 | Immigrants pay marginal cost of public goods | Federal | 6,154 | 7,117 | 1.157 |
| State and Local | 5,515 | 3,769 | 0.683 | ||
| Total | 11,669 | 10,887 | 0.933 | ||
| Scenario 6 | Scenario 5, but interest costs are excluded | Federal | 6,154 | 7,117 | 1.157 |
| State and Local | 5,515 | 3,769 | 0.683 | ||
| Total | 11,669 | 10,887 | 0.933 | ||
| Scenario 7 | Scenario 5, but immigrants’ sales taxes are 80% | Federal | 6,154 | 7,051 | 1.146 |
| State and Local | 5,515 | 3,475 | 0.630 | ||
| Total | 11,669 | 10,525 | 0.902 | ||
| Scenario 8 | Scenario 5, but new immigrants’ corporate taxes are zero | Federal | 6,154 | 6,937 | 1.127 |
| State and Local | 5,515 | 3,769 | 0.683 | ||
| Total | 11,669 | 10,706 | 0.917 | ||
NOTE: See note to Table 8-1. The eight estimation scenarios are described in Box 8-1 and accompanying text.
| 2nd Generation and Their Dependents (population: 23.3 million) | 3rd-plus Generation and Their Dependents (population: 237.3 million) | ||||
|---|---|---|---|---|---|
| Outlays | Receipts | Receipts/Outlays | Outlays | Receipts | Receipts/Outlays |
| 13,093 | 9,495 | 0.725 | 12,050 | 9,473 | 0.786 |
| 6,101 | 5,039 | 0.826 | 5,844 | 4,813 | 0.823 |
| 19,194 | 14,534 | 0.757 | 17,894 | 14,286 | 0.798 |
| 11,792 | 9,495 | 0.805 | 10,749 | 9,473 | 0.881 |
| 5,477 | 5,039 | 0.920 | 5,220 | 4,813 | 0.922 |
| 17,269 | 14,534 | 0.842 | 15,970 | 14,286 | 0.895 |
| 13,093 | 9,507 | 0.726 | 12,050 | 9,486 | 0.787 |
| 6,101 | 5,092 | 0.835 | 5,844 | 4,868 | 0.833 |
| 19,194 | 14,600 | 0.761 | 17,894 | 14,353 | 0.802 |
| 13,093 | 9,536 | 0.728 | 12,050 | 9,513 | 0.790 |
| 6,101 | 5,039 | 0.826 | 5,844 | 4,813 | 0.823 |
| 19,194 | 14,576 | 0.759 | 17,894 | 14,326 | 0.801 |
| 13,734 | 9,495 | 0.691 | 12,691 | 9,473 | 0.746 |
| 6,216 | 5,039 | 0.811 | 5,959 | 4,813 | 0.808 |
| 19,949 | 14,534 | 0.729 | 18,650 | 14,286 | 0.766 |
| 12,208 | 9,495 | 0.778 | 11,165 | 9,473 | 0.848 |
| 5,478 | 5,039 | 0.920 | 5,221 | 4,813 | 0.922 |
| 17,686 | 14,534 | 0.822 | 16,386 | 14,286 | 0.872 |
| 13,734 | 9,507 | 0.692 | 12,691 | 9,486 | 0.747 |
| 6,216 | 5,092 | 0.819 | 5,959 | 4,868 | 0.817 |
| 19,949 | 14,600 | 0.732 | 18,650 | 14,353 | 0.770 |
| 13,734 | 9,536 | 0.694 | 12,691 | 9,513 | 0.750 |
| 6,216 | 5,039 | 0.811 | 5,959 | 4,813 | 0.808 |
| 19,949 | 14,576 | 0.731 | 18,650 | 14,326 | 0.768 |
source of the shift occurs at the federal level, where the cost of public goods such as national defense accrues. However, even the fiscal ratio for the state and local levels rises somewhat for the first generation group, since there are some public costs that accrue to governments at the subnational level.
Looking in greater detail at the results in Table 8-2, one can see that, as alluded to above, the biggest difference across the scenarios is in the way that government spending on public goods like national defense and interest payments is allocated. Government expenditures on public goods are large at the federal level in the United States, with defense outlays totaling $617.1 billion and federal interest payments adding $417.4 billion in 2013. Subsidies and grants accounted for another $125 billion. All together, these categories of federal spending accounted for almost one-third of total federal spending as reflected in the National Income and Product Accounts that year. Therefore, allocating none of the costs associated with these public goods to individuals in the first generation group, as is done under the marginal-cost scenarios, changes the fiscal ratio estimates significantly. Fiscal ratios for the first generation group rise and become considerably closer to one relative to scenarios 1 through 4, in which the average cost of public goods is allocated to the full population, including immigrants and their dependents. Most but not all of the increase in the fiscal ratio for the first generation group is linked to the change in the public goods assumption that results in vastly reduced federal spending on this group—from an estimate of $9,767 per individual in scenario 1 down to $6,154 in scenario 5—a reduction that raises the ratio of receipts to outlays from 0.729 to 1.157. State and local spending on the first generation group also falls modestly for the marginal-cost scenarios, due to a reduction in some interest payments and subsidies treated as public goods, but not by as much as the federal spending declines. In scenario 5, the total fiscal burden for the first generation group drops to $43.4 billion while it rises to $126.2 billion for the second generation group and to $1,035.6 billion for the third-plus generation group. In this scenario, the first generation group accounts for less than 4 percent of the total deficit (while still of course accounting for 17.6 percent of the sample population). As noted, government expenditures on public goods account for almost one-third of total federal spending. Therefore, the average-cost versus marginal-cost assumption—along with other assumptions having to do with how expenditures are allocated—are quantitatively extremely important in driving estimates of the fiscal impact different generational groups.
Thus, while for scenarios 1 through 4 the first generation group displays slightly lower but quite comparable fiscal ratios at the federal level, compared with the third-plus generation group,18 the ordering reverses
___________________
18 Here as elsewhere in the report, “third-plus generation” is a short-hand way of referring to everyone who is neither an immigrant nor a U.S-born child of at least one immigrant parent.
and a wide gulf between the first and third-plus generation groups appears for scenarios 5 through 8. If it is assumed that spending on defense and other pure public goods does not increase with a marginal immigrant and instead these costs are assigned to the native-born only (both second and third-plus generation groups), the first generation group appears in a much more favorable light relative to the scenarios in which its members share in the cost of pure public goods equally. Comparisons between scenarios 1-4 and 5-8 also reveal a small compounding effect associated with the native-born groups (the second and third-plus generation groups). A consequence of the zero marginal-cost allocation assumption is that these two groups appear more costly because they bear an increased burden in public goods costs—costs that in these scenarios are spread across a population that is decreased by the number of foreign-born and their dependent children.
Results also vary somewhat across the other scenarios in Table 8-2, but these differences pale in comparison with the choice between assuming marginal cost versus average cost for public goods. Excluding interest payments—that is, when only the fiscal flows generated by current, but not by past, program usage as reflected in deficits, debt, and interest payments are counted—as is done for scenarios 2 and 6, outlays for all generational groups are naturally reduced and the ratios of receipts to outlays rise.19 The differences between immigrants and the native-born groups remain qualitatively unchanged, but the first generation comes closer to “breaking even”—and actually does so at the federal fiscal level in scenario 6—compared with scenarios 1 and 5.
Scenarios 3, 4, 7, and 8 adjust the first generation’s contributions of tax receipts downward either in terms of their sales and excise taxes (3 and 7) or corporate income taxes (4 and 8). The motivation for these scenarios is the recognition that some immigrants, especially new arrivals, send remittances to their country of origin rather than spending all of their discretionary income in the receiving country and that they may not yet own taxable U.S. capital assets. The scenarios that test these factors (described in Box 8-1 above) reduce tax receipts somewhat but do not drastically alter the picture. These reductions in tax receipts do little to change the relative value of the immigrant and native-born generational groups (as defined for Tables 8-1 and 8-2) in terms of their net fiscal impacts.
___________________
19 This calculation is meant mainly to serve as a sensitivity test and not to be realistic. However, debt was incurred by generations now dead as well, and an additional living person (native-born or immigrant) should not be counted as having contributed to that portion of the debt.
Comparing Immigrants to Natives, Controlling for Characteristics
While informative, the per capita net fiscal impacts and fiscal ratios reported thus far are associated with broad groups of individuals of widely varying age and other characteristics. As the age profiles examined earlier have suggested, the pattern, during this report’s period of analysis, of net fiscal impacts of the first generation group is shaped in large part by their disproportionate presence in the working-age and family-rearing portion of the life cycle. In the aggregate, they have made large positive contributions in the form of tax revenues (although still paying less per capita in taxes than their second and third generation counterparts—refer to Figure 8-11), while also drawing on public expenditures at higher than average rates, mainly due to the presence of more children in their households relative to native-born groups. As today’s immigrants age, as their children continue to move out of parental households, and as they themselves eventually move into retirement, their fiscal profiles will change substantially.
To more fully grasp the fiscal impact of immigrants and to better understand the reasons for the observed differences, it is useful to adjust for characteristics that tend to vary substantially with nativity. Chief among the key factors are age and education, as well as the calendar year—more specifically, the point in the business cycle, which clearly shifts the fiscal contributions of all population groups, as revealed by Figure 8-19 above. In Table 8-3, the panel explores how net fiscal impacts correlate with immigrant-native differences in characteristics in our pooled March CPS samples spanning 1994 to 2013. As in the analysis that produced the Table 8-1 results, the first group consists of first generation (foreign-born) immigrants, plus their dependent children. The second group consists of independent individuals in the second generation and their dependents. In both these groups, as in the analysis for Table 8-1, the potentially productive parents (from a tax contribution perspective) are paired with their children who generate net public costs, predominantly in the form of education. Those in the third-plus generation group include all U.S.-born persons ages 18 and older who do not have a foreign-born parent, plus their dependent children. Unlike the presentation of results in Tables 8-1 and 8-2, in Table 8-3 the estimated fiscal impacts for the third-plus generation group are used as the reference group (or benchmark) for a regression analysis of how the first and second generation groups differ from this benchmark. The unit of analysis in the regression analysis is the independent individual; therefore, unlike in the previous analysis, the total number of observations is less than the population (which also includes dependents). Here, the flow of program outlays and tax receipts for dependents are rolled up into the flows of the independent person to which they are linked in the data. This was an explicit decision for this type of analysis because the goal is to
| Federal | State and Local | Total | |
|---|---|---|---|
| Model 1 − Controls: none; N = 2,537,262 | |||
| 1st generation group | –1309 *** | –1940 *** | –3249 *** |
| 2nd generation group | –4380 *** | 535 *** | –3845 *** |
| 3rd+ gen ref. group | — | — | — |
| R2 | 0.002 | 0.003 | 0.002 |
| Model 2 − Controls: age group, year, sex; N = 2,537,262 | |||
| 1st generation group | –2181 *** | –1748 *** | –3929 *** |
| 2nd generation group | 1927 *** | 738 *** | 2665 *** |
| 3rd+ gen ref. group | — | — | — |
| R2 | 0.223 | 0.040 | 0.152 |
| Model 3 − Controls: age group, year, sex, education; N = 2,537,262 | |||
| 1st generation group | –803 *** | –1303 *** | –2107 *** |
| 2nd generation group | 1109 *** | 554 *** | 1663 *** |
| 3rd+ gen ref. group | — | — | — |
| R2 | 0.296 | 0.062 | 0.220 |
| Model 4 − Controls: age group, year, sex, education, race/ethnicity; N = 2,537,262 | |||
| 1st generation group | 34 | –649 *** | –615 *** |
| 2nd generation group | 1233 *** | 825 *** | 2058 *** |
| 3rd+ gen ref. group | — | — | — |
| R2 | 0.303 | 0.067 | 0.229 |
| Model 5 − Controls: age group, year, sex, education, race/ethnicity, number of dependents; N = 2,537,262 | |||
| 1st generation group | 277 *** | –382 *** | –104 |
| 2nd generation group | 981 *** | 547 *** | 1529 *** |
| 3rd+ gen ref. group | — | — | — |
| R2 | 0.344 | 0.285 | 0.338 |
NOTES: The first, second, and third-plus generation groups (as defined at the beginning of the chapter) consist only of independent individuals. Dependents are not included (hence N is smaller than in the earlier analysis), but their fiscal flows are rolled into those of the independent person(s) to whom they are linked. Each column presents coefficients and significance levels from a separate ordinary least squares regression of net fiscal impact at the given level of government (dependent variable) on indicators for generational group assignment (x variables) and indicators for the other characteristics listed as controls.
The control variables added for each successive model are highlighted in boldface.
Coefficients indicate the marginal per capita effects, in 2012 dollars, that are associated with that generational group relative to the third-plus generation group. A positive coefficient indicates an improvement, or savings to the government level, in net fiscal impact; a negative coefficient indicates a budgetary reduction for that government level. Thus, a coefficient on “First generation group” equal to 100 implies that, compared to an average member of the third-plus generation group, an average member of the first generation group has a net fiscal impact that is $100 more positive for that level of government.
Age groups are measured in 5-year intervals.
Asterisks denote statistical significance at the 1 percent (***), 5 percent (**), or 10 percent (*) levels. Estimation applies to scenario 1, which assigns the average costs of public goods, including interest payments, to each member of the first generation group (as well as to each member of the second and third-plus generation groups).
A note on the R2 values: In an alternative specification in which (1) the fiscal costs and benefits linked to first generation and second generation individuals were grouped independently of age, and (2) dependents were not assigned to a parent’s generational group, the R2 values were quite a bit larger. This change in the strength of correlation occurs because, when the fiscal impacts of dependent children are not included in the generational group of the parent or responsible adult to which the children are assigned, the age variable explains a lot more of the total variation in fiscal impacts compared to the specification used for this table, in which age as a driving factor of fiscal impact is diluted by grouping dependents with the independent individual to which they are assigned.
estimate the impact on the regressions of the independent person’s characteristics—most notably age, education, and number of dependents.
Table 8-3 shows the results of a number of regression analyses designed to understand how differences in characteristics between independent individuals in the first and second generation groups (as defined above) and the third-plus generation reference group contribute to group differences in per capita fiscal impact. In each model, the net fiscal impact in 2012 dollars is regressed on generational group status (i.e., first generation or second generation group, with the third-plus generation group constituting the reference category). Model 1 includes no additional explanatory variables and hence shows unadjusted difference in net fiscal impacts for the first and second generation groups relative to the third-plus generation group. Each subsequent model incorporates an additional control variable or group of control variables. A comparison of the coefficients of each subsequent model with the preceding one illuminates the role of the control variable(s) that have been added in explaining the differences between the first and second generation groups and the third-plus generation group. For this very large pooled sample, the regression coefficients are nearly always statistically significant (the level of statistical significance is shown by the asterisks after a coefficient, as explained in the table note).
Model 1 represents the differences in net fiscal impacts of the first and second generation groups relative to the third-plus generation group when differences in characteristics of the two groups are not taken into account. Hence, it corresponds to what would be obtained if one simply examined the averages for each generational group. Using Model 1, the first generation group’s net fiscal impact is $1,309 less per independent person20 at the federal level and $1,940 less at the state and local level, for a total of $3,249 less in net fiscal impact per person overall. The corresponding figures for the second generation group are $4,380 less per person at the federal level and $535 more per person at the state and local level, totaling $3,845 less overall.
The extremely large deficit for the second generation group at the federal level in Model 1 might seem surprising in light of Figures 8-17 and 8-18, which indicate that second generation individuals generally have a more positive fiscal picture than third-plus generation individuals at most adult ages (and have a similar picture in the remaining ages). Although the comparison in those two figures do not take the fiscal impact of dependents into account, it seems unlikely that their inclusion would shift the picture so drastically. The major factor accounting for the large shift is the differences in the age distribution between second and third-plus generation individuals, as illustrated in Figures 8-1 (for 1994) and 8-2 (for 2012). One can think of the regression sample (spanning 1994-2013) as representing a mixture of the two age distributions for each immigrant generation. When the panel examined the data for this period, we found that, among adults, the second generation was concentrated among both younger individuals, prior to their peak earning years, and (especially) older individuals. The latter are most expensive for the federal government due to their lower taxes paid and higher benefits received, but not very expensive for the states (because they still pay property taxes). This makes the fiscal impact of second generation independent persons at the federal level quite negative relative to the third-plus generation group. Results for Model 2, discussed below, confirm this reasoning.
Model 2 adds basic controls for age, calendar year, and sex. The results control for differences in age profiles for the first generation and second generation groups relative to the third-plus generation group, as well as any differences in sex composition or in the year of the CPS source survey. Under Model 2, a negative coefficient on the generation group indicator means that, adjusted for age, sex of group members, and survey year, the net fiscal impact is more negative for a member of that group than for a
___________________
20 The Ns in Table 8-3 are the numbers of independent individuals present in each generational group; the flows of dependents are rolled into those of the independent individuals in the household to which they are linked.
member of the third-plus generation (reference) group. Of course a positive coefficient indicates the opposite. Comparing the results for Model 2 with those for Model 1 shows that, controlling for age and the other two variables, the fiscal impact of the first generation group remains quite negative relative to the third-plus generation group.
The impact of differences in the age distribution of the first and third-plus generation groups is seen by comparing the coefficients for the first generation group in Model 2 to those obtained in Model 1. The fiscal impact of the first generation group becomes more negative (by $872 per person) at the federal level, while it becomes less negative (by $192 per person) at the state and local level. These results indicate that the age distribution of the first generation group has a (fairly substantial) positive effect on that group’s fiscal contribution relative to the reference group at the federal level (because the first generation group’s contribution becomes more negative when one controls for age) but a (smaller) negative effect on the first generation group’s fiscal contribution at the state and local level. These findings reflect the concentration of first generation immigrants in the working ages, which increases their federal tax contributions, but it also means they have more dependent children, on average, which increases state and local expenditures on education. Taking both the federal and state and local contributions together, controlling for age (as well as sex and year) results in the total fiscal impact of the first generation group becoming more negative (by $680 per person), meaning that the immigrant age distribution has a positive effect on that group’s fiscal contribution overall. This analysis highlights that the first generation group’s concentration in the working ages has a favorable effect on their fiscal impact at the federal level and overall but a (relatively small) negative effect on their fiscal impact at the state level.
In contrast to the findings for the first generation group, the Model 2 results for the second generation show positive net fiscal impacts for this group at both the federal and state and local levels, totaling $2,665 per person. These results indicate that the large negative effect for this group at the federal level in Model 1 were entirely due to the group’s age distribution (concentration at both younger and, especially, older ages), since controlling for age (as well as sex and year) transforms this to a sizable positive effect ($1,927 per person).
Models 3, 4, and 5 sequentially add controls for education, race/ethnicity, and number of dependents, respectively. Again, for brevity, we report regression coefficients only for first and second generation groups; these coefficients can be interpreted as 2012 dollars of net fiscal impact associated with being a member of the first or second generation group, compared to being a member of the third-plus generation group. In Model 3, where educational differences are taken into account, the negative net fiscal
impacts of the first generation become considerably attenuated. Relative to Model 2, the negative impact on federal finances falls by more than half, from −$2,181 to −$803 per person, while the effect on state and local finances falls by about a quarter, from −$1,748 to −$1,303. In Model 4, which controls for differences in racial/ethnic identity, the net fiscal impact of the first generation moves even closer to that of the third-plus generation: essentially on par at the federal level (+$34) and becoming much less negative (just −$615 per person, down from −$2,107) in total. One rationale behind this specification is that, in the United States, race and ethnicity may proxy for differences in treatment and opportunity. Along with age and education, race and ethnicity can affect earnings opportunities and may also be related to labor force participation.
The trend of converging fiscal impacts across immigrant generation groups continues in Model 5. Controlling for number of dependents—where a higher average number of dependents, relative to the third-plus generation, creates more-negative fiscal impacts for immigrants in a raw analysis—lowers the total net fiscal impact for the first generation to a statistically insignificant negative difference (−$104 per person) from the third-plus generation. In short, this comparison of first generation and third-plus generation individuals of similar age and race/ethnicity, with similar education levels and in households with similar numbers of dependents, yields estimated net fiscal impacts that are quite similar.
For the second generation, the net fiscal impacts in Models 3 through 5 continue to be more positive than the third-plus generation reference group across the board, as they were for Model 2. Taking Models 2 through 5 together, the second generation’s positive impact on federal finances is somewhat large, varying between $981 per person in Model 5 and $1,927 per person in Model 2. Impacts on state and local finances are also positive but smaller, ranging from $547 per person in Model 5 to $825 per person in Model 4.
It is perhaps not surprising that controlling for education and race/ethnicity eliminates a significant portion of the immigrant penalty (that is, the negative net fiscal impact relative to the third-plus generation) for the first generation. At working ages, net fiscal impact is likely to rise with human capital and skills relevant for U.S. labor markets. These results also reflect that members of the second generation (like all nativity groups) are costly primarily during their youth (when this analysis links them as dependents with a foreign-born parent). Once they are independent adults, this analysis shows their net fiscal impact to be quite positive, even when they are linked with their own dependents.
When a similar regression analysis is applied to the seven alternative scenarios, one finds that assigning public goods only to the native-born (i.e., the second and third-plus generations) strongly increases the estimated
net fiscal impact of being an immigrant (member of the first generation). Because that scenario assigns the cost of public goods to the second and third-plus generations alike, coefficients on the second generation indicator do not change.
Historical Fiscal Impacts: Summary
While cross-sectional estimates of fiscal impacts are limited in a number of ways, 20 years of CPS data on first and second generation immigrants provide numerous insights about the fiscal impacts of immigrants.
Immigrant and native-born populations have historically been and remain very different in terms of their age structure. For the 1994-2013 analysis period, first generation individuals were heavily concentrated in working ages, reflecting growth in immigration leading up to this period and the typical young age profile of immigrants. During the early years of this period, the second generation had comparatively higher shares of elderly, especially, and also young individuals relative to the first and third-plus generations21 because members of that generation tended to be the children of earlier large waves of immigrants. By 2012, the second generation was mainly concentrated at young ages, including younger adults, reflecting substantial recent growth in the immigrant cohort of working-age adults with children, coupled with mortality of the second generation children of earlier waves of immigrants.
Considering the fiscal contributions of individuals (without including dependent children), cross-sectional data from 1994-2013 reveal that, at any given age, adult members of the second generation typically have had a more positive net fiscal impact for all government levels combined than either first or third-plus generation adults. Reflecting their slightly higher educational achievement, as well as their higher wages and salaries (at a given age), the second generation contributes more in taxes on a per capita basis during working ages than either the first or second generations.
The same cross-sectional data reveal that the net fiscal impact of individuals in the first generation—at least prior to around age 60—has been consistently less positive than the fiscal impact of the second and third-plus generations. Relative to the other two generation groups, the foreign-born contribute less in taxes during working ages, and thus their net positive impact during working ages is lower. However, this pattern switches in retirement, when the third-plus generation has consistently been more expensive to government on a per capita basis than either the first or second
___________________
21 As noted earlier, throughout this report, “third-plus generation” refers to individuals of the third generation and higher—that is, all U.S. residents who are neither immigrants nor children of at least one foreign-born parent.
generation. This change reflects the greater use of Social Security benefits by the third-plus generation.
A different perspective on these same data results from examining the annual per capita fiscal impact for the 1994-2013 analysis period in a way that reflects the age structure of each generational group as it actually existed in each year. For this analysis, the panel defined generational groups such that each group includes the dependent children of independent individuals. For these generational groups, the net fiscal costs of dependent children are included as part of the calculations of outlays, receipts, and net fiscal impacts for the group. For purposes of per capita comparisons, the population of each group is counted as the number of independent individuals of that generation plus the number of their dependent children. Assigning the per capita fiscal cost of public goods such as national defense on an average cost basis, the first generation group (independent individuals plus their dependents), has a lower fiscal ratio (taxes paid divided by expenditures on benefits received) than the second and third-plus generation groups. This outcome, portrayed in Table 8-1 and Figure 8-19, is driven by two factors: (1) The lower average education level of the first generation group translates into lower incomes and, in turn, lower tax payments. (2) Higher per capita costs (notably those for public education of dependent children) are generated by the first generation group at the state and local levels because this group has, on average, more dependent children per adult member. A partially offsetting positive fiscal impact is that, during the analysis period, first generation adults were disproportionately of working ages and paying taxes. The regression results, which adjust for characteristics—most notably age and education—corroborate this interpretation (refer to Table 8-3). Controlling for age, the results indicate that, during the analysis period, the concentration of independent individuals of the first generation group in the working ages created a favorable effect on the group’s fiscal impact at the federal level and overall but a (relatively small) negative effect on its fiscal impact at the state and local level. The regression results further indicate that the more negative fiscal impact of the first generation group (relative to the two native-born groups) overall is accounted for by (1) lower average educational levels for first-generation adults and (2) their larger average number of dependents.
Looking again at every year over the 1994-2013 period of historical analysis, and again assigning the per capita fiscal cost of public goods such as national defense on an average cost basis to all generational groups, the fiscal ratio for the second generation group (including dependent children) is only modestly more positive than the fiscal ratio for the first generation group over the period as a whole, and it is well below that of the third-plus generation group. The fiscal ratio (shown in Table 8-1 and Figure 8-19) is similar to that of the first generation group in 1994, but becomes more like
that of the third-plus generation group by 2013 (although it remains lower). This result may at first blush be somewhat surprising, given the data represented in Figures 8-8 through 8-12, which show that the second generation (as individuals without dependent children) exceeded the third-plus generation along a number of dimensions, including years of education, per capita wage and salary income, and per capita taxes paid. Remember, however, that data underlying those earlier figures were arranged to estimate these variables for individuals in each group at a given age. The comparatively low fiscal ratios for the second generation group relative to the third-plus generation group reflects, in the beginning of the 1994-2013 period, the former group’s comparatively high concentration in the (fiscally expensive) retirement portion of the age distribution. The closing gap in fiscal ratios between the generational groups (shown in Figure 8-19) reflects the more recent age profile, characterized by a younger second generation of independent individuals and an aging of the third-plus generation’s independent individuals to a higher concentration in retirement. The regression analysis in Table 8-3 indicates that the larger negative effect for the second generation group (compared to the third-plus generation group) during the analysis period was due entirely to the two groups’ age distributions.
Because the federal government has typically run budget deficits during the analysis period, the three generational groups mostly have negative net fiscal impacts between 1994 and 2013. However, both federal and total fiscal ratios increased for both the first and second generation groups between 1994 and 2013, while they generally decreased for the third-plus generation group. The net fiscal impact of each generational group grew more positive during the boom of the late 1990s before falling and rising during the 2000s and again during and after the financial crisis of 2008.
Data for the analysis period (shown in Table 8-1) translate into large fiscal shortfalls overall: The total fiscal ratio falls well below 1 for all three generational groups. Cross-checking against alternative sources indicates that, although these numbers are large, they are consistent with deficit figures in the National Income and Product Accounts for the federal and state-and-local budgets combined. For 2013, the data in Table 8-1 show the 55.5 million people in the first generation group (independent individuals and their dependents), 23.3 million people in the second generation group (independent individuals and their dependents), and 237.3 million people in the third-plus generation group (independent individuals and their dependents) as producing a total (federal plus state-and-local) fiscal shortfall of $1,243 billion. The total fiscal burden was $279 billion for the first generation group (average outlays of $15,908 minus average receipts of $10,887, multiplied by 55.5 million individuals), $109 billion for the second generation group (average outlays of $19,194 minus average receipts of $14,534, multiplied by 23.3 million individuals), and $856 billion for the third-plus
generation group (average outlays of $17,894 minus average receipts of $14,286, multiplied by 237.3 million individuals). Under the assumptions of this analysis, the first generation group accounted for 17.6 percent of the population and 22.4 percent of the total deficit. In contrast, the second generation group accounted for a slightly higher share of the total deficit (8.7%) than its share in the population (7.4%). While the fiscal shortfall for the average person in the first generation was larger than it was for the average person in either the second or third-plus generation groups, the shortfall for the latter two groups would have been larger without the addition of the first generation group because federal expenditures on public goods such as national defense (assigned to all members of that group on an average cost basis under scenario 1) would have to be divided among a smaller population. Some argue that this is an important benefit of immigration.
Government expenditures on public goods are large, accounting for almost one third of total federal spending. Therefore, the average versus marginal cost assumption is quantitatively extremely important in driving fiscal impact estimates. When a marginal cost allocation of public goods is assumed, instead of the average cost allocation, the total net fiscal impact of the first generation group becomes much lower than that of the two native-born groups. In this case, the first generation group accounts for less than 4 percent of the total deficit (while still of course accounting for 17.6 percent of the sample population).
Fiscal impacts vary strongly by level of government. States and localities bear the burden of funding educational benefits enjoyed by immigrant and native children. The federal government transfers relatively little to individuals at young and working ages but collects much tax revenue from working-age immigrant and native-born workers. Inequality between levels of government in the fiscal gains or losses associated with immigration appears to have widened since 1994.
8.3 FORECASTS OF LIFETIME NET FISCAL IMPACTS
Introduction
Section 8.2 addressed the question of the fiscal impacts of immigration using current and historical data to describe what has happened in recent decades. One insight from that analysis was that recent fiscal impacts reflect the youthful age structure of immigrants currently and thus may not be indicative of their future fiscal impacts. In this section, the future fiscal impacts of immigrants are explored using a different type of analysis. Among the focal questions are the following: If an immigrant arrives in the United States and pays taxes and receives benefits over his or her lifetime, will that additional immigrant contribute positively to public finances on
net, by paying more in taxes than that individual receives in benefits? Or will this additional immigrant represent a net fiscal cost by absorbing more in benefits than is paid in taxes? What about the children of that immigrant who may create public costs today but who may work and pay taxes in future years? In short, what is the magnitude of the total new net contribution or burden associated with the immigrant’s arrival, including the net contribution or burden of the immigrant’s descendants?
This research question is best examined with a dynamic, forward-looking calculation, as was done in the pioneering work on future fiscal impacts in The New Americans (National Research Council, 1997) almost two decades ago. The calculation assumes the condition and subsequent life experience of an “average” new immigrant, based on the characteristics of recent arrivals to the United States, and follows the immigrant into the future, adding up tax payments and benefit receipts each year from the time of entry, weighted by the probability of the immigrant’s survival and probability of remaining in the country. The model also forecasts the immigrant’s fertility, and the taxes paid and benefits absorbed by children of the immigrant. The fiscal impacts of descendants are also weighted by probabilities of their survival and of remaining in the United States.
Including the impact of an immigrant’s descendants over a significant part of the life cycle is an important feature of the forward-looking calculation presented here, and one that distinguishes it from other types of fiscal impact models. Descendants of immigrants often only enter the debate as children, because this is often where they appear in cross-sectional data providing a point-in-time snapshot; currently the average immigrant household is a net fiscal burden in part because young children of immigrants, like the children of natives, receive public education. Following the descendants of immigrants further into the future, when they become workers and start paying taxes, provides a more complete measure of fiscal impact because it includes not just the cost of their education but also the delayed fiscal benefits of that education: larger tax payments made possible by the investment in human capital that education represents.
As discussed in Chapter 7, forward-looking analyses require assumptions about future developments which are inherently uncertain. The panel has addressed these uncertainties by examining the robustness of results across an array of reasonable alternative scenarios. The CBO and the Social Security Trustees22 routinely conduct analyses of long-term fiscal
___________________
22 Technically, there are three boards of trustees overseeing the Social Security and Medicare programs: the Board of Old Age and Survivors Insurance Trust Fund and the Disability Trust Fund, the Board of the Hospital Insurance Trust Fund (Medicare Part A), and the Board of the Supplemental Medical Insurance Trust Fund (Medicare Part B). Currently the same six trustees serve on all three boards. For further information, see www.ssa.gov/history/reports/trustees/historypt.html [November 2016].
developments that many observers view as meaningful, given that they supply “official” projections, even though they are subject to high levels of uncertainty. Those analyses similarly evaluate robustness by comparing results across a range of scenarios. We adopt a broadly similar research design and array of assumptions about central rates of growth and change in future periods.
Methodology
Broadly speaking, the budget concepts and methodologies adopted here were developed in The New Americans (National Research Council, 1997). Age profiles are estimated for a comprehensive list of government tax and spending programs at federal and at state and local levels. The approach is partial equilibrium in nature, which means that an additional new immigrant is assumed to pay taxes and receive benefits in the same way that an average immigrant with similar characteristics does along whichever temporal baseline is being projected. Any economic or policy responses to the presence of the new immigrant are not taken into consideration. In addition, we do not model macroeconomic responses to debt or tax rates beyond those that are implicit in CBO forecasts, which we describe in detail below. For small changes, these assumptions are likely to be reasonable, but one should not extrapolate these results to forecast the effects of large numbers of new immigrants.
As discussed in the preceding section presenting the historical analysis, a key question is how to account for government spending on public goods. There are several such categories, but by far the largest is federal defense spending which today amounts to around $2,000 per person annually. Pure public goods, by definition, do not trigger additional costs with additional users—at least as long as the number of additional users is small—so the marginal impact should be zero; and it almost certainly would be if one were to take literally the scenario of only one additional immigrant. But it may be incorrect to assume that a large increase in the population, whether obtained through immigration or some other channel, would exert no pressure on the defense budget and similar programs. In order to examine the robustness of our results, we include alternative assignments for federal defense spending and other categories of public goods in a subset of scenarios. As in The New Americans (National Research Council, 1997), we also model several categories of spending as congestible goods—that is, goods subject to congestion with more users, and thus a cost that rises with population increase. Public administration expenses, police and fire-fighting services, and incarceration are all treated as congestible costs. In the forward-looking calculation, we omit interest payments, the vast majority of which are federal interest payments on the
debt. Interest payments are conceptually distinct from spending on public goods; they represent the current costs of servicing past deficits that have accumulated into the current debt.23 New immigrants are responsible only for the net fiscal impacts incurred once they have arrived in the country, which are fully accounted for by their annual tax contributions less their absorption of benefits (which, in some scenarios, includes public goods such as defense).
The panel’s methodology measures the future net fiscal impact of an immigrant and descendants over a 75-year time horizon, with dollar amounts discounted to present values using standard techniques. Because of the length of human life spans, fiscal planning is best informed by projections that cover a long time horizon. For example, the Social Security Trustees annually project program balances over a 75-year horizon, which is long enough for most current workers to age out of the system. Since 2003, the Social Security Trustees have also presented supplemental forecasts of actuarial balance over an infinite future, and The New Americans (National Research Council, 1997) projected net fiscal impacts of immigrants over an infinite horizon. For this report, the panel adopted the 75-year horizon of the Trustees, which also appears in supplemental long-term forecasts prepared by the CBO (Congressional Budget Office, 2014a), which it calls its extended baseline or “projections for the very long term.”
One of the challenges of projecting taxes and spending either in aggregate or associated with an (incremental) immigrant and descendants over such a long time horizon is that the forecasts may or may not imply fiscal sustainability. Assumed fiscal sustainability may specify a national debt that does not grow without limit, interest rates that do not explode in reaction to ballooning debt levels, and gross domestic product (GDP) that continues to grow with population and productivity rather than shrink in response to a debt crisis. The authors of The New Americans (National Research Council, 1997) opted to forecast a future in which the ratio of debt to GDP was stabilized at 80 percent through a balanced mix of tax increases and benefit reductions. In their forecast, the ratio first hits that target level in 2016 (National Research Council, 1997, p. 324).24 For this report, the panel opted instead to generate three forecast scenarios; these are based on:
___________________
23 In other words, it does not make sense to treat interest payments on past debt as a benefit received by a new immigrant. Also, it goes directly counter to the argument that, as far as interest payments are concerned, immigrants are a positive to government budgets as they help spread the cost of debt payments across more individuals.
24 Economists believe the ratio of publicly held debt to GDP is a good measure of fiscal sustainability. To date, the 80 percent threshold has only been crossed by the U.S. government during World War II.
- CBO’s Long-term Budget Outlook that assumes no changes in current legislation—that is, all current laws persist and no new laws are passed to change taxes or spending in the future. Current entitlement programs continue to pay benefits exactly as they do now, and provisions of newer legislation such as the Affordable Care Act grow as currently legislated. Tax breaks enacted after the Great Recession expire as legislated and, as wages rise, more taxpayers end up in higher tax brackets. This scenario does not prevent the federal debt from growing to what many economists believe are levels that would severely impact economic growth and the continuing ability to borrow money. To implement the CBO’s long-term budget projections for this exercise, age profiles of the various taxes and benefit programs are adjusted to match aggregate program amounts as projected by the CBO.
- CBO’s Long-term Budget Outlook with Deficit Reduction that takes the previous scenario as its starting point but, beginning in 2015, narrows the gap between federal spending and revenue using a 50/50 split between tax increases and spending cuts. Adjustments narrow annual deficits to half of their projected levels after 20 years, which is about the time the debt-to-GDP ratio is projected to exceed 90 percent in the CBO current legislation scenario. This represents approximately $3 trillion in projected deficit reduction from 2015 to 2035: raising taxes 3 percent higher than their projected level by 2035 and lowering noninterest spending by 3 percent compared to its projected 2035 level.
- No Budget Adjustments, our “business-as-usual” forecast in which spending and taxes simply increase by the rate of productivity growth, which is set at 1 percent, and stay fixed relative to one another across all age profiles.25 An annual rate of 1 percent was chosen in order to parallel the basic assumptions in other long-run studies (such as those used in budget projections by CBO and in The New Americans). In this scenario, in contrast to the CBO projections, no currently legislated or expected fiscal changes, such as an increase in Social Security retirement ages or a sunsetting of tax cuts, are included. The only change over time is that the current
___________________
25 State and local governments are typically subject to balanced-budget amendments, and we generally adhere to the methodologies described in the 1997 report to forecast these budgets. In the two CBO-based scenarios that we present here, we assume both per capita spending and revenue grow at the same rate as per capita GDP in CBO’s long-term budget outlook. This holds the state-funded portion of Medicaid to a lower growth rate than is assumed for the program as a whole, and it is assumed that the federal government assumes any excess costs. In the third scenario of “business-as-usual” or “no budget adjustments,” we let spending and revenue grow at the central rate of 1 percent.
observed age schedule of tax payments and benefit receipts for each group shifts up at the same rate every year.
Table 8-4 shows the resulting average annual inflation-adjusted growth rates over the projection interval in several categories of per capita flows across these three scenarios. Except for the category of other discretionary spending, growth in per capita expenditures is higher in the two CBO scenarios than in the third scenario. Federal revenue grows at a 2.2 percent rate on average in CBO’s deficit reduction scenario, 0.2 percentage points faster than federal spending.
Under the no budget adjustments scenario (third bullet above), annual growth in per capita expenditure flows is set at 1 percent per year for each age group; any deviation from that in Table 8-4, column 3, is driven by change in the population age structure. For example, even though growth in spending on each age group’s Medicare benefits is set at 1 percent, the overall growth rate is higher (1.7%) because the population is shifting disproportionately into ages that receive the benefit. The CBO projections build in this effect as well, but also reflect that medical costs have been rising at a faster rate than economic growth, a trend that is assumed to continue (in the CBO scenarios). In the CBO-based scenarios, the Student Health Insurance Plan and the Affordable Insurance Exchanges experience
| CBO Long-Term Budget Outlook | CBO with Deficit Reduction | No Budget Adjustments | |
|---|---|---|---|
| Federal Spending (excluding public goods) | 2.1 | 2.0 | 1.5 |
| OASDI | 2.1 | 2.0 | 1.7 |
| Medicare | 2.9 | 2.8 | 1.9 |
| Medicaid, SHIP, Exchanges | 3.0 | 2.9 | 1.4 |
| Other Discretionary | 0.7 | 0.6 | 1.0 |
| Federal Revenue | 2.1 | 2.2 | 1.0 |
| Income Tax | 2.4 | 2.5 | 1.0 |
| FICA | 1.6 | 1.7 | 1.0 |
| Corporate Taxes | 1.8 | 1.9 | 1.0 |
| Other Taxes | 2.5 | 2.6 | 1.2 |
NOTES: CBO = Congressional Budget Office, OASDI = Old-Age, Survivors, and Disability Insurance Program, SHIP = Student Health Insurance Plan, and FICA = Federal Insurance Contributions Act.
additional growth pressure from legislative changes that will continue to go into effect as a result of the Affordable Care Act. On the revenue side, the CBO projections show faster growth than the panel’s No Budget Adjustments scenario mainly due to tax bracket creep: the fact that, in the absence of legislative changes to the tax code, assumed economic growth will place an increasing proportion of the population in higher tax brackets.
The goal of this exercise is to assess the net present value (NPV) to governments of an additional immigrant and that immigrant’s descendants; to do so, a real rate of interest (or discount rate) must be specified in order to value future dollars in terms of current dollars. The Social Security Trustees have assumed rates of 2.4, 2.9, and 3.4 percent for their three alternatives in two consecutive actuarial reports (Board of Trustees, Federal Old-Age and Survivors Insurance and Federal Disability Insurance Trust Funds, 2014, 2015). CBO assumed a 2.5 percent interest rate in its 2014 long-range forecasts and 2.3 percent in its 2015 forecasts (Congressional Budget Office, 2014, 2015).26 The panel chose a relatively conservative real discount rate of 3 percent. A higher value will reduce the impact of future cash flows on the bottom line. Because many fiscal impacts of immigration, such as the education of the children of immigrants, are more negative in the short run than they are in the long run, a rate that is too high would tend to understate the net fiscal benefit or overstate the net fiscal cost of an immigrant.
The Future in Context
As discussed earlier in this chapter, both immigrants and government budgets have changed since the mid-1990s, when a similar exercise was undertaken for The New Americans (National Research Council, 1997). Each of these changes, discussed below, has implications for the estimation of the fiscal impacts of immigrants.
Who Is the New Immigrant?
Each immigrant arrives with a particular set of characteristics that contribute to shaping that person’s experience once he or she arrives in the United States. The panel focuses on the characteristics that are most important in determining the amount of taxes an immigrant pays and the cost of benefits they receive: their education, age at arrival in the country, and time since arrival. Education is correlated with current and future earnings,
___________________
26 On the other hand, reflecting a particular risk profile for investment in the context of the economic impacts of climate change, William Nordhaus’s DICE-2013R model uses discount rates in the 4.25-5 percent range, depending on whether they are being applied to a near-term or long-term scenario (Nordhaus and Sztorc, 2013, p. 38).
and thus tax payments. Earnings also determine eligibility for means-tested benefits and for government benefits that are pegged to past earnings, like Social Security or unemployment benefits. Age determines where a person is in his or her career and where that individual falls on the inverse-U-shaped earnings curve. Time since arrival is important in three ways: Time in the country is one eligibility rule for several important government benefit programs; it correlates with extent of assimilation, which among other things allows immigrants to at least partially close earnings gaps with their native-born counterparts; and, in combination with a fixed current date, it delineates different arrival cohorts with different characteristics that are correlated with tax and benefit flows.
In order to accurately portray how the fiscal impacts of today’s immigrants might have changed since the research for The New Americans (National Research Council, 1997) was done in the 1990s, it is necessary to identify the characteristics of recent arrivals and of the overall population of immigrants in the country. Starting with education, today’s immigrants have more people in the highest educational groups and fewer in the lowest. This trend is revealed in Table 8-5, which shows educational distributions based on five categories of attainment: less than a high school diploma, high school diploma, some college but no degree, bachelor’s degree, and additional years of schooling or degrees beyond a bachelor’s (which includes attainment of advanced degrees). For comparative purposes, distributions for the second and third-plus generations27 are also shown for the current period and for the mid-1990s. Because these generations differ significantly in their age structure, the table shows age-standardized measures of these educational distributions. These figures are obtained by applying age-specific education rates for different groups to a single profile of the population by age—in this case, that of first generation immigrants.
As shown previously, immigrants have had systematically different levels of education depending on their arrival cohort. To explore this, the panel varied the first generation group examined in the top and bottom panels of Table 8-5. The top panel focuses on immigrants who have arrived within the past 5 years, while the bottom panel includes the entire stock of immigrants. Both the top and bottom panels define the second and third-plus generations the same way but, because each panel standardizes to the age structure of its first generation, the educational achievement rates change slightly for both of the native-born generations. Averages for each nativity group within the five tiers of the educational
___________________
27 The generations used for Table 8-5 include all individuals by their nativity status only, whether they are independent or dependent individuals; dependent children of a different nativity status are not included in their parents’ generation.
| First Generation | Second Generation | Third-plus Generation | |||||||
|---|---|---|---|---|---|---|---|---|---|
| 1994-1996 | 2011-2013 | Change | 1994-1996 | 2011-2013 | Change | 1994-1996 | 2011-2013 | Change | |
| First generation includes recent immigrants only: | |||||||||
| <HS | 0.36 | 0.21 | −0.14 | 0.11 | 0.08 | −0.03 | 0.12 | 0.07 | −0.05 |
| HS | 0.21 | 0.23 | 0.02 | 0.28 | 0.24 | −0.04 | 0.35 | 0.29 | −0.06 |
| SomCol | 0.13 | 0.14 | 0.01 | 0.30 | 0.29 | 0.01 | 0.28 | 0.30 | 0.02 |
| BA | 0.19 | 0.25 | 0.06 | 0.21 | 0.25 | 0.05 | 0.18 | 0.23 | 0.05 |
| >BA | 0.11 | 0.16 | 0.05 | 0.10 | 0.14 | 0.04 | 0.07 | 0.10 | 0.04 |
| Total | 1.00 | 1.00 | 1.00 | 1.00 | 1.00 | 1.00 | |||
| Average (numbering education groups 1-5): | |||||||||
| 2.50 | 2.93 | 0.43 | 2.92 | 3.14 | 0.22 | 2.71 | 3.00 | 0.29 | |
| First generation includes all immigrants: | |||||||||
| <HS | 0.38 | 0.26 | −0.12 | 0.13 | 0.08 | −0.05 | 0.16 | 0.08 | −0.07 |
| HS | 0.22 | 0.24 | 0.02 | 0.30 | 0.25 | −0.05 | 0.35 | 0.31 | −0.05 |
| SomCol | 0.11 | 0.14 | 0.02 | 0.27 | 0.28 | 0.00 | 0.26 | 0.29 | 0.03 |
| BA | 0.18 | 0.23 | 0.04 | 0.18 | 0.23 | 0.05 | 0.16 | 0.21 | 0.05 |
| >BA | 0.10 | 0.14 | 0.03 | 0.11 | 0.16 | 0.05 | 0.07 | 0.11 | 0.04 |
| Total | 1.00 | 1.00 | 1.00 | 1.00 | 1.00 | 1.00 | |||
| Average (numbering education groups 1-5): | |||||||||
| 2.41 | 2.74 | 0.33 | 2.83 | 3.13 | 0.30 | 2.64 | 2.95 | 0.31 | |
NOTE: The distributions for the second and third-plus generation groups are standardized on the age distribution of the first generation group. Figures in the bottom rows of each panel show the weighted average of the fraction of individuals at each education level multiplied by the number assigned to the level, from 1 to 5.
SOURCE: All data used in the analysis are from the 1994-1996 and 2011-2013 March Current Population Survey.
distribution are shown along the bottom of each panel. These statistics show that, in both the earlier and current periods, the second generation achieves the highest educational attainment, the third-plus generation is next highest, and the first generation has the lowest educational attainment of the three.
While all nativity groups have improved their educational distributions, the first generation has caught up over time. Recent first generation immigrants, depicted in the first two data columns of the top panel, show the most improvement. Their share in the lowest educational group has shrunk the most (the less than high school, <HS, group decreased by 14 percentage points) and their share in the highest educational group has grown the most (the group with additional years beyond a bachelor’s degree, >BA, increased by 5 percentage points). Among all first generation immigrants, shown in the first two data columns of the lower panel, the trends are similar but, as one might expect, the educational distribution is shifted toward less attainment because earlier immigrants have less education than recent immigrants. In both panels, the first generation has experienced the largest decrease in the lowest education group and the largest overall increase in average education level.
Increasing education levels over time motivated the panel to adopt a methodological change in its approach to longitudinal forecasting compared to previous work. In The New Americans, the analysis used only three education categories: less than high school, high school diploma, and more than a high school diploma. No distinction was drawn between the top three categories in Table 8-5 because there were fewer immigrants in those categories. This may have been a reasonable strategy given the distribution of education among immigrants at the time, but as Table 8-5 reveals, it has become increasingly insufficient for analysis.
Changing educational attainment patterns means that, relative to the 1990s, a greater percentage of recent immigrants are found in higher earning and higher taxpaying groups. Likewise, a smaller percentage are now found in the lower socioeconomic groups that—once citizenship or sufficient time in the country has been established—may qualify for means-tested benefit programs such as the EITC, Medicaid, and Supplemental Security Income (SSI). Table 8-5 also shows that, over this time period, the educational attainment of the second generation did not improve as much as it did for the first generation. But the second generation remains the most educated of these three groups.
Recent immigrants are slightly older on average than were those who arrived during the 1990s, following the global trend of population aging affecting both the United States and almost every sending country in the
world.28 Age is important because, as shown earlier in this chapter, young and old age groups are net recipients of government benefit programs, paid for by those in the working ages who are net taxpayers. Figure 8-18 shows this pattern, in which the first crossover occurs around age 25, when young adults begin working and paying enough taxes to break even; the second crossover occurs around age 65, when most U.S. residents become eligible for Social Security and Medicare. Using these cross-over points as age boundaries, Table 8-6 shows the age distributions for immigrants and natives now and in the mid-1990s. First generation immigrants today are even more heavily concentrated at working ages, as defined by the 25-65 age group, than they were at the time of The New Americans (National Research Council, 1997). This is true regardless of whether one looks at recent immigrants, shown in the leftmost columns, or all first generation immigrants as shown in the middle columns. Although current workers get older and eventually become expensive retirees, one would still expect these developments to be good for government finances in the short term. By contrast, the age structure for natives has not changed much during this period. The Baby Boom generation, located solidly within the working-age group in the early period, has begun to move into retirement and will continue to do so. The bottom line most relevant here is that these shifts in age structure imply that an average new immigrant today is more likely to be of working age than 20 years ago. Thus, our forecast of that average new immigrant’s lifetime net fiscal impact begins at a more advantageous age for government budgets now compared with when the estimates for The New Americans (National Research Council, 1997) were created.
The sections that follow assess the fiscal impacts that are associated with an “average immigrant”—a weighted average of flows based on the distribution of age and education either of recent arrivals or of all current first-generation immigrants, depending on the scenario.
What Does a New Immigrant Currently Pay in Taxes and Receive in Benefits?
In Section 8.2, age profiles of taxes and benefits, based on estimates of program utilization from the March CPS, were presented; essentially the same age profiles are used for the analysis here. However, age profiles across nativity groups are further disaggregated by time in the United States and across the five educational categories described above.29 A key challenge
___________________
28 The older age and higher education of recent immigrants also reflect the decline of Mexican immigration. This is not thought to be a fluke of the recession but reflects long-term changes in Mexico, especially the decline in fertility that once produced surplus workers needing to find work outside their native country.
29 To summarize briefly, these age profiles are schedules of tax and benefit flows per person by age, which are estimated from 3-year pooled CPS samples, smoothed using standard
of this forward-looking exercise involves dealing with incomplete educational histories for the young. For a large share of individuals ages 0-24 years, their schooling has not yet been completed. In these cases, we assign to these individuals’ records the educational group of a parent, which we impute if no parents are co-resident in the household.
We begin by examining age profiles of wage and salary earnings, which are shown in Figure 8-20. For each generation group, there is a clear gradient in earnings according to education, and it is broadly similar within each group. One visible difference is that immigrants of the first generation earn less of a premium for a high school degree compared to the other two groups. The first generation earns less at each level of education except the highest and, even within that group, immigrants at older working ages still suffer an earnings penalty compared to other workers. Relative to the third-plus generation and higher, whose average earnings rise with age until roughly age 60, immigrants with more than a bachelor’s degree exhibit a more steeply rising earnings profile and an inflection point near age 45.
Net fiscal impacts by age across education and nativity are shown in Figure 8-21. Children and young adults under age 25 with incomplete education are coded as having the education level of a parent (or average if there are two). Net fiscal impacts begin negative at young ages for all groups before dropping sharply at the age of public elementary schooling. Trajectories by education crisscross one another after high school, when the net impact of individuals who drop out of or stop at high school rises more than those who continue in school. Fiscal impacts then tend to rise strongly and become positive during working years, increasing until the mid-50s for the second and third-plus generation but plateauing earlier among the first generation. Another aspect here that mirrors patterns in earnings is the compression of the educational gradient within the first generation.
Gradients across educational groups within the third-plus generation
___________________
techniques, and augmented with other data sources where necessary. We estimate age profiles across five groups identified by nativity and time in the United States: foreign-born arriving within the last 0-4 years, foreign-born arriving within the last 5-9 years, foreign-born arriving more than 10 years ago, native-born of foreign-born parents, and native-born of native-born parents. We also measure these age profiles separately across the five education groups as described in the previous section. For each program, we adjust CPS data for under- or over-reporting by scaling each record by a single multiplicative factor for that particular program so that the accumulated aggregate over all records matches program totals from the National Income and Product Accounts (NIPA). In our calculations, 2012 is the first year of the forecast; for The New Americans (National Research Council, 1997) work, it was an average of 1994 and 1995. When the CPS has individual-level indicators of a particular flow, those are used. Where only a household-level flow is available, we make assumptions about the allocation of the household amount to individuals within the household that mirror the methodologies in The New Americans. A full discussion of the panel’s methodologies is in the Annex (Section 8.4) at the end of this chapter.
TABLE 8-6 Age Distribution by Generation, 1994-1996 and 2011-2013
| Recent First Generation | All First Generation | All Native Born | |||||||
|---|---|---|---|---|---|---|---|---|---|
| Age Group | 1994-1996 | 2011-2013 | Change | 1994-1996 | 2011-2013 | Change | 1994-1996 | 011-2013 | Change |
| 0-24 | 0.47 | 0.37 | −0.10 | 0.22 | 0.14 | −0.08 | 0.38 | 0.36 | −0.01 |
| 25-64 | 0.50 | 0.59 | 0.09 | 0.66 | 0.73 | 0.07 | 0.50 | 0.50 | 0.00 |
| 65+ | 0.03 | 0.04 | 0.01 | 0.12 | 0.13 | 0.01 | 0.12 | 0.14 | 0.01 |
| Total | 1.00 | 1.00 | 1.00 | 1.00 | 1.00 | 1.00 | |||
NOTE: “Recent First Generation” means individual arrived in the United States within 0-4 years of the analysis period
SOURCE: All data used in the analysis are from the 1994-1996 and 2011-2013 March Current Population Survey.
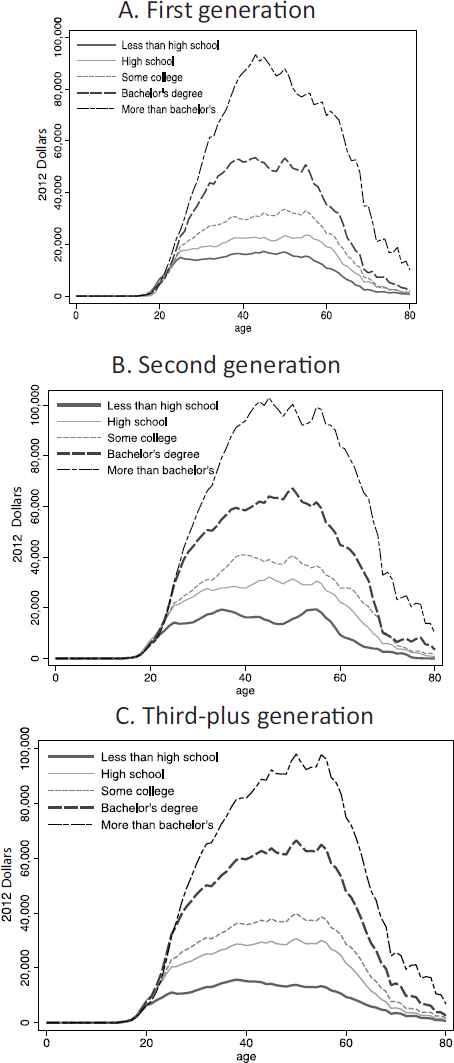
SOURCE: Data from the 2011-2013 March Current Population Surveys.
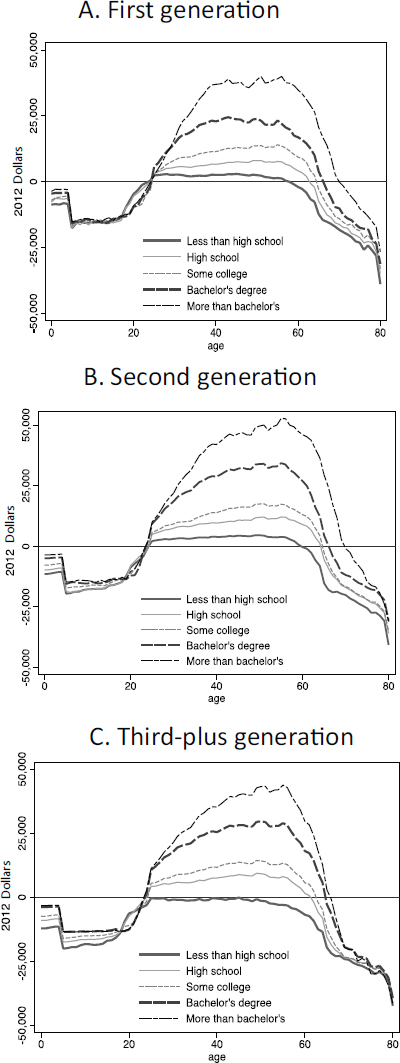
SOURCE: Data are from the 2011-2013 March Current Population Surveys, normalized to administrative control totals.
are arguably most interesting here. The largest differences between groups in terms of absolute dollars is found at working ages, when those with the most education are contributing much more on net than those with the least. Third-plus generation persons without a high school degree never contribute more than they receive, a striking result that is not true for either the first or second generation. Children of the third-plus generation also exhibit a wider educational gradient in their net fiscal impacts than either of the other two groups. The explanation for both of these patterns must be greater usage of fiscal transfer programs by third generation working-age parents, given their education levels compared to immigrants. For the first generation, part of this is purely mechanical; eligibility for some fiscal transfers depends on time spent in the country. But the second generation should have close to the same access as the third-plus generation; but Figure 8-21 shows signs of less program utilization by the second generation.
Figure 8-22 shows how strongly tax contributions rise with educational attainment for immigrants. Each set of 5 vertical bars in the figure shows taxes paid by an educational group relative to those paid by the least educated in each period and at each level of government. So, in 2012 for example, as represented in the far-right bar chart, those with a bachelor’s degree paid on average almost three times as much in total taxes as did those with less than a high school education. Taxes paid by immigrants in the highest education group are considerably higher than those paid by the other education groups, and they appear to be rising faster. This trend is more pronounced at the federal level than at the state and local levels, presumably because the federal income tax is relatively more progressive than most taxes collected at the state level. The trends shown in Figure 8-22 are roughly the same for second and third-plus generation taxpayers.
For benefits, the relative flows are more similar across education groups than they are for taxes where, on average, the high education groups pay much more than the low education groups.30 Regulations requiring documentation of legal status or minimum time in the United States to qualify for some benefit programs have had the expected effect of decreasing immigrants’ participation in those programs. Focusing on those age groups that are net receivers of benefits, Table 8-7 shows that, while benefits have grown in real terms for all nativity groups since the time (circa 1995) of the data used in The New Americans (National Research Council, 1997), benefits have grown more slowly for the first generation than for the other two generational groups. Given these underlying trends in taxes and benefits by nativity since The New Americans, one should expect new immigrants to
___________________
30 For all groups regardless of immigration status, the government has shifted its benefit portfolio away from the poorest of the poor and toward the working poor (Moffitt, 2015).
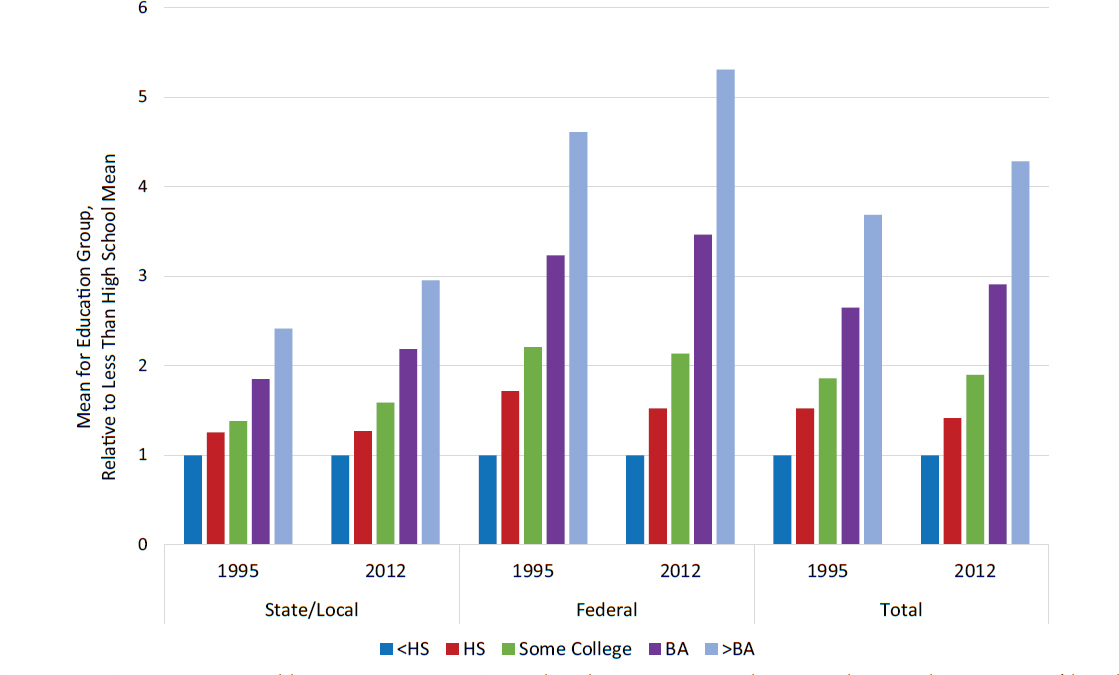
SOURCE: Data are from the 2011-2013 March Current Population Surveys, normalized to administrative control totals.
| State/Local Benefits | Federal Benefits | |||||
|---|---|---|---|---|---|---|
| 1995 | 2010 | % Change | 1995 | 2010 | % Change | |
| Ages 0-24 | ||||||
| 1st Generation | 7.6 | 9.1 | 19 | l.7 | 2.6 | 49 |
| 2nd Generation | 7.3 | 9.5 | 30 | 2.6 | 4.4 | 73 |
| 3rd+ Generation | 7.1 | 8.8 | 23 | 2.5 | 4.3 | 68 |
| Age 65+ | ||||||
| 1st Generation | 3.0 | 3.3 | 10 | 20.9 | 22.5 | 22 |
| 2nd Generation | 3.6 | 4.2 | 16 | 24.3 | 33.5 | 38 |
| 3rd+ Generation | 4.7 | 6.5 | 38 | 25.2 | 32.4 | 28 |
NOTE: Includes all government spending other than defense, interest payments, and subsidies.
SOURCE: Panel generated using Current Population Survey data pools from 2011-2013.
now cost government less, relative to the other generational groups, than they did in the 1990s.
What Will an Additional Immigrant and Descendants Pay in Taxes and Receive in Benefits in the Future?
In order to forecast taxes and benefits for an average immigrant and descendants, it is necessary to first forecast the ultimate educational attainment for young immigrants and the future educational attainment of the offspring of immigrants. The panel predicted the education of offspring as a function of parental education using regression analysis based on CPS samples 15 years apart. The earlier sample gives the education of parents born in particular regions who have children ages 10-16 living in their households. The later sample gives the education of people ages 25-31 whose parents were born in that region. Adult child education is regressed on parental education by birth region, with separate equations for native-born children versus foreign-born children. This generates equations that are used to predict a child’s ultimate educational attainment; a random error term is included in the equations to obtain realistic educational distributions for each generation. Separate regressions are used to estimate the transmission of educational attainment from foreign-born parents to foreign-born children (not shown) and, for comparative purposes, from U.S.-born parents to their U.S.-born children.
Results from this estimation are presented below as transition matrices. Table 8-8 shows the transition for U.S.-born children of an immigrant parent; Table 8-9 shows the transition for U.S.-born children of a U.S.-born parent. Each cell of the matrix shows the chance that the child attains the
| Parent’s Education | Child’s Education | ||||
|---|---|---|---|---|---|
| Less Than High School | High School Graduate | Some College | Bachelor’s Degree | More Than Bachelor’s Degree | |
| 1. Less than high school | 17.1 | 44.1 | 32.4 | 6.2 | 0.3 |
| 2. High school graduate | 4.3 | 27.2 | 46.2 | 20.3 | 2.0 |
| 3. Some college | 0.7 | 11.9 | 40.2 | 38.0 | 9.2 |
| 4. Bachelor’s degree | 0.1 | 2.2 | 21.7 | 46.5 | 29.5 |
| 5. More than bachelor’s degree | 0.0 | 0.6 | 8.8 | 37.7 | 52.9 |
NOTE: Educational distributions are the panel’s predictions using the methodology described in the text introducing the table.
| Parent’s Education | Child’s Education | ||||
|---|---|---|---|---|---|
| Less Than High School | High School Graduate | Some College | Bachelor’s Degree | More Than Bachelor’s Degree | |
| 1. Less than high school | 29.4 | 50.9 | 18.4 | 1.3 | 0.0 |
| 2. High school graduate | 7.6 | 42.2 | 42.2 | 7.8 | 0.2 |
| 3. Some college | 1.0 | 16.9 | 50.1 | 28.8 | 3.2 |
| 4. Bachelor’s degree | 0.0 | 2.3 | 26.0 | 51.8 | 19.9 |
| 5. More than bachelor’s degree | 0.0 | 0.3 | 7.0 | 40.3 | 52.4 |
NOTE: Educational distributions are the panel’s predictions using the methodology described in the text introducing the table.
educational level indicated in the column head, given the parent’s educational attainment shown in the row stub. A strong pattern of upward educational mobility is apparent for the children of immigrants. Numbering the five education categories from 1 to 5, with 1 being the lowest and 5 the highest, the offspring of those with less than a high school education (category 1) would have an average education group of 2.3. Meanwhile, a category 2 parent could expect offspring that average 2.9, a parent of category 3 could expect offspring at 3.4, a category 4 parent could expect 4.0, and a category 5 parent’s offspring average 4.4 (offspring of parents in the highest educational category have nowhere to go but down, of course). These averages are consistent with the phenomenon of reversion
to the mean in correlated measures: Those lowest in the distribution on one measure are more likely to have a large increase on the other measure, while those at the highest end of the distribution are more likely to have a decrease. Still, there is an overall trend toward increasing educational attainment with immigrant generation. To see this, imagine starting with just five parents, each in one of the parental education categories, so that their average group category is 3. If they all had the same fertility pattern, they would have offspring with an average group category of 3.4.
Comparing Tables 8-8 and 8-9 shows that children of U.S.-born parents also have upward educational mobility, but not as much as the children of immigrants. For example, the children of immigrants with less than a high school education have a 17.1 percent chance of achieving only this level (i.e., making no upward transition), while children of third-plus generation parents in category 1 have a 29.4 percent chance of only attaining that same level. Repeating the calculation in which five parents, one from each educational category, have children, the children’s average group category would be only 3.2, in contrast with the 3.4 for the children of immigrants. Note that this calculation abstracts from the education distribution of the parents and only indicates relative upward educational mobility. The fact that immigrants’ children appear to have more upward mobility is perhaps consistent with the narrative of immigrants coming to the United States for the specific purpose of giving their children better opportunities than they had in their home countries. If true, first generation parents may be relatively more focused on educational attainment for their children than native-born parents. This result carries through to the patterns of tax payments by generation: If second generation children go on to achieve higher levels of education, one would also expect that they will be higher earners and thus pay relatively more in taxes than other groups.
Table 8-10 provides a different perspective on how educational transmission plays out in the forecast for a sample of new immigrants ages 20-30 who have been in the United States less than 5 years. Each column shows an educational distribution. The leftmost column is the immigrants’ actual education as observed in the CPS. Immigrants who are observed at ages under 25 are at first assigned their parent’s observed education, as shown in the leftmost column. Their projected ultimate educational attainment after age 25 (second column in Table 8-10) can be higher or lower than this initial assignment. Although some immigrant children of highly educated immigrants may end up with less education, the overwhelming trend here is toward upward mobility (e.g., compare the second column with the first), with the share projected to be in the lowest attainment category falling to half that of their immigrant parents. The third and fourth columns show the predicted ultimate educational distribution of the children and grandchildren of the immigrants whose observed distribution is in the first column. The
| Observed in CPS | Projected Educational Distributions | |||
|---|---|---|---|---|
| Immigrant | Children | Grandchildren | ||
| 1. Less than high school | 0.42 | 0.21 | 0.04 | 0.04 |
| 2. High school graduate | 0.16 | 0.18 | 0.17 | 0.13 |
| 3. Some college | 0.12 | 0.22 | 0.30 | 0.32 |
| 4. Bachelor’s degree | 0.18 | 0.27 | 0.32 | 0.31 |
| 5. More than bachelor’s | 0.11 | 0.12 | 0.17 | 0.20 |
| TOTAL | 1.00 | 1.00 | 1.00 | 1.00 |
| Average category score | 2.40 | 2.90 | 3.40 | 3.50 |
NOTE: The “average category score” is the weighted average of the education categories numbered 1 through 5, using the proportional distribution as weights.
SOURCE: Data represent both analysis of Current Population Survey data and panel’s projections.
third column, compared with the first two, reveals an upward shift between first and second generations that is similar on average (shown in the bottom row) to the half-category jump experienced by the first generation after arrival. Differences between the second and third-plus generation exist but are not as large, which is what one might expect to see in repeated application of transition matrices. The important implication of these patterns for the fiscal analysis that follows is that even an immigrant arriving with little education, whom one would expect to pay relatively less in taxes and cost relatively more in benefits, will likely have offspring with more education. That education will cost the government and taxpayers in the near term, but that investment ultimately pays off in the form of elevated tax contributions by the second and higher generations in the future. However, computations using a positive discount rate reduce the present value of those future payoffs.
How Long Do the New Immigrants Stay, and How Many U.S.-born Children Do They Add to the Population?
The final piece of the longitudinal calculation concerns the demography of the new immigrant and that immigrant’s descendants—specifically, the mortality, fertility, and migration schedules that apply to each individual. We account for the immigrant’s likelihood of survival each year into the future, of remaining in the United States (not emigrating back to the home country or to another country), and of having descendants through fertility. Similar forecasts apply to the immigrant’s descendants whose fiscal impacts
are also appropriately weighted by their probabilities of remaining alive and within the United States. In particular, we assume that any immigrant who leaves the country will take along any children younger than age 20. The mortality, fertility, and emigration probabilities are the same as those used to generate the demographic projections in Chapter 2.
Table 8-11 shows several indicators of vital rates across current first, second, and third-plus generations (labeled “Current”), plus the same indicators as observed in the mid-1990s and used in the 1997 report The New Americans (labeled “Circa 1990s”). Following global trends, the total fertility rate has fallen, as shown in the top left panel of Table 8-11, and fertility has also shifted toward older ages in all generational groups, as shown in the bottom left panel.31 The largest changes were experienced by the first generation and to some extent by the second generation. The middle panels of Table 8-11 show that the immigrant and all-native-born generational groups have also experienced longevity increases since the 1990s. Survivorship is not very different across generations, with a slight advantage for immigrants. The right-hand panels show cumulative emigration probabilities. These have risen since the 1990s time frame used by The New Americans (National Research Council, 1997), but the increases are small. Comparison of the cumulative probabilities of emigration over the two time horizons listed in the table, within 10 years of arrival and within 50 years, reveals that the risk of emigration decreases the longer the immigrant stays in the country. According to current statistics, 24 percent of an immigrant cohort will leave the United States within the first 10 years after arrival, whereas only an additional 7 percent leave between year 10 and year 50, for a cumulative total of 31 percent. These are the figures used in the projections of fiscal impacts for this report.
The Fiscal Impacts of a New Immigrant—Detailed Results
Estimates of the present value of the net fiscal impact associated with a new immigrant vary widely, depending on a number of assumptions. Table 8-12 captures this variation. The age of the immigrant upon arrival varies across the columns within each panel of data; the education level of the immigrant varies down the rows of each panel. The panels in Parts 1 and 2 of Table 8-12 vary assumptions about the addition of descendants and the future fiscal regime. The panels from top to bottom vary the
___________________
31 The fertility indicator in Table 8-11, the Total Fertility Rate, measures “children per woman” implied by age-specific rates of birth in a period. In our fiscal impacts calculation, the panel counted half of the projected offspring of an immigrant as the second generation. Children with two immigrant parents will be fully counted by this technique, while a child of one immigrant parent and one native-born parent will be half-allocated to the immigrant and half to the native-born parent.
TABLE 8-11 Demographic Indicators Used in Fiscal Impact Calculations
| Fertility Indicators by Generation | Mortality Indicators by Generation | Cumulative Probability of Emigration | ||||||
|---|---|---|---|---|---|---|---|---|
| 1st | 2nd | 3rd+ | 1st | 2nd+ | ||||
| Total Fertility Rate | Probability of Survival, Birth to Age 40 | Within 10 Years of Arrival | ||||||
| Circa 1990s | 2.7 | 2.3 | 2.0 | Circa 1990s | 0.96 | 0.96 | Circa 1990s | 0.23 |
| Current | 2.3 | 2.0 | 1.9 | Current | 0.97 | 0.97 | Current | 0.24 |
| Change | –0.4 | –0.4 | –0.1 | Change | 0.01 | 0.01 | Change | 0.01 |
| Average Age of Age-Specific Fertility Schedule | Probability of Survival, Ages 40 to 80 | Within 50 Years of Arrival | ||||||
| Circa 1990s | 26.6 | 26.6 | 26.6 | Circa 1990s | 0.59 | 0.51 | Circa 1990s | 0.29 |
| Current | 30.2 | 29.1 | 29.1 | Current | 0.60 | 0.58 | Current | 0.31 |
| Change | 3.6 | 2.5 | 2.5 | Change | 0.02 | 0.07 | Change | 0.02 |
NOTE: The two generational groups used for the mortality indicators are first-generation immigrants (“1st”) and all native-born (2nd+).
SOURCE: Values in the rows labeled “Current” are the indicator values used in the calculations done for this report based on the 2011-2013 March Current Population Survey; values in the “Circa 1990s” rows are those used in The New Americans (National Research Council, 1997).
| PART 1 CBO Long-term Budget Outlook |
||||||||||||
|---|---|---|---|---|---|---|---|---|---|---|---|---|
| Total Impact | Immigrant | Descendants | ||||||||||
| 0-24 | 25-64 | 65+ | Avg. | 0-24 | 25-64 | 65+ | Avg. | 0-24 | 25-64 | 65+ | Avg. | |
| AVERAGES BASED ON RECENT IMMIGRANTS | ||||||||||||
| No Public Goods Included in Benefits | ||||||||||||
| <HS | 35 | –225 | –257 | –117 | 23 | –198 | –257 | –109 | 11 | –26 | 0 | –8 |
| HS | 239 | –42 | –164 | 49 | 140 | –50 | –164 | 11 | 98 | 8 | 0 | 39 |
| SomCol | 401 | 157 | –155 | 261 | 236 | 99 | –155 | 155 | 165 | 58 | 0 | 106 |
| BA | 495 | 504 | –160 | 481 | 301 | 366 | –160 | 330 | 194 | 138 | 0 | 150 |
| >BA | 446 | 994 | –100 | 812 | 287 | 805 | –100 | 635 | 159 | 190 | 0 | 177 |
| Avg. | 291 | 269 | –201 | 259 | 177 | 196 | –201 | 173 | 114 | 73 | 0 | 85 |
| Benefits Include Defense, Subsidies, and Rest-of-World Payments | ||||||||||||
| <HS | –77 | –294 | –279 | –200 | –32 | –246 | –279 | –158 | –45 | –47 | 0 | –43 |
| HS | 127 | –112 | –187 | –33 | 85 | –99 | –187 | –39 | 42 | –14 | 0 | 6 |
| SomCol | 288 | 82 | –178 | 170 | 180 | 49 | –178 | 104 | 107 | 33 | 0 | 67 |
| BA | 385 | 426 | –186 | 395 | 245 | 316 | –186 | 279 | 140 | 110 | 0 | 116 |
| >BA | 339 | 915 | –123 | 726 | 231 | 754 | –123 | 583 | 108 | 161 | 0 | 142 |
| Avg. | 180 | 195 | –224 | 173 | 121 | 147 | –224 | 123 | 59 | 48 | 0 | 50 |
| AVERAGES BASED ON ALL IMMIGRANTS | ||||||||||||
| No Public Goods Included in Benefits | ||||||||||||
| <HS | 49 | –239 | –253 | –196 | 32 | –221 | –253 | –186 | 17 | –18 | 0 | –10 |
| HS | 271 | –82 | –155 | –47 | 157 | –88 | –155 | –65 | 114 | 6 | 0 | 19 |
| SomCol | 425 | 63 | –144 | 99 | 249 | 28 | –144 | 45 | 176 | 35 | 0 | 54 |
| BA | 540 | 290 | –157 | 280 | 324 | 218 | –157 | 195 | 216 | 72 | 0 | 85 |
| >BA | 515 | 648 | –99 | 547 | 321 | 556 | –99 | 452 | 194 | 91 | 0 | 95 |
| Avg. | 301 | 53 | –183 | 58 | 181 | 27 | –183 | 22 | 121 | 26 | 0 | 37 |
| Benefits Include Defense, Subsidies, and Rest-of-World Payments | ||||||||||||
| <HS | –65 | –299 | –274 | –259 | –23 | –266 | –274 | –230 | –42 | –33 | 0 | –29 |
| HS | 156 | –143 | –177 | –109 | 102 | –133 | –177 | –109 | 55 | –9 | 0 | 0 |
| SomCol | 310 | 2 | –166 | 34 | 194 | –18 | –166 | 0 | 117 | 20 | 0 | 33 |
| BA | 427 | 230 | –180 | 216 | 268 | 172 | –180 | 150 | 159 | 57 | 0 | 66 |
| >BA | 404 | 588 | –122 | 485 | 265 | 510 | –122 | 407 | 139 | 78 | 0 | 77 |
| Avg. | 188 | –8 | –205 | –5 | 125 | –19 | –205 | –22 | 63 | 12 | 0 | 18 |
| PART 2 No Budget Adjustments |
||||||||||||
| Total Impact | Immigrant | Descendants | ||||||||||
| 0-24 | 25-64 | 65+ | Avg. | 0-24 | 25-64 | 65+ | Avg. | 0-24 | 25-64 | 65+ | Avg. | |
| AVERAGES BASED ON RECENT IMMIGRANTS | ||||||||||||
| No Public Goods Included in Benefits | ||||||||||||
| <HS | –118 | –231 | –254 | –185 | –18 | –176 | –254 | –115 | –100 | –55 | 0 | –70 |
| HS | 13 | –105 | –170 | –67 | 61 | –70 | –170 | –29 | –48 | –36 | 0 | –39 |
| SomCol | 117 | 35 | –163 | 67 | 127 | 47 | –163 | 78 | –11 | –12 | 0 | –11 |
| BA | 172 | 283 | –177 | 235 | 160 | 251 | –177 | 210 | 12 | 32 | 0 | 25 |
| >BA | 140 | 627 | –120 | 469 | 143 | 565 | –120 | 427 | –2 | 63 | 0 | 42 |
| Avg. | 45 | 116 | –206 | 77 | 82 | 118 | –206 | 92 | –37 | –2 | 0 | –15 |
| Benefits Include Defense, Subsidies, and Rest-of-World Payments | ||||||||||||
| <HS | –266 | –322 | –282 | –295 | –90 | –239 | –282 | –179 | –176 | –84 | 0 | –116 |
| HS | –136 | –198 | –197 | –176 | –12 | –132 | –197 | –94 | –123 | –65 | 0 | –83 |
| SomCol | –33 | –63 | –192 | –53 | 55 | –17 | –192 | 12 | –88 | –46 | 0 | –64 |
| BA | 26 | 181 | –206 | 122 | 87 | 186 | –206 | 144 | –61 | –5 | 0 | –22 |
| >BA | –2 | 523 | –149 | 355 | 69 | 499 | –149 | 359 | –70 | 24 | 0 | –4 |
| Avg. | –103 | 19 | –234 | –36 | 9 | 54 | –234 | 26 | –112 | –35 | 0 | –62 |
| AVERAGES BASED ON ALL IMMIGRANTS | ||||||||||||
| No Public Goods Included in Benefits | ||||||||||||
| <HS | –107 | –237 | –250 | –219 | –6 | –199 | –250 | –177 | –101 | –38 | 0 | –42 |
| HS | 36 | –129 | –160 | –112 | 80 | –105 | –160 | –88 | –44 | –24 | 0 | –23 |
| SomCol | 135 | –21 | –151 | –10 | 142 | –15 | –151 | –4 | –7 | –7 | 0 | –6 |
| BA | 204 | 147 | –174 | 123 | 184 | 130 | –174 | 107 | 20 | 17 | 0 | 16 |
| >BA | 187 | 405 | –119 | 318 | 176 | 374 | –119 | 293 | 11 | 30 | 0 | 24 |
| Avg. | 54 | –28 | –189 | –36 | 93 | –16 | –189 | –23 | –38 | –11 | 0 | –14 |
| Benefits Include Defense, Subsidies, and Rest-of-World Payments | ||||||||||||
| <HS | –258 | –316 | –276 | –301 | –78 | –259 | –276 | –233 | –180 | –58 | 0 | –68 |
| HS | –116 | –208 | –187 | –193 | 8 | –164 | –187 | –145 | –124 | –44 | 0 | –48 |
| SomCol | –17 | –101 | –179 | –96 | 70 | –74 | –1798 | –62 | –87 | –27 | 0 | –34 |
| BA | 55 | 68 | –202 | 39 | 112 | 71 | –202 | 49 | –57 | –3 | 0 | –10 |
| >BA | 40 | 326 | –147 | 236 | 103 | 314 | –147 | 235 | –63 | 12 | 0 | 1 |
| Avg. | –96 | –107 | –216 | –119 | 20 | –79 | –216 | –80 | –117 | –31 | 0 | –39 |
NOTE: The “total’ figures equal the fiscal impact of the individual, starting at age 25, plus the fiscal impacts of that individual’s descendants. See accompanying text for a discussion of the difference between scenarios without and with public goods included. The discount rate used for the net present value calculations is 3 percent.
SOURCE: Values are panel generated, using the same 2011-2013 Current Population Survey data pools used for the earlier projections.
breadth of spending programs assumed to be affected by an additional immigrant, either with or without spending on public goods, and the pool of immigrants on which the analysis computes characteristics of an average immigrant. The first set of data panels in Parts 1 and 2 use the pool of recent immigrants who have arrived within the past 5 years; the second set use the pool of all first generation immigrants.
Each cell in the table is the amount, in thousands of inflation-adjusted 2012 dollars, of the net fiscal impact associated with an immigrant’s arrival today under the assumptions of that data-panel’s scenario. For example, the highlighted statistic of “259” in the first set of data panels of the table means that, under the CBO Long-term Budget Outlook scenario, the total fiscal impact of a new immigrant who most resembles recent immigrants in terms of average age and education creates a positive fiscal balance flow to all levels of government with an NPV of $259,000. The cells four and eight columns to the right of this cell shows that, under these same assumptions, the projection attributes $173,000 of this total impact to the immigrant as an individual and $85,000 to that immigrant’s descendants.32
These are large numbers, and a comparison with the corresponding statistics that appear directly to the right of this first data panel, under the no-budget-adjustments scenario, reveals that a large part of these average fiscal impact amounts is accounted for by the assumptions made by CBO in their future fiscal scenarios. Table 8-4, presented above, indicated significant differences in the growth of benefits programs across fiscal scenarios. Application of the CBO assumptions increases estimates of an immigrant’s net present value of fiscal impacts to levels that may at first glance seem unreasonably high. Because the present value of labor earnings for an average immigrant under these assumptions is in the neighborhood of a million dollars,33 tax rates would have to be very high or benefit rates very low to produce a present value of net fiscal impact associated with that immigrant that is roughly 17.3 percent of lifetime earnings.34 However, it is important to remember the timing of life-cycle fiscal flows. Working-age people pay more in taxes than they consume in benefits and, in old age, they consume more in benefits than they pay in taxes. The large expenditures
___________________
32 We have rounded the statistics in Table 8-12 to the nearest thousand dollars to enhance readability, so the total for immigrant as an individual plus that immigrant’s descendants may not exactly match the total impact statistic.
33 The present value of a stream of annual earnings that starts at $35,000 and grows at a real rate of 1 percent over 35 years of working from age 30 to 65 is equal to $907,195 when the real discount rate is 3 percent.
34 During the historical period of CPS data used by the panel in Section 8.2, covering 1994 to 2013, taxes as a share of GDP hovered around 27 percent, or 18 percent at the federal level and 9 percent at the state and local level. Spending was 30 percent, split between 20 percent at the federal level (of which 4% was defense) and 10 percent at the state level.
on retirement benefits are, on average, more heavily discounted relative to tax dollars contributed during the working years. With a discount rate of 3 percent and a 35-year difference between the age at which individuals become a net fiscal positive (taxes paid are greater than benefits received) and the age at which they again become net fiscal negatives (vice versa), the net benefits are discounted to about a third of what they would be using the discount applied to the net fiscal positive years. Additionally, assuming productivity growth of 1 percent, the effective discount rate becomes 2 percent and the adjustment is less extreme.
By comparison, under the No Budget Adjustments scenario, smaller net fiscal impact estimates are produced, reflecting an assumed growth in the size of government that is more in line with historical precedent. For immigrants and descendants combined, the highlighted statistic in the first set of data panels in this scenario is $77,000. It is noteworthy that under this scenario, the immigrant’s own contribution to this number is a surplus of $92,000, shown four columns further to the right, while the fiscal impact of that average immigrant’s descendants, is a deficit of −$15,000. These projections contrast with those presented in The New Americans, in which the descendants of immigrants had net positive impacts in part because of the assumption about imposed fiscal sustainability. Under the CBO Long-term Budget Outlook scenarios in Table 8-12—in which some categories of spending are projected to grow less rapidly and some taxes grow more rapidly (for a likely net effect of reduced levels of debt compared to the No Budget Adjustments scenario)—the descendants of immigrants almost universally have positive fiscal impacts on the bottom line.
Table 8-12 also reveals that, if the arrival of a new immigrant raises spending on public goods by its per capita level, the immigrant’s net fiscal impact becomes less positive and may become negative. This is shown in the second panel in Parts 1 and 2, where it is assumed that an immigrant’s arrival raises spending on public goods such as defense (and therefore the calculation includes the average cost of public goods as part of the immigrant’s fiscal costs). The highlighted average fiscal impact on the left-hand side of this panel is $173,000, down from $259,000 in Part 1 in which an additional immigrant does not raise spending on public goods. In Part 2, the average fiscal impact has fallen from $77,000 to −$36,000. The third and fourth data panels in Table 8-12 recalculate these statistics using all first generation immigrants as the basis for computing the effect of a new immigrant. This assumption pushes all the fiscal impacts more negative because the more heterogeneous group of all living first generation immigrants has less education and is older than the group of recent arrivals. The average fiscal impact (the four highlighted data cells) across these four scenarios range from $58,000 to −$119,000. The stock of all first generation immigrants reflects the characteristics of both recent and further-past arrivals, and (as
discussed in Chapter 3) these characteristics have been changing over time. It is perhaps surprising that some of the numbers in these panels remain positive after weighting the calculations to include the characteristics of those earlier arrivals.
Within each of the data panels, Table 8-12 also contains detailed information about how net fiscal impacts vary by an immigrant’s age at arrival and level of education. As one might expect, the net fiscal impact is less positive (or more negative) when the immigrant arrives during youth or at retirement ages and becomes more positive with higher educational attainment.35 Note that there are no descendants for those arriving at age 65+ because fertility rates are zero after age 50 in the demographic projections. Those arriving at older ages may have brought children with them, but those children would be immigrants themselves and are counted as new arrivals in their own right.
Broader Patterns across Major Scenarios
Given the considerable stability in gradients by age and education, it is possible to focus on net fiscal impacts at the average age and education level in order to sharpen conclusions about robustness across scenarios.36 These category averages appear as shaded and boxed areas in Table 8-12, and Figure 8-23. Figure 8-23 also shows results for the second CBO scenario, in which there is planned deficit reduction over time achieved by explicitly raising taxes and cutting benefits.
The black bars in Figure 8-23 show net fiscal impacts when spending on public goods is assumed to not increase in response to an immigrant’s arrival. As discussed earlier, this scenario is arguably most reasonable when considering the marginal impact of one additional immigrant’s arrival and is less reasonable when considering the arrival of many new immigrants. The gray bars show results for when spending on public goods is assumed to rise with an additional immigrant, calculated by assigning the per capita amount spent on residents to immigrants as well. Bar pairs are shown for each of the three budget scenarios: black for the scenario without assign-
___________________
35 The one exception to this relationship is when the BA category is compared with the >BA category for immigrants arriving at ages 0-24. For these immigrants, initial education is that of their parents. Because of reversion to the mean, having parents in the highest education category means that there is a substantial chance that the children will, on average, end up with less education than their parents.
36 For both age and education, the averages are weighted averages of the 75-year present values for each of 81 age groups (ages 0-80+) by five education categories, with the weights derived from either the age-by-education distribution of recent immigrants in 2011-2013 or the age of all immigrants alive, as indicated by the data panel headings in Table 8-12 and the New Arrival versus All Immigrants bars in Figure 8-23.
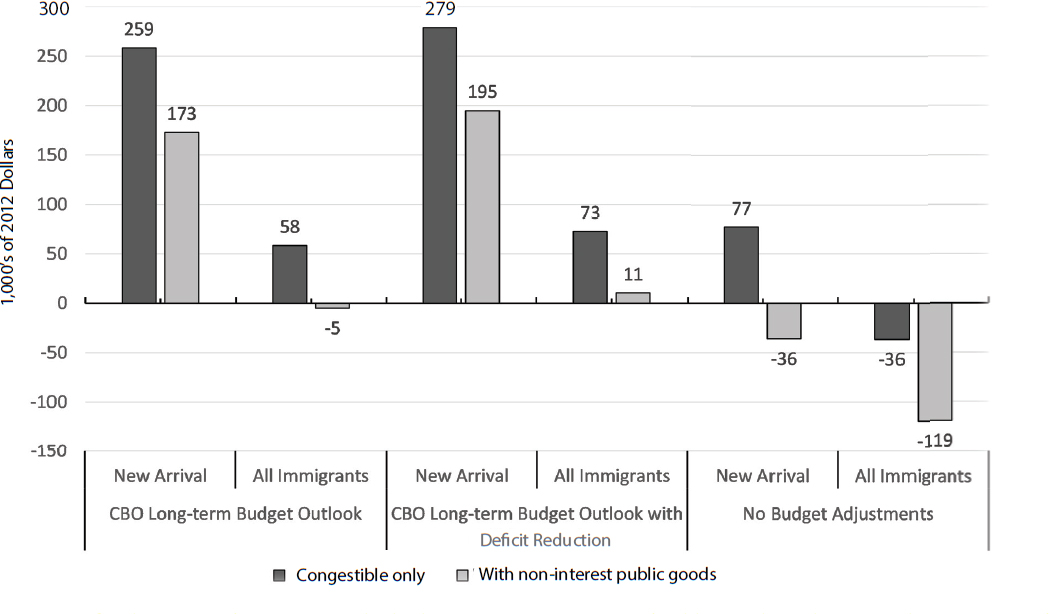
ing public goods (“congestible only”) and gray for the scenario with cost of public goods assigned to immigrants. The pairs are grouped by the two measures of an average immigrant’s characteristics: first by whether just recent arrivals are pooled or all first-generation immigrants currently alive are included, then by the three budget outlook scenarios.
Figure 8-23 indicates that estimates of an immigrant’s net fiscal impact vary fairly widely across scenarios—from +$279,000 to −$119,000. The average of the 12 estimates in Figure 8-23 is $77,000, and the standard deviation is $125,000.37 Shifting the pool from which one calculates characteristics of an average immigrant has a relatively large impact on the final estimate. Assuming that a new immigrant resembles recent immigrants yields a more positive net fiscal impact than does assuming the new immigrant is drawn from the entire stock of first generation immigrants currently in the country.
The choice of budget or fiscal adjustment scenario is also important. Under the CBO-based scenarios, the net fiscal impacts are higher (more positive) than under the scenario with no budget adjustment because spending grows less rapidly than taxes in the former than in the latter. Note that all three of these scenarios assume unsustainable increases in deficits and debt over time, although the No Budget Adjustments scenario reaches unrealistic levels of debt much faster than the CBO scenarios. The CBO “extended baseline” model—which is the basis for the first (Long-term Budget Outlook) scenario in Figure 8-23, and in which interactions between fiscal flows and projected economic growth are estimated—shows the federal-debt-to-GDP ratio reaching 100 percent by 2036 and 219 percent by the end of the 75-year projection window. The ratios are much larger for the No Budget Adjustments scenario, and a little bit smaller for the CBO scenario with deficit reduction.
The Fiscal Impact of Immigrants Relative to Natives
Thus far in Section 8.3, we have focused on whether an additional immigrant will benefit or be a drain on public finances. The results of the panel’s projections show that the age and education characteristics of entering immigrants have a major influence on the answer to this question. This leads naturally to another question: if new immigrants have the same age and education as native-born persons, will their fiscal impacts be the same? This question is of interest for assessing whether it is immigrant status that is relevant for understanding fiscal impacts or whether it is just a matter of adding an additional person to the economy. In other words, is it simply
___________________
37 The standard error of the mean is the sample standard deviation divided by the square root of N, here equal to $36,000.
age and education that distinguishes immigrants from natives as far as fiscal impacts are concerned, or are there other differences? Certainly there are statutory differences, in that many benefit programs prohibit paying benefits to immigrants at all or before some waiting period, but there is no similar prohibition on collecting taxes from immigrants. This would suggest that an immigrant would be less costly than a native with exactly the same age and education characteristics at a particular point in time. However, there may be other differences beyond just age and education. Similar immigrant and native levels of educational attainment might be associated with different earnings and thus taxes paid; for example, otherwise comparable groups might have different levels of language proficiency that would impact earnings, or there may be other unobservable differences. Adding a future-looking perspective, there are additional demographic differences between immigrants and natives that will be reflected in the fiscal calculation: they have somewhat different levels of fertility and mortality, and immigrants may emigrate out of the population, which is far less likely for natives. Thus, it becomes an empirical question whether there are consistent differences in the net fiscal impact of immigrants and natives of the same age and education.
The panel explored this question. Results are summarized in Table 8-13, which shows the projected total net fiscal impacts for an immigrant entering the country at age 25, versus a native-born person observed from the time he or she reaches age 25. Note that this calculation is not affected by the past of these hypothetical 25-year-olds: The fact that the U.S. government did not have to pay for the immigrant’s education is not included; nor is the fact that the native-born 25-year-old had native-born taxpaying parents who helped finance his or her education. These past issues are set aside to follow only the immigrant’s and the native’s impact on government budgets from their 25th year on. The calculation is broken out to show the fiscal impact component attributed to the 25-year-old as an individual and the component attributed to that individual’s descendants. As in Table 8-12, net fiscal impacts for the immigrant and the native-born individual are shown for each educational attainment category under two budget scenarios (CBO Long-term Budget Outlook and the No Budget Adjustments scenario). Here, pure public goods are omitted for everyone, natives and immigrants (top panel) or assigned equally to everyone (bottom panel). Differences in the fiscal impacts of the immigrant and the native-born are shown in shaded bars, positive numbers indicating cases in which that the immigrant is better for fiscal balances and negative numbers indicating cases in which the native is better.
To understand the patterns, first look at the columns labeled “Individual,” which show the fiscal impact for the immigrant or native as an individual (excluding fiscal impact of descendants) for the scenario in which
| CBO Long-term Budget Outlook | No Budget Adjustments | ||||||
|---|---|---|---|---|---|---|---|
| Total | Individual | Descendants | Total | Individual | Descendants | ||
| No Public Goods Included in Benefits | |||||||
| <HS | Immigrant | –186 | –109 | –77 | –246 | –87 | –159 |
| Native | –388 | –251 | –137 | –427 | –234 | –193 | |
| Imm–Nat | 202 | 142 | 60 | 181 | 147 | 34 | |
| HS | Immigrant | 72 | 49 | 23 | –79 | 21 | –100 |
| Native | 14 | 61 | –47 | –139 | –7 | –132 | |
| Imm–Nat | 58 | –12 | 70 | 60 | 28 | 32 | |
| SomCol | Immigrant | 347 | 205 | 142 | 109 | 136 | –27 |
| Native | 262 | 208 | 54 | 26 | 97 | –71 | |
| Imm–Nat | 85 | –3 | 88 | 83 | 39 | 44 | |
| BA | Immigrant | 821 | 514 | 307 | 433 | 361 | 72 |
| Native | 895 | 684 | 211 | 473 | 446 | 27 | |
| Imm–Nat | –74 | –170 | 96 | –40 | –85 | 45 | |
| >BA | Immigrant | 1,362 | 972 | 390 | 795 | 670 | 125 |
| Native | 1,344 | 1,020 | 324 | 766 | 674 | 92 | |
| Imm-–Nat | 18 | –48 | 66 | 29 | –4 | 33 | |
| Benefits Include Defense, Subsidies, and Rest-of-World Payments | |||||||
| <HS | Immigrant | –302 | –164 | –138 | –398 | –158 | –240 |
| Native | –503 | –313 | –190 | –580 | –315 | –265 | |
| Imm–Nat | 201 | 149 | 52 | 182 | 157 | 25 | |
| HS | Immigrant | –44 | –6 | –38 | –231 | –50 | –181 |
| Native | –191 | –1 | –100 | –292 | –88 | –204 | |
| Imm–Nat | 57 | –5 | 62 | 61 | 38 | 23 | |
| SomCol | Immigrant | 231 | 150 | 81 | –43 | 65 | –108 |
| Native | 147 | 146 | 1 | –127 | 16 | –143 | |
| Imm–Nat | 84 | 4 | 80 | 84 | 49 | 35 | |
| BA | Immigrant | 705 | 459 | 246 | 281 | 290 | –9 |
| Native | 780 | 622 | 158 | 320 | 365 | –45 | |
| Imm–Nat | –75 | –163 | 88 | –39 | –75 | 36 | |
| >BA | Immigrant | 1,246 | 917 | 329 | 643 | 599 | 44 |
| Native | 1,229 | 958 | 271 | 613 | 593 | 20 | |
| Imm–Nat | 17 | –41 | 58 | 30 | 6 | 24 | |
| CBO Long-term Budget Outlook | No Budget Adjustments | ||||||
|---|---|---|---|---|---|---|---|
| Total | Individual | Descendants | Total | Individual | Descendants | ||
| Benefits Include Defense, Subsidies, Rest-of-World Payments, and Interest Payments | |||||||
| <HS | Immigrant | –716 | –316 | –400 | –522 | –216 | –306 |
| Native | –915 | –490 | –425 | –705 | –381 | –324 | |
| Imm–Nat | 199 | 174 | 25 | 183 | 165 | 18 | |
| HS | Immigrant | –458 | –158 | –300 | –355 | –108 | –247 |
| Native | –513 | –178 | –335 | –417 | –154 | –263 | |
| Imm–Nat | 55 | 20 | 35 | 62 | 46 | 16 | |
| SomCol | Immigrant | –183 | –2 | –181 | –167 | 7 | –174 |
| Native | –265 | –31 | –234 | –252 | –50 | –202 | |
| Imm–Nat | 82 | 29 | 53 | 85 | 57 | 28 | |
| BA | Immigrant | 291 | 307 | –16 | 157 | 232 | –75 |
| Native | 368 | 445 | –77 | 195 | 299 | –104 | |
| Imm–Nat | –77 | –138 | 61 | –38 | –67 | 29 | |
| >BA | Immigrant | 832 | 765 | 67 | 519 | 541 | –22 |
| Native | 817 | 781 | 36 | 488 | 527 | –39 | |
| Imm–Nat | 15 | –16 | 31 | 31 | 14 | 17 | |
NOTE: The “total” figures equal the fiscal impact of the individual, starting at age 25, plus the fiscal impacts of that individual’s descendants. See accompanying text for a discussion of the difference between scenarios without and with public goods included. The discount rate used for the net present value calculations is 3 percent.
SOURCE: Values are panel generated using 2011-2013 Current Population Survey data pools for the projections.
pure public goods are left out (top panel). Notice that these values are more similar for immigrant and native within the same educational category than they are for either individual across educational categories. The fiscal impact is negative only for individuals in the lowest educational attainment category (less than high school, <HS). This is true for both natives and immigrants, with values of –$251,000 for the fiscal impact of a native-born person and −$109,000 for an immigrant. The low-skilled immigrant is less costly than the low-skilled native mainly because the former will not qualify for as many welfare programs. For all educational attainment groups from completing high school (HS) and higher, net impacts are positive and greater for the native-born person—but the differences between immigrant and native-born are relatively small. For example, strictly from the perspective of fiscal balance, an immigrant with a bachelor’s degree (BA) (positive fiscal impact of $514,000) is preferable over a native with only some college (positive impact of $208,000).
In contrast, as shown in the next column, descendants of the immigrant always contribute more to fiscal balances than do the descendants of the native-born person, no matter what the individual’s educational attainment is, which budget scenario is assumed, or how public goods are treated. This is mostly due to the greater average educational attainment of an immigrant’s descendants, compared to the average educational attainment of descendants of the native born. To a lesser extent, there is also a small advantage for second generation persons in estimated earnings, and thus tax payments, within education category, compared to third-plus generation persons.
Combining the fiscal impact of the individual with that of the individual’s descendants (the “Total” columns in Table 8-13), one can see that the hypothetical immigrant in this projection is almost always more positive (or less negative), from a fiscal balance perspective, than the hypothetical native-born person. The exception is the BA educational attainment category. Nonetheless, the lesson to draw from these projections is that the variability in fiscal impact is much greater across education categories than between immigrants and natives with the same educational attainment. Under the conditions of this projection, the major driver of fiscal impacts is educational attainment, not immigrant status.
Note that the above discussion does not touch on the results for the lower half of Table 8-13, in which most types of public goods are included as benefits paid for by both the immigrant and the native-born individual and to their descendants. This is because the patterns discussed are similar for the scenario with public goods costs included, just with more negative fiscal impacts. Because the same average value of the additional public goods is assigned to immigrants, natives, and descendants alike, the only differences for that scenario, compared to the scenario with no public
goods, will be driven by demographic differences, such as different fertility, mortality, and emigration, and those differences are slight.
Looking within Net Impacts
It is helpful to disaggregate the results of the panel’s projection into taxes paid versus benefits received and also into impact by level of government. Tables 8-14, 8-15, and 8-16 do this for the accounting scenario in which an additional immigrant does not trigger additional spending on public goods, and therefore the cost of public goods is not added into the benefits received. Tables 8-17 and 8-18 present total and federal-only fiscal impacts when the alternative scenario is used, in which a new immigrant is assumed to increase spending on public goods by the per capita cost of those goods. Throughout Tables 8-14 through 8-18, the analysis calculates the characteristics of an average immigrant by drawing from the CPS pool of recent immigrants (CPS survey data for 2011 through 2013).
In all five tables, as in Tables 8-12 and 8-13 above, many of these fiscal impact estimates may seem large, but recall that they are the sums of discounted (NPV) flows over 75 years. For comparison, consider the lifetime earnings of a native-born worker without a college degree who earns $35,000 a year. Over a 40-year working life from ages 25 to 65, assuming an average tax rate of 25 percent in income, property, sales, corporate and other taxes, plus another 7.65 percent for employees’ contributions for FICA taxes, this worker will accumulate tax payments of $457,000 in undiscounted dollars. Assuming an annual rate of real growth of 1 percent and a discount rate of 3 percent, the present value of this flow of taxes becomes $318,000. This is roughly consistent with the total taxes paid in the No Budget Adjustments scenario in Table 8-14 for a new immigrant who arrives ages 0-24. The 75-year present value of taxes paid by that person is $283,000 if his parent had less than a high school education, $350,000 if the parent had a high school diploma, and $417,000 if the parent had some college. (These figures are from the column under the No Budget Adjustments scenario for just the immigrant’s own flows, without the flows from dependents. Adding the future flow of taxes in the descendants column increases the NPV of taxes to the estimates shown in the Total Impact column.)
These tables also illustrate the differential impacts of education on taxes paid versus benefits received. For instance, in the No Budget Adjustments section of Table 8-14, an immigrant who arrives during working ages (i.e., ages 25-64) with a BA will pay much more in taxes than an immigrant of similar age with less than a high school education ($704,000 versus $258,000). The educational gradient in the receipt of benefits, which is inverted with higher education groups receiving less in benefits, is much less
| CBO Long-term Budget Outlook | ||||||||||||
|---|---|---|---|---|---|---|---|---|---|---|---|---|
| Total Impact | Immigrant | Descendants | ||||||||||
| 0-24 | 25-64 | 65+ | Avg. | 0-24 | 25-64 | 65+ | Avg. | 0-24 | 25-64 | 65+ | Avg. | |
| Total Net | ||||||||||||
| <HS | 35 | –225 | –257 | –117 | 23 | –198 | –257 | –109 | 11 | –26 | 0 | –8 |
| HS | 239 | –42 | –164 | 49 | 140 | –50 | –164 | 11 | 98 | 8 | 0 | 39 |
| SomCol | 401 | 157 | –155 | 261 | 236 | 99 | –155 | 155 | 165 | 58 | 0 | 106 |
| BA | 495 | 504 | –160 | 481 | 301 | 366 | –160 | 330 | 194 | 138 | 0 | 150 |
| >BA | 446 | 994 | –100 | 812 | 287 | 805 | –100 | 635 | 159 | 190 | 0 | 177 |
| Avg. | 291 | 269 | –201 | 259 | 177 | 196 | –201 | 173 | 114 | 73 | 0 | 85 |
| Taxes | ||||||||||||
| <HS | 778 | 340 | 38 | 503 | 382 | 216 | 38 | 272 | 396 | 125 | 0 | 230 |
| HS | 942 | 475 | 33 | 620 | 482 | 318 | 33 | 365 | 461 | 157 | 0 | 255 |
| SomCol | 1,096 | 659 | 40 | 844 | 576 | 438 | 40 | 491 | 521 | 220 | 0 | 354 |
| BA | 1,159 | 978 | 53 | 1,005 | 638 | 682 | 53 | 649 | 521 | 296 | 0 | 355 |
| >BA | 1,088 | 1,445 | 78 | 1,314 | 618 | 1,101 | 78 | 939 | 469 | 344 | 0 | 375 |
| Avg. | 989 | 771 | 43 | 822 | 521 | 543 | 43 | 515 | 468 | 228 | 0 | 307 |
| Benefits | ||||||||||||
| <HS | 743 | 565 | 295 | 619 | 358 | 414 | 295 | 381 | 385 | 151 | 0 | 238 |
| HS | 704 | 517 | 197 | 570 | 342 | 368 | 197 | 354 | 362 | 149 | 0 | 216 |
| SomCol | 696 | 501 | 194 | 583 | 340 | 340 | 194 | 336 | 356 | 162 | 0 | 247 |
| BA | 665 | 474 | 213 | 524 | 337 | 316 | 213 | 319 | 327 | 158 | 0 | 205 |
| >BA | 641 | 450 | 179 | 503 | 331 | 296 | 179 | 304 | 310 | 154 | 0 | 198 |
| Avg. | 698 | 502 | 244 | 563 | 344 | 347 | 244 | 342 | 354 | 154 | 0 | 221 |
| CBO Long-term Budget Outlook with Deficit Reduction | ||||||||||||
|---|---|---|---|---|---|---|---|---|---|---|---|---|
| Total Impact | Immigrant | Descendants | ||||||||||
| 0-24 | 25-64 | 65+ | Avg. | 0-24 | 25-64 | 65+ | Avg. | 0-24 | 25-64 | 65+ | Avg. | |
| Total Net | ||||||||||||
| <HS | 56 | –212 | –254 | –101 | 34 | –189 | –254 | –99 | 22 | –23 | 0 | –2 |
| HS | 263 | –28 | –162 | 67 | 153 | –40 | –162 | 22 | 110 | 13 | 0 | 45 |
| SomCol | 427 | 174 | –151 | 283 | 250 | 110 | –151 | 168 | 178 | 64 | 0 | 115 |
| BA | 522 | 525 | –157 | 503 | 316 | 381 | –157 | 345 | 206 | 145 | 0 | 159 |
| >BA | 472 | 1,023 | –97 | 840 | 302 | 826 | –97 | 654 | 170 | 197 | 0 | 186 |
| Avg. | 316 | 288 | –199 | 279 | 190 | 209 | –199 | 186 | 126 | 79 | 0 | 93 |
| Taxes | ||||||||||||
| <HS | 791 | 345 | 38 | 510 | 388 | 218 | 38 | 276 | 404 | 127 | 0 | 235 |
| HS | 959 | 481 | 33 | 630 | 490 | 321 | 33 | 370 | 470 | 160 | 0 | 260 |
| SomCol | 1,116 | 668 | 40 | 858 | 585 | 443 | 40 | 498 | 531 | 225 | 0 | 361 |
| BA | 1,181 | 992 | 53 | 1,021 | 650 | 690 | 53 | 659 | 531 | 302 | 0 | 362 |
| >BA | 1,108 | 1,467 | 79 | 1,336 | 629 | 1,117 | 79 | 954 | 478 | 351 | 0 | 383 |
| Avg. | 1,007 | 782 | 43 | 835 | 530 | 550 | 43 | 522 | 477 | 232 | 0 | 313 |
| Benefits | ||||||||||||
| <HS | 735 | 556 | 292 | 611 | 353 | 407 | 292 | 375 | 382 | 149 | 0 | 236 |
| HS | 697 | 509 | 195 | 563 | 337 | 361 | 195 | 348 | 360 | 147 | 0 | 215 |
| SomCol | 689 | 494 | 192 | 576 | 336 | 333 | 192 | 330 | 353 | 161 | 0 | 246 |
| BA | 658 | 467 | 211 | 517 | 333 | 310 | 211 | 314 | 325 | 157 | 0 | 204 |
| >BA | 636 | 444 | 176 | 496 | 327 | 290 | 176 | 299 | 309 | 154 | 0 | 197 |
| Avg. | 691 | 494 | 242 | 556 | 339 | 341 | 242 | 336 | 352 | 153 | 0 | 220 |
| No Budget Adjustments | ||||||||||||
|---|---|---|---|---|---|---|---|---|---|---|---|---|
| Total Impact | Immigrant | Descendants | ||||||||||
| 0-24 | 25-64 | 65+ | Avg. | 0-24 | 25-64 | 65+ | Avg. | 0-24 | 25-64 | 65+ | Avg. | |
| Total Net | ||||||||||||
| <HS | –118 | –231 | –254 | –185 | –18 | –176 | –254 | –115 | –100 | –55 | 0 | –70 |
| HS | 13 | –105 | –170 | –67 | 61 | –70 | –170 | –29 | –48 | –36 | 0 | –39 |
| SomCol | 117 | 35 | –163 | 67 | 127 | 47 | –163 | 78 | –11 | –12 | 0 | –11 |
| BA | 172 | 283 | –177 | 235 | 160 | 251 | –177 | 210 | 12 | 32 | 0 | 25 |
| >BA | 140 | 627 | –120 | 469 | 143 | 565 | –120 | 427 | –2 | 63 | 0 | 42 |
| Avg. | 45 | 116 | –206 | 77 | 82 | 118 | –206 | 92 | –37 | –2 | 0 | –15 |
| Taxes | ||||||||||||
| <HS | 514 | 258 | 37 | 349 | 283 | 181 | 37 | 213 | 231 | 76 | 0 | 136 |
| HS | 616 | 352 | 30 | 432 | 350 | 258 | 30 | 282 | 265 | 94 | 0 | 149 |
| SomCol | 716 | 479 | 35 | 576 | 417 | 348 | 35 | 372 | 299 | 130 | 0 | 205 |
| BA | 746 | 704 | 47 | 697 | 451 | 532 | 47 | 493 | 295 | 172 | 0 | 204 |
| >BA | 693 | 1,025 | 64 | 909 | 428 | 827 | 64 | 695 | 264 | 198 | 0 | 214 |
| Avg. | 643 | 558 | 39 | 569 | 375 | 424 | 39 | 391 | 268 | 134 | 0 | 178 |
| Benefits | ||||||||||||
| <HS | 631 | 489 | 291 | 534 | 300 | 358 | 291 | 328 | 331 | 131 | 0 | 206 |
| HS | 603 | 458 | 200 | 499 | 290 | 328 | 200 | 311 | 313 | 130 | 0 | 188 |
| SomCol | 599 | 444 | 198 | 509 | 290 | 301 | 198 | 293 | 309 | 142 | 0 | 216 |
| BA | 574 | 421 | 224 | 462 | 291 | 281 | 224 | 283 | 283 | 140 | 0 | 179 |
| >BA | 552 | 397 | 185 | 440 | 286 | 262 | 185 | 268 | 267 | 135 | 0 | 172 |
| Avg. | 598 | 442 | 246 | 491 | 292 | 307 | 246 | 299 | 306 | 135 | 0 | 192 |
NOTE: The “total” figures equal the fiscal impact of the individual immigrant plus the fiscal impacts of that individual’s descendants. See accompanying text for a discussion of the difference among scenarios without and with public goods included. The discount rate used for the net present value calculations is 3 percent.
SOURCE: The values are panel generated using Current Population Survey data pools from 2011-2013.
| CBO Long-term Budget Outlook | ||||||||||||
|---|---|---|---|---|---|---|---|---|---|---|---|---|
| Total Impact | Immigrant | Descendants | ||||||||||
| 0-24 | 25-64 | 65+ | Avg. | 0-24 | 25-64 | 65+ | Avg. | 0-24 | 25-64 | 65+ | Avg. | |
| Federal Net | ||||||||||||
| <HS | 165 | –192 | –229 | –43 | 13 | –215 | –229 | –119 | 152 | 23 | 0 | 76 |
| HS | 335 | –53 | –152 | 76 | 108 | –109 | –152 | –36 | 227 | 56 | 0 | 112 |
| SomCol | 474 | 109 | –149 | 271 | 189 | 2 | –149 | 85 | 285 | 107 | 0 | 187 |
| BA | 570 | 399 | –160 | 434 | 264 | 220 | –160 | 222 | 306 | 178 | 0 | 212 |
| >BA | 544 | 793 | –104 | 703 | 271 | 567 | –104 | 467 | 272 | 226 | 0 | 236 |
| Avg. | 388 | 205 | –186 | 256 | 149 | 87 | –186 | 99 | 239 | 118 | 0 | 157 |
| Federal Taxes | ||||||||||||
| <HS | 540 | 209 | 15 | 334 | 252 | 121 | 15 | 168 | 288 | 87 | 0 | 166 |
| HS | 670 | 310 | 15 | 423 | 329 | 197 | 15 | 236 | 342 | 114 | 0 | 187 |
| SomCol | 791 | 449 | 18 | 596 | 402 | 286 | 18 | 332 | 390 | 163 | 0 | 264 |
| BA | 849 | 700 | 23 | 724 | 456 | 476 | 23 | 456 | 393 | 224 | 0 | 269 |
| >BA | 800 | 1,073 | 45 | 974 | 446 | 810 | 45 | 688 | 354 | 263 | 0 | 285 |
| Avg. | 710 | 541 | 19 | 582 | 362 | 372 | 19 | 354 | 348 | 170 | 0 | 228 |
| Federal Benefits | ||||||||||||
| <HS | 376 | 400 | 244 | 377 | 239 | 336 | 244 | 287 | 137 | 64 | 0 | 90 |
| HS | 336 | 363 | 167 | 348 | 221 | 306 | 167 | 272 | 115 | 57 | 0 | 75 |
| SomCol | 317 | 340 | 167 | 324 | 213 | 284 | 167 | 247 | 105 | 56 | 0 | 77 |
| BA | 279 | 301 | 182 | 291 | 192 | 256 | 182 | 234 | 87 | 45 | 0 | 57 |
| >BA | 256 | 280 | 149 | 271 | 175 | 243 | 149 | 221 | 81 | 37 | 0 | 50 |
| Avg. | 322 | 337 | 204 | 326 | 213 | 285 | 204 | 255 | 109 | 52 | 0 | 71 |
| CBO Long-term Budget Outlook with Deficit Reduction | ||||||||||||
|---|---|---|---|---|---|---|---|---|---|---|---|---|
| Total Impact | Immigrant | Descendants | ||||||||||
| 0-24 | 25-64 | 65+ | Avg. | 0-24 | 25-64 | 65+ | Avg. | 0-24 | 25-64 | 65+ | Avg. | |
| Federal Net | ||||||||||||
| <HS | 186 | –179 | –226 | –27 | 24 | –206 | –226 | –110 | 162 | 27 | 0 | 82 |
| HS | 359 | –38 | –150 | 93 | 121 | –99 | –150 | –26 | 238 | 60 | 0 | 119 |
| SomCol | 501 | 126 | –146 | 293 | 203 | 14 | –146 | 97 | 298 | 112 | 0 | 195 |
| BA | 598 | 420 | –157 | 457 | 279 | 235 | –157 | 236 | 319 | 185 | 0 | 220 |
| >BA | 570 | 822 | –101 | 731 | 286 | 589 | –101 | 487 | 284 | 233 | 0 | 244 |
| Avg. | 413 | 224 | –186 | 277 | 162 | 100 | –183 | 112 | 251 | 123 | 0 | 165 |
| Federal Taxes | ||||||||||||
| <HS | 553 | 213 | 15 | 342 | 258 | 123 | 15 | 172 | 296 | 90 | 0 | 170 |
| HS | 687 | 317 | 15 | 433 | 337 | 200 | 15 | 241 | 350 | 116 | 0 | 192 |
| SomCol | 811 | 459 | 18 | 610 | 411 | 292 | 18 | 339 | 400 | 167 | 0 | 270 |
| BA | 871 | 714 | 23 | 741 | 467 | 485 | 23 | 465 | 403 | 230 | 0 | 276 |
| >BA | 820 | 1,096 | 46 | 995 | 457 | 826 | 46 | 702 | 363 | 270 | 0 | 293 |
| Avg. | 728 | 553 | 19 | 596 | 370 | 379 | 19 | 361 | 358 | 174 | 0 | 234 |
| Federal Benefits | ||||||||||||
| <HS | 367 | 392 | 241 | 370 | 234 | 329 | 241 | 282 | 133 | 63 | 0 | 88 |
| HS | 328 | 355 | 165 | 340 | 216 | 299 | 165 | 266 | 112 | 56 | 0 | 74 |
| SomCol | 310 | 332 | 165 | 317 | 208 | 278 | 165 | 242 | 102 | 55 | 0 | 75 |
| BA | 273 | 294 | 180 | 284 | 188 | 250 | 180 | 229 | 85 | 44 | 0 | 55 |
| >BA | 251 | 274 | 147 | 265 | 171 | 237 | 147 | 216 | 80 | 37 | 0 | 49 |
| Avg. | 315 | 329 | 202 | 319 | 208 | 278 | 202 | 250 | 107 | 51 | 0 | 69 |
| No Budget Adjustments | ||||||||||||
|---|---|---|---|---|---|---|---|---|---|---|---|---|
| Total Impact | Immigrant | Descendants | ||||||||||
| 0-24 | 25-64 | 65+ | Avg. | 0-24 | 25-64 | 65+ | Avg. | 0-24 | 25-64 | 65+ | Avg. | |
| Federal Net | ||||||||||||
| <HS | –2 | –205 | –228 | –120 | –23 | –193 | –228 | –123 | 21 | –11 | 0 | 3 |
| HS | 101 | –117 | –158 | –44 | 38 | –124 | –158 | –70 | 64 | 7 | 0 | 26 |
| SomCol | 188 | –9 | –158 | 78 | 92 | –41 | –158 | 17 | 96 | 32 | 0 | 61 |
| BA | 247 | 188 | –176 | 194 | 136 | 116 | –176 | 113 | 110 | 71 | 0 | 81 |
| >BA | 235 | 447 | –123 | 374 | 139 | 348 | –123 | 278 | 96 | 98 | 0 | 96 |
| Avg. | 135 | 57 | –191 | 76 | 64 | 17 | –191 | 26 | 71 | 39 | 0 | 60 |
| Federal Taxes | ||||||||||||
| <HS | 317 | 142 | 15 | 207 | 169 | 95 | 15 | 121 | 148 | 47 | 0 | 86 |
| HS | 391 | 208 | 13 | 264 | 217 | 148 | 13 | 167 | 174 | 60 | 0 | 97 |
| SomCol | 463 | 296 | 15 | 365 | 265 | 211 | 15 | 230 | 198 | 85 | 0 | 135 |
| BA | 490 | 460 | 19 | 456 | 293 | 345 | 19 | 319 | 197 | 116 | 0 | 137 |
| >BA | 457 | 699 | 34 | 615 | 281 | 564 | 34 | 470 | 176 | 135 | 0 | 146 |
| Avg. | 413 | 357 | 17 | 364 | 236 | 269 | 17 | 247 | 177 | 88 | 0 | 117 |
| Federal Benefits | ||||||||||||
| <HS | 320 | 347 | 243 | 327 | 192 | 289 | 243 | 244 | 127 | 58 | 0 | 83 |
| HS | 289 | 325 | 171 | 308 | 179 | 272 | 171 | 237 | 110 | 53 | 0 | 71 |
| SomCol | 275 | 305 | 173 | 287 | 173 | 252 | 173 | 213 | 102 | 53 | 0 | 74 |
| BA | 243 | 273 | 195 | 261 | 157 | 228 | 195 | 206 | 86 | 44 | 0 | 56 |
| >BA | 222 | 252 | 157 | 241 | 142 | 215 | 157 | 192 | 81 | 37 | 0 | 49 |
| Avg. | 278 | 300 | 208 | 288 | 173 | 251 | 208 | 221 | 105 | 49 | 0 | 68 |
NOTE: The “total” figures equal the fiscal impact of the individual immigrant plus the fiscal impacts of that individual’s descendants. See accompanying text for a discussion of the difference among scenarios without and with public goods included. The discount rate used for the net present value calculations is 3 percent.
SOURCE: The values are panel generated using Current Population Survey data pools from 2011-2013.
| CBO Long-term Budget Outlook | ||||||||||||
|---|---|---|---|---|---|---|---|---|---|---|---|---|
| Total Impact | Immigrant | Descendants | ||||||||||
| 0-24 | 25-64 | 65+ | Avg. | 0-24 | 25-64 | 65+ | Avg. | 0-24 | 25-64 | 65+ | Avg. | |
| State/Local Net | ||||||||||||
| <HS | –130 | –33 | –28 | –74 | 10 | 16 | –28 | 10 | –141 | –49 | 0 | –84 |
| HS | –96 | 11 | –12 | –26 | 32 | 58 | –12 | 47 | –128 | –48 | 0% | –74 |
| SomCol | –73 | 48 | –5 | –10 | 47 | 96 | –5 | 70 | –120 | –48 | 0% | –80 |
| BA | –75 | 105 | 0 | 47 | 37 | 146 | 0 | 108 | –113 | –41 | 0% | –61 |
| >BA | –98 | 202 | 4 | 109 | 16 | 238 | 4 | 168 | –114 | –36 | 0% | –59 |
| Avg. | –97 | 65 | –16 | 2 | 28 | 109 | –16 | 74 | –125 | –44 | 0% | –72 |
| State/Local Taxes | ||||||||||||
| <HS | 237 | 132 | 23 | 168 | 130 | 94 | 23 | 104 | 107 | 37 | 0% | 64 |
| HS | 272 | 165 | 18 | 196 | 153 | 121 | 18 | 129 | 119 | 43 | 0% | 68 |
| SomCol | 305 | 209 | 22 | 249 | 174 | 152 | 22 | 159 | 131 | 58 | 0% | 90 |
| BA | 310 | 278 | 30 | 280 | 182 | 206 | 30 | 193 | 127 | 72 | 0% | 87 |
| >BA | 287 | 372 | 33 | 341 | 172 | 291 | 33 | 251 | 115 | 81 | 0% | 90 |
| Avg. | 279 | 229 | 24 | 239 | 159 | 171 | 24 | 161 | 120 | 58 | 0% | 78 |
| State/Local Benefits | ||||||||||||
| <HS | 367 | 164 | 51 | 242 | 119 | 78 | 51 | 94 | 248 | 86 | 0% | 148 |
| HS | 368 | 154 | 30 | 233 | 121 | 63 | 30 | 81 | 247 | 91 | 0% | 141 |
| SomCol | 379 | 161 | 27 | 259 | 128 | 56 | 27 | 88 | 251 | 106 | 0% | 170 |
| BA | 385 | 176 | 31 | 233 | 145 | 60 | 31 | 85 | 240 | 113 | 0% | 148 |
| >BA | 385 | 170 | 29 | 232 | 156 | 53 | 29 | 83 | 229 | 117 | 0% | 148 |
| Avg. | 376 | 165 | 40 | 237 | 131 | 62 | 40 | 87 | 245 | 102 | 0% | 150 |
| CBO Long-term Budget Outlook with Deficit Reduction | ||||||||||||
|---|---|---|---|---|---|---|---|---|---|---|---|---|
| Total Impact | Immigrant | Descendants | ||||||||||
| 0-24 | 25-64 | 65+ | Avg. | 0-24 | 25-64 | 65+ | Avg. | 0-24 | 25-64 | 65+ | Avg. | |
| State/Local Net | ||||||||||||
| <HS | –130 | –33 | –28 | –74 | 10 | 16 | –28 | 10 | –141 | –49 | 0% | –84 |
| HS | –96 | 11 | –12 | –26 | 32 | 58 | –12 | 47 | –128 | –48 | 0% | –74 |
| SomCol | –73 | 48 | –5 | –10 | 47 | 96 | –5 | 70 | –120 | –48 | 0% | –80 |
| BA | –75 | 105 | 0 | 47 | 37 | 146 | 0 | 108 | –113 | –41 | 0% | –61 |
| >BA | –98 | 202 | 4 | 109 | 16 | 238 | 4 | 168 | –114 | –36 | 0% | –59 |
| Avg. | –97 | 65 | –16 | 2 | 28 | 108 | –16 | 74 | –125 | –44 | 0% | –72 |
| State/Local Taxes | ||||||||||||
| <HS | 237 | 132 | 23 | 168 | 130 | 94 | 23 | 104 | 107 | 37 | 0% | 64 |
| HS | 272 | 165 | 18 | 196 | 153 | 121 | 18 | 129 | 119 | 43 | 0% | 68 |
| SomCol | 305 | 209 | 22 | 249 | 174 | 152 | 22 | 159 | 131 | 58 | 0% | 90 |
| BA | 310 | 278 | 30 | 280 | 182 | 206 | 30 | 193 | 127 | 72 | 0% | 87 |
| >BA | 287 | 372 | 33 | 341 | 172 | 291 | 33 | 251 | 115 | 81 | 0% | 90 |
| Avg. | 279 | 229 | 24 | 239 | 159 | 171 | 24 | 161 | 120 | 58 | 0% | 78 |
| State/Local Benefits | ||||||||||||
| <HS | 367 | 164 | 51 | 242 | 119 | 78 | 51 | 94 | 248 | 86 | 0% | 148 |
| HS | 368 | 154 | 30 | 223 | 121 | 63 | 30 | 81 | 247 | 91 | 0% | 141 |
| SomCol | 379 | 161 | 27 | 259 | 128 | 56 | 27 | 88 | 251 | 106 | 0% | 170 |
| BA | 385 | 173 | 31 | 233 | 145 | 60 | 31 | 85 | 240 | 113 | 0% | 148 |
| >BA | 385 | 170 | 29 | 232 | 156 | 53 | 29 | 83 | 229 | 117 | 0% | 148 |
| Avg. | 376 | 165 | 40 | 237 | 131 | 62 | 40 | 87 | 245 | 102 | 0% | 150 |
| No Budget Adjustments | ||||||||||||
|---|---|---|---|---|---|---|---|---|---|---|---|---|
| Total Impact | Immigrant | Descendants | ||||||||||
| 0-24 | 25-64 | 65+ | Avg. | 0-24 | 25-64 | 65+ | Avg. | 0-24 | 25-64 | 65+ | Avg. | |
| State/Local Net | ||||||||||||
| <HS | –116 | –27 | –27 | –65 | 5 | 17 | –27 | 8 | –121 | –44 | 0% | –73 |
| HS | –89 | 12 | –12 | –23 | 23 | 55 | –12 | 42 | –112 | –43 | 0% | –65 |
| SomCol | –71 | 44 | –5 | –11 | 35 | 88 | –5 | 61 | –106 | –44 | 0% | –72 |
| BA | –75 | 96 | –1 | 41 | 24 | 135 | –1 | 97 | –99 | –39 | 0% | –56 |
| >BA | –94 | 181 | 3 | 96 | 4 | 216 | 3 | 149 | –98 | –36 | 0% | –53 |
| Avg. | –90 | 59 | –15 | 2 | 19 | 100 | –15 | 66 | –109 | –41 | 0% | –64 |
| State/Local Taxes | ||||||||||||
| <HS | 196 | 115 | 22 | 142 | 113 | 86 | 22 | 93 | 83 | 29 | 0% | 50 |
| HS | 225 | 144 | 17 | 168 | 133 | 110 | 17 | 115 | 92 | 34 | 0% | 52 |
| SomCol | 253 | 183 | 20 | 211 | 152 | 138 | 20 | 141 | 101 | 45 | 0% | 70 |
| BA | 256 | 244 | 28 | 241 | 158 | 188 | 28 | 174 | 98 | 56 | 0% | 67 |
| >BA | 235 | 326 | 30 | 294 | 148 | 263 | 30 | 225 | 88 | 63 | 0% | 69 |
| Avg. | 230 | 201 | 23 | 205 | 138 | 156 | 23 | 144 | 92 | 45 | 0% | 61 |
| State/Local Benefits | ||||||||||||
| <HS | 312 | 142 | 49 | 207 | 108 | 69 | 49 | 84 | 204 | 73 | 0% | 123 |
| HS | 314 | 133 | 29 | 191 | 110 | 56 | 29 | 73 | 203 | 77 | 0% | 118 |
| SomCol | 324 | 139 | 26 | 222 | 117 | 50 | 26 | 80 | 207 | 89 | 0% | 142 |
| BA | 330 | 148 | 29 | 200 | 134 | 53 | 29 | 77 | 196 | 95 | 0% | 123 |
| >BA | 330 | 146 | 27 | 198 | 144 | 47 | 27 | 76 | 186 | 98 | 0% | 123 |
| Avg. | 321 | 142 | 38 | 203 | 120 | 55 | 38 | 78 | 201 | 86 | 0% | 125 |
NOTE: The “total” figures equal the fiscal impact of the individual immigrant plus the fiscal impacts of that individual’s descendants. See accompanying text for a discussion of the difference among scenarios without and with public goods included. The discount rate used for the net present value calculations is 3 percent.
SOURCE: The values are panel generated using Current Population Survey data pools from 2011-2013.
| CBO Long-term Budget Outlook | ||||||||||||
|---|---|---|---|---|---|---|---|---|---|---|---|---|
| Total Impact | Immigrant | Descendants | ||||||||||
| 0-24 | 25-64 | 65+ | Avg. | 0-24 | 25-64 | 65+ | Avg. | 0-24 | 25-64 | 65+ | Avg. | |
| Total Net | ||||||||||||
| <HS | –77 | –254 | –279 | –201 | –32 | –247 | –279 | –158 | –45 | –47 | 0% | –43 |
| HS | 127 | –112 | –187 | –33 | 84 | –99 | –187 | –39 | 42 | –14 | 0% | 6 |
| SomCol | 288 | 82 | –178 | 171 | 180 | 50 | –178 | 104 | 108 | 33 | 0% | 67 |
| BA | 384 | 426 | –183 | 395 | 245 | 316 | –183 | 279 | 139 | 110 | 0% | 116 |
| >BA | 339 | 915 | –123 | 725 | 231 | 754 | –123 | 583 | 108 | 161 | 0% | 142 |
| Avg. | 180 | 195 | –224 | 173 | 121 | 147 | –224 | 123 | 59 | 48 | 0% | 50 |
| Taxes | ||||||||||||
| <HS | 778 | 340 | 38 | 503 | 382 | 216 | 38 | 272 | 396 | 125 | 0% | 230 |
| HS | 942 | 475 | 33 | 620 | 482 | 318 | 33 | 365 | 461 | 157 | 0% | 255 |
| SomCol | 1,096 | 659 | 40 | 844 | 576 | 438 | 40 | 491 | 521 | 220 | 0% | 354 |
| BA | 1,159 | 978 | 53 | 1,005 | 638 | 682 | 53 | 649 | 521 | 296 | 0% | 355 |
| >BA | 1,088 | 1,445 | 78 | 1,314 | 618 | 1,101 | 78 | 939 | 469 | 344 | 0% | 375 |
| Avg. | 989 | 771 | 43 | 822 | 521 | 543 | 43 | 515 | 468 | 228 | 0% | 307 |
| Benefits | ||||||||||||
| <HS | 855 | 634 | 317 | 703 | 414 | 462 | 317 | 430 | 441 | 172 | 0% | 273 |
| HS | 816 | 587 | 220 | 653 | 397 | 416 | 220 | 404 | 418 | 170 | 0% | 249 |
| SomCol | 809 | 576 | 218 | 674 | 396 | 389 | 218 | 387 | 413 | 188 | 0% | 287 |
| BA | 775 | 551 | 236 | 610 | 394 | 365 | 236 | 370 | 381 | 186 | 0% | 240 |
| >BA | 749 | 529 | 201 | 589 | 388 | 346 | 201 | 356 | 361 | 183 | 0% | 233 |
| Avg. | 809 | 576 | 267 | 649 | 400 | 396 | 267 | 392 | 409 | 179 | 0% | 256 |
| CBO Long-term Budget Outlook with Deficit Reduction | ||||||||||||
|---|---|---|---|---|---|---|---|---|---|---|---|---|
| Total Impact | Immigrant | Descendants | ||||||||||
| 0-24 | 25-64 | 65+ | Avg. | 0-24 | 25-64 | 65+ | Avg. | 0-24 | 25-64 | 65+ | Avg. | |
| Total Net | ||||||||||||
| <HS | –54 | –280 | –276 | –186 | –21 | –236 | –276 | –148 | –33 | –43 | 0% | –36 |
| HS | 153 | –97 | –185 | –15 | 98 | –88 | –185 | –28 | 55 | –9 | 0% | 13 |
| SomCol | 317 | 101 | –175 | 193 | 195 | 62 | –175 | 117 | 121 | 39 | 0% | 76 |
| BA | 415 | 449 | –180 | 419 | 261 | 331 | –180 | 294 | 153 | 118 | 0% | 125 |
| >BA | 367 | 946 | –120 | 755 | 246 | 776 | –120 | 603 | 121 | 169 | 0% | 152 |
| Avg. | 207 | 215 | –221 | 195 | 135 | 161 | –221 | 136 | 72 | 54 | 0% | 59 |
| Taxes | ||||||||||||
| <HS | 791 | 345 | 38 | 510 | 388 | 218 | 38 | 276 | 404 | 127 | 0% | 235 |
| HS | 959 | 481 | 33 | 630 | 490 | 321 | 33 | 370 | 470 | 160 | 0% | 260 |
| SomCol | 1,116 | 668 | 40 | 858 | 585 | 443 | 40 | 498 | 531 | 225 | 0% | 361 |
| BA | 1,181 | 992 | 53 | 1,021 | 650 | 690 | 53 | 659 | 531 | 302 | 0% | 362 |
| >BA | 1,108 | 1,467 | 79 | 1,336 | 629 | 1,117 | 79 | 954 | 478 | 351 | 0% | 383 |
| Avg. | 1,007 | 782 | 43 | 835 | 530 | 550 | 43 | 522 | 477 | 232 | 0% | 313 |
| Benefits | ||||||||||||
| <HS | 844 | 624 | 315 | 693 | 408 | 454 | 315 | 423 | 436 | 170 | 0% | 270 |
| HS | 806 | 578 | 217 | 644 | 392 | 409 | 217 | 397 | 414 | 169 | 0% | 247 |
| SomCol | 800 | 567 | 215 | 665 | 390 | 381 | 215 | 381 | 409 | 186 | 0% | 284 |
| BA | 766 | 544 | 234 | 602 | 389 | 359 | 234 | 364 | 378 | 184 | 0% | 238 |
| >BA | 741 | 522 | 199 | 581 | 383 | 340 | 199 | 351 | 358 | 181 | 0% | 231 |
| Avg. | 800 | 567 | 264 | 640 | 394 | 389 | 264 | 386 | 405 | 178 | 0% | 254 |
| No Budget Adjustments | ||||||||||||
|---|---|---|---|---|---|---|---|---|---|---|---|---|
| Total Impact | Immigrant | Descendants | ||||||||||
| 0-24 | 25-64 | 65+ | Avg. | 0-24 | 25-64 | 65+ | Avg. | 0-24 | 25-64 | 65+ | Avg. | |
| Total Net | ||||||||||||
| <HS | –267 | –322 | –282 | –296 | –90 | –239 | –282 | –179 | –176 | –84 | 0% | –116 |
| HS | –135 | –197 | –197 | –176 | –12 | –132 | –197 | –93 | –123 | –65 | 0% | –83 |
| SomCol | –33 | –63 | –192 | –53 | 55 | –17 | –192 | 12 | –88 | –46 | 0% | –64 |
| BA | 26 | 181 | –205 | 122 | 87 | 186 | –205 | 144 | –61 | –5 | 0% | –22 |
| >BA | –2 | 523 | –149 | 355 | 69 | 499 | –149 | 360 | –70 | 24 | 0% | –4 |
| Avg. | –103 | 19 | –234 | –36 | 9 | 54 | –234 | 26 | –112 | –35 | 0% | –62 |
| Taxes | ||||||||||||
| <HS | 514 | 258 | 37 | 349 | 283 | 181 | 37 | 213 | 231 | 76 | 0% | 136 |
| HS | 616 | 352 | 30 | 432 | 350 | 258 | 30 | 282 | 265 | 94 | 0% | 149 |
| SomCol | 716 | 479 | 35 | 576 | 417 | 348 | 35 | 372 | 299 | 130 | 0% | 205 |
| BA | 746 | 704 | 47 | 697 | 451 | 532 | 47 | 493 | 295 | 172 | 0% | 204 |
| >BA | 693 | 1025 | 64 | 909 | 428 | 827 | 64 | 695 | 264 | 198 | 0% | 214 |
| Avg. | 643 | 558 | 39 | 569 | 375 | 424 | 39 | 391 | 268 | 134 | 0% | 178 |
| Benefits | ||||||||||||
| <HS | 780 | 580 | 319 | 644 | 373 | 420 | 319 | 392 | 407 | 160 | 0% | 252 |
| HS | 751 | 550 | 227 | 608 | 362 | 390 | 227 | 376 | 389 | 159 | 0% | 232 |
| SomCol | 749 | 542 | 227 | 629 | 362 | 365 | 227 | 360 | 387 | 177 | 0% | 269 |
| BA | 720 | 523 | 253 | 575 | 364 | 346 | 253 | 349 | 356 | 177 | 0% | 226 |
| >BA | 695 | 502 | 231 | 554 | 360 | 328 | 213 | 336 | 335 | 174 | 0% | 219 |
| Avg. | 746 | 539 | 273 | 604 | 365 | 370 | 273 | 365 | 381 | 169 | 0% | 240 |
NOTE: The “total” figures equal the fiscal impact of the individual immigrant plus the fiscal impacts of that individual’s descendants. See accompanying text for a discussion of the difference among scenarios without and with public goods included. The discount rate used for the net present value calculations is 3 percent.
SOURCE: The values are panel generated using Current Population Survey data pools from 2011-2013.
| CBO Long-term Budget Outlook | ||||||||||||
|---|---|---|---|---|---|---|---|---|---|---|---|---|
| Total Impact | Immigrant | Descendants | ||||||||||
| 0-24 | 25-64 | 65+ | Avg. | 0-24 | 25-64 | 65+ | Avg. | 0-24 | 25-64 | 65+ | Avg. | |
| Federal Net | ||||||||||||
| <HS | 53 | –261 | –251 | –127 | –43 | –263 | –251 | –168 | 95 | 2 | 0 | 42 |
| HS | 23 | –123 | –175 | –7 | 52 | –157 | –175 | –86 | 170 | 34 | 0 | 79 |
| SomCol | 361 | 34 | –173 | 180 | 134 | –47 | –173 | 34 | 228 | 81 | 0 | 147 |
| BA | 460 | 321 | –183 | 348 | 208 | 170 | –186 | 171 | 252 | 151 | 0 | 177 |
| >BA | 436 | 714 | –127 | 616 | 215 | 517 | –127 | 415 | 222 | 197 | 0 | 201 |
| Avg. | 277 | 131 | –209 | 171 | 93 | 39 | –209 | 48 | 184 | 93 | 0 | 122 |
| Federal Taxes | ||||||||||||
| <HS | 540 | 209 | 15 | 334 | 252 | 121 | 15 | 168 | 288 | 87 | 0 | 166 |
| HS | 670 | 310 | 15 | 423 | 329 | 197 | 15 | 236 | 342 | 114 | 0 | 187 |
| SomCol | 791 | 449 | 18 | 596 | 402 | 286 | 18 | 332 | 390 | 163 | 0 | 264 |
| BA | 849 | 700 | 23 | 724 | 456 | 476 | 23 | 456 | 393 | 224 | 0 | 269 |
| >BA | 800 | 1,073 | 45 | 974 | 446 | 810 | 45 | 688 | 354 | 263 | 0 | 285 |
| Avg. | 710 | 541 | 19 | 582 | 362 | 372 | 19 | 354 | 348 | 170 | 0 | 228 |
| Federal Benefits | ||||||||||||
| <HS | 487 | 470 | 266 | 461 | 294 | 384 | 266 | 337 | 193 | 85 | 0 | 124 |
| HS | 447 | 433 | 189 | 430 | 276 | 354 | 189 | 322 | 171 | 79 | 0 | 108 |
| SomCol | 430 | 415 | 191 | 415 | 268 | 333 | 191 | 299 | 162 | 82 | 0 | 117 |
| BA | 389 | 378 | 206 | 376 | 248 | 306 | 206 | 285 | 141 | 73 | 0 | 91 |
| >BA | 363 | 359 | 172 | 357 | 231 | 293 | 172 | 273 | 132 | 66 | 0 | 84 |
| Avg. | 433 | 411 | 227 | 412 | 269 | 334 | 227 | 306 | 165 | 77 | 0 | 106 |
| CBO Long-term Budget Outlook with Deficit Reduction | ||||||||||||
|---|---|---|---|---|---|---|---|---|---|---|---|---|
| Total Impact | Immigrant | Descendants | ||||||||||
| 0-24 | 25-64 | 65+ | Avg. | 0-24 | 25-64 | 65+ | Avg. | 0-24 | 25-64 | 65+ | Avg. | |
| Federal Net | ||||||||||||
| <HS | 77 | –247 | –248 | –109 | –31 | –253 | –248 | –158 | 107 | 6 | 0 | 49 |
| HS | 249 | –107 | –172 | 12 | 66 | –146 | –172 | –75 | 184 | 39 | 0 | 87 |
| SomCol | 390 | 53 | –170 | 203 | 148 | –34 | –170 | 47 | 241 | 87 | 0 | 156 |
| BA | 490 | 344 | –180 | 372 | 224 | 185 | –180 | 186 | 266 | 158 | 0 | 186 |
| >BA | 465 | 744 | –124 | 646 | 231 | 539 | –124 | 435 | 234 | 205 | 0 | 210 |
| Avg. | 304 | 151 | –206 | 193 | 107 | 52 | –206 | 62 | 197 | 99 | 0 | 131 |
| Federal Taxes | ||||||||||||
| <HS | 553 | 213 | 15 | 342 | 258 | 123 | 15 | 172 | 296 | 90 | 0 | 170 |
| HS | 687 | 317 | 15 | 433 | 337 | 200 | 15 | 241 | 350 | 116 | 0 | 192 |
| SomCol | 811 | 459 | 18 | 610 | 411 | 292 | 18 | 339 | 400 | 167 | 0 | 270 |
| BA | 871 | 714 | 23 | 741 | 467 | 485 | 23 | 465 | 403 | 230 | 0 | 276 |
| >BA | 820 | 1,096 | 46 | 995 | 457 | 826 | 46 | 7020 | 363 | 270 | 0 | 293 |
| Avg. | 728 | 553 | 19 | 596 | 370 | 379 | 19 | 361 | 358 | 174 | 0 | 234 |
| Federal Benefits | ||||||||||||
| <HS | 4,477 | 460 | 263 | 452 | 289 | 376 | 263 | 330 | 188 | 84 | 0 | 122 |
| HS | 438 | 424 | 187 | 421 | 271 | 346 | 187 | 316 | 167 | 78 | 0 | 106 |
| SomCol | 421 | 406 | 188 | 407 | 263 | 326 | 188 | 293 | 158 | 80 | 0 | 114 |
| BA | 381 | 371 | 203 | 368 | 243 | 299 | 203 | 279 | 138 | 71 | 0 | 89 |
| >BA | 356 | 352 | 170 | 350 | 227 | 287 | 170 | 237 | 129 | 65 | 0 | 83 |
| Avg. | 424 | 402 | 225 | 403 | 263 | 327 | 225 | 300 | 161 | 75 | 0 | 104 |
| No Budget Adjustments | ||||||||||||
|---|---|---|---|---|---|---|---|---|---|---|---|---|
| Total Impact | Immigrant | Descendants | ||||||||||
| 0-24 | 25-64 | 65+ | Avg. | 0-24 | 25-64 | 65+ | Avg. | 0-24 | 25-64 | 65+ | Avg. | |
| Federal Net | ||||||||||||
| <HS | –151 | –295 | –255 | –231 | –96 | –256 | –255 | –187 | –55 | –40 | 0 | –43 |
| HS | –47 | –209 | –185 | –153 | –35 | –187 | –185 | –135 | –12 | –22 | 0 | –18 |
| SomCol | 38 | –107 | –187 | –42 | 20 | –105 | –187 | –49 | 18 | –2 | 0 | 7 |
| BA | 101 | 85 | –205 | 81 | 63 | 51 | –205 | 47 | 38 | 34 | 0 | 34 |
| >BA | 92 | 342 | –151 | 259 | 65 | 283 | –151 | 210 | 27 | 60 | 0 | 49 |
| Avg. | –12 | –41 | –219 | –37 | –9 | –47 | –219 | –40 | –3 | 6 | 0 | 2 |
| Federal Taxes | ||||||||||||
| <HS | 317 | 142 | 15 | 207 | 169 | 95 | 15 | 121 | 148 | 47 | 0 | 86 |
| HS | 391 | 208 | 13 | 264 | 217 | 148 | 13 | 167 | 174 | 60 | 0 | 97 |
| SomCol | 463 | 296 | 15 | 365 | 265 | 211 | 15 | 230 | 198 | 85 | 0 | 135 |
| BA | 490 | 460 | 19 | 456 | 293 | 345 | 19 | 319 | 197 | 116 | 0 | 137 |
| >BA | 457 | 699 | 34 | 615 | 281 | 564 | 34 | 470 | 176 | 135 | 0 | 145 |
| Avg. | 413 | 357 | 17 | 364 | 236 | 269 | 17 | 247 | 177 | 88 | 0 | 117 |
| Federal Benefits | ||||||||||||
| <HS | 468 | 438 | 270 | 437 | 265 | 351 | 270 | 308 | 203 | 87 | 0 | 129 |
| HS | 438 | 417 | 199 | 417 | 252 | 335 | 199 | 302 | 186 | 82 | 0 | 115 |
| SomCol | 425 | 403 | 202 | 407 | 2,445 | 316 | 202 | 280 | 180 | 88 | 0 | 128 |
| BA | 390 | 375 | 224 | 375 | 230 | 293 | 224 | 272 | 160 | 82 | 0 | 103 |
| >BA | 365 | 356 | 185 | 356 | 216 | 281 | 185 | 260 | 149 | 75 | 0 | 96 |
| Avg. | 425 | 398 | 236 | 401 | 246 | 315 | 236 | 287 | 180 | 83 | 0 | 115 |
NOTE: The “total” figures equal the fiscal impact of the individual immigrant plus the fiscal impacts of that individual’s descendants. See accompanying text for a discussion of the difference among scenarios without and with public goods included. The discount rate used for the net present value calculations is 3 percent.
SOURCE: The values are panel generated using Current Population Survey data pools from 2011-2013.
steep than the gradient for taxes paid. An immigrant arriving at working age with a college degree will receive less in benefits than the high school dropout ($281,000 compared to $358,000), but this difference is far less than it was for taxes paid ($532,000 versus $181,000). Overall, since taxes are sharply increased with education, and benefits are reduced (albeit not as dramatically), one can see why the higher levels of education among recent immigrants produce a more positive net fiscal impact than previous immigrants produced.
The consolidated amounts in Tables 8-12, 8-13, and 8-14 are the sum of the corresponding federal amounts in Table 8-15 and the state/local amounts in Table 8-16. The two CBO-based scenarios are the same at the state and local levels because there is no deficit reduction plan for state and local budgets. By statute, those budgets are required to balance. These results show that almost all of the positive fiscal impacts of immigration come from the federal level. State and local impacts are mostly negative for the average new immigrant as an individual and for that individual’s descendants. Comparing the difference in fiscal impacts of the individual with those of the immigrant’s descendants gives some indication of what drives these patterns. The descendants’ amounts are mostly negative because state and local governments must pay the upfront costs of education for young immigrants who are still dependents and for the young native-born children of new immigrants. Even though working-age immigrants pay state and local taxes, these receipts are not large enough to compensate for the cost of educating their children. In addition, the 75-year time window for our future-looking projections cuts the analysis off when some of the children and grandchildren of the hypothetical immigrant are in their highest earning, highest tax-paying ages. Although those amounts would be heavily discounted in the calculations because they are relatively far in the future, there would likely be some additional benefit from these flows into state and local budgets if the projection was extended further and captured them.
Table 8-16 also does not show as wide a spread in the present value of tax revenues by education group at the state and local level as at the federal level. State and local governments rely much more heavily on revenue sources other than income taxes than does the federal government. Sales and property taxes are less correlated with education than are income taxes. A key upshot of this is that higher levels of education among recent immigrants, which seems to be such a boon to federal budgets, cannot help as much to maintain fiscal balance at the state and local level. Another is that educating the children of immigrants, while demonstrably helpful at the federal level because of the progressivity of federal taxes, is much less of a gain for the states, where the sales and property tax contributions of more educated residents do not seem to exceed those of less educated residents as much as taxes do at the federal level.
Future Impacts: Summary
Although estimates vary across scenarios, fiscal impacts of immigrants are generally positive at the federal level and negative at the state and local levels. State and local governments bear the burden of providing education benefits, upon arrival and continuing, to young immigrants and to the children of immigrants, but their methods of taxation tend to recoup relatively fewer contributions later from the most highly educated taxpayers. Federal benefits, in contrast, are largely focused on the elderly, so the relative youthfulness of arriving immigrants means that they tend to have positive fiscal impacts on federal finances in the short term. In addition, federal taxes are more strongly progressive, drawing more contributions from the most highly educated. The investment in public education requires public funds and pays public dividends, but a key issue is that the public dividends tend to be absorbed by the federal government, while the public funds are provided by the states. The fact that states bear much of the fiscal burden of immigration may incentivize state-level policies to exclude immigrants. Equity issues between the federal government and across states should be given consideration in future iterations of immigration policy.
Forward-looking projections of the net fiscal impact of an additional immigrant and descendants generate a relatively wide range of possible results. Future developments are uncertain, and, across a range of reasonable scenarios, the fiscal impact from an additional immigrant can be positive or negative depending on which assumptions are used in the calculation. Three assumptions are particularly important in determining the results: the future of government budgets, the treatment of public goods (i.e., how costs on budget items such as national defense change are assumed to change with an additional immigrant), and the immigrant’s characteristics.
The future path of fiscal policy is important for assessing the fiscal impacts of immigrants. Under “business as usual,” in which federal deficits continue and debt increases rapidly relative to GDP, immigrants are not valuable to governments (i.e., they do not have a positive fiscal impact) because nobody is valuable to governments. The net fiscal impact for any U.S. resident, immigrant or native-born, is negative. When fiscal sustainability is assumed to result in future spending cuts and tax increases, immigrants are more valuable than native-born Americans (that is, their net fiscal impact is greater in a positive direction).
The treatment of spending on public goods is important for assessing the fiscal impact of immigrants. Federal defense spending is a very large part of the budget. But the addition of a single citizen through immigration or birth cannot plausibly increase defense spending, which is easily shared by all citizens, while it clearly must increase spending on transfer programs
such as Social Security. Therefore, it is reasonable to omit the per capita cost of pure public goods, such as national defense, from the incremental cost to government of a single additional citizen. However, for larger increases in population through sustained immigration, this reasoning no longer holds and the net fiscal impact of immigrants may dip negative if spending on public goods is assumed to increase with the resulting population increase.
The characteristics of a new immigrant are important for assessing the fiscal impact. During the past 20 years, there has been considerable change in many characteristics of immigrants, chief among them—for purposes of understanding fiscal impacts—being age structure and educational attainment. If a future immigrant looks like recent new immigrants, rather than like an average immigrant of the entire first generation alive today, that immigrant will have a more positive net fiscal impact because of increased levels of education and concentration at working ages, the characteristics most lucrative to governments from the perspective of tax collections.
Today’s immigrants have more education, making them more positive contributors to government finances than immigrants in the past. If today’s immigrants had the same lower educational distribution as immigrants two decades ago, their positive fiscal impact would have been 30-70 percent lower. Whether these trends will continue or not remains uncertain, but the historical record suggests that the total net fiscal impact of immigrants across all levels of government may have become more positive over time.
An immigrant and a native-born person with similar characteristics will likely have about the same fiscal impact. Persons with higher levels of education contribute more positively to government finances regardless of their immigrant status. Furthermore, within age and education categories, immigrants generally have a more salutary effect on budgets than a native-born person because they are disqualified from some benefit programs and because their children, on average, tend to achieve higher levels of education, earnings, and tax paying. Of course, government policy has much more control over levels of immigration than over rates of native population growth, and thus the policy implications of this point are minimal.
8.4 ANNEX: TECHNICAL DOCUMENTATION FOR THE FISCAL ESTIMATES
Chapter 8 contains estimates of costs and benefits of U.S. residents by generation, as well as discounted flows, of taxes paid and benefits received, that are expected to arise from one new immigrant arriving in the United States in the future, including flows attributable to that immigrant’s descendants. This annex explains the calculation steps involved in the creation of this dataset of flows and in all of the NPV calculations that appear in Chapter 8. After an overview of the calculation steps, the second section documents in detail how the age profiles of taxes and benefits were generated. The third section explains the methodology for estimating educational transmission from one generation to the next and projecting educational attainment of future immigrants and descendants. The fourth subsection covers the projection of future taxes and benefits, and the final subsection documents how key demographic characteristics (survivorship, emigration, and number of descendants) were projected for future immigrants and their descendants.
Overview of Calculation Steps
The same input data that were used in the historical static calculations in Section 8.2 were used in the forward projections in Section 8.3, but the future-looking projected flows are only used in the 75-year horizon calculations. The steps in the forward-looking calculation are described briefly in this section in a numbered list. The subsequent sections of the annex give complete details for each step.
1. Estimate Age Profiles of Tax and Benefit Flows by Immigrant Status and Education
The profiles are smoothed, per capita age schedules of tax and benefit flows, estimated from rolling 3-year CPS samples and augmented with other data sources where necessary. They are adjusted by an overall factor (i.e., one multiplicative factor is applied to all age groups) so that the aggregates match totals from the NIPA for the central year of the 3-year period. For example, the age profiles for 2012 come from pooled CPS samples for 2011-2013 and are adjusted to 2012 NIPA total. The “jumping-off” year for the future-looking 75-year flow projections is 2012.
Age profiles are estimated for five immigrant groups and five educational attainment groups. The immigrant groups are foreign born arriving within the last 0-4 years, foreign-born arriving within the last 5-9 years, foreign-born arriving more than 10 years ago, native-born children of foreign-born
parents, and native-born children of native-born parents. The five education groups are less than high school completion (<HS), completed high school (HS), some college (SomCol), graduated from college with a degree (BA), and education beyond the first college degree (>BA). When the CPS has individual-level indicators of a particular flow, those are used. Where a household-level flow is available, assumptions are made about the allocation of the household amount to individuals within the household.
Some flows are not attributable to individuals but instead can be assigned to everyone in the population on a per capita basis. These include public goods, such as defense and subsidies, interest payments on debt, general costs of public administration, and other costs shared across society such as the costs of police, fire, and building and maintaining public infrastructure. For some analyses, it is appropriate to exclude some of these costs, for others it is more reasonable to include them. The tables in the chapter specify whether and which public goods were included in per capita costs.
For the historical static calculations in Section 8.2, the same rolling 3-year pooled CPS samples are used, but at the individual level rather than collapsed into per capita age profiles. However, the microdata is still adjusted to agree with NIPA totals for the central year at the aggregate level. The data sources and assumptions for each flow are listed in the next subsection of this annex, followed by details on the aggregate NIPA amounts to which the age profiles were adjusted.
2. Estimate Future Educational Attainment of Young Immigrants and of All Immigrant Descendants
Because an individual’s tax payments and benefit receipts differ so much by the individual’s educational attainment, to predict future flows for an immigrant one must first predict the educational level that individual and his descendants will attain. An immigrant who arrives after age 25 is likely to maintain the education level observed on arrival, so we assume no change in educational attainment after age 25. If the immigrant arrives before age 25, we instead predict a future education level by estimating regression functions that predict offspring education based on parental education.
The regression functions were estimated using Decennial Census samples 15 years apart. The earlier sample was used to observe the education of parents born in particular regions who had children ages 10-16 living in their households. The later sample provided observations of the education of persons ages 25-31 whose parents were born in that region. These distributions were compared to derive regression functions to predict a child’s educational attainment based on parents’ education and birth region. Separate functions were derived for native-born children and for foreign-born
children. In predicting ultimate education levels, random error terms were added to maintain realistic educational distributions at each generation. More details on this process are included below.
3. Project Future Taxes and Benefits
The NPV calculations start with the jumping-off year of 2012 and continue forward 75 years to 2087. To estimate federal flows, three different scenarios are used, as follows:
- The CBO’s Long-Term Budget Outlook’s extended baseline scenario, which projects what would happen in the future under all currently legislated tax and spending provisions but no new ones (Congressional Budget Office, 2014a).
- A CBO version of the extended baseline scenario but with a long-term plan to reduce federal deficits.
- A simple No Budget Adjustments scenario in which no budget-mitigation mechanisms are assumed but the age profiles themselves simply shift up every year by an assumed rate of productivity growth (1% was used).
State and local budgets were handled differently because they cannot run large deficits like the federal government can. For the CBO-based scenarios, we assumed that all state and local flows grow at the same rate as national GDP in CBO’s baseline budget projection (which does not include economic feedbacks from debt to economic performance, although CBO does have alternative projections that do incorporate equilibrium effects). For the No Budget Adjustments scenario, state and local flows were handled in the same way as federal flows, with age profiles of taxes paid and benefits received shifting upward by an assumed 1 percent per year. More details on these projections and what they do to future deficits appear in the detailed discussion below.
4. Project Survivorship, Emigration, and Number of Descendants
To project fiscal impacts of an immigrant arrival into the future, one needs to know how likely the immigrant is to survive in each future year and to not emigrate from the United States (either back to the immigrant’s country of origin or to another country). To project the fiscal impacts of the immigrant’s descendants, one needs to know how many children will be born and what their survivorship and risk of emigration will be. For the projections in Chapter 8, all of these demographic factors are the same as those used for the demographic projections elsewhere in the report.
However, there is one additional assumption needed to cover the case of young children whose immigrant parents choose to emigrate. We assume here that children of immigrants ages 0 to 19 years whose parents emigrate will also emigrate, even if they are native born. See the section below on projection of demographic characteristics for further details.
5. Final Calculation: Sum Up Discounted Projected Future Flows Based on Entry Characteristics and Apply a Discount Rate
The final “thought experiment” of estimating the fiscal impact of the arrival of one additional immigrant combines the results from steps 3 and 4. Defining survivorship broadly to include the risk of emigration along with the risk of death, this process then involves weighting the projected per capita flows by the survivorship probability of a hypothetical immigrant and that immigrant’s hypothetical descendants at each year from 2012 to 2087, given the immigrant’s level of education and age at entry.
To talk through one example, imagine an immigrant arriving at age 32 in 2012 with less than high school education. The age profiles specify that this immigrant will have a particular level of taxes paid and benefits received in 2012, and the difference between them is that person’s net fiscal impact in 2012. For 2013, the calculation uses the projected taxes paid and benefits received of a now 33-year-old with less than high school education, weighted by the probability of having survived to age 33 and not emigrated, discounted by 3 percent. The process continues for a 34-year-old in 2014, this time discounted by 3 percent each year for 2 years. The net fiscal impact for the 35-year-old immigrant in 2015 is discounted for each of 3 years, and so on. The discounted annual net fiscal impacts for all 75 years are then added together to give the NPV of the immigrant’s arrival attributable just to that individual (excluding flows from the immigrant’s descendants).
The discounted NPV for each of the immigrant’s descendants is calculated similarly. Based on fertility rates, the immigrant has an expected number of births in 2013, weighted by the probability of a newborn surviving (and not leaving with an emigrating parent). This number of children is multiplied by the taxes paid less benefits received that are expected to accrue to a newborn child in 2013, and so for each year as the expected children age and progress through their years of public schooling. Eventually in one or another future year, each surviving child of the immigrant is old enough to have a positive expected number of births, and the discounted NPV calculation process will continue forward for the immigrant’s grandchildren as well. All expected (based on fertility, survivorship and emigration rates, etc.) offspring over the 75-year period are included in deriving the summed-up fiscal impact for the immigrant’s descendants.
For comparative purposes, a similar analysis can be done for native-born persons of native-born parents. Even though natives only ever “arrive” at birth (age 0), the calculation for a native-born individual that is included in Chapter 8 is for the discounted flows starting from age 25. But that calculation is used just for comparison with an immigrant arriving at age 25 (to equalize the comparison, given that the immigrant does not receive public schooling benefits in the United States).
The immigrant calculations described here give the 75-year present values for a particular age and education at arrival. However, for purposes of the issues discussed in Chapter 8, we are usually interested in the discounted present value for a set of average characteristics for a particular group. In the chapter, averages for recent immigrants and all immigrants are shown.
Age Profiles of Taxes and Benefits
CPS Data and Definition of Immigrant Generations
Most of the profiles used in The New Americans (National Research Council, 1997) were based on CPS data, pooling March samples for 1994 and 1995. Federal tax and benefit flows were adjusted to national aggregates as measured in NIPA for 1994. State and local benefits were adjusted to agree with 1994 fiscal year totals, while state and local taxes were adjusted to follow a balanced budget rule.
The age profiles used in this report also use mostly CPS data, pooling samples over 3 years to get the appropriate age shape for the central year, then adjusting to national aggregates for the central year. The profiles shown here are for 2012: The age profiles are calculated from CPS samples for 2011, 2012, and 2013 and are adjusted to be consistent with national aggregates for calendar year 2012.
For each age profile, the source in the CPS for that profile is noted below, as is the source for the national aggregate that the age profile is adjusted proportionally to match. Separate profiles were generated for each of five immigration groups with each of five education levels. Immigrants are divided by generation and, for the first generation, by the time since their arrival in the United States:
- Foreign-born (first generation)38
- arrived 0-4 years ago
___________________
38 This group does not include those born abroad of American-citizen parents, as those persons would be considered citizens at birth and thus not affected by immigration policy. Such persons are considered to be third-plus generation for this report.
-
- arrived 5-9 years ago
- arrived 10 or more years ago
- Native-born with two foreign-born parents (second generation)
- Native-born with two native-born parents (third generation)39
In its computations, The New Americans (National Research Council, 1997) split native-born person with one foreign-born parent and one native-born parent 50/50 between the second and third-plus generations. This is appropriate for the forward-looking present value calculation because it credits an immigrant and nonimmigrant who have a child together as each having half of that child. Thus, higher or lower expected fertility for immigrant groups as compared to native groups will be accounted for in the calculation of net fiscal impacts of descendants. However, for the historical static calculations in Section 8.2, these children can be considered as either second or third generation, depending on the calculation scenario.
The age profiles were further separated into the five education groups, with immigrant descendants and immigrants themselves moving from one education category to another based on estimated generational transitions. The five education groups, abbreviated as <HS, HS, SomColl, BA, and >BA, are defined above in the “Overview of Calculation Steps.”
Institutionalized Persons (mainly nursing home residents)
Because the CPS does not include persons in institutions, each age profile must be adjusted to reflect the total U.S. resident population instead of just the household-resident population. This issue is most acute at oldest ages, when there are high rates of nursing home residence. For some age profiles, the adjustment for the “missing” residents in the CPS is made by assuming the value for the net fiscal flows for these persons is zero, or is the same as those not in nursing homes. For other age profiles, a different assumption is made based on external data sources. Data on the percentage of persons in institutions, by age and immigration status, are from the Integrated Public Use Microdata Series (IPUMS) for 1980, 1990, and 2000 and the American Community Survey (ACS) for the period 2006-2012, interpolated for years with no sample.
The IPUMS and ACS data for most years do not allow separation of nursing home residence by other types of institutionalization. All persons ages 65 and older in institutions are assumed to be in nursing homes. Also, IPUMS and ACS only allow separating institutionalization percentages by first generation versus second or higher generations. For this report, the
___________________
39 Throughout this report, the term “third-plus generation” is used as shorthand to refer to all U.S. residents who are technically third generation or more from an immigrant ancestor.
proportion institutionalized for second and higher generations is applied to both the second and third-plus generation estimates.
While rates of institutionalization are generally lower for immigrants compared to natives, and much lower for recent immigrants, they are very relevant for estimating the correct flows of some transfer programs that benefit the oldest age groups, such as Medicare and Medicaid, and for estimating the difference between average benefits for immigrants and the native-born.
Allocations to Individuals When CPS Data Are Household Level
When CPS source data are used at individual level, the data are used “as is,” unless otherwise noted. When the source data are at the household level, the allocation of the household amount to individuals within the household is specified for each variable.
Top Codes
CPS income variables have top codes to prevent identification of individuals. For most years and most survey items, a group average for those to whom the top code applies is given in the CPS data. Where CPS data do not have a top-coded value (mostly for years prior to 2011), twice the value of the highest non-topcoded value is substituted for records in that category.
Levels of Government
Flows are divided into federal government flows and state/local government flows. For programs where federal and state/local resources are combined, the program is treated as federal if the federal government provides a large proportion of the resources for the program, treated as state/local if state/local governments provide most of the funding, and divided into separate flows with the same age shape but different aggregate controls where there are substantial funding components from both levels of government.
Variable List
The following list defines the variables used in the datasets derived from the CPS data to generate the age profiles for taxes paid and benefits received. This information is provided for readers interested in working with the panel’s datasets or with data extracts similar to those used by the panel for the forward-looking projections in Chapter 8.
|
Group characteristics: |
|
| year | Year of age profile (central year of 3-year pooled CPS samples) |
| age | Age groups, single year to 80+ |
| immig | Immigration groups (see following section for groups) |
| edu | Education groups (see following section for groups) |
| totpop | Total resident population represented by year/age/immig/edu group |
|
Federal taxes: |
|
| inctx_f | Income tax, federal |
| corptx_f | Corporate tax, federal |
| extx_f | Excise tax, federal |
| fica_f | FICA contributions (employer and employee combined), federal |
| smicon_f | Contributions for Supplementary Medical Insurance (Medicare Part B), federal |
| unmpcon_f | Unemployment insurance contributions, federal |
| othtx_f | Other taxes, federal |
|
State/local taxes: |
|
| inctx_s | Income tax, state/local |
| prptxown_s | Property tax attributed to owners of property, state/local |
| prptxrent_s | Property tax estimated as “passed down” to renters, state/local |
| salestax_s | Sales tax, state/local |
| othtx_s | Other taxes, state/local |
|
Federal benefits: |
|
| oasdi_f | Social Security payments (Old-Age and Disability Insurance), federal |
| hi_f | Medicare Part A benefits (hospital insurance), federal |
| smi_f | Medicare Part B benefits (also called supplementary medical insurance), federal |
| mcaidnhom_f | Medicaid payments to nursing homes, federal portion |
| mcaidnoninst_f | Medicaid payments to other than nursing homes, federal portion |
| incunemp_f | Unemployment benefit payments, federal |
| retrr_f | Railroad retirement, federal |
| incssi_f | Supplemental security income (to low-income old, blind, disabled), federal |
| eitcred_f | EITC payments, federal |
| fdstmp_f | Food stamp benefits (now called SNAP), federal |
| schlunch_f | School lunch benefits, federal |
| incwelfr_f | Welfare program benefits (AFDC, TANF, GA, welfare reform benefits), federal |
| jail_f | Incarceration costs, federal |
| vetben_f | Veterans’ benefits (military retirement, disability, readjustment), federal |
| refugee_f | Refugee settlement programs, federal |
| scholar_f | Scholarships and student loan subsidies, federal |
| rentsub_f | Rent subsidies, federal |
| pubhous_f | Public housing benefits, federal |
| heatsup_f | Energy payment subsidies for low-income people, federal |
| ret_f | Retirement benefits, federal |
| cong_f | Congestible goods (transportation, public admin, etc.), federal |
|
State/local benefits: |
|
| mcaidnhom_s | Medicaid payments to nursing homes, state portion |
| mcaidnoninst_s | Medicaid payments to other than nursing homes, state portion |
| schip_s | SCHIP benefits, state |
| incssi_s | Supplemental security income (to low-income old, blind, disabled), state |
| jail_s | Incarceration costs, state/local |
| wic_s | WIC benefits, state |
| lowedu_s | Primary and secondary education, state/local |
| college_s | Public college and university support, state/local |
| ret_s | Retirement benefits, state/local |
| incwkcom_s | Workers’ compensation benefits, state/local |
| bilingual_s | Bilingual education costs, state/local |
| cong_s | Congestible goods (police, public admin, etc.), state/local |
|
For comparative purposes: |
|
| wgsal | Wages and salary income |
| gia_x | Grants-in-aid from federal to state/local governments (on a per capita basis) |
|
“Pure” public goods (all distributed on a per capita basis to the entire population, so no further documentation for these flows appears in this annex): |
|
| int_fx | Interest payments on the federal debt |
| def_fx | Defense spending, federal |
| sub_fx | Subsidies, federal |
| rowgr_fx | Grants to rest-of-world, federal |
| int_sx | Interest payments by state and local governments |
| sub_sx | Subsidies, state/local |
|
Summary groups of age profiles: |
|
| purepub | All variables in “pure” public goods group above |
| fedtax | All variables in federal tax group above |
| sltax | All variables in state/local tax group above |
| fedold | Federal benefits based on old age (oasdi_f, hi_f, smi_f, retrr_f, ret_f) |
| fedpoor | Federal benefits based on low income (mcaidnhom_f, mcaidnoninst_f, incunemp__f, incssi_f, eitcred_f, fdstmp_f, schlunch_f, incwelfr_f, rentsub_f, pubhous_f, heatsup_f) |
| fededu | Federal education benefits (scholar_f) |
| fedother | Other federal benefits (jail_f, vetben_f, refugree_f, cong_f) |
| fedben | Total federal benefits (fedold, fedpoor, fededu, fedother) |
| slold | State/local benefits based on old age (ret_s) |
| slpoor | State/local benefits based on low income (mcaidnhom_s, mcaidnoninst_s, incssi_s, schip_s, wic_s) |
| sledu | State/local education benefits (lowedu_s, college_s, bilingual_s) |
| slother | Other state/local benefits (jail_s, incwkcom_s, cong_s) |
| slben | Total state/local benefits (slold, slpoor, sledu, slother) |
| fednet | Net federal impact (taxes-benefits) |
| slnet | Net state/local impact (taxes-benefits) |
| tottax | Total taxes (fed and s/l combined) |
| totben | Total benefits (fed and s/l combined) |
| totnet | Net total impact (fed and s/l combined) |
|
Codes for immigration groups (immig variable): |
|
| 0 | All groups combined |
| 10 | Foreign-born (FB, all arrival groups combined) |
| 11 | FB, arrived 0-4 years ago |
| 12 | FB, arrived 5-9 years ago |
| 13 | FB, arrived 10+ years ago |
| 20 | Native-born (NB) of 2 FB parents (2nd generation) |
| 25 | NB with 1 FB parent, 1 NB parent (2.5 generation) |
| 30 | NB with 2 NB parents plus FB but citizen at birth (3rd generation) |
|
Codes for education groups (edu variable): |
|
| 0 | Total population (all education groups combined) |
| 1 | Less than HS |
| 2 | HS graduate or GED |
| 3 | Some college |
| 4 | Bachelor’s degree |
| 5 | Any post bachelors |
Details on Each Flow
The following documentation describes source data, aggregates to which totals are normalized, and assumptions underlying tax revenue and various benefit and public cost flow calculations used in the fiscal impact estimates. This section does not include description of flows assigned on a per capita basis.
Federal Income Taxes (variable name: inctx_f)
| Source data: | CPS individual-level variable fedtax, which is imputed by the Census Bureau’s tax model. For married couples filing jointly, the tax model assigns the whole amount to one of the spouses; but this has been recoded to give half of the amount to one spouse, half to the other. |
| Aggregate: | NIPA (National Income and Product Accounts) Table 3.2, Federal Government Current Receipts and Expenditures, personal current taxes. |
| NH assump: | Non-household (i.e., institutionalized) persons assumed to pay no income tax. |
| Topcoding: | fedtax = 99997 for years before 2011, used 2 x highest non-topcoded value for the year. |
Federal Corporate Taxes (variable name: corptx_f)
| Source data: | 80% of CPS individual-level variables for dividend and interest income (incdivid+incint) plus 20% of CPS individual-level variable for wages (incwage). |
| Aggregate: | NIPA Table 3.2. Federal Government Current Receipts and Expenditures, taxes on corporate income. (There is a much smaller amount in the state/local expenditures table titled “taxes on corporate income,” but that is considered to be similar enough to a sales tax that it is included with state sales taxes.) |
| NH assump: | Non-household persons are assumed to have 20% of assets of persons in households. Data underlying this assumption originate from U.S. National Transfer Accounts publications by Lee et al. (2011). |
| Topcoding: | incdivid = 99997 and incint = 99997 for years prior to 1999, used 2 x highest non-topcoded value for the year (incwage has imputed values for topcodes). |
Federal Excise Taxes (variable name: extx_f)
| Source data: | Excise taxes are predicted based on a regression equation estimated from data from the Consumer Expenditure Survey where household adjusted gross income (AGI) and household structure predict the amount the household spends on consumption of alcohol, tobacco, and gasoline. (These three items make up the bulk of excise taxes in most years.) This regression equation is then applied to the household sum of values in the individual-level CPS variable adjginc. Household amount is allocated to individuals in the household based on individual shares of household AGI, but dividing total spousal couple AGI evenly between both spouses. AGI amount reduced by $1,250 as in The New Americans (National Research Council, 1997) ($1,250 real 1994 dollars are adjusted to real value for each subsequent year) for first generation, as this amount is assumed to be remitted to the country of origin. |
| Aggregate: | NIPA Table 3.2. Federal Government Current Receipts and Expenditures, Excise taxes. |
| NH assump: | Non-household persons are assumed to have $0 for these taxes. |
| Topcoding: | adjginc = 99997 for years prior to 1999, used 2 x highest non-topcoded value for the year. |
FICA Taxes (variable name: fica_f)
| Source data: | CPS individual-level variable fica, which is imputed by Census Bureau’s tax model; same change made for married couples filing jointly as for federal income taxes (assigned 50/50 to spouses). |
| Aggregate: | NIPA Table 3.6. Contributions for Government Social Insurance, Employer and Employee contributions for Old-Age, Survivors, and Disability Insurance; and Hospital Insurance. |
| NH assump: | Non-household persons are assumed to pay no FICA tax. |
| Topcoding: | No topcoding. |
Federal SMI Contributions (variable name: smicon_f)
| Source data: | Allocated based on enrollment in Medicare (CPS variable himcare = 2). |
| Aggregate: | NIPA Table 3.6. Contributions for Government Social Insurance, Supplementary Medical Insurance. |
| NH assump: | Non-household persons are assumed to have $0 for these taxes. |
| Topcoding: | Not applicable. |
Federal Unemployment Contributions (variable name: unmpcon_f)
| Source data: | Allocated based on any contributions to FICA taxes in Medicare (CPS variable fica > 0) to reflect flat amount contributed by employers for each employee. |
| Aggregate: | NIPA Table 3.6. Contributions for Government Social Insurance, Unemployment Insurance. |
| NH assump: | Non-household persons are assumed to have $0 in federal unemployment contributions. |
| Topcoding: | Not applicable. |
Other Federal Taxes (variable name: othtx_f)
| Source data: | Following The New Americans (National Research Council, 1997), federal “other” has same age shape as federal income tax. |
| Aggregate: | Remaining revenue items from federal taxes and social contribution tables. |
| NH assump: | Non-household persons are assumed to have $0 for these taxes. |
| Topcoding: | Not applicable. |
State Income Taxes (variable name: inctx_s)
| Source data: | CPS individual-level variable state tax, which is imputed by Census Bureau’s tax model. For married couples filing jointly, amount is divided 50/50 between spouses. |
| Aggregate: | NIPA Table 3.3, State and Local Government Current Receipts and Expenditures, personal current taxes. |
| NH assump: | Non-household persons are assumed to have $0 for these taxes. |
| Topcoding: | statetax = 99997 for years prior to 2011; used 2 x highest non-topcoded value for the year. |
Property Tax (owners/renters) (variable names: prptxown_s, prptxrent_s)
| Source data: | For owners, CPS household-level variable proptax, for those households occupied by the owners (ownershp = 10). For renters, it is based on percentage who rent. For both, amount is allocated to adults (i.e., nondependents) in the household but weighted by family size. (For example, if a household has two families in it, an adult couple and a couple with two children, one-third of the amount would be allocated to the couple, two-thirds to the nuclear family, but then each family’s amount would be divided evenly among the two adults in that family.) |
| Aggregate: | State/local property taxes (NIPA Table 3.3, line 8), divided into that paid on owned housing versus rental housing based on shares of consumption of owned housing versus rental (Table 2.4.5. Personal Consumption Expenditures by Type of Product). Of the portion attributed to rental housing, 70% allocated to renters, 30% to property owners. |
| NH assump: | For renters, non-household population is assumed to pay $0. For owners, non-household population is assumed to pay 20% of the amount paid by the household population, based on data from the National Nursing Home Survey showing about 20% of non-household residents pay for the nursing home using their own insurance or own income/assets. The rest are either using means-tested government programs that require the resident to spend down assets or they are using help from relatives or charities, implying that they have no assets. |
| Topcoding: | Not applicable. |
Sales Taxes (variable name: salestax_s)
| Source data: | Similar to excise taxes. Excise taxes are predicted based on a regression equation estimated from data from the Consumer Expenditure Survey where household AGI and household structure predict total taxable consumption. This regression equation is then applied to the household sum of values in the individual-level CPS variable adjginc. Household amount is allocated to individuals in the household based on individual |
| shares of household AGI, but dividing total spousal couple AGI evenly between both spouses. AGI amount is reduced by $1,250 (real 1994 dollars are adjusted to real value for each subsequent year) for the first generation, as this amount is assumed to be remitted to the immigrant’s country of origin. | |
| Aggregate: | NIPA Table 3.3. State and Local Government Current Receipts and Expenditures, sales taxes. |
| NH assump: | Non-household persons are assumed to pay $0 sales tax. |
| Topcoding: | adjginc = 99997 topcode through 2010 (original value was $99999); adjginc = 9999997 topcode beginning in 2011 (original value was $9999999); before 2011, used 2 x highest non-topcoded value for the year. |
Other State/Local Taxes (variable name: othtx_s)
| Source data: | Following The New Americans (National Research Council, 1997), state/local “other” has same age shape as state/local income tax. |
| Aggregate: | Remaining revenue items from state/local taxes and social contribution tables. |
| NH assump: | Non-household persons are assumed to have $0 for these taxes. |
| Topcoding: | Not applicable. |
Federal OASDI (variable name: oasdi_f)
| Source data: | CPS individual-level variable incss (includes payments to retirees, survivors, and the disabled). |
| Aggregate: | NIPA Table 3.12 Government Social Benefits. |
| NH assump: | Same as for non-nursing home (i.e., household) population. |
| Topcoding: | Not applicable. |
Hospital Insurance (Medicare Part A) (variable name: hi_f)
| Source data: | CPS individual-level variable on Medicare enrollment (himcare = 2), but weighted by total per capita personal health care expenditures by age from the 2011 National Health Accounts. |
| Aggregate: | Total Medicare costs come from Government Social Benefits (NIPA Table 3.12), multiplied by the percentage going to Part A from Medicare Trustees Report. |
| NH assump: | These are mostly hospital costs associated with nursing home residents when they have serious complications, and such costs are very expensive. Non-household persons are assumed |
| to be consuming at twice the level of household residents. Data underlying this assumption originate from U.S. National Transfer Accounts publications by Lee et al. (2011). | |
| Topcoding: | Not applicable. |
Supplemental Medical Insurance (Medicare Parts B & D)
(variable name: smi_f)
| Source data: | (Same as for hi_f) CPS individual-level variable on Medicare enrollment (himcare = 2), but weighted by total per capita personal health care expenditures by age from the 2011 National Health Accounts. |
| Aggregate: | Total Medicare costs come from Government Social Benefits (NIPA Table 3.12), multiplied by the percentage going to Parts B & D from Medicare Trustees Report. |
| NH assump: | Same as for the household population. |
| Topcoding: | Not applicable. |
Medicaid Payments to Nursing Homes
(variable names: mcaidnhom_f, mcaidnhom_s)
| Source data: | Federal and state/local levels are coded separately. Because this flow is for persons not in the household population, CPS does not have indicators for this. Instead, we assign these costs based on the percentage of population in nursing homes, ages 65 and older, as measured in IPUMS/ACS for that year. These sources do not have generational detail, so the profile only differentiates between the first generation and native-born generations; (the second and third-plus generations are assigned the weight for native-born [second and higher] generations. |
| Aggregate: | Government Social Benefits (NIPA Table 3.12, Medicaid), multiplied by the proportion that Medicaid paid to nursing homes as measured in National Health Expenditures data. Also separated into federal and state/local portions from the National Health Expenditure data. |
| NH assump: | Not applicable. |
| Topcoding: | Not applicable. |
Medicaid Payments to Other Than Nursing Homes
(variable names: mcaidnoninst_f, mcaidnoninst_s)
| Source data: | Federal and state/local levels are coded separately. Assigned based on Medicaid enrollment (CPS variable himcaid = 2) but weighted by total per capita personal health care expenditures by age from the 2011 National Health Accounts. |
| Aggregate: | Government Social Benefits (NIPA Table 3.12, Medicaid), multiplied by proportion Medicaid paid to non-nursing homes from National Health Expenditures data and also separated into federal and state/local portions from National Health Expenditure data. |
| NH assump: | These are mostly hospital costs associated with nursing home residents when they have serious complications, and such costs are very expensive. Non-household persons are assumed to be consuming at twice the level of household residents. Data underlying this assumption originate from U.S. National Transfer Accounts publications by Lee et al. (2011). |
| Topcoding: | Not applicable. |
Unemployment Insurance Income (variable name: incunemp_f)
| Source data: | CPS individual-level variable incunemp. This variable does contain some payments from private sources, but as long as those are not huge or radically different by age or immigrant generation, it is corrected for in the aggregate adjustment. |
| Aggregate: | Government Social Benefits (NIPA Table 3.12, unemployment insurance). |
| NH assump: | Non-household persons are assumed to have $0 for this benefit. |
| Topcoding: | incunemp = 99997 for years 1995, 1996, 1998, 2000-2007, 2009-2013; replace with 2 x top value for the non-topcoded observations. |
Railroad Retirement (variable name: retrr_f)
| Source data: | CPS individual-level variable increti1 (amount of income from first source) and srcreti1 = 5 (receives U.S. Railroad retirement pension); similarly increti2 and srcreti2 = 5 for the second source of income. If there is an amount attributed to someone with a spouse in the household, that amount is divided evenly between the two spouses. |
| Aggregate: | Government Social Benefits (NIPA Table 3.12, U.S. railroad retirement). |
| NH assump: | Same as household population. |
| Topcoding: | increti1 and increti2 = 99997 for years up to and including 1998 and from 2011 forward. Substituted 2 x highest non-topcoded value. |
Supplemental Security Income (variable names: incssi_f, incssi_s)
| Source data: | Federal and state/local levels are coded separately. CPS individual-level variable incssi. |
| Aggregate: | Government Social Benefits (NIPA Table 3.12), SSI federal and state/local amounts are listed separately. |
| NH assump: | Same as household population. |
| Topcoding: | Not applicable. |
EITC (variable name: eitcred_f)
| Source data: | CPS individual-level variable eitcred is imputed by Census Bureau’s tax model. Allocation is made by summing all eitcred in a family unit and dividing evenly among people in the family. |
| Aggregate: | Government Social Benefits (NIPA Table 3.12, line 25, Refundable Tax Credits). |
| NH assump: | Non-household persons are assumed to have $0 for this benefit. |
| Topcoding: | Not applicable. |
Food Stamps/SNAP (variable name: fdstmp_f)
| Source data: | CPS household-level variable stampval (value of food stamps received), divided equally among all household members. |
| Aggregate: | Government Social Benefits (NIPA Table 3.12, federal SNAP benefits). |
| NH assump: | Non-household persons are assumed to have $0 for this benefit. |
| Topcoding: | Not applicable. |
Federal School Lunch Program (variable name: schlunch_f)
| Source data: | CPS household-level variable lunchsub, which indicates households where some or all of the children received free or reduced price school lunches, and CPS household-level variable frelunch, which indicates how many children in the household received free or reduced price lunches. An equal value is assigned to all children households with lunchsub = 1 and is allocated to all children ages 5-18, starting with the youngest, until reaching the total number in the household given in frelunch. (There is no individual-level indicator of which children received the free lunches.) |
| Aggregate: | Federal budget historical tables (Table 11.3—Outlays for Payments for Individuals by Category and Major Program, child nutrition and special milk programs). |
| NH assump: | Non-household persons are assumed to have $0 for this benefit. |
| Topcoding: | Not applicable. |
Welfare (variable name: incwelfr_f)
| Source data: | This includes AFDC, Temporary Assistance for Needy Families, welfare reform benefits, and general assistance. CPS individual-level variable incwelfr. Allocation is made by summing all incwelfr in a family unit and dividing evenly among people in the family. |
| Aggregate: | Government Social Benefits (NIPA Table 3.12, family assistance and general assistance). |
| NH assump: | Non-household persons are assumed to have $0 for this benefit. |
| Topcoding: | Not applicable. |
Incarceration Costs (variable names: jail_f, jail_s)
| Source data: | Percentage institutionalized under age 65 from IPUMS/ACS. We were only able to distinguish difference between the first and native-born (second and higher) generations. Federal and state/local levels are coded separately. |
| Aggregate: | NIPA Table 3.16. Government Current Expenditures by Function, prison costs, separated out by federal versus state/local levels. |
| NH assump: | Not applicable. |
| Topcoding: | Not applicable. |
Military Retirement and Other Veteran’s Benefits (variable name: vetben_f)
| Source data: | CPS individual-level variables incvet, plus increti1 (amount of income from first source) if srcreti1 = 3 (receives military pension), and similarly increti2 and srcreti2 for the second source of income. Amounts to veteran with spouse in the household is divided equally between spouses. |
| Aggregate: | Government Social Benefits (NIPA Table 3.12, line 17 Veterans’ benefits). |
| NH assump: | Same as for non-nursing home population. |
| Topcoding: | Not applicable. |
Refugee Support (variable name: refugee_f)
| Source data: | Assigned equally to all 1st generation immigrants. |
| Aggregate: | Federal Budget Historical Table 11.3—Outlays for Payments for Individuals by Category and Major Program: 1940–2020, “refugee assistance.” |
| NH assump: | $0. |
| Topcoding: | Not applicable. |
Student Aid (cash scholarships) (variable name: scholar_f)
| Source data: | CPS individual-level variable incedu if CPS variable srcedu indicates that source of the funding is from government, for ages 18-24. |
| Aggregate: | Government Social Benefits (NIPA Table 3.12, for education). |
| NH assump: | $0. |
| Topcoding: | For years 1997 and 2011-2013, topcoded 99997. Substituted 2 x highest non-topcoded value. |
Rent Subsidies (variable name: rentsub_f)
| Source data: | CPS household-level variable rentsub indicates if the household received a rent subsidy. This is attributed equally to individuals in the household (so individuals in smaller households with subsidy have greater attribution). |
| Aggregate: | Historical Federal budget tables, Table 11.3—Outlays for Payments for Individuals by Category and Major Program: 1940–2019 gives amount spent on housing, Table 12.3—Total Outlays for Grants to State and Local Governments by Function, Agency, and Program: 1940–2015, gives part used for rent subsidies on private property as opposed to government-owned public housing). |
| NH assump: | $0. |
| Topcoding: | Not applicable. |
Public Housing (variable name: pubhous_f)
| Source data: | CPS household-level variable indicating if household is part of a government housing project, allocated equally to all individuals in public housing households. |
| Aggregate: | Historical Federal budget tables, Table 11.3—Outlays for Payments for Individuals by Category and Major Program: 1940–2019 gives amount spent on housing, Table 12.3— |
| Total Outlays for Grants to State and Local Governments by Function, Agency, and Program: 1940–2015, gives part used for public housing as opposed to rent subsidies). | |
| NH assump: | $0. |
| Topcoding: | Not applicable. |
Energy Assistance (varname: heatsup_f)
| Source data: | CPS household-level variables indicating if household received energy assistance (heatsub) and if so how much it was worth (heatval). Value divided equally among all household members. |
| Aggregate: | Government Social Benefits (NIPA Table 3.12, energy assistance). |
| NH assump: | $0. |
| Topcoding: | Not applicable. |
Government Retirement Benefits (federal and s/l separately) (variable name: ret_f/ret_s)
| Source data: | For federal, CPS individual-level variable increti1 (amount of income from first source) and srcreti1 = 2 (receives federal government pension), and similarly increti2 and srcreti2 for the second source of income. For state/local, CPS individual-level variable increti1 (amount of income from first source) and srcreti1 = 4 (receives state/local government pension), and similarly increti2 and srcreti2 for the second source of income. For both age profiles, if the amount was to a person with a spouse in the household, the amount is allocated to both spouses equally. |
| Aggregate: | For Federal, Historical Federal budget tables, Table 11.3—Outlays for Payments for Individuals by Category and Major Program: 1940–2019. State/local: NIPA Table 7.23. Transactions of State and Local Government Defined Benefit Pension Plans. |
| NH assump: | For both, same as for household population. |
| Topcoding: | increti1 and increti2 = 99997 for < = 1998 and > = 2011. Substituted 2 x highest value. |
Congestible Goods–Federal and State/Local (variable name: cong_f / cong_s)
| Source data: | None. Same by all ages by assumption. |
| Aggregate: | Residual, after all accounted for flows and “pure” public goods are subtracted from total expenditures (NIPA table 3.2 for Federal, 3.3 for State/Local). |
| NH assump: | Same as for household population. |
| Topcoding: | Not applicable. |
State Child Health Insurance Program (SCHIP) (variable name: schip)
| Source data: | CPS individual-level variable indicating if person ages 0-18 was enrolled in health insurance through SCHIP. No cost information so age shape is just based on enrollment. CPS enrollment rates are known to be less than estimates from other sources, but as long as there is no correlation between enrollment discrepancy and age or immigration status then the aggregate adjustment will take care of the error. |
| Aggregate: | National Health Accounts, total spent by SCHIP program (includes pure federal amount and amount spent by states, both of their own funds and from grants-in-aid from federal to state governments). |
| NH assump: | $0. |
| Topcoding: | Not applicable. |
WIC (variable name: schip)
| Source data: | CPS individual-level variable gotwic indicates if a woman was receiving WIC benefits. Allocated equally to all of those women and any of their children in the household ages 0-4. |
| Aggregate: | NIPA Table 3.12, Government Social Benefits, line for State/local “other” which is WIC, but also includes some small amounts for foster care and adoption assistance that were not able to be separated out. |
| NH assump: | $0. |
| Topcoding: | Not applicable. |
Primary and Secondary Education (variable name: lowedu_s)
| Source data: |
|
|
|
| Aggregate: | Table 3.16. Government Current Expenditures by Function, expenditures on primary and secondary education. |
| NH assump: | 0. |
| Topcoding: | Not applicable. |
Public College and Other Postsecondary (variable name: college_s)
| Source data: | Based on enrollment in college, with half weight given to those half-time enrolled. The enrollment data uses the CPS variable “schlcoll.” As noted above, the universe changes from ages 16-24 before 2013 to 16-54 in 2013. For the projected age profiles, the 2013 proportions enrolled are used for ages 25-54, while the pooled sample of 2011, 2012, and 2013 is used to calculate proportion enrolled for ages 16-24. For the historical age profiles, the comparison between 1994 and 2013 suffers from this change in data collection, but the impact is minor because of the low levels of higher education enrollment for age 25+ and because of the adjustment of per capita age profiles to national-level aggregate flows. Thus, there is a slight |
| discrepancy in the age of the public higher education benefit receipt over the period, but no difference in the total expenditure or average expenditure across the total population. | |
| Aggregate: | Table 3.16. Government Current Expenditures by Function, expenditures on higher education (federal and state/local combined). |
| NH assump: | 0. |
| Topcoding: | Not applicable. |
Workers’ Compensation (variable name: incwkcom_s)
| Source data: | CPS individual-level variable incwkcom. |
| Aggregate: | Government Social Benefits (NIPA Table 3.12, federal and s/l worker’s compensation combined, but this is mostly state/local). |
| NH assump: | 0. |
| Topcoding: | 99997 for 1995, 1996, 1998-2001, 2003, 2004, 2006, 2007, 2009-2013, replaced with 2 x maximum value. |
Bilingual Education (variable name: bilingual_s)
| Source data: | Age shape comes from the % limited English proficiency (LEP) for first generation and for second generation with two foreign-born parents (see details on lowedu_s for source data for LEP status). Note that this is supposed to represent the costs of a particular educational program designed to teach in two languages. It is included as a cost beyond just the general cost of educating students with LEP, which is already included in the lowedu_s age profile. |
| Aggregate: | 2.5% of total amount spent on elementary and secondary education (this is the same assumption used in NA). |
| NH assump: | 0. |
| Topcoding: | Not applicable. |
Details on Administrative Totals
Each measured flow is adjusted by a single multiplicative factor so that the population-weighted aggregate is consistent with totals reported in the annual tables of the National Income and Product Accounts, as compiled by the Bureau of Economic Analysis (see http://www.bea.gov/national [November 2016]). Note the handling of federal grants-in-aid to state and local governments: they are counted as government expenditures and not as state and local revenue, to avoid double counting this flow. An example for 2013 is shown, but all years are calculated in a similar fashion:
| NIPA Table Extracts for 2013 (Billions) | ||||
|---|---|---|---|---|
| Table 3.1 | Table 3.2 | Table 3.3 | ||
| Consolidated | Federal | State/Local | ||
| Receipts | 4,788.6 | 3,113.0 | 2,125.6 | |
| Tax receipts | 3,283.6 | 1,811.8 | 1,471.8 | [1] |
| Contributions for government social insurance | 1,109.9 | 1,092.3 | 17.7 | [1] |
| Income receipts on assets | 244.4 | 164.7 | 79.7 | |
| Transfer receipts [2] | 180.4 | 59.5 | 570.8 | |
| Portion that is federal grants-in-aid (GIA) to s/l | --- | --- | 450.0 | |
| Surplus of gov't enterprises | (29.6) | (15.3) | (14.3) | |
| Expenditures | 5,662.9 | 3,762.1 | 2,350.8 | |
| Consumption expenditures | 2,547.6 | 963.0 | 1,584.5 | |
| Portion spent on defense | 617.1 | 617.1 | --- | [2] |
| Consumption expenditures LESS Defense | 1,930.5 | 345.9 | 1,584.5 | [1] |
| Government social benefits to persons | 2,372.2 | 1,806.8 | 565.4 | [1] |
| Government social benefits to rest of world | 18.9 | 18.9 | --- | |
| Other transfer payments [2] | 46.4 | 496.3 | --- | |
| Portion that is federal grants-in-aid (GIA) to s/l | --- | 450.0 | --- | [1] |
| Interest payments | 617.7 | 417.4 | 200.3 | [2] |
| Subsidies | 60.2 | 59.7 | 0.5 | [2] |
| Amounts Included in Fiscal Impacts Analysis | ||||
| GIA are attributed in the analysis as federal expenditures and subtracted from s/l to avoid double counting. | ||||
| Total | Federal | State/Local | ||
| Total Taxes | 4,393.6 | 2,904.1 | 1,489.5 | |
| Tax receipts | 3,283.6 | 1,811.8 | 1,471.8 | |
| Contributions for government social insurance | 1,109.9 | 1,092.3 | 17.7 | |
| Total Benefits | 4,302.6 | 2,602.7 | 1,699.9 | |
| Consumption expenditures LESS Defense | 1,930.4 | 345.9 | 1,584.5 | |
| Government social benefits to persons [3] | 2,372.2 | 1,806.8 | 565.4 | [3] |
| Federal grants-in-aid (GIA) to s/l | - | 450.0 | (450.0) | |
| Taxes less benefits | 91.0 | 301.4 | (210.4) | |
| Public Goods | 1,360.2 | 1,159.4 | 200.8 | |
| Defense | 617.1 | 617.1 | --- | [2] |
| Interest | 617.7 | 417.4 | 200.3 | [2] |
| Subsidies | 60.2 | 59.7 | 0.5 | [2] |
| Transfers and social benefits to ROW | 65.2 | 65.2 | --- | [2] |
| [1] Included in all fiscal impacts analyses as congestible goods assigned to individuals. | ||||
| [2] Non-congestible goods included in some analysis scenarios, assigned on a marginal or per capita basis. | ||||
| [3] Includes $450.0B in federal grants-in-aid to state/local government. Thus, the consolidated amount equals federal amount + state/local amount - federal grants-in-aid. | ||||
Estimates of Education Transmission and Projection of Educational Attainment
In the future-looking analysis, we want to estimate the fiscal impact of persons in the future and that impact differs by education—persons of different education earn, pay taxes, qualify for and accrue benefits at different levels. For those people who begin the 75-year projection period very young or are born in the projection period, we need to estimate which education group they will be in when they grow up. This section describes the process used to project education for those who are ages 0-24 in 2012 or are born during the projection.
Estimating Education Prediction Functions
Using CPS samples from early years, we identified a cohort of parents who are age 25 or older (and thus have completed their educations), based on the co-residence of young children in their households. We then identified that cohort of children in a later year when the children are age 25 or older (and thus also likely to have completed their educations). Both parents and children are disaggregated, based on parental birth region, and separate CPS samples are taken as distinct data points. This gives a sufficient sample to estimate the average expected educational attainment of children based on the average educational attainment of parents. This was done separately by parental birth region, and a separate set of predictions was made for U.S.-born children versus non-U.S.-born children.
Specifically, the data come from CPS samples from 1994 to 2014. We observe the children’s educational attainment each year from 2009 to 2014 and compare that to the parental educational attainment in each year from 1994 to 1999, generating a set of six paired parent-child averages for each region. We could not observe parental cohorts earlier than 1994 because there were no data collected on birthplace in earlier samples. We could not observe children’s cohorts later than 2014 because that was the most recent CPS sample available at the time the analysis was done. The comparisons were done separately by regional groups of parental birth and also by whether the child was U.S. born or foreign born.
For the U.S.-born offspring, a cohort of parents for each region in each year X (where X varies from 1994 to 1999) is identified by the following characteristics: they have at least one co-resident U.S.-born own-child, ages 10-16, in the household (own-child as imputed by IPUMS-CPS) and the parent was born in that region. The cohort of children of these parents is identified in year X + 15 (where X + 15 varies from 2009 to 2014) by the following characteristics: they are ages 25-31, were born in the United States, and indicate that they have at least one parent born in the designated region.
For the foreign-born child case, the comparison is similar, except that the own-child of the parents must be born in the parental region and the children identified in the children’s cohort must be born in the parental region.
The 10-16 year-old age group in year X was chosen to be as large an age group as possible to increase the sample size, but it had to also satisfy two additional criteria: (1) young enough that the children in year X were likely to still be living in the parental home, and (2) old enough that the children in year X + 15 have mostly all completed their education or at least achieved the highest educational category.
Educational outcomes were based on the CPS variable for years of schooling, but were grouped into more categories than the educational groups used for the fiscal flows analysis. This difference allowed for better identification of the parent-child educational relationships, but the education predictions of the offspring were recoded into the five educational attainment categories for use in the 75-year discounted flows calculations.
The parental birth regions were as follows: United States (or born abroad to citizen parents), Mexico, Central America (excluding Mexico), South America, Canada, Europe, Africa, East Asia, Southeast Asia, Other Asia (Eurasia, Central Asia, Oceania). The average education of the parent and child for each region for six consecutive CPS samples was calculated, and a regression was run to predict children’s average educational attainment based on the parental average educational attainment. Canada and Africa were not included in the regressions because the sample sizes in the average were too small (in most years, fewer than 50 observations in the child cohort group).
The charts below (Figures 8-24 and 8-25) show the resulting estimates and linear regression equations that were used to predict educational attainment based on parental education. Two separate regression equations were used for two sets of regions: one included Mexico, South America, and Central America; the other included all of the other regions. Although the predictions for U.S.-born children of U.S.-born parents are not needed in estimating the 75-year discounted net fiscal impact of immigrants, the prediction equation for U.S.-born children of a U.S.-born parent was estimated as well for comparative purposes. The results are shown below. The parent-child paired averages are plotted as points; the predicted regression line representing educational assimilation is shown as well.
Projected Future Taxes and Benefits
Each tax and benefit flow must be projected forward 75 years from the starting year of 2012. This was done in several different ways to create different scenarios of future fiscal flows.
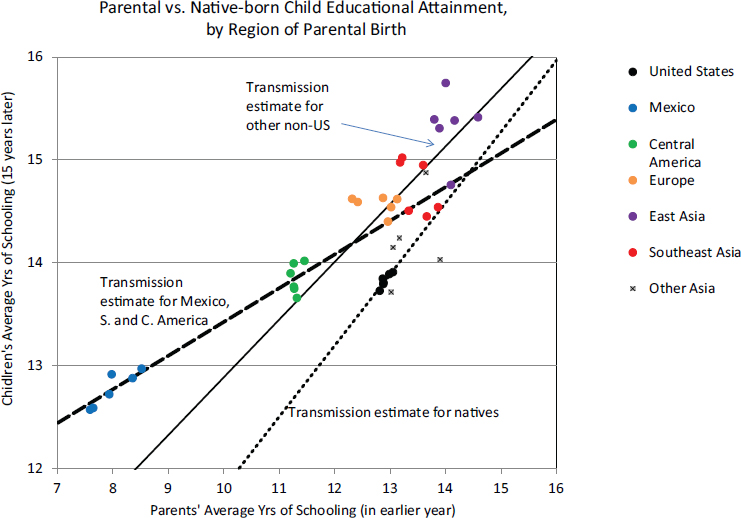
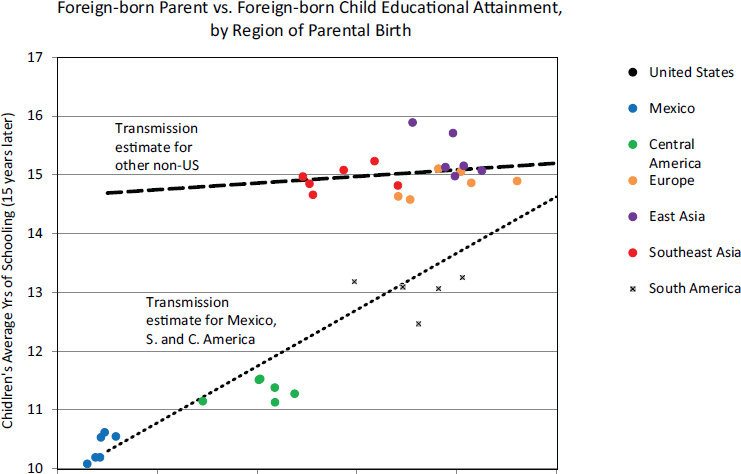
The simplest approach to understand is that for the no budget adjustments scenario. This scenario takes the per capita tax and benefit age profiles of 2012 and increases them each year by the assumed rate of productivity growth, 1 percent in our projections. This approach implies that the federal and state/local governments change nothing about its tax rates and spending and that no other aspects of the economy change. All per capita amounts at all ages, education, and immigration groups simply grow at 1 percent per year. This scenario leads to quickly increasing levels of debt, which the federal government may be able to sustain for quite some time but not indefinitely. State and local budgets function in a very different statutory environment compared to the federal government and typically have balanced-budget requirements that would constrain their ability to tax and spend in this fashion, but no provision is made for that requirement in this scenario.
More complex is the scenario that uses CBO’s long-term budget projections and matches the growth of various fiscal flows to be consistent with that scenario. At the time the projection work was done, the most recent report was CBO’s 2014 Long-Term Budget Outlook, published in July 2014 (Congressional Budget Office, 2014a, https://www.cbo.gov/publication/45471 [November 2016]), with supplemental data tables available at https://www.cbo.gov/about/products/budget-economic-data#1 [November 2016]).
The method used by the panel for matching to the projections in the CBO report is simple for flows that are the same for all age groups. They are simply increased year over year by the same per capita growth rate reported in the supplemental tables. This is the case for general government congestible spending such as public administration, police, fire, etc. It is also the case when we apply public goods such as defense or interest on public debt on an average cost basis. When these items are applied on a marginal cost basis—that is, when they are assigned as zero cost attributed to immigrants—the nonimmigrant amounts are estimated to be a per capita amount that generates an aggregate level of these flows if the per capita amount is paid by each nonimmigrant (with the numbers of nonimmigrants provided by the Pew Research Center projections). Of course, the per capita value in the marginal cost case is only relevant for the one piece of data reported in Chapter 8 where 25-year-old natives are compared to 25-year-old immigrants.
Matching the CBO report for flows that do vary by age is more complex. In this case, in order to match overall per capita growth rates projected by CBO, we must project the amount of growth or decline that is inherent in population age structure by using the population projections from the Pew Research Center to find a baseline population-driven change and then calculate the additional change above or below that necessary to match CBO projections. To illustrate the calculation, imagine that a hypo-
thetical benefit flow is projected by CBO to rise from 100 to 110 per person in a year. If that flow is assigned to all age groups equally, then the adjustment to match the CBO projection is simply to increase the estimated age profile by 10 percent at each age. Imagine, however, that this flow mostly benefits the elderly. If the population of interest is aging, then from one year to the next, without altering the age profile at all, the population per capita flow may grow from 100 in year 1 to 102 in year 2, simply because the population is aging. To make the overall per capita flow equal to 110, we must first calculate the population-driven change of 100 to 102, and then multiply the overall age profile by 110/102 = 1.0784 to grow the rest of the necessary amount. In this illustrative case, the overall per capita age profile must increase by only 7.8 percent to have the average flow increase by 10 percent.
The CBO projections cover only federal flows, so the panel’s projections must make assumptions about what will happen with state and local government taxing and spending in order to project those flows into the future. For this case, we assumed both per capita spending and revenue grow at the same rate as per capita GDP in CBO’s long-term budget outlook (Congressional Budget Office, 2014a). This holds the state-funded portion of Medicaid to a lower growth rate than is assumed for the program as a whole. This assumption implies that the federal government will assume any excess costs.
The CBO baseline projection is intended to be the best guess as to government budgets if current policy is completely unchanged. It does not include any economic feedbacks from this no-policy-change scenario but simply looks at current government tax and spending policy and combines that with the Census Bureau’s population projections and assumptions about the future of economic variables such as interest rates. In this scenario, then, there is no attempt to deal with any future fiscal imbalances that may arise, and thus the overall deficit and national debt rise sharply.
Thus, the panel employed a third scenario in which, relative to the CBO baseline case, taxes are increased and benefits decreased (on a 50/50 basis) to achieve $3 trillion in deficit reduction by 2035, relative to the baseline scenario. By trying different levels of tax increases and benefit reductions on an ad hoc basis, we found that the path that achieved this $3 trillion in reduction was about 3 percent higher, by 2035, in taxes paid and about 3 percent lower in benefits received, compared to 2013 in the CBO baseline case. State and local budgets in this scenario are handled similarly to the way they are treated in the CBO baseline scenario.
Projected Demography: Survivorship, Emigration, and Number of Descendants
The rates of fertility, mortality, and emigration used in projecting future survivorship, numbers of surviving offspring, and probability of remaining in the United States (as opposed to emigrating), are from the Pew Research Center projections discussed above in Chapter 2. Where the Pew Research Center rates vary by race/ethnic group, these have been combined by current race/ethnic composition to produce an overall population average.
Five generations of descendants are counted in the demographic projections, to cover all potential births for the 75-year forward-looking observation period.
This page intentionally left blank.


