


Below is the uncorrected machine-read text of this chapter, intended to provide our own search engines and external engines with highly rich, chapter-representative searchable text of each book. Because it is UNCORRECTED material, please consider the following text as a useful but insufficient proxy for the authoritative book pages.
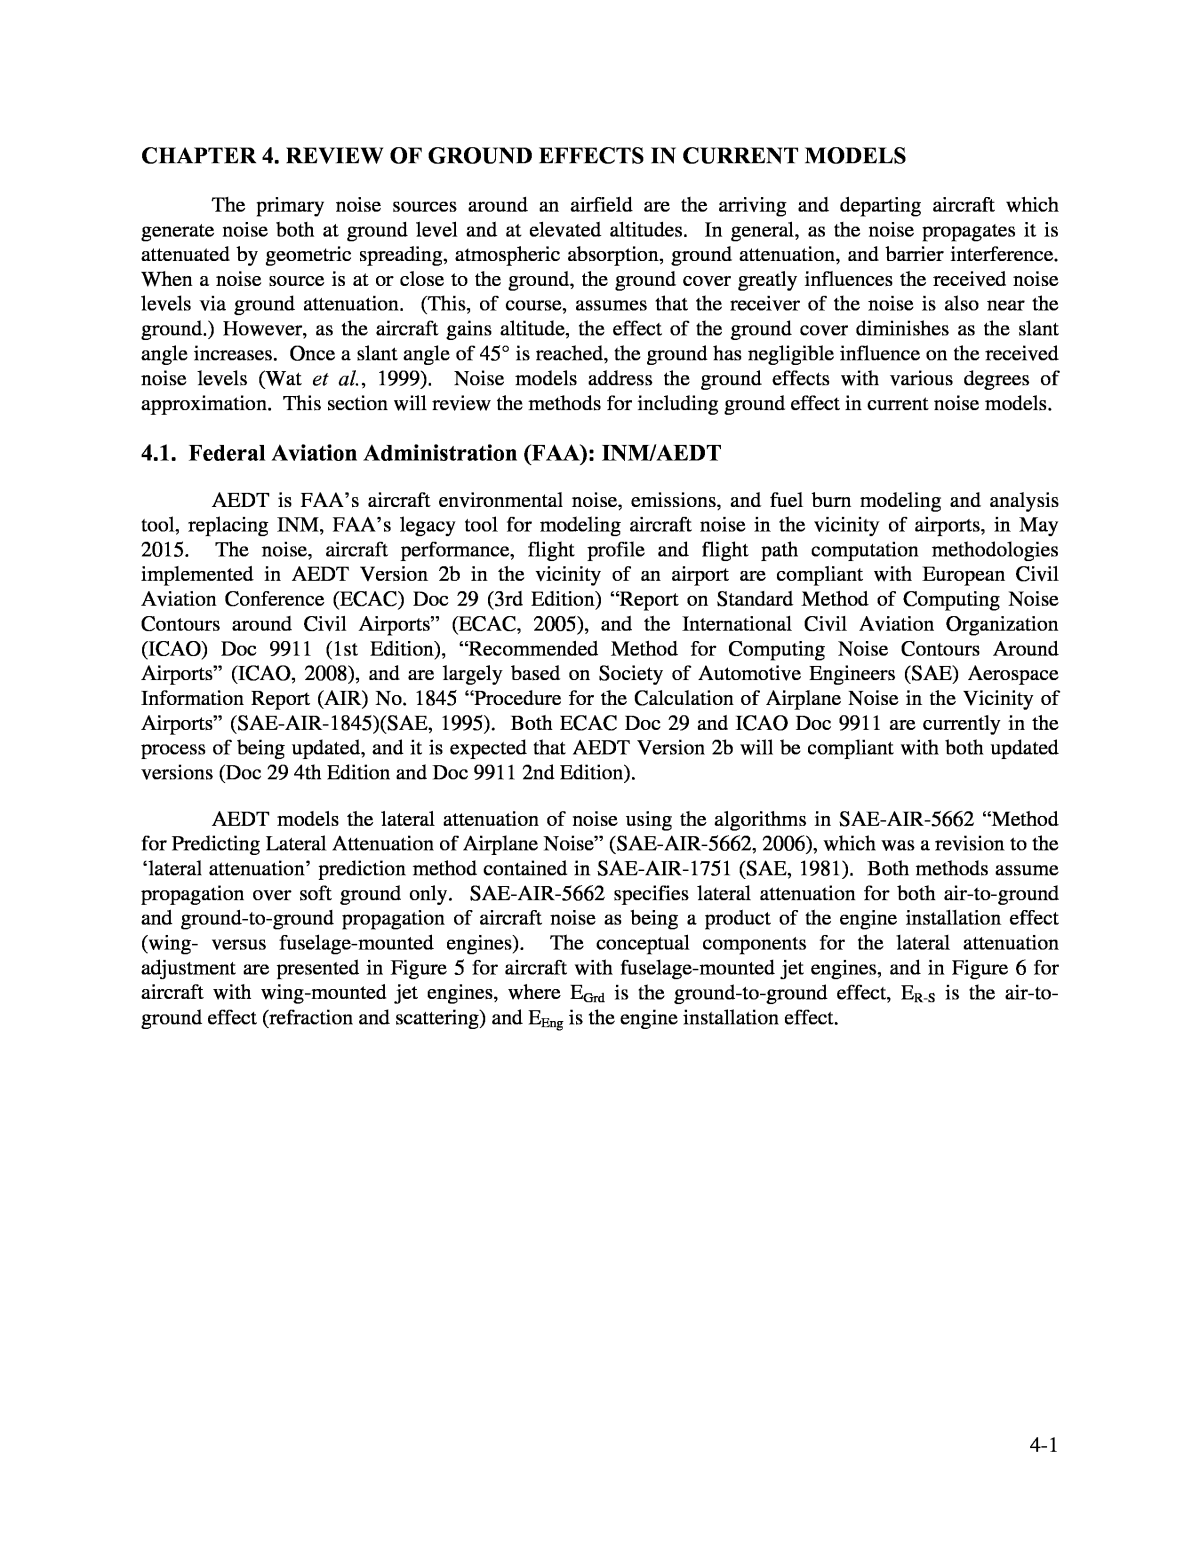
4-1 CHAPTER 4. REVIEW OF GROUND EFFECTS IN CURRENT MODELS The primary noise sources around an airfield are the arriving and departing aircraft which generate noise both at ground level and at elevated altitudes. In general, as the noise propagates it is attenuated by geometric spreading, atmospheric absorption, ground attenuation, and barrier interference. When a noise source is at or close to the ground, the ground cover greatly influences the received noise levels via ground attenuation. (This, of course, assumes that the receiver of the noise is also near the ground.) However, as the aircraft gains altitude, the effect of the ground cover diminishes as the slant angle increases. Once a slant angle of 45° is reached, the ground has negligible influence on the received noise levels (Wat et al., 1999). Noise models address the ground effects with various degrees of approximation. This section will review the methods for including ground effect in current noise models. 4.1. Federal Aviation Administration (FAA): INM/AEDT AEDT is FAAâs aircraft environmental noise, emissions, and fuel burn modeling and analysis tool, replacing INM, FAAâs legacy tool for modeling aircraft noise in the vicinity of airports, in May 2015. The noise, aircraft performance, flight profile and flight path computation methodologies implemented in AEDT Version 2b in the vicinity of an airport are compliant with European Civil Aviation Conference (ECAC) Doc 29 (3rd Edition) âReport on Standard Method of Computing Noise Contours around Civil Airportsâ (ECAC, 2005), and the International Civil Aviation Organization (ICAO) Doc 9911 (1st Edition), âRecommended Method for Computing Noise Contours Around Airportsâ (ICAO, 2008), and are largely based on Society of Automotive Engineers (SAE) Aerospace Information Report (AIR) No. 1845 âProcedure for the Calculation of Airplane Noise in the Vicinity of Airportsâ (SAE-AIR-1845)(SAE, 1995). Both ECAC Doc 29 and ICAO Doc 9911 are currently in the process of being updated, and it is expected that AEDT Version 2b will be compliant with both updated versions (Doc 29 4th Edition and Doc 9911 2nd Edition). AEDT models the lateral attenuation of noise using the algorithms in SAE-AIR-5662 âMethod for Predicting Lateral Attenuation of Airplane Noiseâ (SAE-AIR-5662, 2006), which was a revision to the âlateral attenuationâ prediction method contained in SAE-AIR-1751 (SAE, 1981). Both methods assume propagation over soft ground only. SAE-AIR-5662 specifies lateral attenuation for both air-to-ground and ground-to-ground propagation of aircraft noise as being a product of the engine installation effect (wing- versus fuselage-mounted engines). The conceptual components for the lateral attenuation adjustment are presented in Figure 5 for aircraft with fuselage-mounted jet engines, and in Figure 6 for aircraft with wing-mounted jet engines, where EGrd is the ground-to-ground effect, ER-S is the air-to- ground effect (refraction and scattering) and EEng is the engine installation effect.
T The air-to FIGURE 5. FIGURE 6. he ground-to -ground com Conceptual aircraft w Conceptual aircraft -ground com ponent of SA components ith fuselage components with wing-m ponent of SA E-AIR-5662 of long-rang -mounted en of long-rang ounted eng E-AIR-5662 applied in AE e lateral att gines in SA e lateral att ines in SAE- applied in A DT is prese enuation for E-AIR-5662 enuation for AIR-5662. EDT is pres nted in Figur the sound fr . the sound fr ented in Figu e 8. 4-2  om  om re 7.
FIGURE 7. Illustration of ground-to-groun d component of lateral attenuation. 4-3 Â
T originally (1964; 19 modified N according propagatio adjustmen T surfaces i AIR-5662 airplanes FIGU he ground-to developed a 65), carried o in SAE-AIR- oise propaga to aircraft t n over soft t to the noise he validation s shown in Fi âs lateral att with wing-mo RE 8. Illus -ground com s an empirica ut for the Bu 5662, in orde tion is repre ype, aircraft ground, an -power-dista of using S gure 9 for air enuation alg unted engine tration of air ponent of th l equation fo ilding Resea r to separate sented in AE operation typ d other env nce (NPD) da AE-AIR-566 planes with f orithm over s. -to-ground c e lateral att r SAE-AIR- rch Establish out the engin DT with a e and noise ironmental a tabase in AE 2âs lateral at uselage-mou flat, soft gr omponent o enuation adj 1751 based o ment in the U e installation database of metric. Lat nd geometr DT. tenuation alg nted engines ound surfac f lateral atte ustment over n work of P nited Kingd effects. NPD data, w eral attenuat ic effects, a orithm over . The validat es is shown nuation. soft ground arkin and Sc om, and then hich are sp ion effects d re applied flat, soft g ion of using in Figure 1 4-4 Â was holes later ecific ue to as an round SAE- 0 for
a FIGURE 9 (lower soli irplanes wit . Predicted S d line) and 1 h fuselage-m AE-AIR-56 500 m (uppe ounted engi 62 lateral at r solid line) nes operatin tenuation fo and lateral g from Lond r lateral dist attenuations on Gatwick ances of 450 measured fo Airport (LG 4-5 Â m r W).
G effects of ï· ï· ï· ï· ï· FIGURE 10 (lower soli airplanes w eneral uncert noise propag Allaire, D Quantifica Engineerin Miller, N. Hanson In Fleming, G Parks, Fed Lee, Cynth National P Volpe Nat Fleming, G Sound Lev Engineerin . Predicted d line) and 1 ith wing-mo ainty quantif ation over ha ouglas, No tion of an g and System P., et al., A c. Project 295 . G., et al., eral Interagen ia, âINM Mo ark Backcou ional Transpo regg, Senzig els over an A g Journal, V SAE-AIR-56 500 m (uppe unted engine ication and v rd ground, ca el, George Aviation Safety 126 ircraft Nois 860.20, June Assessment cy Committe deling in Su ntry Locatio rtation Syste , David and coustically H .50, n.1, 2002 62 lateral a r solid line) s operating alidation of t n be found in , Willcox, Environment (2014) 14-24 e Model Va 2002. of Tools fo e on Aviatio pport of Asse ns,â Technica ms Center, Ju John-Paul Cl ard Water S , pp. 19-29. ttenuation fo and lateral from Londo he algorithm the followin Karen, Co al Toolsuite . lidation Stu r Modeling n Noise Repo ssment of IN l Memorand ne 2, 2009. arke. 2002. " urface: Loga r lateral dis attenuations n Gatwick A s in AEDT an g literature: intin, Rebe , January dy, Harris, M Aircraft Noi rt, March 20 M Accuracy um, Cambri Lateral Atten n Airport Stu tances of 450 measured fo irport (LGW d INM, incl cca, Uncer 2014, Relia iller, Mille se in the Na 05. for Grand Ca dge, MA: Jo uation of Ai dy", Noise co 4-6 Â m r ). uding tainty bility r and tional nyon hn A. rcraft ntrol
ï· ï· ï· ï· 4.2. Fed T (FHWA) Jongâs m averaging results of In geometry, Figure 11 show grou solid gree receivers. solid red represent Fleming, G Wallops F Boeker, E Gregg, An Analysis a AEE-2012 Boeker, Er Modeling December Plotkin, K Modeling, eral Highw he Traffic N to calculate ethod outline of ground i Geometric Th TNM, a âr ground imp . The solid b nd zones. E n lines repre The dashed lines with ar rows of build regg, et al. light Facility ric, Ahearn, alysis of M t Four Natio -07. ic, Schulz, N Cumulative N 2012, DOT-V enneth J., e April 2013, D ay Adminis oise Model noise levels d above to mpedance fo eory of Diff unâ is define edance, rece lack lines wi ach ground sent terrain li green polygo rows represe ings that pro 2003. Engin Study, Octob Meghan, Sc odeling Cum nal Parks, D oah, Lee, C oise from S NTSC-FAA t al., Detail OT-VNTSC tration (FH (TNM) wa near roadway calculate tra r multiple gr raction to acc d by the us iver location th arrows rep zone has a s nes that can ns represent nt barriers th vide some att FIGURE 1 e Installation er 2003, NA hulz, Noah, ulative Noi ecember 201 ynthia, Roof imultaneous -12-08.II, DO ed Weather -FAA-14-08 WA): TNM s developed s. It uses a ffic noise ov ound types. ount for their er entering d s, etc. An resent segme pecific effect be used to m tree zones wi at can be ei enuation but 1. Example Effects of F SA/TM-2003 Lee, Cynthia se from Sim 2, DOT-VNT , Christopher Flights; Volu T-FAA-AE and Terrain , Wyle Repo for the Fed combination er flat terra If noise bar effect ata related t example of nts of roadw ive flow resi odel elevatio th sufficient ther walls or not as much setup in TNM our Civil Tr -212433. , Roof, Chr ultaneous F SC-FAA-12 , Fleming, G me 2: Supp E-2012-07. Analysis f rt 13-01. eral Highwa of straight in along wi riers are pre o road vehic the site geom ays. The so stivity assoc n changes b density to att berms. Th as a solid bar . ansport Airp istopher, Fle lights; Volum -08.I, DOT- regg, Analy lemental Ana or Aircraft N y Administ ray theory a th a Fresnel sent it utilize le operations etry is show lid black poly iated with it. etween sourc enuate sound e dashed red rier. 4-7 lanes: ming, e 1: FAA- sis of lysis, oise ration nd de zone s the , site n in gons The e and . The lines Â
4-8 TNM assumes a locally reacting surface to compute the plane wave reflection coefficient of the ground surface. The ground impedance is determined by using a frequency dependent, single parameter, ground type model such as described by Delaney and Bazley (1970). The model computes attenuations for the direct and reflected rays for each segment/vehicle/receiver pair. The direct ray is attenuated by free-field divergence, atmospheric absorption, barriers, and (potentially) tree zones. The reflected ray is attenuated by free-field divergence, atmospheric absorption, (potentially) tree zones, ground impedance, and also by diffractions of barriers. Following the ISO standard (ISO, 1996), TNM computes attenuation through dense foliage as a function of distance and frequency. The attenuation rates are given for octave frequency bands in (Menge et al., 1998, Table 4). Tree zones should only be modeled when the foliage is sufficiently dense to block the view along the propagation path year round. Â Diffracted rays due to ground impedance discontinuities (such as where pavement meets grass) may also be generated and are accounted for based on Fresnel diffraction theory, as described by de Jong et al. (1983). If a single discontinuity exists between a source and receiver, then a single ray is generated. If multiple discontinuities exist, then the Boulanger impedance averaging approach is used. In this case, TNM creates a straight-line regression fit to the (two-dimensional) ground and averages the ground impedance in the vicinity of the reflection point. Once direct, reflected, and diffracted attenuations are determined, they are coherently combined for each one-third octave band from 50 Hz to 10,000 Hz. The octave band attenuation rates are applied to each of the 1/3-octave bands within the associated octave band. Interference patterns due to the multiple rays are generated, which accounts for the ground effects as well as other factors (such as barrier diffractions). The complex sum (magnitude and phase) of each of these paths represents the combined effect of all of the paths and all of the elements in each path. This sum is then referenced to the free field pressure to determine the adjustment factor for shielding and ground effects. Finally, the results are aggregated for each segment and each vehicle type to generate noise contours. Four example of sites with at least three different ground zones are shown below. The sites were originally measured for the validation of TNM 2.0, but have been used extensively to validate more recent TNM model development (Rochat and Fleming, 2002; Rochat and Fleming, 2004; Hastings et al., 2015). The sites represent practical examples of highway-related noise propagation over ground that is either flat or with acoustically significant terrain variations. For each site, a plan view shows the overhead geometry, a skew view shows a cross section along the microphone line, and a scatter plot shows the agreement between measured and predicted results using the most recent model version available. Each scatter plot shows the results of 14 sites in gray and the results of the specific site in red. The overall sound pressure levels and traffic patterns were measured in 5-minute blocks. The traffic blocks were then modeled in TNM and compared to measurements.
4.2.1. TN T figure abo included: kPa s/m2) M Validati his site inclu ve. For this a rectangular for the irregu on Site: A FIGU ded a region site, the defau zone of hard larly shaped RE 12. Pla of lawn with lt ground typ soil (5000 k playground a n and skew a barrier at e is lawn (3 Pa s/m2) just rea in the no view setup o op a berm ju 00 kPa s/m2) north of the rtheast quadr f Site A. st north of t , but two gro roadway and ant of the fig  he highway und zones ar pavement (2 ure above. 4-9 in the e also 0,000
4.2.2. TN T site a berm ground zo loose soil Figure 13. M Validati his site inclu was also pr nes were als (500 kPa s/m Comparison on Site: B ded a highwa esent. For th o included: a 2) south of th of modeled y adjacent to is site, the de median of h e roadway of levels versu a recently d fault ground ard soil (500 the roadway s measured. isked field. F type was field 0 kPa s/m2) in Figure 14 Site A data or half the l grass (150 and a large r . Â shown in re ength of the kPa s/m2), bu ectangular zo 4-10 d. study t two ne of
FIGURE 15 FIGU . Comparis RE 14. Pla on of modele n and skew d levels vers view setup o us measured f Site B. . Site B dat   a shown in r 4-11 ed.
4.2.3. TN T highway a zone was in the Figu M Validat his site consi nd the park. also included re 16. FIGURE 17 ion Site: C FIGU sted of an ur For this site, : a pavement . Comparis RE 16. Pla ban park adj the default g (20,000 kPa on of modele n and skew acent to a hi round type w s/m2) surface d levels vers view setup o ghway with a as field gras parking / dr us measured f Site C. wall-type b s (150 kPa s iving area sou . Site C dat  arrier betwee /m2), but a g th of the roa  a shown in r 4-12 n the round dway ed.
4.2.4. TN T barrier. Fo included: M Validati his site also c r this site, th an irregular s FIGURE 19 on Site: D FIGU onsisted of a e default gro haped region . Comparis RE 18. Pla park-like re und type wa of lawn (300 on of modele n and skew v gion separate s field grass kPa s/m2) so d levels vers iew setup fo d from the a (150 kPa s/m uth of the ro us measured r Site D. djacent highw 2), but a gro adway in Fig . Site D dat ay by a wal und zone wa ure 18. a shown in r 4-13 l-type s also ed.
4.2.5. TN T impedanc can be se prediction the distrib ground ty median of mixed gro be seen th the majori F markers, there is n mixed gro deviations of the mi M Accurac he scatter pl e averaging m en more eas s as shown i utions of the pe, the box in the residual und type me at the majori ty of the resi igure 21 show many cannot ot a significa und types fr for the three xed ground y ots in the ab atch measur ily by consi n the next tw residuals, w dicates the ra s. Here it ca dian lying bet ty of the resi duals are actu FIGU s the same be seen disc nt difference om sample t ground type residuals lies ove example ements as w dering the re o figures. In here the whi nge between n be seen tha ween the har duals are wit ally within a RE 20. TNM residuals bu retely. This between the o sample. T s: ߪÝܽÝÝ àµ 2 between th s show that ell as for case siduals, i.e. the first, a b skers cover t the first and t the median d and soft gr hin a range o bout +/- 1.5 d model accu t here each s provides a performanc his can also .77 ൠߪÝÝ ÝÝÝ e positively predictions s with a sing the differen oxplot is use he entire ran third quartile s are within ound types as f about +/- 4 B. racy by gro ample is plo useful repres e of the mod be quantifie ൠ2.59 ൠߪ biased hard for mixed g le ground ty ce between m d to allow fo ge of residua s, and the re 2.5 dB of on might be ex dB and that und type. tted. Due to entation to s el for single d by consid ÝÝÝÝ àµ 2.42. and the nega round types pe. This acc easurement r a comparis ls of the spe d line indicat e another wi pected. It can for mixed g overlapping ee that intui ground type ering the sta Further, the tively biased 4-14 using uracy s and on of cified es the th the also round data tively s and ndard mean soft
ground ty it is reaso accuracy 4.3. Nor T (Plovsing road, rail sound pro frequency wind and moderate ground re zonesâ, su In is based o pes, producin nable to con on par with si FI dic Noise G he Nordic No et al., 2001) and air traffi pagation mod results from temperature g refraction de flections and ch as urban a the absence n geometrica g a mean val clude that u tuations that GURE 21. T roup: Nord ise Groupâs was develo c, industrial p el for all kin 25 Hz to 10 radients and fined as weat shadow zone reas or veget of refraction l ray theory ue that is less sing impeda do not actual NM model 2000 Environment ped to mode lants, and w ds of sources kHz. It allow rapid turbule her condition s. Nord2000 ation. , the calculat as outlined i biased than nce averagin ly require im accuracy - a Noise Predi l various typ ind turbine g . The propag s calculation nt motions o s where the g may also pr ion of groun n Section 3. either of the g, when nee pedance aver ll data plotte ction Method es of environ enerators, w ation model for specifie f the atmosph round effect edict sound p d effect in th 1. The terrai single ground ded, provide aging. d by ground s, Nord2000 mental nois ith a goal of provides one d weather co ere, mostly w s are not dom ropagation t e Nord2000 p n profile is a type cases. s predictions type. software pa e sources, su applying the -third octave nditions, incl ithin the lim inated by mu hrough âscat ropagation m pproximated 4-15 Thus, with ckage ch as same band uding its of ltiple tering odel by a
number o model ha number o concept is for determ reflection Equation Nord2000 acoustical Attenboro interferen than are o T parameter Software obtain dif method. developer terrain. difference range (3. significan f strait-line s s no limitatio f 10 to 15 se used in the c ining the a coefficient (13) allows f scheme onl ly hard ma ugh et al.,(2 ce pattern tha bserved in ou he model de s. In that r packages exS ferent noise m The algorithm s, and valida The one exa is shown in 5 m) and di t. egments wit n on the nu gments is n alculation of rea average in Equation or a better fit y includes i terial, surfa 007) and se t otherwise p tdoor measur livers result egard, it req ound2000 an etrics. The s in Nord20 tion measure mple over Figure 22; ho fference in s h the surface mber of segm ecessary to o ground effe of different (3) instead to measured ncoherency d ce roughnes veral subseq roduces stro ements. s for a sing uires multipl d SPL2000 commercial 00 have bee ments prese a flat, mixed wever, the e pectral cont property de ents that ca btain reason ct for flat terr impedances of the full c data at low ue to surfac s reduces i uent publica nger dips in t le source/rec e use to sim exercise the ly available S n empirically nted in Delta â impedan xample was ent between fined by the n be include able computa ain. A modi in the terrai alculation of and high fre e roughness ts effective tions. Inco he attenuatio eiver geom ulate a mov method for r oundPLAN adjusted th (2006) show ce surface m of a hard stri the calculat ground flow d, but in pra tion times. fication of B n by utilizin the source quencies (DE . If the sur impedance herent effect n spectrum a etry with th ing noise so eal-world situ software util rough measu good agre atched the p in a soft su ed and meas resistivity. ctice a max The Fresnel oulangerâs m g the plane strength giv LTA, 2000). face is that as discusse s smooth ou t high freque e necessary urce over te ations in ord izes the Nord rement data ement over v A-weighted rface at very ured values 4-16 The imum zone ethod wave en in The of an d by t the ncies input rrain. er to 2000 by its aried level close were FIGURE 22. Nord2000 calculations versus measurements over an impedance discontinuity.
4-17 4.4. National Park Service: Noise Model Simulation (NMSim) The computer simulation model of noise propagation, NMSim, developed by Wyle Laboratories (Ikelheimer and Plotkin, 2005) generates time histories of noise from moving or stationary sources, accounting for the effects of real terrain on sound propagation. A major capability of NMSim is that it accounts for propagation of sound over complex terrain by a full spectral ray tracing method (Rasmussen, 1984). NMSim has existed as a single-event aircraft noise model since the mid-1990s and was originally developed in support of noise propagation studies running on a PC under MS-DOS. This model has become part of a growing trend toward simulation models for complex situations not adequately addressed by traditional integrated airport noise models and provides both quantitative analysis in terms of spectra and loudness metrics, and a descriptive display in the form of color renditions and animations of noise. The main idea was to condense the noise propagation model into a format that is visual, approachable, and easily understood. The DOS version of NMSim has been tested in a variety of settings and has proven to be a valid tool for estimating sound levels. A comprehensive evaluation of the model was that performed by the National Park Service (NPS) and the FAA in 1999 (Miller et al., 2003) at Grand Canyon National Park where it was tested in comparison with two versions of the FAA's INM (version 5.1) and an older NPS noise model called NODSS. Overall, NMSim proved to be the best model for computing aircraft audibility at the time, because it was shown to have the most consistent combination of low error, low bias, and low scatter for virtually all comparisons. The authors recommended that it be used for future modeling of tour aircraft audibility in the Grand Canyon since its computed results best matched the measured results. Another study that was specific to the validation of topography algorithms over mixed impedance surfaces was conducted as part of a NATO study (2001) comparing predictions by NMSim with measurements for the operations of an F-16 out of the airport at Narvik in Norway. The airport is located on the edge of a fjord as shown in Figure 23. The aircraft is flying clockwise along flight track in the figure, and noise levels were measured at the numbered sites in the figure. The closest point of approach of the track to measurement site number 5 involves propagation over water.
N Figure 24 NMSim u It is noted Rasmusse FIGURE 2 oise measure . The model ses to compu in the Figu nâs method c FIGURE 3. Flight tra ments made ing simulated te attenuatio re 24 as KB reated by Bir 24. Compar ck at Narvi at Site 6 in F an F-16 fly n of sound pr R (Rasmusse ger Plovsing ison of meas k showing to igure 23 are ing on the tra opagating ov nâs initials). (DELTA, 19 urements wi pography an compared w ck shown in er terrain wa In the figur 93). th the KBR d measurem ith NMSim m Figure 23. s create by R e, BP stands and BP meth ent location odel estima The algorithm asmussen (1 for a curve ods at Site 6 4-18 s. tes in that 984). fit of .
4-19 The study of all the events for both methods, KBR and BP, compared well with measurements. The comparison of the two methods versus measurements is shown in Table 4. Flights were conducted on 21 and 22 June 1994. The two days are denoted âAâ and âBâ in the table. A mix of operation types (low power, approach, military power, and afterburner) were performed by the aircraft. There were eight recording sites. All 15 events at the eight sites were used for comparison. Statistical analysis has been performed on the full data set, and on several subsets. The subsets are: ï· Each day by itself, since there were changing weather conditions. These are denoted as âAll Aâ and âAll B.â ï· A set of simulated takeoff events only, excluding the first two passes (level flyovers at 1000 to 1500 ft) each day. These are denoted âAll Takeoff.â ï· There were eight âLow approach, Military takeoff powerâ passes. These are denoted â8 Nomâ in the table since this was the nominal test condition. ï· There were a subset of the eight âLow approach, Military takeoff powerâ passes whose tracks were very consistent. These are denoted â6 Nom.â Â
4-20 TABLE 4 Statistical Summary of Sound Exposure Level Estimates and Measurements All All A All B 6 Nom. 8 Nom. All TO Average KBR 98.5 98.4 98.7 102.2 102.5 103.1 Average BP 99.4 99.2 99.6 103.0 103.4 104.1 Average Measured 97.2 95.9 98.5 102.3 101.6 101.8 Avg. KBR - Measured 1.3 2.5 .2 -.1 .9 1.3 Std. Dev. KBR - Measured 4.7 4.8 4.2 3.6 4.2 4.6 Avg. KBR - BP -.9 -.8 -.9 -.9 -.9 -.9 St. Dev. KBR - BP .9 .9 .9 .9 .9 .8 Number of Records 113 54 59 47 63 87 NMSim has been further developed into a general-purpose, Windows-based noise model for the NPS. The current version 3.00 of the model includes the single-event aircraft noise capabilities of earlier versions of NMSim, but also includes ground noise sources and is capable of analyzing multiple-source noise environments. The noise propagation algorithms are now based on the Nord2000 geometrical ray model. The new program, written in Visual Fortran, operates on a PC under 32-bit Windows. The NPS has made the model and its source code freely available in the expectation that the user community will continue to enhance and expand the capabilities of the model. 4.5. Department of Defense: NOISEMAP (NMAP) Earlier versions of NOISEMAP for the prediction of noise around airbases employed relatively simple propagation models (Moulton, 1992). Terrain was assumed to be flat, and sound propagation was considered along straight rays with no refraction or diffraction effects. The ground surface was assumed to be a nominal soft surface (âinstitutional grassâ), and the sound absorption of this surface was an empirically derived function of only the elevation angle from the source to the receiver. The models included the effect of atmospheric absorption of sound, either for standard conditions or for user specified temperature and humidity. As the understanding of sound propagation over ground has improved considerably over the past two decades, and the availability of topographic data in digital form and dramatic increases in speed of PCs made the practical application of this technology feasible, several suitable computational algorithms were identified based on the theory of outdoor sound propagation accounting for varied terrain and terrain surface as discussed in Section 3.2 (Rasmussen, 1984; Plovsing et al., 2001). The updated version of the U.S. Air Forceâs Noise Exposure Model (NOISEMAP or NMAP) program incorporated an A-weighted parametric fitting of Rasmussenâs Geometric Theory of Diffraction created from a sensitivity study by Plovsing (DELTA, 1993). While application was made to this program, the algorithms are in general form and can be applied to any airport/airbase noise model. These algorithms have been validated with extensive measurement programs (Plotkin et al., 1997, NATO, 2001, Downing, 2004). NMAP 7.0 is the current version of the Department of Defense (DoD) computer program suite for the modeling of aircraft noise from aircraft flight and static events at an airbase (Czech and Plotkin, 1997). It is an integrated noise model. The entire suite encompassed by NMAP 7.0 includes several different programs. The three primary personal computer-based programs in the suite are BASEOPS 7.0,
NMAP 7. of flight a is the com levels gen draw line environm both topog T Narvik (N considere shown as National A For this st on the air top of a 1 modeling calculatio dB) the S is the prim levels for wing-mou the engine N Figure 25 hard and g F 0, and NMPL nd static even putational m erated by air s of equal ental impacts raphy and gr he prediction ATO, 2001) d as acoustic the âBPâ pre irport (Dow udy, acoustic port property 2 ft high ba technique o ns near an air EL values at ary concern land locatio nted engines âs noise dire OISEMAP is shows an ex round as sof IGURE 25. OT 4.2. BA ts, flight and odule that ac craft events noise level (from aircra ound impeda s by NMAP . Terrain in t ally hard. A dictions in F ning et al., 2 measureme (reference s nk, 100 ft in f treating w field. The re the water-lan for military ns beyond th the calculati ctivity effect used to com ample of how t. Contours o for water SEOPS is us static profile cepts the dat at points on (noise contou ft and other nce. 7.0 were sho he study incl demonstrat igure 24. A 004) validat nts were perf ite) and direc land). The r ater surface sults showed d interface, p fighter aircra e water-land on of SEL re near the aircr pute noise c treating the f Ldn calcul /soft for lan ed to enter a s, flight trac a entered in t the ground in rs) to defin sources). NM wn to be in g uded propag ion of the to field measu ed the treatm ormed for air tly across th esults from t s as acousti that the imp articularly f ft. However interface. I sulted in an o aft structure. ontours from entire surfac ated with the d (light gray ll aircraft ope ks, weather, a he BASEOP the airbase e the overa AP 7.0 allo ood agreeme ation over w pography h rements prog ent of a wat craft departu e Potomac R his study dem cally hard w lementation a or aircraft wi , the model s t was also c ver estimatio aircraft ope e as soft com entire area contours wi rational data nd topograp S program, a vicinity. NM ll noise exp ws for mode nt with mea ater and grou andling in th ram conduc er surface as res with the iver (near th onstrated th as correct ccurately pr th tail-mount lightly over- oncluded tha n of approxim rations at mi pares with id as soft (dark th shading). including nu hical data. N nd estimates PLOT is us osure and re ling the effe surements ma nd, with the e Narvik stu ted at Washi acoustically measurement e shoreline, at the NMA for aircraft edicted (with ed engines, w estimated the t for aircraft ately 3 dB d litary installa entifying wa lines) and h 4-21 mber MAP noise ed to lated cts of de at water dy is ngton hard. sites at the P 7.0 noise in 0.5 hich SEL with ue to tions. ter as  ard
4-22 Â 4.6. Department of Defense: Advanced Acoustic Model (AAM) The Advanced Acoustic Model (AAM) developed by Wyle Laboratories is a simulation model (Wyle 2010; Page et al., 2012) that allows the use of different propagation methodologies. For a non- refracting atmosphere, the acoustic propagation algorithm accounts for the ground reflection and attenuation losses caused by the ground, and the resultant interaction between direct and reflected acoustic rays using the Geometric Theory of Diffraction for mixed impedance surfaces (Rasmussen, 1984). The ground surface is characterized by the one-parameter model of Delany and Bazley (1970). The calculations for single impedance, flat surfaces are based on the studies reviewed in Section 3.1 (Chien and Soroka, 1975; Chessell, 1977; Daigle et al., 1985). For moving sources the Doppler shifted frequencies are based on the speed of the vehicle and its direction relative to the receiver. Within the model, the topography propagation module combines both the ground reflection and attenuation, and topographic attenuation as a single term. Two important elements needed in a propagation model to make accurate near- and far-field noise predictions for military aircraft are: (1) a detailed knowledge of the acoustic source, and (2) improved nonlinear acoustic propagation algorithms. These elements are addressed in the AAM (Wyle 2010; Page et al., 2012) by considering 3-dimensional directivity of jet noise and nonlinear acoustic propagation. With regard to the sound propagation algorithm improvement, the objective of the development was to quantify the effects of nonlinear acoustic propagation on noise levels produced by the new generation of fighter aircraft with different engine geometries and thrust vectoring capabilities, and to incorporate the information into the existing propagation models. The 2-D dynamic visualization capability of NMSim (see section 4.4) provided a foundation for developing credible noise simulation modeling and dynamic visualization for high-thrust, vectored-thrust aircraft. The 2-D animations generated by NMSim were extended to three dimensions in AAM. Rendering algorithms were enhanced, which together with increasing computer speeds, allowed AAM to generate dynamic visualization in real time or quasi-real time. Linear propagation algorithms were replaced with nonlinear versions developed under the program. AAM was built on and extended from the Rotorcraft Noise Model (RNM), and includes all of the RNM capabilities (Page et al., 2008). Other propagation algorithms that have been incorporated in AAM are the parabolic equation (PE) method and a curved ray method that accounts for a refracting atmosphere. The PE method utilized by AAM was developed by NASA and exercises the Greens function approach through the APET model discussed below. The validation of AAMâs propagation algorithm over mixed impedance surfaces is shown in Figure 24. The convenience and 3-D modeling of complex noise sources make it an ideal noise model for comparing the results of the different methodologies studied in this project. 4.7. National Aeronautics and Space Administration (NASA): Acoustic Propagation and Emulation Toolset (APET) The Acoustic Propagation and Emulation Toolset (APET) is a framework code uniting several acoustic methodologies for the propagation and measurement of source noise audibility at far-field observers, accounting for the effects of the atmosphere, weather, terrain, and spherical spreading (Burley and Pope, 2012). . The software can be obtained from the NASA Technology Transfer Program at https://software.nasa.gov/software/LAR-17761-1. Currently, APET consists of a modified version of the Rotorcraft Noise Model RNM, Version 7 (Page et al., 2008) coupled with the newly developed Spectral
4-23 Attenuation Method (SAM) that contains the Ray Tracing Program (RTP) and two versions of a Greens Function Parabolic Equation (GFPE) code. A third component of APET is an audibility prediction scheme based on the work of Abrahamson, initially called ICHIN (I Can Hear It Now) and further developed by Wyle Laboratories as AUDIB (short for audibility). SAM computes the transmission loss from a source to an observer using a variety of methods. All are similar in that each needs an observer location, a source location, a frequency of interest, and local weather/terrain information. The GFPE method computes the loss via Runge-Kutta integration along a line joining the source to the observer marching from the source. Local weather profiles and terrain effects are used to obtain the solution. Thus, the transmission loss may vary azimuthally depending on vertical weather profile (as it affects the local sound speed) and terrain (as it affects impedance used in the PE). The local ground impedance is accounted indirectly by the user specified ground cover type (GRASS, ROCK, WATER, etc.). The code then looks up the associated resistivity for that cover type and ground impedance is computed. While the Green's Function approach is more valid than ray theory at lower propagation frequencies, it is computationally slower. However, it has advantages in that it accounts for the noise 'shadow zone' and can accommodate multiple âbouncesâ of sound at the ground. While RTP is much faster computationally, it cannot compute beyond the shadow zone boundary, and can accommodate only a single ground bounce. Although SAM uses time varying, three-dimensional weather profile data wherever needed, RTP has as its developmental foundation an assumption that the weather is stratified with linearly varying properties within each atmospheric layer. Reflection and multipath ray effects are not currently included in RTP, but both are included in the GFPE implementations. A rudimentary hybrid method is also available that merges the GFPE and RTP in order to exploit the strengths of each. APET2 is an improvement to the original APET which predicts the acoustic propagation of noise through the atmosphere accounting for changes in weather and terrain; it works with the Advanced Acoustic Model in the same way that APET worked with RNM. Currently, there is a choice among five propagation methods implemented within APET2. These methods distinguish themselves from one another in their relative abilities to account for terrain elevation and impedance effects, weather handling, inclusion of acoustic shadow zones (regions where the incident ray has bounced off the ground and reflected upward), and finally, computational speed. They consist of a GFPE method, a curved ray method, a fast field method, and finally a hybrid curved ray/fast field method in which the fast field approach is used in shadow regions and the curved ray approach used otherwise. As a fifth option, a simple straight ray method is available. The GFPE method is available in SAM offering expanded capability for handling time-dependent, spatially varying weather. This approach accounts for terrain effects with variable ground impedance. The Greenâs Function method, while exact, is computationally slow compared to other methods (computations are in terms of hours rather than minutes as in the other methods), and there is no accounting for back-reflection. This method also requires high-altitude weather definition (well above the vehicle flight altitude) and has restricted range of applicability for ground regions directly below the vehicle, thus limiting its applicability for high-altitude flight. However, in these situations, a straight ray calculation is usually sufficient for the region directly beneath the vehicle. The APET2 software suite is a useful environment in which to assess the effects of terrain, weather, and computational method on acoustic propagation and audibility. APET2 offers improved handling of both weather and terrain effects, expands the range of propagation methods available to the user, and provides a choice of audibility criteria. It seeks to be a user-friendly, easy-to-use tool with relatively few inputs and provides high fidelity acoustic predictions for a wide assortment of rotorcraft or fixed-wing configurations. Its design allows for rapid inclusion of new propagation methods as they become available.
4-24 4.8. Norwegian Aircraft Noise Calculation Model (NORTIM) The Norwegian aircraft noise calculation model, NORTIM, was implemented in 1995 and was originally based on the (SAE-AIR-1751, 1981) recommendations, with the routine for computing lateral attenuation empirically developed in the early 1980s. The SAE routine at the time contained no frequency dependency. Lateral attenuation was calculated as a combination of source directivity and ground attenuation. The field noise measurements conducted in 2000 indicated, however, that the program under-predicted the measured SEL, on average, by 2.7 dB (Granoien et al., 2002). New equations for lateral attenuation of aircraft noise were later developed and implemented in NORTIM (Granoien and Randeberg, 2004). The new routines developed for lateral attenuation divide the phenomena into ground effect and engine installation effect (source directivity). For the development of new ground attenuation routines, the Nord2000 method (see Section 4.3) was used to calculate the ground attenuation from the aircraft to observer positions for multiple points of the assumed virtual flight tracks. It was further assumed that the data could be modeled by expressions similar to the formulae for ground effect in SAE-AIR 1751 as a function of lateral distance and elevation angle, and with all the coefficients fitted to the virtual flight calculated data. Implementation of the updated expressions into NORTIM provided more accurate calculated results in comparison with the measurement data than the existing standard routine. The overall improvement for the prediction of SEL was on the order of 1 dB (Granoien and Randeberg, 2004). 4.9. Hybrid Propagation Model The hybrid propagation model (HPM) is a numerical model designed to predict aviation noise levels under complicated propagation conditions. It was originally developed as a research tool at the Pennsylvania State University in cooperation with the Volpe National Transportation Systems Center and the Federal Aviation Administration (FAA). HPM is a composite of three propagation methods: a parabolic equation (PE) model; a fast field program (FFP); and a straight ray-trace model. The three component models of the HPM were chosen for their complementary strengths. The PE allows the HPM to incorporate range-dependent effects at small elevation angles from the source, such as terrain features, transitions between different types of ground, and changing meteorology. The FFP ensures that the model is accurate at low frequencies to moderate elevation angles, for cases without extreme range- dependent changes near the source. The straight ray model fills in levels at the higher elevation angles, where the accuracy of the other two models is degraded. The resulting HPM model can return noise levels at all points in the vertical, line-of-sight slice between the source and a distant receiver. 4.10. Go Forward Plan Ray Models As stated in the Interim Report of this project, the Go Forward Plan was to use straight ray theory to explore lateral attenuation of aircraft noise over mixed impedance ground using one and two parameter models of ground impedance. The ray theories presented in Section 3 have been coded into two programs. The first, called EPD by its developers (Fleming et al., 1999, VOLPE, 2000), models pure- tone wave propagation. EPD stands for the authors Embleton, Piercy and Daigle. EPD calculates the ground effect for a single frequency using Equation (12). The second, called EGA, which stands for Excess Ground Attenuation, (Wyle, 1985) estimates the ground effect for one-third octave band levels using Equation (14). A comparison of the calculations with the two codes for a source and receiver at 4 ft heights separated by 50 ft of soft (200 kPa s/m2) ground is shown in Figure 26. No turbulence was included in the calculation using EGA. The one-third octave band estimate by EGA represents an average of what would be expected using the EPD model for all the frequencies within each one-third octave band. The advantage of the EGA model is that it would need to be run once to estimate the ground
4-25 effect for a particular one-third octave band level; whereas, EPD would have to be run for a series of frequencies within that one-third octave band. Â FIGURE 26. Comparison of EPD and EGA models. Source and receiver heights of 4 ft separated by 50 ft of soft (flow resistivity 200 kPa s/m2 ), flat ground. 102 103 104 -12 -10 -8 -6 -4 -2 0 2 4 6 Frequency (Hz) D iff er en ce L ev el (d B ) EPD EGA
