
Climate Change and Infrastructure Resilience
FIRAS SALEH
Jupiter
Infrastructure for energy, transportation, and water has evolved over time into inextricably interconnected systems. Traditionally, the engineering design practice of such systems has proceeded on the assumption of “climate stationarity,” in which the frequency and magnitude of weather patterns remain unchanged into the future. But climate change is introducing nonstationary stressors, such as rises in sea level and temperature and more frequent and intense storms. Such stressors can affect infrastructure systems at varying spatial and temporal scales and require a holistic understanding.
Recent extreme events have highlighted the importance of understanding infrastructure interdependencies to strengthen resilience and adaptive capacity in a changing climate. Hurricanes Sandy (2012), Harvey (2017), Irma (2017), and Florence (2018) caused disruptions to major US water, transportation, and energy systems that affected the functioning of other critical infrastructure (e.g., for health care and telecommunications). Resilience planning must account for the impacts of both disruptive extreme weather events and long-term climate change–induced stressors, such as sea level rise and drought.
The work presented here focuses on the use of state-of-the-art modeling techniques to better understand the infrastructure impacts of natural (e.g., storms and floods) and anthropogenic (e.g., dam breaks) hazards as well as gradual stressors (e.g., sea level rise). This multidisciplinary research merges the fields of climate change; civil, water resources, and coastal engineering; remote sensing; and high-performance cloud computing to identify critical thresholds in aging infrastructure and failure cascade risks in interconnected systems.
INTRODUCTION
Climate change is expected to alter the intensity, duration, and/or frequency of climatic extremes over time, a concept termed nonstationarity (Cheng and AghaKouchak 2014).
In general, engineering design metrics and assessment of risk are based on historical statistical analysis in which hydrologic processes fluctuate in an unchanging envelope of variability. Such metrics are essential in guiding engineering design choices.
In inland and coastal urban areas, nonstationary processes are exacerbated by anthropogenic land-cover changes, such as deforestation, urban expansion, and water diversion. In a changing climate, frequent and more intense storms can have more serious implications for vulnerable and aging infrastructure.
Long-term sea level rise is the main driver of accelerated flooding along the US coastline; however, changes in joint distributions from storm surges and precipitation associated with climate change also augment flood potential (Sweet and Park 2014). Hurricane Irene (2011), for example, showed that with a compound event such as storm surge and heavy precipitation, the potential for flooding in low-lying coastal areas is much greater than from either in isolation. Irene’s extreme rainfall and resulting flash floods in New York, New Jersey, New Hampshire, and Vermont destroyed or damaged nearly 2,400 roads and 300 bridges (Saleh et al. 2016, 2018a, 2018b). Tropical storm Harvey in 2017 brought more than 51 inches of rain in Texas, breaking the record for the greatest amount of rain recorded from a single tropical storm or hurricane in the continental United States.
The combination of aging infrastructure and increasingly severe climatic stresses sets the stage for future disasters. In that context there is a pressing research need to develop strategies for engineers to (1) better understand climate–infrastructure interactions to recognize the limits and opportunities of the knowledge base on which decisions will be made; (2) account for the effects of climate change in engineering design practice, where appropriate; and (3) clearly justify when such changes are not needed for a project of a particular type or scale.
There have been significant advances in considering climate change information in coastal areas, owing to the availability of sea level rise scenarios and analytical methods and tools. But there remains insufficient knowledge of inland and estuarine areas and their preparedness for compound events.
USE CASE: DAMS AND STORM EVENTS
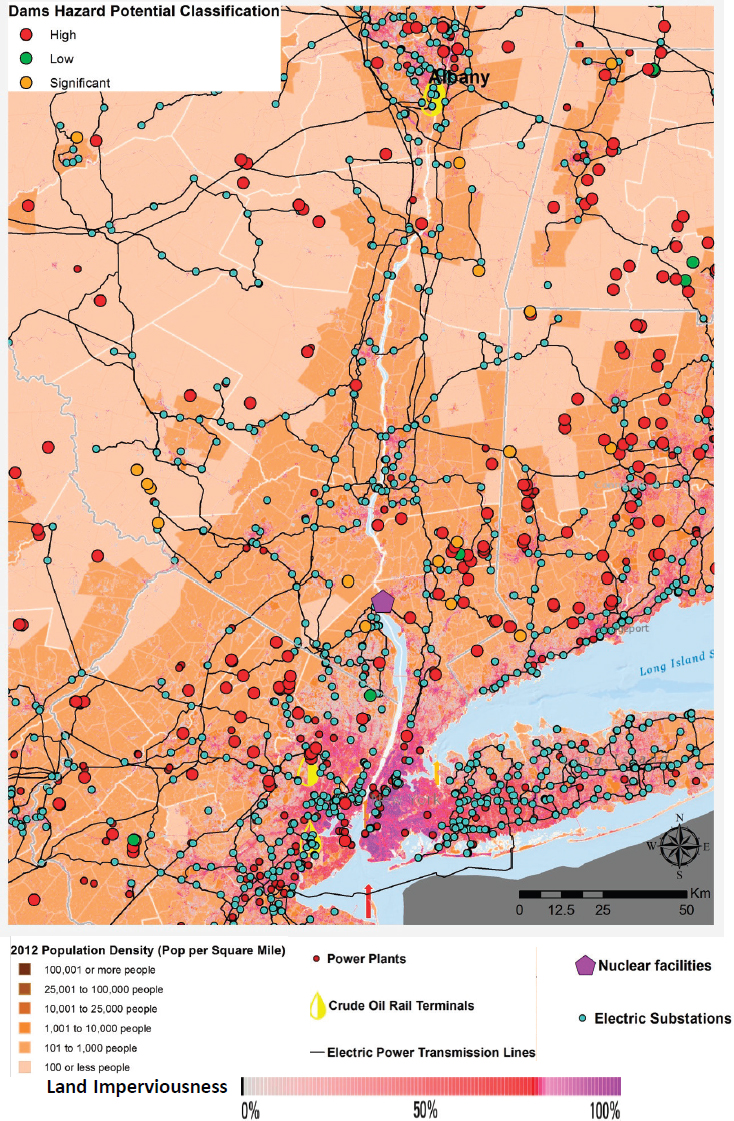
Throughout the United States more than 90,000 dams provide important service and protection to communities and the economy. Their average age is 56 years, which exceeds the average life expectancy of 50 years for certain dams.
Dams are classified based on their hazard potential: high, significant, or low (table 1). As the US population grows and development continues, the number of
TABLE 1 Dam hazard classification. Based on ASCE’s 2017 Infrastructure Report Card (https://www.infrastructurereportcard.org/cat-item/dams/).
| Hazard classification | Potential consequences of failure or misoperation |
|---|---|
| High hazard | Loss of life; significant economic losses, including damages to downstream property or critical infrastructure, environmental damage, or disruption of lifeline facilities |
| Significant hazard | Significant economic losses, including damages to downstream property, critical infrastructure, environmental damage, or disruption of lifeline facilities |
| Low hazard | Minor damage to nonresidential and normally unoccupied buildings, or to rural or agricultural land |
high-hazard dams is increasing—it was nearly 15,500 in 2016 (see, e.g., figure 1). Many dams were designed based on relatively short hydrologic records; longer accurate instrumental records and future climate modeling are needed to guide their upgrading as well as the construction of new dams.
Overtopping is one of the most common forms of catastrophic dam failure, and may result from an increase in the frequency and intensity of extreme rainfall. In addition, as water levels rise from increased inflows, structural and hydraulic stresses from the weight of the additional water in the reservoir will likely exceed levels either designed for or previously experienced in a given dam.
It is often the case that manmade and natural disturbances do not happen in isolation, and their impacts can vary temporally and spatially. Such compound events are likely to cause tipping points and major disturbances to dams and other critical infrastructure. To address this aspect, a predictive framework was developed in this work to evaluate implications of manmade-induced and natural disturbance scenarios, such as storm surges and intensive rainfall storms that trigger dam overtopping or a dam break.
A test bed located in a complex estuarine system in northern New Jersey (figures 1 and 2) was selected to critically evaluate infrastructure resilience for extreme flood events associated with hurricanes Irene (2011) and Sandy (2012). The two events emphasize the importance of detailed integrated modeling for compound effects of coastal storm surge and riverine flooding.
The test bed captures long- and short-term stressors:
- A coastal environment subject to sea level rise
- A steep gradient in population density
- An infrastructure serving one of the largest metropolitan areas in the United States
- A highly urbanized area with valuable commercial and residential assets
- A history of environmental impacts, ranging from heat waves and hurricanes to localized storms
- A wealth of historic and real-time data and extensive monitoring facilities
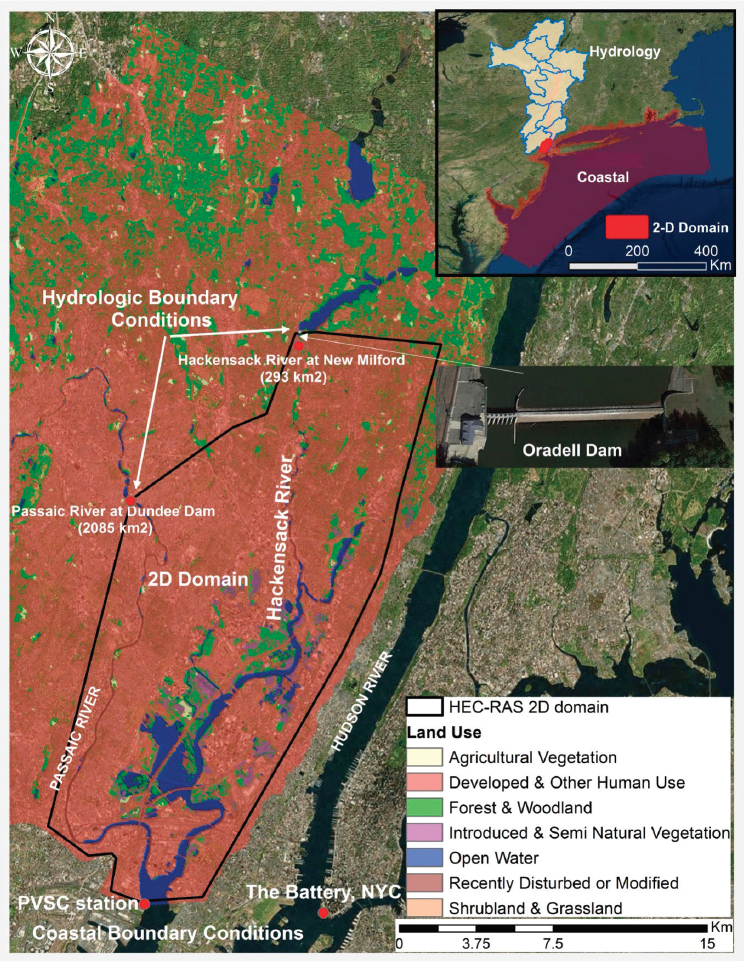
The area is bounded on the west by the Passaic River at Dundee Dam, on the north by the Hackensack River at New Milford (downstream of Oradell Reservoir, built in 1923), on the east by the Hudson River, and the tidal influence of Newark Bay from the south (Saleh et al. 2017).
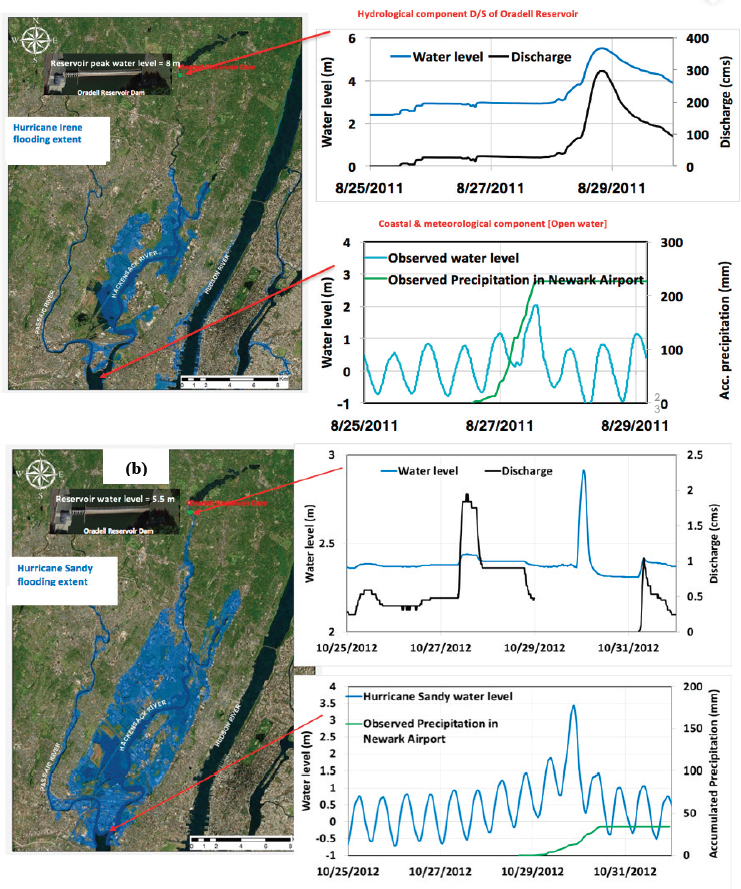
To establish baseline inundation extents, the inland hydrodynamic component of the modeling framework was forced with the best available data from the United States Geological Survey and National Oceanic and Atmospheric Administration, represented by measured river discharge and ocean water levels (figure 3). The extents simulated by the model for Hurricane Irene were a combination of storm surge and major flooding. In contrast, flooding associated with Hurricane Sandy was dominated by a coastal storm surge that overtopped all berms and several tide gates in the area of study. The analysis for Hurricane Sandy suggests that the storm surge propagated 36.2 km inland along the Hackensack River up to the Oradell Reservoir dam (figures 2 and 3).
Upon establishing baseline conditions, the framework was then forced with probabilistic and scenario-based projections of sea level rise and change in rainfall to help stakeholders and practitioners understand long-term risks in a changing climate.
DISCUSSION AND CONCLUSION
Modeling frameworks representing hydrosystem components spanning numerous temporal and spatial scales were integrated to provide telescopic capabilities for modeling coastal and inland flooding. The modeling outputs provide important information to quantify integrated processes at decision-relevant scales, identify significant vulnerabilities, and mitigate associated high-impact risks in critical infrastructure. The framework can be used to quantify the impacts on the paired bilateral interfaces of energy–water from natural (e.g., storms and floods) and anthropogenic (e.g., dam break) shocks and explore complex interactions with gradual stressors (e.g., climate change and changes in land use).
Compound events are characterized as (1) two or more extreme events occurring simultaneously or successively (e.g., storm surge, hurricane, Nor’easter, dam failure, and/or precipitation-induced high river discharge), (2) the combination of one or more extreme events and underlying conditions that amplify the impact of the event(s) (e.g., excessive soil moisture, drought, prolonged heat wave), or (3) combinations of events that are not themselves extreme but create an extreme event or impact when combined (e.g., saturated soil, snow melt with temperature anomalies).
Coupling the system-level models of the framework with regional-scale climate change projections can help identify strong and weak linkages between the different components and nonlinear behaviors and responses across spatial and temporal scales. The resulting information can be used to guide decisions about the capacity of infrastructure to withstand projected climate-related hazards.
REFERENCES
Cheng L, AghaKouchak A. 2014. Nonstationary precipitation intensity-duration-frequency curves for infrastructure design in a changing climate. Scientific Reports 4:7093.
Saleh F, Ramaswamy V, Georgas N, Blumberg AF, Pullen J. 2016. A retrospective streamflow ensemble forecast for an extreme hydrologic event: A case study of Hurricane Irene and on the Hudson River basin. Journal of Hydrology and Earth System Sciences 20:2649–2667.
Saleh F, Ramaswamy V, Wang Y, Georgas N, Blumberg AF, Pullen J. 2017. A multi-scale ensemble-based framework for forecasting compound coastal-riverine flooding: The Hackensack-Passaic watershed and Newark Bay. Advances in Water Resources 110:371–386.
Saleh F, Ramaswamy V, Georgas N, Blumberg AF, Pullen J, Chen S, Holt T, Schmidt J. 2018a. An integrated weather-hydrologic-coastal-stormwater framework to model urban-coastal interactions: City of Hoboken application. Journal of Flood Risk Management e12477.
Saleh F, Ramaswamy V, Georgas N, Blumberg AF, Pullen J. 2018b. Inter-comparison between retrospective ensemble streamflow forecasts using meteorological inputs from ECMWF and NOAA/ESRL in the Hudson River sub-basins during Hurricane Irene (2011). Hydrology Research nh2018182. doi: https://doi.org/10.2166/nh.2018.182.
Sweet WV, Park J. 2014. From the extreme to the mean: Acceleration and tipping points of coastal inundation from sea level rise. Earth’s Future 2(12):579–600.


