
– 2 –
Administrative Records, Third-Party Data, and the American Community Survey
Following brief introductory remarks, the first day of the Workshop on Improving the American Community Survey (ACS) focused on issues related to the incorporation of administrative records or third-party data with the survey’s data collection and production operations. It is essential, then, to be clear about what those terms mean. In the session’s opening presentation, Jennifer Ortman (U.S. Census Bureau) noted that “administrative records” refer to the micro-level data records contained in the working files maintained by government agencies that administer programs and provide services.1 Though much attention has focused on the records compiled by federal government agencies, administrative records data also include records maintained by state, tribal, or local governments. By comparison, “third-party” data refer to similar micro-level data on persons or households by commercial, private-sector entities. Prominent examples of these different data sources—focusing on those that have been made available to the Census Bureau for research—are listed in Box 2.1.
___________________
1 Ortman drew a distinction between administrative records data and the “Systems of Records” that are collected and maintained exclusively for statistical purposes, as the Census Bureau itself does under the authority of Title 13 of the U.S. Code.
2.1 BROAD VISIONS FOR ADMINISTRATIVE DATA USE IN AMERICAN COMMUNITY SURVEY (ACS) PRODUCTION
2.1.1 Outlining the Broad Roles
Jennifer Ortman (U.S. Census Bureau) continued her frame-setting remarks by commenting on the reasons why the Census Bureau is pursuing this change. She said that the Census Bureau is trying to strike a balance between two overarching but contradictory pressures. There remains an insatiable thirst and desire for high-quality data—increasingly demanded at a more rapid pace in order to keep in step with the changing nature of lives and lifestyles. Yet response rates to personal and household surveys have continued to decline for many reasons, among them heightened concerns about the privacy and confidentiality of the supplied information as well as the sheer burden of handling a plethora of information requests. Declining response rates, in turn, have increased the cost of survey work, requiring more attempts to contact potential respondents.
Against this backdrop, Ortman said that the principal substantive reasons for crafting an increased role for administrative records and third-party data in the ACS are three-fold. First is the possible reduction of burden on the respondents: If the Census Bureau has reliable administrative records information for some ACS data items for a particular household, then it need not ask those questions directly. Second, it is believed that greater use of administrative records and third-party data may increase the data reliability of the final ACS product—to wit, data items such as detailed breakdowns of income may be difficult for survey respondents to recall or report accurately in the general survey context, so recourse to IRS data could likely be more accurate. Third, a great promise of these alternative data resources is the reduction of survey cost by decreasing the need for follow-up information, whether the alternative data are used to directly substitute part or all information for nonresponding households or whether they are used to remove from the data collection workload those housing units that are extremely likely to be vacant.2 Ortman also noted that a key practical reason for the Census Bureau to pursue greater use of administrative records data is that it is mandated to do so by the authorizing law for the Census Bureau’s censuses and surveys, Title 13 of the U.S. Code. Specifically, 13 USC § 6(c) holds that:
To the maximum extent possible and consistent with the kind, timeliness, quality and scope of the statistics required, the Secretary [of Commerce] shall acquire and use information available from [federal government, state/local government, or private sources] instead of conducting direct inquiries.3
As described to participants in framing the workshop, and reiterated by Ortman in her remarks, there are three major ways in which administrative records and third-party data may be integrated into ACS production routines:
- Direct replacement of questions and content, omitting some survey questions for households if the same information is reliably available from alternative sources;
- “Filling in the blanks” during survey editing and imputation routines, using alternative data sources to account for nonresponse or discrepant information in specific questionnaire items on otherwise complete returns; and
___________________
2 Ortman observed that this removal of vacant housing units is a major way in which administrative records data will be used in the upcoming 2020 decennial census.
3 The paraphrasing text on sources used here takes the place of reference to “any source referred to in subsection (a) or (b) of this section.” Subsection (a) refers to information from “any other department, agency, or establishment of the Federal Government, or of the government of the District of Columbia” (13 USC § 6(a)) and subsection (b) to “such copies of records, reports, and other material” acquired “by purchase or otherwise” “from States, counties, cities, or other units of government, or their instrumentalities, or from private persons and agencies” (13 USC § 6(b)). This basic language has been a part of census law since Title 13 was codified in 1954, and authority to request information from other government agencies has been part of census law since the 1929 act that authorized the 1930 census (46 Stat. 25).
- Blending ACS and alternative data to generate new data products, using census/ACS and alternative data sources to enrich each other.
Related to these are several other procedural or operational uses, including the previously mentioned notion of identifying vacant housing units up-front in order to better allocate nonresponse follow-up costs. Alternative data sources may also prove important to supporting ACS operations in remote geographic areas and in climates or conditions that may become prohibitively expensive (absent the full extent of resources brought to bear in a decennial census). Finally, another essential role for alternative data sources in the context of the ACS is as a check on the quality of the ACS results: auxiliary or third-party data may provide a useful benchmark or point of comparison for investigating seemingly anomalous findings from survey data.
Ortman said the Census Bureau is convinced that it is worthwhile to pursue this path of greater use of administrative data, including in the ACS, but it is determined to do so carefully and thoughtfully. To that end, she said that the Census Bureau has established a working set of guiding principles or criteria to determine what sources are appropriate for use in the ACS program; these are listed in Box 2.2. Possible administrative records or third-party data sources are assessed with respect to these criteria to determine their suitability for use, in any of the major possible roles. Though the criteria are all important, Ortman deemed quality to be the ACS program’s “North Star,” consistent with the program objectives described by Victoria Velkoff in opening the workshop.
Ortman said that, to date, what the Census Bureau has done in this research area is to evaluate the coverage and quality of a variety of alternative data sources to identify the most promising sources. In particular, and foreshadowing the presentations later in the workshop, the Census Bureau has developed measures of housing characteristics and income—two segments of the ACS questionnaire that have long been seen as most conducive to direct substitution from alternative data sources—to evaluate the possible impact on data products. Particularly in the context of planning for the 2020 census, but certainly with ramifications for the ACS and other surveys, the Census Bureau has also been engaged in testing the use of administrative records data for imputation of the essential demographic information on the census and ACS questionnaires, including race and Hispanic origin and age.
At a high level, Ortman noted, the “big lesson” that the Census Bureau has learned in this research over the past few years is that the work has just started and that major challenges remain to be addressed. One of the guiding principles articulated in Box 2.2 is the consistency of coverage across geography, and that is a particular priority for the Census Bureau because it needs to be fair to all constituencies. Ortman said that the Census Bureau continues to find extensive differences in the coverage across all geographic areas of particular types (state, county, place, and so forth), with records being very complete for some areas
while less complete for others. Great strides have been made in the general ability to link administrative records with census and survey data, but there are always grounds for improvement. Ortman said that the Census Bureau also seeks to improve its ability to better leverage data that were designed for different uses and to become more comfortable in judging the appropriateness of nongovernment sources of alternative data relative to government sources; in particular, nongovernment sources may make changes to their techniques and standards (without public attention or knowledge) that are not fully described and that may affect the resulting data. Finally, as hinted at in the “temporal alignment” guiding principle in Box 2.2, reconciling time lags and differences in the time period covered between different sources remains difficult (for
example, 3-year-old property assessment data might not fully capture something important happening in the domain of housing values).
Ortman closed by noting that leveraging existing administrative records and third-party data sources through linked approaches will be an important component of demographic research, in general, for the foreseeable future, including for census-taking and survey measurement. She said that the field of survey research is shifting, and that alternative data sources should be leveraged to enhance, supplement, or—as appropriate—replace what is currently collected through survey questionnaire items. Accordingly, she said that the Census Bureau is engaging in finding appropriate roles for the use of administrative records and third-party data at all stages of the survey life cycle, and not simply as a replacement for whole questions on the survey.
2.1.2 Census Bureau Internal Evaluation of Alternative Data Sources
Nikolas Pharris-Ciurej (U.S. Census Bureau) described the Census Bureau’s internal research on the aptness-for-use with the ACS of possible administrative records and third-party data sources, taking as a starting point the section of law referenced by Ortman. The Census Bureau is mandated by 13 USC § 6 to use such records and data, to the extent possible, for the efficient and economical conduct of its data collection programs. That passage of law motivates the work of the Bureau’s Center for Administrative Records Research and Application (CARRA), in which Pharris-Ciurej works. CARRA and the ACS Office jointly conducted the evaluation of external data for two pivotal possible roles with the ACS, replacement of questionnaire items and editing/imputation for item nonresponse—and Pharris-Ciurej noted that this analysis is limited to the housing topics on the ACS.
Describing the Census Bureau’s approach to the evaluation problem, Pharris-Ciurej simplified the 12-factor set of guiding principles referenced by Ortman (Box 2.2) into a Venn diagram of four higher-level factors. He said that the analysis is based on the simultaneous use of four broader factors: conceptual alignment, coverage, agreement (of the values of the relevant variables in the records/third-party data and the ACS returns that are able to be linked), and missing data (in the records/third-party source, given interest in using them as possible replacement for ACS values). In general, Pharris-Ciurej argued, the maximum benefit of administrative records and third-party data in the ACS for these purposes depends critically on the respondents’ knowledge or recall of the subject (or lack thereof), on the programmatic purpose of the alternative data source, and the key factor of conceptual alignment between the alternative and ACS sources.
Specifically, Pharris-Ciurej said that aptness-for-use analysis focused on administrative records and third-party sources available for Census Bureau research, as listed in Box 2.1. Using these sources, Pharris-Ciurej said the
Census Bureau’s research team examined possibilities for supplementation or replacement of 14 of the ACS housing items listed in Box 1.1. Summarizing the results, he said that four of the items—property value, costs—real estate tax, year built, and acreage—were deemed “most promising” with the others being “less promising” for ACS–administrative records interface.
Pharris-Ciurej said that the principal reasons for ACS–records integration being less promising for some variables varied considerably. For the Part of a Condominium item, issues of coverage and conceptual alignment proved insuperable. Much of the available data were available using a different level of analysis than desired—the homeowner association (HOA) or co-op level, and not the data about specific units. When data were available at the unit level, they were often for opt-in insurance or mortgage programs, making coverage (and selectivity of units represented in the data) a major problem. Finally, Pharris-Ciurej said that the question is fraught with potential for violating the principle of clear and consistent definitions. A particular confusion is about what is considered a “time-share” relative to a “condominium,” and that there seemed to be considerable variability (perhaps regional as well) in the application of various terms. For the Plumbing/Kitchen Facilities and Phone Service items, the fundamental problem was strongly differential agreement between the ACS and records sources affecting the relatively rare (but critically important) populations who do not have those services. For instance, for cases where linkage was possible between ACS returns and the records, there was consistently strong agreement between a survey answer of “yes” to the presence of phone service and the results in records sources. But if the survey suggested no phone service, records sources were more likely to show discordant values. This led the Bureau staff to conclude that they could not reliably substitute or supplement that information for the full population. Pharris-Ciurej said that difficulties with the Heating Fuel Type item appear to stem from the completeness of the principal alternative data source, the Multiple Listing Services (MLS) data used in real estate transactions. By their nature, MLS data are limited to homes that were recently put on the market or actually sold (and so do not cover all homes), and the MLS data do not cover all markets in the United States. Moreover, Pharris-Ciurej said that realtors tend to list all of the available fuel types in a home listing without indicating which is primary or secondary, so there was misalignment with the ACS question (which asks for the primary fuel type).
Pharris-Ciurej said five other ACS housing items were deemed “less suitable” for replacement or supplementation through administrative records for the basic reason of insufficient detail. The items in question are:
- Agricultural Sales;
- Costs–First Mortgage Payment;
- Costs–Secondary Mortgage Payment;
- Number of Separate Rooms and Bedrooms; and
- Tenure.
For instance, on the tenure item, Pharris-Ciurej noted that the ACS question on tenure has four possible response values4 but the Census Bureau researchers concluded that the administrative records data were only really effective at capturing one of those options.5 He also noted that these items showed the highest agreement on missing values—that is, those items were likely to be missing in both the ACS response and administrative records sources. Pharris-Ciurej’s overview slide identified the yes-or-no Have a Mortgage item as the final “less promising” variable for replacement or supplementation, but he did not explicitly state a reason.
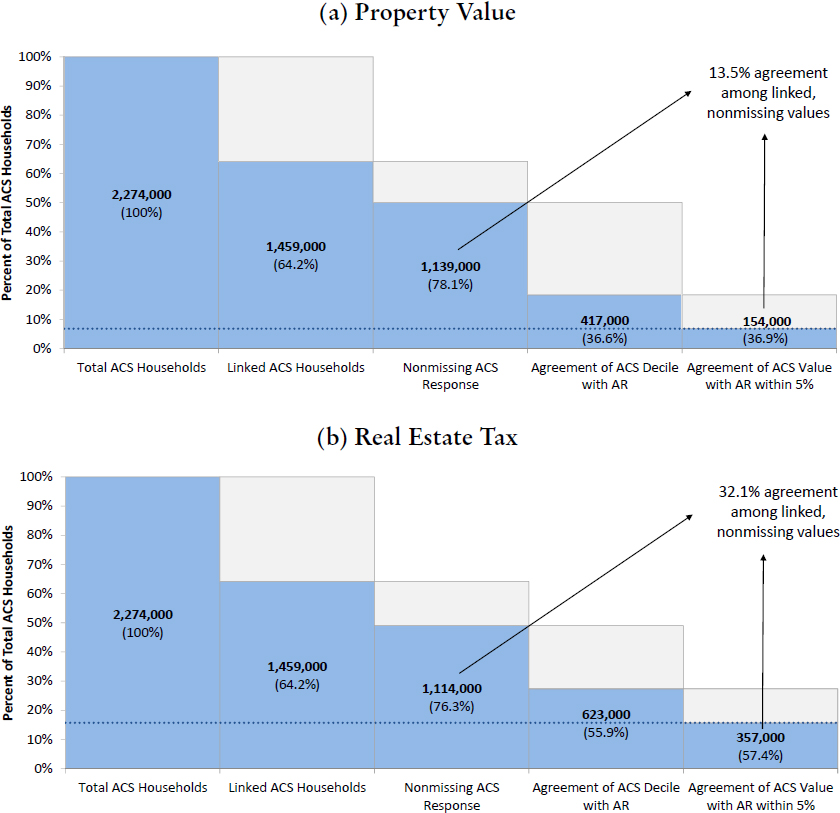
That said, Pharris-Ciurej explained that four ACS housing data items—Property Value, Costs–Real Estate Tax, Year Built, and Acreage—had been found “most promising” in his group’s analysis. He explained the rationale in a series of figures, as shown in Figure 2.1. Part (a) of the figure graphically depicts the level of agreement among linked ACS–administrative records data for the Property Value variable. Of the 2,274,000 base household returns captured by the ACS in 2014, 64.2 percent of them were able to be linked to commercial, third-party property tax data; 78.1 percent of that reduced, linked dataset (1,139,000 households) had nonmissing values for the property value item in the ACS. In the end, 36.6 percent of the linked, nonmissing values for property value were within the same decile and 13.5 percent within 5 percent of each other in numerical value. Part (b) of the figure repeats the analysis for the real estate tax question on the ACS finding a slightly higher (32.1 percent) level of agreement (defined as falling within 5 percent of the ACS-reported value) for that item.
Pharris-Ciurej observed that these percentages might appear disappointingly low, showing “lower agreement than maybe we’d want” between ACS reports and the records. Much of this, he said, is explained by conceptual alignment issues. On property value, the ACS question essentially asks what price the home might get if put on the market now while the commercial data are compiled from the assessments made by state and local governments for taxation purposes; these are sufficiently different ideas to explain differences in the raw values. But Pharris-Ciurej said that the real utility of these data is their coverage of the ACS population. In terms of the capacity for direct substitution
___________________
4 Housing question 16 on the 2018 version of the ACS questionnaire reads: “Is this house, apartment or mobile home—,” permitting the responses “Owned by you or someone in this household with a mortgage or loan? Include home equity loans.,” “Owned by you or someone in this household free and clear (without a mortgage or loan)?,” “Rented?,” or “Occupied without payment of rent?”
5 In his workshop remarks, Pharris-Ciurej did not identify the one response that appeared to perform well.
(replacement of ACS question), Pharris-Ciurej said that the Bureau’s work with the linked sample convinced them that records could provide information for 99.6 percent and 97.0 percent of ACS returns for property value and real estate tax, respectively. Similarly, Pharris-Ciurej concluded, 99.4 percent of missing (unedited) responses to the ACS property value question could be edited/imputed using records data (97.7 percent for real estate tax). Hence, he concluded, the benefits of administrative records for these two ACS data items are compelling, both the high availability of nonmissing data in the alternative sources and the perceived accuracy of government tax data.
On the Year Built ACS item, Pharris-Ciurej said that the Census Bureau had studied agreement in values between 2006–2010 vintage commercial data and the ACS household returns collected in 2012 (2,356,000 households). The Census Bureau researchers linked the files separately by two slightly different geographic identifiers, the Census Bureau’s own Master Address File ID (MAFID) and the basic street address (BSA) for the household. The difference between the two is that the MAFID would be keyed to specific housing units within structures at the address; Pharris-Ciurej said that linking by BSA effectively enables one-to-many linkages between records. Perhaps not surprisingly, they found slightly higher agreement among linked, nonmissing values on the Year Built question when linkage was done at the MAFID level than the BSA level (72.6 percent relative to 68.4 percent). He said the researchers were pleased with the strong general consistency between the ACS and vendor data—particularly because Year Built is “somewhat notorious as a cognitively difficult question for respondents to answer” and so a particularly ripe target for replacement. He said that agreement between the ACS and records value is reasonably high when defined as placing the Year Built within the same 10-year span, 78 percent for MAFID-linked and 76 percent for BSA-linked data. Again, these values may strike some as low—and there are some grounds for completeness concerns, in that linkage appears to be most successful for owned, occupied, single-family metropolitan households than for others. Pharris-Ciurej stressed overall coverage; year built is not something that many respondents may readily know (particularly for renters or apartment dwellers) and so ready access to data with perceived high quality as a substitute cannot be discounted.
The final analysis presented by Pharris-Ciurej was about the Acreage data item. Repeating the same analysis as shown in Figure 2.1 for the acreage data, for linked 2014 ACS and commercial property tax data, the 88.7 percent agreement among linked, nonmissing values is very encouraging. The results hold up fairly well for properties of different sizes, registering 92.8 percent agreement between ACS and records for properties that are less than 1 acre. Pharris-Ciurej said that the Census Bureau concluded that administrative records data could directly substitute information for 95 percent of ACS households, or they could be used for editing/imputation of 78 percent of missing (unedited) ACS responses. For the acreage question, he said that the benefits of records comes in the form of
both high availability of nonmissing data and high rate of agreement between the sources.
Pharris-Ciurej concluded by noting that this is “initial and preliminary” research, suggesting that four ACS housing items appear to be particularly ripe for supplementation through recourse to administrative records or third-party data. Clearly, missing data and conceptual alignment are major barriers for many of the housing data items, preventing even a clear reading of coverage and agreement rates. By the same token, Pharris-Ciurej said that the work had demonstrated that high coverage and agreement rates alone “do not guarantee” the usefulness of the records-based sources; the low numerical agreement between ACS and records values for something like property value need to be weighed in the context of other important attributes such as the confidence attached to the alternative data source, the existence of records-based data for missing survey values, and solid conceptual alignment between the sources.
2.1.3 Discussion
Linda Jacobsen (Population Reference Bureau) opened her remarks, as leader of discussion for this block of workshop presentations, by commending what she described as the Census Bureau’s ongoing commitment and diligent efforts to improve the ACS. In particular, she recognized the Census Bureau’s active search for feedback from subject matter experts and data users through a variety of forums, including but not limited to workshops like this one.
Jacobsen oriented her remarks along four broad themes, the first of which is a paramount focus on assessing data quality. In the quest to determine what administrative records or third-party data sources might be a “gold standard” for comparisons, Jacobsen said that it is important to keep in mind the fundamental concept that all data sources have error—the ACS, administrative records, and third-party data alike. A real “gold standard” of absolute truth is unknowable; Jacobsen said the Census Bureau’s work to date appropriately recognizes that the quality and reliability of administrative and third-party data may vary across geographic areas, and that these alternative data sources may be more accurate or applicable for some population subgroups than others. Picking up on Pharris-Ciurej’s work on the Property Value data item, she said that the variable neatly illustrates numerous conceptual problems:
- Property value is inherently difficult to measure because it is a relative concept—based not on objective, physical measures but rather on the recent sales prices of homes/properties deemed comparable.
- It is, as Pharris-Ciurej said in his presentation, an attribute that is difficult for ACS respondents to process. Jacobsen suggested that many, if not most, ACS respondents might not know with any precision how to answer the question. If someone has been living in a home for a long
-
while and has not contemplated selling it, how would he or she necessarily know the market price?
- The unit of measurement and exact definitions underlying the values in third-party sources need to be reviewed critically: Government assessments for tax purposes are not necessarily a “more accurate” measure of property value as the ACS defines it. Local government assessments are commonly based on neighborhood-level estimates rather than measures specific to the individual property. She used her own neighborhood as an example, in which a recent trend toward “tear downs”—replacement of the 1960s-vintage homes with newer, larger, and more expensive homes—has boosted the assessed value of all the homes in the neighborhood, whether they are a new build or not. Moreover, the third-party property tax data may also rely on estimates derived from statistical models—the exact construction and composition of which may be company-proprietary and hence not transparent, making assessment of the accuracy of the data a difficult prospect.
Jacobsen’s first theme focused on the generation of additional knowledge about the quality and meaning of administrative records data; her second theme was that there is a need to identify more or better ways to share that information. Foreshadowing later presentations, Jacobsen noted that many researchers at the state and local level use administrative data sources in a wide range of applications—and sometimes are responsible for the generation of some of the data. Yet the state and local perspective is perhaps too frequently overlooked, and researchers at those levels may have fewer opportunities to participate in professional meetings and conferences where knowledge of the actual uses of administrative data are shared. Accordingly, she said, there is a need to find better ways for them to share their experience with the broader community—precisely because they are most familiar with the administrative and commercial data that apply to their geographic areas and their specific applications.
Jacobson’s third theme was to recognize that, as Victoria Velkoff noted in her introductory remarks, the ACS faces resource constraints. She said that the Census Bureau needs to have a transparent process for defining criteria and prioritizing across the broad uses of third-party data (substitution, editing/imputation, blending) applied to the range of ACS data items. Some candidate criteria that she suggested might be used are to focus on research and applications that:
- Reduce respondent burden most,
- Increase data quality or reliability most,
- Provide the greatest savings in survey cost,
- Are easiest to implement or are most consistent with new Census Bureau disclosure avoidance procedures, or that
- Have the least negative impact on data users.
Jacobsen’s fourth theme related to her second theme, on garnering state and local practitioner input. Jacobsen urged the Census Bureau to continue to actively incorporate data user perspectives and experience in research and decisions for the survey’s future. Regarding wider incorporation of administrative and third-party data into ACS production, Jacobsen said that it is essential for the Census Bureau to communicate potential changes and their implications to data users in advance of implementation. This is particularly the case if the changes will result in a “break in series” in the time trends for affected ACS variables, of if they will have effects on the availability of the most fine-grained 5-year-average data from the ACS. Jacobsen suggested that it is critical that data user feedback be sought before changes are implemented, in order to assess the possible impact on mission-critical applications of ACS estimates. Doing this effectively will require both attention to documentation of data and procedures and to communication materials and their dissemination strategies. Jacobsen suggested the Census Bureau form active collaborations with data users, particularly those who serve as essential intermediaries in explaining and providing ACS and census data to the broader data user community. And, while the solicitation of feedback before change is implemented is the piece that is sometimes easy to overlook, Jacobsen said that there remains an important need to collect data user feedback after changes have been implemented—to measure the actual impacts on particular applications and to evaluate completely unanticipated effects of the changes.
2.1.4 Floor Discussion
Moderator Michael Davern (NORC at the University of Chicago) opened the floor discussion for this workshop block by picking up on the “gold standard” terminology invoked in some of the spoken remarks—dryly noting that the United States went off the gold standard for its currency in the early 1970s, for good reason. His point, he said, is that agreement between the ACS and the administrative records/third-party sources is good, but the real analytic and policy value is in understanding systematic disagreement between the sources. When asked whether the Bureau is looking into whether and why records and survey data disagree, Ortman replied that the Bureau researchers are very interested in digging into the “why?” behind disagreements. Property value is a good example, and Ortman noted that more would be said in Sandra Clark’s workshop presentation (Section 2.2.1). It is early in the work, but Ortman said that one emerging “bottom line” is that modeling and blending of ACS and administrative records data may prove to be a more practical solution than wide-scale substitution.
Dan Weinberg (DHW Consulting) observed that he had done some work with CoreLogic housing data, and commented that CoreLogic had not really used or exploited the longitudinal structure of the underlying data sources being
combined and modeled in the commercial product. Specifically, there did not seem to be attention placed on longitudinal editing; there might be good year-to-year consistency in some variable except for one unusual spike, but that dominant trend might not be accounted for in calculating a modeled value. He said that this might contribute to the somewhat low agreement rates seen in Pharris-Ciurej’s analysis, and this problem might lend itself to things more sophisticated than year-to-year comparison and concatenation.
Jenny Genser (Food and Nutrition Service, U.S. Department of Agriculture) asked for comment about the challenge of corralling administrative data from 50 states and the District of Columbia. Ortman replied that this practical difficulty with administrative data plays into some of the guiding principles listed in Box 2.2, including those on data source and geographic coverage. For nonfederal sources, she said that variability among the states (in devoting resources to data collection and sharing) and state and local levels of cooperation are always going to be challenges.
Connie Citro (Committee on National Statistics) said she was particularly struck by Jacobsen’s inclusion of “reducing respondent burden the most” as a lead criterion for identifying research directions. Citro argued that reducing respondent burden is a good criterion, but her opinion is that the Census Bureau’s biggest need is to clearly demonstrate some big “wins” in reducing burden. The ACS items on Year Built and Property Value are questions that can lead respondents to make big, inaccurate guesses. To date, Citro said, the Census Bureau has not put a firm stake in the ground on these points—committed to sunsetting a question or two from the questionnaire if various quality criteria are met for substituting that information from an alternative source. She added that a clear “win” on reducing respondent burden would be good to show Congress (to shore up the ongoing viability of the survey) and to begin to break the pervasive mentality among some that survey data are the paramount or only source of accurate data. Setting a deadline for sunsetting questions, putting that kind of stake in the ground, would give the Census Bureau experience in moving into production with administrative records–based indicators. In reply, Ortman said that the Census Bureau staff would return to this topic at the end of the workshop’s first day, in trying to identify next steps. While conceding that Year Built is an obvious candidate for such a stake in the ground, Ortman said that the Census Bureau was not yet prepared to make that manner of commitment.
Shawn Bucholtz (U.S. Department of Housing and Urban Development [HUD]) echoed Citro’s call, saying that the Census Bureau and the research community have arguably hit a maturity level with available data on some items, such as receipt of HUD rental assistance or presence of a mortgage, and the generation of a detailed, “companion” microdata file for research purposes could be a useful step. Doing so could get the broader research community to “do some of the hard work” of examining the suitability of the data for imputation or other purposes; such a file could be a good way to elicit help
and feedback, based on actual application of the data. Ortman thanked him for the suggestion. In later colloquy, Stephen Tordella (Decision Demographics) asked whether such micro-level datasets for (external) research purposes would be cleared by the Census Bureau’s Disclosure Review Board. The answer from Census Bureau staff was that this is not known with certainty but that it would be an issue to which the Bureau would be devoting a lot of time. Foreshadowing his presentation later in the day, Robert Avery (Federal Housing Finance Agency) added that he has been engaged in 5–6 years of analysis on available mortgage data, doing extensive matching between administrative sources and survey data. Though results from the survey work are slated to be released in the coming months, he noted that his team has had to redact all geographic detail from their public-facing files—to comply with a privacy review conducted by the Census Bureau itself at the National Mortgage Database project’s request. The reason for the redaction is that mortgage data sources are generally in the public domain, making Federal Housing Agency (FHA) loans very easy to identify based on publicly available data. He did not discount the notion or the value of constructing such a dataset, but observed that it may be important to cast it as a research area and a research-only dataset rather than “pure” public-use microdata files, because a truly public file is unlikely to be effective.
Dean Resnick (NORC at the University of Chicago), building on the general burden question, asked whether it is too difficult to contemplate withholding some questions for individual ACS respondents. That is, he asked if it is feasible to vary the within-questionnaire skip patterns on individual administrations of the survey (depending on what information might be known about a particular respondent household from other sources). The subsequent discussion clarified that this applied strictly to the Internet- or enumerator-administered questionnaire, as custom questionnaires on paper would be unworkable. Ortman said that this approach is something that the Census Bureau is contemplating, albeit for some of the housing data items (asked once of the entire household) rather than the person data items (asked about every household member) on the ACS questionnaire.
Tordella closed the discussion with a follow-up question related to the guiding principle of, and deep concerns about, “conceptual misalignment” between the ACS and the alternative data sources. His comment related to assessing how well the alternative data estimates conform with the concepts defined in ACS questions (and possible alternatives to improve that match). But, he said, perhaps the Census Bureau itself might be better off changing its concepts or definitions, or even “abandoning” them, to better conform with wider, external uses. In discussion, Ortman said that this is certainly something that the Census Bureau is considering—albeit not as strongly as “abandoning” existing concepts. The concepts that a particular dataset actually measures may be distinct from what planners think it is measuring, so attention to both sides (and possible revisions of concept on both sides) are certainly possible. Ortman
said the Census Bureau needs to remain cognizant of the legal or regulatory basis for individual questions (that is, there might be specific concepts necessitated by law or regulation).
2.2 CENSUS BUREAU RESEARCH AND PRACTICE ON ADMINISTRATIVE RECORDS IN THE ACS
2.2.1 Simulating the Use of Administrative Records in ACS Production, for Housing Variables
Sandra Clark (U.S. Census Bureau)6 described the ACS as the “perfect platform” for reliable simulation of the incorporation of administrative records or third-party data into survey responses for a number of reasons, notably the survey’s large sample size and extensive geographic coverage. She noted that this work is meant to be consistent with the ACS program’s goals of providing “reputable, researched, and responsive” products—but also cautioned that the research is just the first step in understanding the possible contributions that third-party data could make in the ACS.
Clark said the simulation began with linking 2015-vintage administrative data with the set of ACS returns from 2015, and focused attention on the four variables deemed most promising for interface with alternative data: Year Built, Acreage, Costs–Real Estate Taxes, and Property Value. It proceeded by matching ACS returns and third-party records and sought to simulate what would have happened if the third-party data had been used for both direct substitution and for editing/imputation, in an adaptive design approach to ACS conduct:
- For 2015 ACS responses via automated modes (Internet, personal interview using electronic instrument, or interview by telephone [that option not yet having been eliminated in 2015]), direct substitution was used whenever possible for the four selected housing data items. For each of the four housing variables in turn, and for every household for which the information was available from the administrative records data, the administrative records value was used instead (thus simulating what would happen if the question had been skipped entirely in the actual interview). If the information for the question was not available in the records data, then the respondent-supplied value was used instead (thus simulating the act of directly asking the question).
- For responses via paper/mail mode, the administrative records match came into play depending on the completeness of response. If any of the four housing data items were missing for a particular household and the information could be retrieved from the administrative data, then the
___________________
6 Sandra Clark acknowledged the contributions of several Census Bureau co-authors to this work: R. Chase Sawyer, Amanda Klimek, Christopher Mazur, William Chapin, and Ellen Wilson.
administrative data value was used. Otherwise, the ACS program’s usual imputation protocols was followed to fill in the missing values.
The administrative records or third-party data used for this simulation were all from the housing analytics vendor CoreLogic. Specifically, the Year Built, Acreage, and Costs–Real Estate Taxes data were drawn from 2015-vintage property tax records compiled by CoreLogic, while the Property Value variable consisted of values calculated from CoreLogic’s proprietary automated valuation model (AVM). Clark said that the Census Bureau chose to use the CoreLogic AVM value after consultation with subject matter experts, including colleagues at the U.S. Department of Housing and Urban Development, and she added that the CoreLogic-generated AVM values were probably similar in nature to those used by the online real estate database company Zillow.
Under this design, the analysis compares estimates calculated from the “simulated” or records-augmented data with the actual, “published” 2015 ACS estimates that were released in late 2016. At a high level, Clark said that the work suggested that the substitution does have a distinct effect. The four selected variables are used in 575 estimates (key measures and summary metrics) at the U.S.-level, and 79 percent of those were statistically different; the differences were not uniform, but Clark said that the Bureau noted the tendency, for many items, for the simulated records-based value to be lower than the published value. For each of the four variables, the item allocation rate was significantly lower for the simulated data than the published data—that is, the Census Bureau was less likely to need to resort to “hot-deck” or traditional imputation techniques for these four variables because they were generally more available in the CoreLogic data. This is particularly the case for the Property Value and Costs–Real Estate Tax variables, Property Value dropping from an allocation rate of 12.0 to 5.0 percent between published and simulated data and Costs–Real Estate Tax dropping from 16.9 percent to 4.5 percent. Again at a high level, Clark said that one reason for looking at the four selected housing items is that those questions play only a “small” role in the editing/imputation process for other survey items besides the chosen four. That said, Clark observed that the Bureau had found that the simulated data also led to unexpected impacts in other data items on the questionnaire relative to the published data; notably, incorporation of the third-party data into the Property Value data item did yield a noticeable change in the national-level indicators for Household Income, by way of that small role in editing and imputation.
To suggest geographic variation in differences between the simulated and published values, Clark presented a series of three choropleth maps depicting the percent difference between the simulated and published values for median Property Value, the three maps focusing on the state, county, and place levels respectively. (To make the mapping work, with the available 1-year ACS data, the county-level analysis looked only at counties with 65,000 population
or greater while the place/city map depicted circles scaled proportionate to population size for the nation’s largest cities rather than their geographic boundaries.) At the state level, the simulated value was uniformly less than the published value, the difference appearing particularly large along the Pacific coast (including Nevada), in Georgia and Florida in the South, and in New Jersey. The same pattern generally holds for counties and places, though 16 of the 819 mapped counties registered a simulated median Property Value greater than the published result and 180 of the counties show no statistically significant difference.7 The place/city results were similar to the county results, with an appreciable share of large cities showing no significant difference and a small number of places registering higher simulated median Property Value than published. Clark emphasized that, as had been mentioned earlier in the workshop, the pervasiveness in difference across the geographic levels is not very surprising due to conceptual mismatch issues—the ACS question asking respondents what they think that their home is worth, and that value tending to be an overestimate relative to the tax records and appraisers. That said, Clark pointed out an extreme example in the other direction: the city of Flint, Michigan, in which the simulated median property value was 66 percent higher than the published value. She attributed this to being a case in which administrative data are slow to catch up with a sudden, major shock—in this case, the city’s public health crisis—and deemed it a case in which direct substitution may not be useful. However, one of the ACS’s key conceptual strengths is its ability to provide small-area information, and it is often asked to do so in response to natural disasters and other local events, so the possible time-lag effect suggested by Flint—administrative records perhaps not registering sharp and sudden devaluation—might sound a cautionary note for direct replacement of items using administrative records data.
In order to roughly measure potential reductions in respondent burden, Clark said that her group’s analysis classified 2015 ACS responses by match status, judging them a “match” if the ACS-responding household had a corresponding administrative records-based value for any of the four tested questionnaire items and a “non-match” otherwise. Examined by state, Clark said this overall match rate ranged from 78 percent (Iowa) to 9 percent (Maine), with the rate being over 50 percent for the vast majority of states. Then, for each of the four tested housing variables in turn, the “match” ACS respondent households were further classified as:
- Burden reduction, meaning that there is an administrative records value for that particular variable and that particular household, obviating the need to ask the question in an automated interview;
___________________
7 At the workshop, the number of counties with no statistically significant difference was reported as 181. After the workshop, in finalizing the research, the figure was revised to 180.
- Potential mail burden reduction, meaning that there is an administrative records value for that particular variable and household but the household responded by mail/paper questionnaire, and so would not represent a burden reduction unless the mail/paper mode “adapted” as well; and
- Match—value not available, meaning that the match was to at least one of the other three tested variables.
Plotting these match rates as stacked bar charts, separately by each variable, showed considerable variation among the states, a small number of states being particularly prone to missing administrative records values for Property Value or Year Structure Built (and so registering “Match—value not available” for that variable). Clark characterized it as “many” states having greater than 50 percent “burden reduction” match rates in each of the variables. Fairly pervasive bands of up to 20 percent of respondent households being “potential mail burden reduction” suggests to Clark that including this kind of adaptive design in the mail/paper mode could have strong benefit—but would also be very difficult to manage (and for cost reasons). Clark briefly presented similar stacked-bar charts for the county level, with similar visual impressions arising: encouraging, greater-than-50-percent overall match rates being the norm, but with more variability and less compelling burden reduction rates when examined by separate variables (with Year Structure Built and Property Value, again, performing most poorly). Clark demonstrated that mapping the county-level burden reduction rates by each question hints at the administrative records data being generally more complete and available in more populous, urban counties. Rural areas, generally, appear to be more dependent on the mail/paper mode of response to the ACS, she said. Overall, Clark calculated the burden reduction at the national level at 52 percent for Acreage, 54 percent for Costs–Real Estate Tax, 47 percent for Property Value, and 38 percent for Year Built.
In recapping the major challenges encountered during this work, Clark began by conceding the inherent uncertainty associated with reliance on an outside vendor in CoreLogic. Contracts, prices, and methodologies are all subject to unexpected change; new vendors can always come into the equation; and there is always a risk associated with depending on the output of CoreLogic’s (or any particular vendor’s) undocumented and proprietary automated valuation model as the “best” alternative source of property value data. The county-level analysis underscores that the completeness of administrative data differs across jurisdictions, making the data unavailable for some areas and types of housing units. Moreover, Clark said there may be important differences in analysis created by time lags between economic developments and their becoming manifest in survey versus administrative records data. Though linkage methodologies have improved markedly in recent years, Clark said it is sometimes difficult to impossible to link records to survey data (and that
improved linkage techniques remain an important research area). Given the Census Bureau’s mission to treat all jurisdictions and potential respondents equally, Clark said that there is the lingering challenge to effectively adapt data collection techniques in all modes (particularly difficult for mail/paper); implementing any of these changes involves major changes to the entire survey life cycle, requiring significant resources and extensive testing to minimize risk. Finally, a recurrent theme throughout the workshop, Clark said using administrative records can complicate the application of new data disclosure avoidance rules.
As a preliminary conclusion, Clark said that she and the Census Bureau team had concluded that full incorporation of administrative records or third-party data for any of these four tested housing data series would create a “break in series” relative to earlier years of data. This simulation work underscored that administrative records data and ACS response data are simply so “different” from each other—neither uniquely better nor uniquely worse but simply different—that such a break is virtually inevitable. Such a “break in series” is not something that the Census Bureau takes lightly; there would also be a ripple effect on other survey items, and differential availability or quality of the records sources could “unfairly represent” some geographic subgroups (particularly if used for direct replacement of questionnaire items). But, Clark said, the potential benefits are too compelling to neglect: significant reduction in respondent burden and great improvement in item allocation rates.
2.2.2 Comparison of ACS-Based and Administrative Records-Based Indicators of Income
Jonathan Rothbaum (U.S. Census Bureau) began his remarks with a basic comparison, using estimated, national values for selected income types (earnings, property income, transfers/pensions and retirements, and overall). These values from two different Census Bureau-conducted surveys—the 1990–1996 and 2007–2012 averages from the Current Population Survey (CPS) and the 2007–2012 averages from the ACS—were compared with the relevant aggregates in the National Income and Product Accounts (NIPA) maintained by the Bureau of Economic Analysis (BEA). In terms of earnings, Rothbaum said that the different, relevant Census Bureau surveys “generally capture most of the dollars” in the BEA figures—90 percent or more—for several types of income, but that other types of income are more challenging. For instance, he said that the ACS average captures only about half of the relevant activity for property income. The ACS does not delve into income in the same detail as the CPS, so the ACS measure of transfers (primarily Social Security income, but other sources as well) also includes pension and retirement income that the CPS
is capable of estimating separately. But, on balance, the survey-based measures capture 80 percent or more of the BEA NIPA values for transfers.8
At the most aggregate level, Rothbaum said survey-based measures do well on earnings and Social Security income and less well on other income types—but, he added, the interest in this area of research is how well the comparison works on individual/household records and at lower levels of aggregation. Rothbaum briefly described the Census Bureau’s process as probabilistically linking individuals to, effectively, Social Security numbers using name, age, and other characteristics. Identifying information is removed and replaced with a Protected Identification Key (PIK), which then becomes the basis for final matching and linking. Each year, Rothbaum said, 7–9 percent of the individuals in the ACS sample are not linked to their Social Security numbers, are not able to be associated with a PIK, and so are unlinkable to individual administrative data. For actions such as direct replacement, he said, as much as 9 percent is not linkable to alternative income data from records sources.
Rothbaum cited the O’Hara et al. (2016) analysis of linked 2011 ACS returns and Internal Revenue Service (IRS) W-2 forms in concluding that a high correspondence exists between the existence of a W-2 (earnings reported to the IRS) and earnings being reported (nonzero) in the ACS. Specifically, 52 percent of the linked set were found to have both a survey response to the earnings question and a W-2 on file, 38 percent had neither a survey response on earnings nor a W-2 on file, and the one-but-not-the-other combinations split the remaining 10 percent of the linked data. Rothbaum noted these percentages are comparable to those using CPS data, for which there is not necessarily the mismatch in time periods between W-2 (calendar year) and ACS (last 12 months) data. Also citing O’Hara et al. (2016), Rothbaum observed that the response values are strongly correlated as well; plotting the logarithms of total wages from the 2011 ACS and W-2 returns yields a reasonably good linear fit though not quite one-to-one correspondence; for lower-income respondents, the value reported to the ACS tends to be higher than the value on file in the W-2. He added that this is not necessarily misreporting and that, particularly at lower levels of income, there are reasons for not reporting income to the IRS, but it needs to be borne in mind in examining poverty through survey and administrative data. Rothbaum described investigation of these differences as a very active research area for the Census Bureau, alluding to additional research in the literature suggesting some tendency toward misreporting among males (especially, again, at low incomes) and among more educated respondents.
Rothbaum cited analysis of 1997 data from the CPS Annual Social and Economic Supplement (ASEC), rather than from the ACS, to illustrate that similar patterns hold for Social Security income and retirement income, but with critical deviations. Using matched survey and Social Security
___________________
8 Rothbaum cited his own Census Bureau report (Rothbaum, 2015) as the source for the figure.
Administration payment records, 87 percent of cases showed a nonzero survey response for Social Security income and a record of payment in the administrative records—and, as with earnings, the actual reported values are strongly correlated for that subset of cases. Put another way, Rothbaum said, Social Security recipiency as measured by the survey appears to be accurate, subject to low Type II error. But he added that nonrecipiency is subject to high Type I error when measured by survey; only 5 percent of the matched cases registered both a survey report of zero Social Security income and no SSA record of payment. (About 4 percent of the matched cases fell into the off-diagonals, instances of the survey showing zero SSA income but nonzero payment in SSA records or vice versa.) And if the results for Social Security income “look bad to you,” Rothbaum cautioned, then “don’t look at retirement income,” where the picture is worse. Based on analysis of matched 2009 CPS ASEC data with IRS form 1099-R records, nonrecipiency in the 1099-R data is overwhelmingly likely to correspond with nonrecipiency in the survey data. Rothbaum said only 45 percent of recipients in the administrative/1099-R data also report retirement income in the survey, meaning that a majority do not. Part of this is confusion on the reporting of 401(k) funds, Rothbaum said, but not all—remarking that this amount of difference has a “huge impact on how we measure income” for persons age 65 and older. Rothbaum said that survey-based measures of income for the 65-and-older population are roughly 30 percent too low (household median income, when the head of household is 65 or older) and measures of poverty are 2–2.5 percentage points too high. Rothbaum said that the same holds true when looking at other income types, such as receipt of SNAP or TANF benefits. Still, Rothbaum made the general assessment that earnings and Social Security are generally well reported in the data, that the quality and degree of reporting varies for other types of income, and that underreporting and misreporting can be severe. But, he said, even in those cases, conditional on their reporting a value on the survey, that value tends to be relatively accurate.
Turning to the possibilities of using administrative records data to deal with survey nonresponse (whether whole-unit or individual-item), Rothbaum began by illustrating the extent to which income data have had to be imputed in part or in whole in the ACS over the years. Figure 2.2 shows his calculations from ACS data files, showing a general increasing trend over the past decade of 20–30 percent of individuals in the ACS sample needing to have part of their income imputed for nonresponse; in dollar values, imputation has accounted for 15–20 percent of aggregate personal income. Rothbaum suggested that these values are actually reasonably good given the dominant trend toward increased survey nonresponse, and that the picture for the CPS ASEC appears considerably worse (the ACS benefiting from its mandatory-response status). Analysis of those CPS ASEC data do suggest some general patterns to consider in the ACS context; Rothbaum noted that the CPS ASEC shows markedly
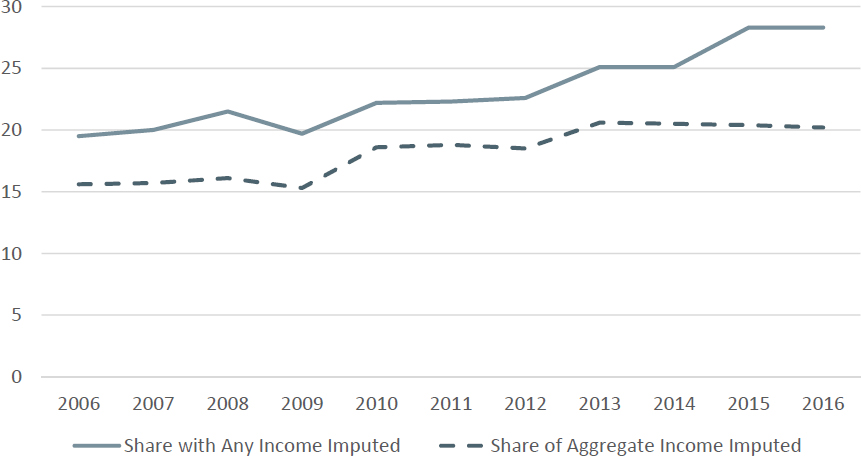
higher nonresponse for the highest and lowest income percentiles (which has implications for the accuracy of imputation in general). He said that research that he has participated in regarding income imputation in the CPS ASEC suggests a tendency to consistently overstate average income when using administrative data in imputing for nonresponse.
Having raised some of the underlying conceptual issues and basic findings from his research, Rothbaum quickly reviewed the table reproduced in Table 2.1. He said that the table asks, for various components of income requested on the ACS questionnaire, three basic questions: What are the data that the Census Bureau have, what are the data that might be useful, and what are some of the concerns? Some of the things noted in the comments and “concerns” column are recurring themes and challenges in the measurement of income in general. For overall earnings, a major concern is unreported earnings that do not appear on individuals’ W-2 forms for a variety of reasons. For income specifically from self-employment, he said that evidence from surveys of consumption generally show spending among the self-employed to be much higher than the self-reported income value would suggest, raising concerns about the accuracy of either administrative records or a general survey like the
ACS to capture that specific income type. And, for dividend income, Rothbaum said that the major challenge is that the administrative data are largely limited to the existence of a return rather than the content. But, conversely, Rothbaum said that administrative records information on Social Security income might be as close to a “gold standard” as possible: if the Social Security Administration does not have a record of someone getting paid a benefit, they probably were not paid the benefit.
Before presenting his analysis, Rothbaum alluded to ongoing cognitive testing being done by the Census Bureau on burden reduction specific to the income data items. In particular, one thread of the research starts with the premise that the task of providing the full breakdown of income by type might be too difficult and might detract from the accuracy of reporting of overall income, so the cognitive testing work is considering variants of the ACS questionnaire that ask yes/no for recipiency of certain income types only (not the individual amounts), with total income being the only dollar-value income amount requested. Another part of the cognitive testing work attempts to change the relevant reference period, asking respondents to describe their income in the prior calendar year rather than just the previous 12 months from the date of the interview. The work is ongoing, so it is not known what effect the change might have in accuracy.
As Rothbaum described them, the basic approaches for reducing respondent burden associated with the income questions on the ACS, via direct replacement, involve different thresholds for performing that replacement. One approach would be to drop the income-type-and-amount questions for everyone (or nearly everyone) in the ACS sample, substituting administrative records values for the “missing” income-breakdown information as possible. The detailed income questions could still be asked of a subsample of respondents, and those responses (or those from another income survey such as the CPS ASEC) could be used with other ACS covariates and administrative records information to model survey responses to the income question for the full sample. Variants on the modeling with replacement approach would be more aggressive in modeling/replacing additional income types, or use “universe” administrative record data and ACS sample to generate estimates that are more precise and specific to geographic/demographic subgroups.
To approximate these approaches, Rothbaum described constructing and analyzing two different files. His Survey-Only File retains ACS income-question responses for about 3 percent of the ACS sample (a level he said that he based on the size of the CPS ASEC sample relative to the ACS). Rothbaum used those responses and administrative records (IRS Form W-2, 1040, and 1099-R entries) to construct regression models that were then used to impute income recipiency and value responses for the remainder of the sample. He noted in brief that the estimation was done sequentially, opting to model a first income type using only the other ACS and administrative records characteristics, but including
| ACS Data Item | Available to Census Bureau? | Other Useful Sources | Issues/Discussion |
|---|---|---|---|
| Wages, salary, commissions, bonuses, or tips from all jobs. |
W-2s Longitudinal Employer-Household Dynamics (LEHD) 1040s |
National Directory of New Hires (NDNH) |
Unreported earnings. Note that only UI records from LEHD capture GROSS earnings before any deductions. Amounts excluded from income such as employee health premiums do not show up on any IRS forms. |
| Self-employment income from own nonfarm business or farm businesses, including proprietorships and partnerships. |
1040 Schedule SE (only receipt, not amount) 1040 Schedule C (only receipt, not amount) |
1040 schedule amounts 1099-MISC |
Unreported earnings. Evidence from consumption surveys and audit studies suggests substantial under-reporting of income in both surveys and administrative records. |
| Interest, dividends, net rental income, royalty income, or income from estate and trusts. |
1099-DIV/INT (incidence, some years) 1040 Schedule B (interest and dividends) 1040 Schedule E (rental and royalty income and income from estates and trusts)—gross only 1040 Line 8a and 8b for tax-exempt and taxable interest, Line 9 for total dividends all ACS year |
1099-DIV/INT amounts 1040 Schedule E net rental income 1041-K1 for rental income 1040 Line 17 Rental, royalties, estates/trusts (must be filed if estate and trust income present) |
Missing Interest and dividend payments under $10. Only gross rental income currently available on 1040s. |
| ACS Data Item | Available to Census Bureau? | Other Useful Sources | Issues/Discussion |
|---|---|---|---|
| Social Security or Railroad Retirement |
SSA-1099 (incidence, some years) 1040 (this is total Social Security benefits not the taxable amount) |
SSA-1099 (amounts and incidence for other years) SSA Master Beneficiary Record and Payment History Update Files 1099-RRB |
1040 SS data is of questionable quality in earlier years of ACS. Having only the Social Security data, without SSI data is problematic for income replacement given program confusion in reporting. |
| Supplemental Security Income. |
SSA SSI (incidence) |
SSA SSI (amounts) |
This is not taxable, so SSA is the only possible source for this information |
| Any public assistance or welfare payments from the state of local welfare office. | TANF |
This is not taxable so states are the only possible source of this information. Available with full coverage in some states, sample in others, with no data from many states. Not clear whether it is feasible to gather information on local government programs. |
|
| Retirement, survivor, or disability pensions. |
1099-R (This should include nontaxable benefits and some disability) |
SSA-1099 (Social Security Disability and survivor benefits) 1099-MISC (Employer/Union paid survivor benefits) W-2 (Short-term disability payments, not on the current W-2 received) Veterans’ Disability/Survivor: VA (not taxable) 1040, Schedule R for disability payments |
| ACS Data Item | Available to Census Bureau? | Other Useful Sources | Issues/Discussion |
|---|---|---|---|
| Any other sources of income received regularly such as Veterans’ payments, unemployment compensation, child support, or alimony. |
Unemployment: 1099-G (incidence, some years) |
Unemployment: 1099-G (amounts and incidence for other years) Alimony: 1040 Line 11. Other Income: 1040 Line 21, Includes: Nonbusiness credit card debt cancellation, which can be netted out with 1099-C if not desired); Prizes and awards; Gambling winnings; Jury duty pay; Alaska permanent fund dividends Educational Assistance/Pell Grants: 1098-T Veterans’ Payments: VA (not taxable) |
Child support, financial support, not covered in tax forms (available in survey data for modelling. People do get wages garnished who fail to pay child support so there is some record keeping of this that may be worth exploring) Workers’ Compensation: some taxable/some nontaxable, available for modeling from CPS ASEC. There may be some trail for nontaxable income in W-2 filed workers’ compensation that is subtracted from 1040 on line 21. Other WC is considered taxable wages in the W-2. |
SOURCE: Workshop presentation by Jonathan Rothbaum.
recipiency of income type 1 in the model to estimate income type 2, including recipiency of income types 1 and 2 in the model to estimate income type 3, and so forth. He replicated this analysis for each year, 2006–2013, to examine temporal consistency in results. His second analysis file, dubbed the Model-Replacement File, used the Survey-Only File as the base but was more aggressive in replacing ACS-reported values with administrative records information that are a rougher match to the ACS concepts. In particular, this involved making even fuller use of W-2 and 1099-R data for some categories (e.g., using Form 1040 data on adjusted gross income to measure total household income if the 1040 exists). Rothbaum mentioned making use of IRS Form 1040 information on gross income from rent in lieu of the ACS-requested data on interest and dividends earnings—something that he said is thought to “vastly overstate” that type of income but that nonetheless would be a good test of utilizing those available data—but the conceptual mismatch is too great to bridge for this current work.
The results were consistent with the themes already outlined, Rothbaum said. Looking at ratios of total household income, modeled Survey-Only File to the published ACS results, across percentiles of the income distribution for a single survey year, the ideal result would be a flat-line ratio of 1. Rothbaum generally found that this is the case for middle to large percentiles of the income distribution, but the line distinctly dips below 1 for the lowest income percentiles relative to the published ACS rsults. That is, the modeled, administrative-records-based measures tend to understate income (and overstate poverty) at the lowest percentiles relative to the published ACS results. This result generally holds for all years at the national level and across states. Results from the Model-Replacement File yield an even more exacerbated gap for the lower income classes. Analyzing the years separately, particularly for the file where substitution of 1040 adjusted gross income is more liberal, shows an anomaly similar to the time lag Clark noted in her data (see Section 2.2.1). In the pivotal recession year of 2008, there was more incentive/reason for households to file a zero-income 1040 return, causing a massive number of 0 values not seen in 2007 or 2009—and consequently an even greater divergence from the ACS-published estimates for the lowest income percentile.
Summarizing, Rothbaum cautioned that measurement error can bias estimates of the income distribution, primarily because respondents tend to underreport recipiency; that two major types of income, base earnings and Social Security income, are fairly well represented in administrative records data but other income types are more challenging; and that even those well-covered income types are prone to be discrepant at the lowest levels of income. There are high-quality sources of information that might be brought to bear—detailed IRS data from Form 1040 and 1099 returns on property income and Social Security Administration payment records—but that are not currently available for work with the ACS. Initial research on simulating the effect of
substitution or editing/imputation for ACS income responses suggests promise but also noisy estimates at the state level—likely even more so at smaller levels of geography—echoing Clark’s observation about needing to manage the impact of breaks-in-series when alternative data are incorporated into ACS production.
2.2.3 Planned Use of Administrative Records in the 2020 Census for Imputation of Characteristics, and Possible Extensions to the ACS
Andrew Keller (U.S. Census Bureau) discussed steps being taken to impute key characteristics—age, race, and Hispanic origin—due to nonresponse. They are premised on the decennial census, but have potential applications in the ACS that remain to be explored. Specifically, he said the 2010 decennial census enumerated roughly 308 million people across 136 million addresses. Addresses that were not resolved during the self-response phase of the 2010 census were turned over for in-person, nonresponse follow-up (NRFU) contacts. In 2010, NRFU operations applied to about 50 million of the 136 million in the universe, and the cost of mounting the NRFU operation alone was on the order of $2 billion. Nonresponse on the characteristic-information questions can happen in both the self-response and NRFU populations, and Keller noted that about 7 percent of age/date of birth values, 6.4 percent of Hispanic origin, and 6 percent of race values in the 2010 census had to be imputed. Keller noted his understanding that these percentages are “in the ballpark” of levels of missing data for these items in the ACS.
Given the cost of in-person NRFU operations, Keller said that increased use of administrative records or third-party data is seen as a “key innovation area” to reduce the cost of NRFU while maintaining data quality. One critical way in which Keller said that the 2020 census is at the unit level, using administrative records to remove some vacant housing units from the NRFU workload up front. Another approach is to directly fill information for occupied households if there is high confidence that records can reliably provide all the requisite census information for those units. This work has been developing since the early part of this decade and began to be tested as early as 2013. The Bureau is also pursuing work at the person-level; the evaluation study corresponding to editing and imputation in the 2010 census urged that the Census Bureau explore a wider use of administrative records information in those algorithms.
The research that Keller described was, effectively, reanalysis and simulation based on the 2010 census—directly substituting characteristics information from administrative records for cases that required imputation or that had been received by proxy (e.g., a neighbor or landlord). For substitution of race and Hispanic origin data, Keller said that the Bureau researchers weighed three different administrative records sources:
- Origin/country of birth information from the Census Numident file, mapping certain foreign nations of birth (as determined by work with the Census Bureau’s Population Division) to specific race and Hispanic origin values;9
- The Census Bureau’s internal Best Race and Hispanic Origin files, a research composite from various government and commercial sources that uses a rules-based approach to resolve unique race and Hispanic origin codes for person records where those values vary across different files; and
- Legacy 2000 census responses (2000 since this is simulating data in the 2010 census; 2010 census returns would be used in 2020 census processing data).
Age information for substitution comes from two of the same sources, Census Numident and reported responses in the 2000 census.
Keller said that his analysis leaves the 2010 census person count unchanged, but directly substitutes administrative records data for characteristics imputed in 2010 or filled by response from proxy reporters. This means that the analysis (and possible direct substitution) is only possible for 2010 census person records that both match to the administrative records sources and have characteristics values defined in those records—some 91 percent of persons in the 2010 census. The basic metric that Keller considered in this analysis is:
![]()
the basic percentage change in characteristic count when direct substitution is used relative to the imputation/proxy values used in actual 2010 census operations. He added the caveat that the effect of administrative records, demonstrated by this metric, is attenuated because of the relatively small size of the imputated-or-proxy-response universe, when analyzed over a total pool of 300 million persons. As a final caveat, Keller added that results could also differ if more or different alternative data sources were used rather than the limited set discussed here.
For Hispanic origin, Keller began by setting the context. The Census Coverage Measurement (CCM) program in the 2010 census estimated a 1.54 percent undercount of Hispanics nationally, about 776,000 persons. In the universe of 2010 census returns, 4.7 million values that had to be filled by imputation matched to the records sources (and have a valid value there); likewise, 6 million Hispanic origin responses gathered by proxy are eligible for
___________________
9 The distinction between Census Numident and the Social Security Administration Numerical Identification (SSA Numident) file is that the former is a reformatted version of the latter. SSA Numident is said to record all SSA transactions with regard to a specific Social Security number, while Census Numident reformats this information to construct a single record for every Social Security number.
substitution in this analysis. The two principal records sources both appear to show very good levels of agreement: Among 2010 census persons who self-reported a Hispanic origin, 98 percent of persons listed as being born in a primarily-Hispanic nation of birth in Census Numident (again, as determined with the Census Bureau’s Population Division) self-reported as Hispanic in the census. Likewise, person-record values from 2010 census self-reports of Hispanic origin and entries in the Bureau’s Best Hispanic Origin file agreed 96 percent of the time. Accordingly, for the simulation/analysis, Keller said that the Bureau team settled on a “hierarchy of use” for imputation and proxy response cases: directly substitute the Hispanic origin derived from Census Numident first; barring that, use the Best Hispanic Origin file; barring that, use the 2000 Census return.
Keller presented results for the 2010-imputed and 2010-proxy-reported groups, separately. For Hispanic origin, substituting administrative records values in lieu of imputed values yielded a 7.1 percent increase (on the order of 50,000 persons), while substitution increased Hispanic origin reporting 14.5 percent among proxy cases in the 2010 census (roughly 125,000 persons). Correspondingly, the measure of non-Hispanic origin dropped 1.2 percent and 2.5 percent using records in lieu of imputed and proxy-reported values, respectively.
Keller reported similar analysis paths for race and age:
- For race, the context is that the 2010 CCM program determined a 0.54 percent overcount of whites in the census and a 2.06 percent undercount of blacks. A match to administrative records (with valid value) could be found for 3.1 million cases where race was imputed and 6 million cases where race was obtained by proxy response, making it possible to substitute administrative records data instead. The Census Numident and Best Race files show slightly lower—but still very good—correspondence with self-responses to the race question in the 2010 census, at 90 percent and 92 percent respectively. Keller said that he used a similar hierarchy of use to substitute values: Census Numident country of origin first, Best Race file barring that, and 2000 census returns barring that. Results of the comparison are depicted in Table 2.2 and, as Keller explained, are encouraging in that the values are positive (as expected) for almost all of the major race category and replacement-type combinations, the sole exception being the slight decrease in whites that results from replacing proxy responses with administrative records. Keller explained that the seemingly anomalous results for “some other race” and “more than one race” are understandable due to limitations in the Census Numident source data. The Census Numident file does not map primarily-Hispanic countries of birth to “some other race” yet there was a strong trend in the 2010 census for Hispanics to register their race as “some other race.”
| Race Category | Percentage Increase in Race Due to Substituting AR Values | |
|---|---|---|
| Imputed | Proxy Response | |
| White | 13.5% | −0.4% |
| Black | 9.0% | 2.5% |
| American Indian and Alaska Native | 11.2% | 55.5% |
| Asian | 18.4% | 19.6% |
| Native Hawaiian and Pacific Islander | 92.5% | 62.5% |
| Some Other Race | −49.1% | −16.5% |
| More Than One Race | −56.9% | −44.5% |
NOTE: AR, administrative records.
SOURCE: Workshop presentation by Andrew Keller, representing values printed atop entries on a bar chart in tabular form for clarity.
-
Likewise it maps countries to only one race category (thus ruling out matches to “more than one race”).
- Keller said that the hierarchy for replacing imputations and proxy responses for age used the Census Numident value first if possible, and 2000 census reports otherwise; agreement between self-reported age in the 2010 census and matched values in Census Numident was 98 percent. The results, depicted in two graphs in Figure 2.3 separately for proxy responses and imputations, illustrate the clear potential value of using the administrative data. The top graph, for proxy responses, shows—as age increases—large negative spikes at ages ending in 0 or 5 and positive values otherwise. Keller said that this meant that the records-based values were less prone to “age heaping” that occurs with proxy responses, where a neighbor or landlord’s best guess as to an individual’s age is a rough guess that is mentally rounded to a cleaner-sounding 0-or-5 age value. Keller said the negative values (decreases from using records) that dominate the second graph serve to counter the 2010 CCM’s finding of a significant overcount of persons aged 50 or higher in 2010.10
In quick summary, Keller stated that these results suggest that administrative records values could be used as substitute for proxy or otherwise-imputed values to the basic characteristics data. Simulating the effects of such replacement
___________________
10 In the short time available for discussion following this session, it was clarified that age (or date of birth) is one of the date elements considered in assigning a PIK to person-level data but that it is not absolutely necessary for the matching—the question having been raised that it seems counterintuitive to even consider imputing age from administrative data if one needs to know date-of-birth to perform the match to administrative records.
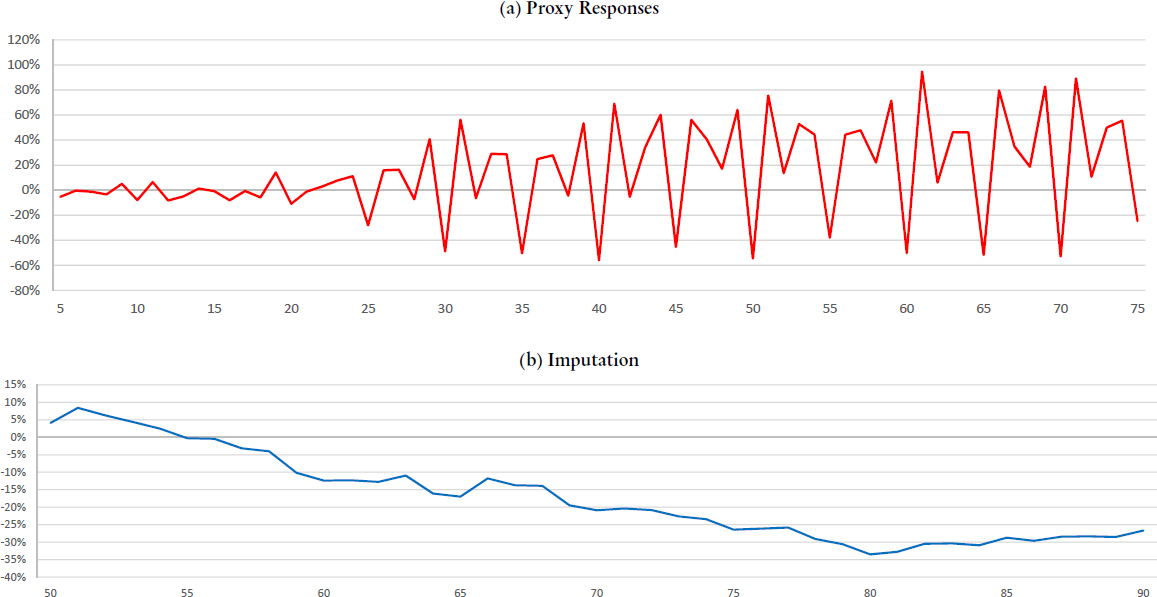
on 2010 census data shows generally salutary effects on the basic distributions of those characteristics, consistent with overarching findings about coverage in the 2010 census. Keller warned that administrative records data are not a full solution: their coverage is not complete, and they still have to satisfy rigorous edits if used for direct substitution during imputation.
2.2.4 Discussion
John Czajka (Mathematica Policy Research) framed his remarks about this set of workshop presentations with a set of overarching themes and questions related to the use of administrative data in the ACS or any other survey:
- What administrative records or third-party data exist that could directly replace survey responses?
- Which of these data sources does the Census Bureau currently receive—and what data elements does the Bureau receive from them? (Czajka cautioned that simply getting data does not mean that one gets all of the data.)
- Which of these alternative data are the ACS authorized to use?
- What legal authorization may be needed to use these data to replace survey responses?
- What disclosure-proofing must be applied to the ACS to prevent the administrative agency (source of records) from re-identifying respondents?
- How would all of this fit into the ACS production schedule?
He further noted, in overview, that Citro (2014) discussed two subject areas for which it is both “possible and incumbent on statistical agencies” to convert their survey programs into “multiple sources [of data] programs” in order to meet the needs of data users and stakeholders. Those two topic areas—housing unit characteristics and household income—dovetail neatly with the papers in this session, and hence Czajka noted that they are very appropriate starting points to considering wider use of administrative data in the ACS.
With regard to housing-related measures based on administrative data, Czajka observed that a number of housing items on the ACS questionnaire are available in state property tax records but are not included in the property tax bill that homeowners see. Accordingly, even those homeowners who are diligent in answering survey questions, looking things up as appropriate, do not have most of the information being asked—but the county and the state do tend to know those things. Czajka noted that obtaining property tax data from the full array of states and local jurisdictions may not be feasible, making third-party vendors (aggregators from those local sources) an attractive option. Echoing points made in the earlier presentations, Czajka commented that reliance on any vendor’s data raises a new host of concerns—particularly to the degree to which the vendor products involve estimation. In sharp contrast
with government estimation, estimation methodology used in commercial and third-party data may be proprietary information and transparency may be lacking. Moreover, methodology may change without notice and without details on potential effects on the data themselves. Czajka conceded that federal administrative data are not completely free of this kind of change in methodology, with unanticipated consequences, but that the public is substantially more likely to know about such changes in advance and when they happen.
Czajka said that Clark’s finding of lower allocation rates in the simulated versus published data is a notable potential benefit of the administrative data sources. He said that the fact that property values obtained from the third-party vendor were lower than those obtained from ACS respondents is consistent with the expectation that respondents will tend to overestimate the value of their property (a common sense expectation, he said, verifiable by asking any real estate agent). Czajka added that the state-level variation in match rates and in the extent of data available from the vendor implies some significant potential state-level variation in overall quality of housing data arising from direct substitution—but he added that the important follow-up question of whether that variation is worse than that in survey-based measures needs further exploration. He noted work done by Michael Davern and others involved in matching Medicaid administrative data to survey data and documenting wide variation across the states in rates.11 In that context, as in the housing context, it is unclear whether respondents were “better” or administrative records were “better,” just that they were different.
Turning to the administrative versus survey indicators of income, Czajka briefly described Statistics Canada’s use of tax records in its annual Canadian Income Survey—work that Czajka characterized as going well beyond the proverbial “stake in the ground” that Citro suggested earlier in the workshop. He said that data are collected for the annual survey between January and April each year, using the prior calendar year as the reference period.12 As Czajka described it, the use of tax data in lieu of survey question responses began as a respondent option but progressed into a straightforward declaration that the tax data will be used. He quoted the “informed replacement” notice wording provided to respondents on the questionnaire:
In order to reduce the length of the interview and enhance the information provided in this survey, Statistics Canada plans to combine your house-
___________________
11 Some of this work was described at a high level in Davern’s discussion at the 2016 workshop; see National Academies of Sciences, Engineering, and Medicine (2016:46–47).
12 Technically, as described later in Eric Olson’s remarks (Section 2.3.1), this opt-in model for use of tax data was first used in 1995 in Canada’s Survey of Labour and Income Dynamics. That survey was discontinued in 2013, but income content continued and was expanded in the new, standalone Canadian Income Survey. See http://www23.statcan.gc.ca/imdb/p2SV.pl?Function=getSurvey&SDDS=3889.
hold’s survey information with tax data. The combined data will be used for statistical purposes only, and will be kept confidential.
He said that the tax data from Canada’s revenue agency provides detailed information on income by source and on such things as pension plan contributions, as well as on the amount of tax paid; meanwhile, the income survey queries respondents for things that are not captured in the administrative tax data such as total personal income, child and spouse support received and paid, and interhousehold transfers. In this way, the income survey complemented with the tax data is able to provide much more detail on income characteristics “than we would consider doing here,” Czajka said—with a tradeoff being that the published survey analyses end up “distributing a lot of tax data.”
Particularly in contrast to the Canadian experience, Czajka characterized access to administrative data as the “elephant in the room.” The ACS does not have access to every source of administrative data that the Census Bureau receives to support its research and work, and the Census Bureau itself receives only limited elements from many of the administrative sources. And, he noted, administrative data that might be available to the Census Bureau for research cannot simply be substituted for survey responses and released, due to legal and contractual conditions on data use and on the need for respondents to be protected from disclosure of personal information. Among the thorny issues that must be resolved is the extent to which the potential reidentification of respondents by the source agency of administrative records is a major concern; Czajka said that a major concern in constructing a public use file from a match between Internal Revenue Service and Current Population Survey data, several years ago, was that the file be designed so that the U.S. Department of the Treasury could not identify people based on the IRS data alone. However, realistically, Czajka added that the prospects for making the kinds of necessary legal and regulatory changes necessary to facilitate fuller (but still secure) data access are “slim (at best)” at present. In particular, he noted that the Bipartisan Policy Center—working with the U.S. Office of Management and Budget on legislative language implementing the recommendations of the recent Commission on Evidence-Based Policymaking (2017)—decided up-front that pursuing change to 26 U.S.C. § 6103 (the passage of federal Internal Revenue Code governing disclosure of tax return information) was infeasible.13 While that was a necessary practical decision, Czajka said, it is “kind of giving up the biggest thing you want, right from the start.”
Czajka noted mention of conceptual consistency between administrative and survey data; he expanded on the point, noting that here is ample ground for conceptual inconsistency regarding the ACS’s financial data items. The survey
___________________
13 The legislation Czajka referred to, the Foundations for Evidence-Based Policymaking Act, cleared both chambers of Congress in the final days of the 115th Congress and was signed into law (P.L. 115-435) on January 14, 2019.
question asks for gross income, and Czajka said that this earnings question is an instance where “we know that the tax data are not what we ask” for in the survey—“the IRS doesn’t know your gross income.” He added there is very little known about how taxable earnings differ from gross earnings, and how those differences vary across different people.
Czajka briefly reviewed a range of data on aspects of income that are not presently available to the Census Bureau for use with the ACS. From tax return (IRS Form 1040) information for the population of tax filers, these data include the following:
- The amount of self-employment income reported on Schedule SE or on Schedule C (the latter making no exclusion below $400)—Czajka said that the IRS’s random audits have led the agency to estimate that about two-thirds of self-employment income is not reported in tax filings, making self-employment a particularly interesting and challenging case for measurement. Self-employment is a clear case where the administrative data are known to be “pretty bad”—but, as Rothbaum’s presentation had suggested, survey measures of self-employment are “all over the place,” too, so there is no good answer;
- Alimony;
- Taxable pensions and annuities;
- Rental income net of out-of-pocket expenses (from Schedule E)—referring to Rothbaum’s discussion of the conceptual consistency between administrative and survey data, Czajka said that he agreed with Rothbaum that gross rent is “clearly not what you want” to measure regarding rental income—there is a lot of out-of-pocket expenses that go along with rent. Czajka added that it should be possible to obtain net rental income from the 1040-return data—but this tax concept incorporates depreciation, which is thought to be fairly well reported because it “looks great on your tax return because it wipes out all the profit.” Alternatively, one could go to Schedule E and subtract out the out-of-pocket expenses to get the “right” number—but Czajka emphasized that his point is that “we’re far from that in terms of the data that the Census Bureau gets;” and
- Unemployment compensation.
Income data from the Social Security Administration’s Detailed Earnings Record and beneficiary data, not currently available to the ACS, include another measure of self-employment earnings (derived from the IRS Schedule SE information) and precise detail on Supplemental Security Income. Finally, from Unemployment Insurance (UI) wage data, it should be possible to derive gross earnings rather than taxable earnings. Czajka noted that the coverage in UI wage data is known to be lower than IRS data but that, to the best of his knowledge, no one had done the detailed link between UI and other tax data to fully explore those differences—which would be a hugely valuable project.
Concluding the discussion of the potential use of administrative records and third-party data in the income content of the ACS, Czajka noted three major issues and conceptual questions that require attention:
- How will differing reference periods be reconciled? As mentioned several times, the reference period in tax return data is the prior calendar year, while ACS respondents are queried about income in the past 12 months from the survey’s administration. The two do not necessarily match, and some compromise would have to be reached. Would the ACS reference period be changed to match the tax data (and would that affect the collection of other ACS information)? Or would administrative/tax data for two calendar years be averaged (with weights reflecting the portion of the calendar/reporting years within the tax reference period)? And could that accommodation of a second year of tax data even fit the ACS production schedule?
- How much gain in utility would justify the wider use of the administrative data? That is, Czajka asked, how many of the eight income-related questions on the ACS would have to be replaced/substituted with administrative data in order to justify the major change? Would it be a worthwhile investment if only one of the aspects of income could be directly replaced/substituted?
- Could, or should, the ACS income concept be expanded, as has been done recently in the Current Population Survey? Specifically, Czajka mentioned that the CPS concept of income had been revised to account for all withdrawals from individual retirement accounts (IRAs) and other pension accounts. If those kind of data could be obtained from tax data for use with the ACS, would it be worthwhile to revise the ACS concept as well. Czajka noted that IRA withdrawal income is a point on which the ACS question wording is unclear; “you have to look at the instructions and guides” for any notion of whether that is supposed to be considered part of ACS “income.”
Turning to Keller’s presentation on the planned use of administrative records data in the 2020 census for imputation of characteristics, Czajka reprised the listing of the basic potential sources of those data. Reported responses to age and the race and Hispanic origin questions in the 2000 census were treated as external, auxiliary data in Keller’s research, and the same could be said of 2010 census returns in the planned work in 2020 census production. Czajka conceded that the content and quality of the Census Bureau’s own “Best Race and Hispanic Origin files” is mysterious to observers (but “they sound great”). But the main point of attention, logically, is the SSA Numident information—of which Czajka indicated agreement with the prevailing general assessment, that Numident is “great for age and sex” (for which the Numident-recorded values are commonly verified with documentation) “but poor for race and
ethnicity.” In terms of quality of Hispanic origin data, the issue is with the indirect nature of the measure; Numident includes the country of birth, and deriving Hispanic origin from birth in some countries was found to be fairly reliable in the 2010 census, Czajka said. But the problem of race data in the Numident files is more complex, and he said that complexity illustrates both the potential limitations of administrative data and how concepts of coverage and measurement can change in administrative sources over time. The race data included in the SSA Numident file is the race information collected at the time that application was made to obtain a Social Security number (SSN). Prior to 1980, that application form only permitted white, black, and other as reporting options. In 1980, the race item on the application was expanded to five categories: white; black; Spanish origin; Asian, Asian-American, or Pacific Islander; North American Indian or Alaska native. Finally, in 1997–1998, consistent with the new OMB guidelines, the now standard categories were put on the application, with Hispanic or Latino ethnicity being removed as a race response and added as a separate question. But the collection process changed radically in the late 1980s, with SSA’s introduction of Enumeration At Birth (EAB) as the now-most-common method for SSN assignment. The tax reform legislation enacted in 1987 required child dependents (ages 5 and older initially, but expanded over time to include all children) on tax returns to have their own SSN, and EAB was a way of meeting the new demand for numbers. Under EAB, new parents can opt to have their child assigned a SSN, and state vital records offices transmit the necessary information (from birth certificate data) to the SSA so that the SSNs are assigned. But not all the birth certificate information is transmitted to SSA, even though the standard birth certificate includes the race of both biological parents. Thus, Czajka said, “Numident has no race data for persons obtaining SSNs through [EAB]”—a group that he said now represents roughly one-quarter of the U.S. population.
Czajka echoed Keller’s findings from the Census Bureau’s simulation studies, that replacing imputed values in the 2010 census with administrative data increases Hispanic origin reporting by 7 percent and doing the same for proxy-reported Hispanic origin cases increases reporting by 14 percent. He noted similar increases in reporting of Native Hawaiian/Pacific Islander and American Indian/Alaska Native categories when 2010 census imputations and proxies were replaced with administrative data, but that the absence of “some other race” and “more than one race” categories from the administrative sources hinders comparison for those groups. Czajka noted the apparently beneficial results of using administrative data to replace proxy age reporting, markedly reducing the high degree of “heaping” of proxy-reported ages ending in 0 and 5. Of the research, Czajka asked the Census Bureau for more detail on the quality of the PIK rate—the degree to which matching to administrative records was feasible—among the imputed-characteristics and proxy-reported-characteristics subgroups in the census returns. Based on that, he asked how those numbers
were likely to compare with households eligible for administrative records-enumeration in the 2020 census. In short, he asked, can any further benefit be gleaned from examining un-PIKed 2010 census cases?
2.3 APPLICATIONS AND EMERGING BEST PRACTICES
On the agenda, the final two sessions of the workshop’s first day were nominally differentiated as covering possible applications in the area of editing/imputation or direct question replacement in the ACS first, and then turning to possible applications for “blending” survey and alternative data sources. However, as Warren Brown (Cornell University) noted in opening the workshop, this is new terrain and the planning committee knew of no directly analogous situations that could be profiled. It is difficult to present finished case studies of major household surveys being reengineered to incorporate third-party data in their production because that has not been done yet on a major scale. The workshop organizers chose to present a variety of high-level and detailed-application perspectives on the issues. Session moderator Donald Dillman (Washington State University) described the presentations in his block of the agenda as beginning with the closest large-scale analogue (experience with incorporating tax data into the national census of Canada), drilling down to the hyper-local perspective (integration of extensive data resources in one U.S. county), and examining the role of statistical modeling in facilitating those and other levels of analysis. The second session, moderated by Patrice Mathieu (Statistics Canada), then focused on an array of specific application areas in which survey and administrative data have been usefully linked and analyzed—joint agency research on health impacts related to housing, the construction of a National Mortgage Database, insights from “data journalism” at the regional planning level, and experience from private-sector marshaling of data resources for understanding markets and constituencies—with a discussant weaving together the diverse themes.
2.3.1 Statistics Canada Experience and Protocols for Interface Between Census/Surveys and Administrative Data
Canada’s move toward wide use of administrative records data in its censuses and surveys began tentatively in 1985, as Eric Olson (Statistics Canada) described, with Statistics Canada issuing its first statistical products sourced from taxation data from what was then Revenue Canada Taxation (now known as the Canadian Revenue Agency). Olson said that this was a new model for work between the agencies, and not yet a direct connection, but it paved the way for the next significant step in the collaboration: addition of the “informed consent” option for respondents to the Canadian Survey of Labour and Income Dynamics in 1995, by which respondents could permit their tax
data to be shared and be substituted into the survey. Following a decade of experience with the option on the income survey, the informed consent option for sharing tax data in lieu of answering the income questions was added to the long form of the 2006 Canadian census. As Czajka had recounted in his remarks (Section 2.2.4), informed consent gave way to “informed replacement” in 2010 on use in the income survey—advising respondents that their tax data would be used by default, though they technically retain the option to opt out of that sharing. However, the Canadian government directed a late change in 2011 census planning, making the long-form sample voluntary response rather than mandatory; income content in 2011, collected as part of the long-form replacement National Household Survey, still used opt-in tax data sharing. Subsequently, Statistics Canada returned to the informed replacement strategy and a mandatory long-form sample was reinstated for the 2016 Canadian census. Box 2.3 shows the introductory text and advisory given to respondents in the 2016 census. Olson drew particular attention to paragraphs 2 and 4, the first of which is the “informed replacement” clause and the second of which is language “we’re using on a lot of surveys now” acknowledging the possible combination with other administrative data sources.
As Olson summarized, administrative data were used in four principal ways in the 2016 census of Canada, the first being continuation of use of tax return and “tax slip” data for replacement of data items on income. As Olson described, this involved linking all census respondents to administrative identity files (among them T1IDENT, the equivalent of the U.S. Numident files) and adding other tax return or information slips (including child benefit information). Olson
Table 2.3 Data Compilation Methods for Income Components and Income Taxes, 2016 Canadian Census
| Income Components and Income Taxes | Tax Filers | Non-tax Filers |
|---|---|---|
| Market income | ||
| Employment income | ||
| Wages, salaries and commissions | A | A/I |
| Net non-farm self-employment income | A | I |
| Investment income | A | I |
| Private retirement income | A | I |
| Market income not included elsewhere | A | A/I |
| Government transfers | ||
| Old Age Security pension | A | A |
| Guaranteed Income Supplement | A | A |
| Canada/Quebec Pension Plan | A | A |
| Employment Insurance | A | A |
| Federal child benefits | A | A |
| Provincial and territorial child benefits | D | D |
| Government transfers not included elsewhere | A/D | D/I |
| Net federal tax | A | I |
| Provincial and territorial income taxes | A/Da | I |
a For residents living in Quebec only, the provincial income tax was derived deterministically.
NOTES: A, Compiled directly from administrative tax records. D, Derived based on program specifications. I, Imputed using related auxiliary administrative data and demographic characteristics.
SOURCE: Workshop presentation by Eric Olson, adapting Statistics Canada (2017:Table 4).
said that the benefits that Statistics Canada has seen from the direct substitution of tax data for the income questions include: less respondent burden (and the elimination of roughly 4 pages from the questionnaire), improved processing and data quality for the income data items (all the income data coming primarily from a single input stream), and greater precision in estimates of income (including the elimination of respondent rounding of guesses to round-sounding totals). Because tax data could be obtained for all census households, short-form as well as long-form, Statistics Canada was also able to produce very detailed small-area estimates of income in the 2016 census. Finally, Olson said that the use of tax data has permitted a more detailed classification of income sources—some of the more intricate components of income being difficult to even describe to respondents, much less collect accurately in a survey context.
Olson then described the various components of income collected as part of the 2016 Canadian census, showing the source used to obtain the information, as
shown in Table 2.3. The table illustrates how extensive the reference to available tax data has grown in Canadian censuses and surveys. It also underscores the reality faced in the U.S. context, which is that the available data are necessarily limited to the tax-filing population. More subtly, Olson said, concepts like self-employment income are as tricky to measure and as prone to nonreporting (to any entity) in the Canadian context as in the United States. He said that investment income is also imputed for non-tax-filers, but that Statistics Canada is able to rely upon “better information” from banks and other sources to ground those imputations than is possible for other components of income. He noted that private retirement income was a component that was “close to ready-to-use as-is” from the tax slip data available through the sharing. Information on income from government transfers (benefits) are very complete and can be used for all census respondents, tax filers or not; however, some special provincial/territorial benefits are derived or calculated separately by formula.
Olson said that the second major way in which administrative data were used in the 2016 Canadian census was the derivation of an immigrant admission category data item based on linkage to administrative immigration records. He said that this was advantageous because knowledge of the specific program or class by which immigrants enter the country may be difficult or impossible for them to report accurately on their own, and much more so for proxy respondents. To illustrate the point, Olson briefly described the detailed classification of admission category that Statistics Canada was able to complete through the administrative data match, comprising four high-level categories (economic immigrant, immigrant sponsored by family, refugee, and other immigrant) filtering down to 26 final subcategories as intricate as “Quebec entrepreneur” (admitted under a provincial business program for entrepreneurs, distinct from “federal entrepreneur”), “sponsored intercountry adopted child,” and “blended visa office-referred refugee.” To generate this data item for the 2016 census, Olson said that Immigration, Refugees and Citizenship Canada (IRCC) was able to provide relatively detailed and “coherent” immigration files for the years 1980–2016 and less detailed records for 1952–1979 (less complete in terms of program-of-admission as well as personal identifiers, such as only having month and year of birth rather than the precise date). IRCC also provided administrative files on temporary residents, such as temporary foreign workers, international students, and refugee/asylum claimants. Olson reported that about 90 percent of the immigrants who arrived in Canada between 1980 and 2016 were able to be linked to 2016 census returns, with the analysts suggesting a roughly 0.3 percent false-positive rate. From the linked data, the two data items of admission category and applicant type were derived as applicable, and Olson reported general satisfaction with the quality of the results.
Where the other uses of administrative data in Canada’s 2016 census were planned in advance, Olson noted that the third major use was much more of an improvisation: administrative data were used to enumerate (complete short-form
census responses) an area where field operations were precluded by natural disaster. In 2016, Census Day in Canada was May 10, with enumeration activities beginning on May 2. On May 1, wildfire was detected in northern Alberta; it spread quickly and, by the end of May 3, a mandatory evacuation order was put into effect for the area of Fort McMurray. This evacuation order covered about 90,000 residents and would remain in effect into early June, with the fire only deemed to be under control in early July and declared extinguished in early August. In light of the standing evacuation order, census collection activities were suspended and Statistics Canada began to marshal alternatives to conduct the count for Fort McMurray. Olson said that administrative data (principally, tax and child benefit files) were linked to the census address register. Households in the linked dataset for which a census response had already been received (i.e., via online response) were removed from consideration, as were person records from the Fort McMurray area that were found to be already enumerated in the census (e.g., staying with a friend or family member). For the remainder, the administrative records data were “reformatted” and treated in processing as though they were regular census responses by the Internet or by paper (though the records were flagged as having entered via this improvised channel so that they could be analyzed later). Months later, when it was possible to resume the field effort, long-form census information was collected for a sample of households as originally planned. Though the effort was improvisational, Olson observed that Statistics Canada researchers concluded that the administrative count had worked quite well and that age and sex counts all appeared to be good—though he did say that the linkage across all the component data series did involve some “painstaking work to get into the detail that may not be scalable.”
Finally, Olson noted that the fourth major use of administrative data in the 2016 Canadian census was implementation of a variety of improvements to editing and imputation routines for other census variables. In essence, the matched administrative data files from both the taxation (substitution) and immigrant admission (new variable derivation) examples proved useful in identifying “donor” records to impute missing values in other variables in routine imputation processes. Distance measures or stratification categories based on education, income, labour/employment, immigrant status, and year of immigration were calculated to refine the search for ideal donor records for imputation. Statistics Canada turned to another administrative/third-party data resource—the nation’s Indian Register maintained by Indian and Northern Affairs Canada—for editing and imputation of Registered Indian status and other ethnocultural variables as appropriate. And, Olson said, Statistics Canada’s certification (evaluation and assessment) activities used the various linked administrative data resources to study and corroborate regional effects in important variables.
Summarizing the Canadian experience with integrating administrative data with census processes into two general challenges, Olson first offered the cautionary word that administrative data need a lot of work—potentially much more than expected—to mesh well with census processes. The linkages require work and continual improvement, and Olson said that linkage rates varied considerably by age and for specific populations. But managing the potential for conceptual misalignment, such as mapping tax-form income concepts into census-defined income concepts, is also a formidable task. Olson said that the integration of new information into existing (in some cases, years-old or decades-old data) edit and imputation routines is currently a complex task. Still, the accomplishment of harmonizing immigrant admission categories into a unified-in-time classification and deriving that variable from available administrative data was a great benefit.
The second overarching lesson that Olson derived from the Canadian experience is that some things remain imperfect; administrative data are not a panacea. Indeed, he said, wider integration of administrative data is virtually certain to alter—if not break—the continuity of long-established time series in census and survey data, because the collection method is different. In the Canadian experience, the wider use of administrative data comes with known tradeoffs: the derived immigrant admission category is only consistently available for immigrants admitted since 1980, not for earlier generations, and there is known variability and volatility in the reporting of social assistance income. Olson also echoed a point made earlier in Ortman’s articulation of principles for administrative data use, as a lesson that Statistics Canada had learned through experience: the quality and consistency of administrative data is always vulnerable to modifications in the administrative programs that generate the source data. Specifically, about 10 years ago, one of the child benefit programs available to Canadians was changed in structure so that it was no longer means-tested—a change that caused a spike in the reporting of children (as measured through registration in the administrative data from that program) in that the benefit was made more widely available to applicants. The benefit program has since switched back to a form of means testing, curtailing that increased reporting of children. Olson said that a major remaining conceptual challenge, underscored by experience with the Fort McMurray enumeration-by-records experience, is in bridging between person-based administrative data files and household-based measures. On average, Olson said, Statistics Canada researchers found the person-level administrative data to be solid but that the “households” formed from the administrative data tended to be either too big or too small.
Olson concluded by saying that Statistics Canada is actively pursuing more aggressive use of administrative data in its surveys and in the 2021 Canadian census, with the longer-term vision of a “combined census” option that would combine administrative data with a long-form sample. As is occurring in
the United States, Olson said that this involves assessing new and different data sources for their linkability, coherence, and coverage, particularly data sources that may correct some current gaps. Possibilities include program files that may speak to current “blind spots” in the measurement of the income distribution, use of property assessment files to obtain home ownership and value information, utility bills for measuring part of shelter/housing costs, and analysis of third-party credit report files for mortgage information. Going beyond the Indian Register described earlier, Olson mentioned an effort to study and potentially utilize the membership lists of other indigenous organizations. More subtly, he noted work to try to use the returns from previous Canadian censuses as administrative records in their own right—in particular, potentially using reported location in the previous quinquennial census to replace the census question on mobility (i.e., where did you live 5 years ago?). One variable of increasing interest to Canadian census stakeholders is veterans status, and Olson said that Statistics Canada was engaged in analyzing discharge data from the Department of National Defence; in the early goings, Olson said that they are grappling with the data being of “distinctly lower quality” before 1998. He said that Statistics Canada is also actively looking at administrative data sources with an eye toward modernizing edit and imputation routines for reported type of industry (in the nation’s business register) and on respondents’ work activity/labor force status (based on linkage with employment records). Also consistent with the U.S. experience, Olson said that Canada is working to do more with administrative data concerning the nonhousehold or group quarters population than the currently available “minimal individual information.” As was done on an ad hoc basis for Fort McMurray, Olson said that testing of this work involves reformatting records from such sources as Canada’s correctional system and homeless shelter management systems and injecting them into census/survey processing as if they came from the Internet response channel. He noted that Canada’s upcoming Census of Agriculture will be an important proof-of-concept for “adaptive questionnaires” and an administrative data-intensive approach. In that count, the address frame (list of farms) will be linked to a series of administrative farms, and the intent is to only ask certain questions of respondent farm businesses if the information is missing in the administrative files.
In closing, Olson reiterated several ongoing risks. There is a constant pressure to reduce burden quickly, and to try to scale “standard” processes and tools to match the new data environment quickly. But the resulting data can be more complex to analyze and introduce unforeseen effects. He said that “we can see or imagine differences across modes but we don’t always measure them in our rush to implement.” Part of the problem is that once a question has been eliminated on a census or survey, by replacement via other means, there is no incentive to add or continue data collection on even a small-scale basis for evaluation and verification purposes. And, he warned, census and survey
organizations must remain aware of public perception concerning the use and distribution of these data; a single “ill-managed or ill-timed crisis” concerning the use of administrative or third-party data “could spell disaster” for the wider enterprise.
In the time available for discussion after the first afternoon session, Penelope Weinberger (American Association of State Highway and Transportation Officials) asked Olson about the Fort McMurray example and, in particular, about the small percentage of respondents who had already submitted census information before resort had to be made to administrative data. The question was whether the original census-return data were used in lieu of the administrative data and (in either event) whether the already-on-hand census returns were ever directly compared and evaluated relative to the administrative data. Olson clarified that the final percentage of respondents in the affected area for whom census returns were available was closer to 25 percent, because long-form data were collected (much later, after the fires) on a sample basis in the field. The census self-responses were indeed used in lieu of the administrative data for all those cases. However, there was not a detailed micro-level analysis performed of the self-response and adminisrative data results when both were available in the Fort McMurray area; the analysis was kept at the aggregate level and gave comfort that the sources seemed to match in broad strokes. Olson said that the main reason for not doing further evaluation/assessment is that the administrative data (being tax record-heavy) really did not have much additional, auxiliary data for researchers to probe and compare between the sources. But, he said, the work is helping guide Statistics Canada on what it is considering or dreaming about for the 2026 census.
John Czajka (Mathematica) asked Olson whether Statistics Canada has seen much practical difference between survey-measure income data and administrative-measure income data, whether in concept or directly in the values between the sources. Olson replied that Statistics Canada has become comfortable and experienced in the use and handling of the tax data, but that the only anomalous year or period in working with the data was in the 2011 voluntary-collection year, which is “particularly iffy in terms of quality” relative to the mandatory years. Olson said that Statistics Canada is confident that its estimates from 2005 through 2015, modulo the voluntary period, show good and consistent trends. Local contrasts exist, when the sources are compared, but the big practical differences come up in the usually hard-to-measure low-income groups, for which measures seemed to be at least a percentage point off in the voluntary year.
2.3.2 Experience from Linking Survey Data, Administrative Data, and Social Media Extracts
Erin Dalton (Allegheny County, Pennsylvania, Department of Human Services) opened her remarks by noting that she brings state and local perspective to the discussion, but added that Allegheny County’s experience is fairly atypical. The county has made major investments in developing analytics, marshaling data resources, and testing new approaches. Allegheny County has learned through practice how to integrate data from widely disparate sources, but that experience is not necessarily representative of other jurisdictions.
Dalton said that the Allegheny County Department of Human Services is tasked with provision of “cradle-to-grave” services, directly affecting at least 1 of every 5 residents of the county. Those services touch all points of the age spectrum, from child protective services and family support to elder assistance (including those with and without disabilities), and they cover a gamut of health services (e.g., Medicare and Medicaid administration, mental health services/crisis counseling, drug and alcohol services, and services for individuals diagnosed with an intellectual disability). The department’s provided services can also be logistical or educational in nature, such as homeless and emergency sheltering, nonemergency medical transportation, occupational training and placement (for elders and persons receiving welfare assistance), after-school and summer programs for children, and early education programs for at-risk children. Given that extensive substantive scope, Dalton noted that the department must utilize a wide array of data sources, both internal and external. Internally, there are records generated by and maintained by numerous subdivisions of the department, including Aging, Child Welfare, Drug and Alcohol Services, Early Intervention, Family Support Centers, Head Start, Homeless, Housing Support, Mental Health Services, and Intellectual Disabilities Services. The external sources that come into play are myriad as well:
- Birth and death (autopsy) records;
- Public housing and physical health (Medicaid) records;
- Educational records, both from Pittsburgh Public Schools and 21 other school districts in the county;
- Correctional records, including not just the Allegheny County Jail but the juvenile probation system and records from the court system;
- 911 dispatch calls; and
- Records from the state Department of Labor and Industry.
Every day, these integrated data are used in a variety of ways. At the person level, Dalton said that the data are used to make decisions about individual-level treatments as well as to resolve broader policy and administration questions. Importantly, the department also has a mission to provide integrated
data products to the “clients” and agencies that provide the original source information. To that end, Dalton briefly displayed a sample data record from the department’s integrated data system, showing various points of contact and information of services received in a unified, timeline view. Reflecting points made earlier in the workshop, Dalton said that the department is keenly aware that coverage varies across and within the disparate data sources; as just one example, she observed that there are 42 school districts in the county, and the department only has agreements in place with 21 of them. Allegheny County has over 100 law enforcement agencies operating within its boundaries, and the human services department definitely does not obtain data from all of them.
Dalton suggested that the most succinct summary of what the department must do with data, on a daily basis, is “triangulation” from all possible sources—seeking the different insights that can come from different data series. The data structures with which she works are of four basic types:
- Federal survey data remain critical, even at the local level, because they are the numbers that are known in the public eye and, importantly, because they are the only real basis by which external stakeholders can compare across geographic jurisdictions (counties) or agencies;
- Integrated data systems are those that the department combines from an array of other sources, typically administrative data generated by other agencies;
- Allegheny County is unusual in the extent to which it has gone to harness those external data systems, yet they still rely on “what most counties are going to be looking at” to the extent that they do such analyses—the internal case management applications used in agencies’ day-to-day work (and that may be queryable for additional detail); and
- An area that Allegheny County has taken as a priority of its approach, measures of client experience, feedback, and needs, whether generated by traditional pencil-and-paper or Internet surveys, by text messaging (which has become the most efficient mode of collection for Allegheny County), or increasingly by feedback registered at computer/touchscreen kiosks at service locations.
More recently, Dalton noted that the department has been moving toward the analysis of unstructured data, and they have experimented with social media listening—trying to glean client needs and experiences through monitoring of social media feeds. Thus far, though, she noted that the department’s social media listening had not yet yielded much data.
Dalton illustrated her points by considering one population group of particular interest: transition-aged youth, defined as those who have been involved in the child welfare system but who “age out” of the system after they reach 16 years of age. In Table 2.4, she listed eight general categories of outcomes that are commonly of interest in assessing the needs of and the
| Outcome of Interest | Federal Survey | Administrative Data | Case Management | Client Experience |
|---|---|---|---|---|
| Educational Attainment | • | • | • | |
| Employment/Economic Security | • | • | • | • |
| Housing Stability | • | • | • | • |
| Pregnancy/Early Parenthood | • | • | • | |
| Physical and Mental Health | • | • | • | • |
| Healthy Relationships With Adults | • | • | • | |
| Criminal Justice Involvement | • | • | • | |
| Other Well-being | • | • |
SOURCE: Workshop presentation by Erin Dalton, substituting shaded table cells with • for clarity.
effectiveness of service delivery to transition-aged youth and offered a quick, binary assessment of whether those outcomes are available in the four principal data. For instance, the federal surveys that come into play include the National Youth in Transition Data Collection (NYTD) sponsored by the Administration for Children and Families. Administrative data types, for an outcome such as educational attainment, include the administrative data (including graduation rates) from school districts as well as third-party data obtained via the National Student Clearinghouse. The department’s internal case management system is a useful resource; it collects some data and, periodically, attempts are made to evaluate and assess the quality of the data within (i.e., verifying educational attainment). Client/customer surveys can provide insight on how well some of the outcomes are being addressed.
Over a series of presentation slides, Dalton illustrated the kind of “triangulation” that her department regularly performs, pulling insights from all the various sources. Again emphasizing the transition-aged youth population, Dalton said that national studies on former foster youth provide help in suggesting questions for deeper analysis. She reported that such national studies provide useful benchmarking and hypothesis generation. Dalton noted that these studies suggest that former foster youth:
- are somewhat likely to experience homelessness after leaving child welfare care (12–22 percent experiencing homelessness for at least one night);
- are likely to become young parents (56 percent of women and 30 percent of men becoming parents by age 21);
- are very likely to have criminal justice system involvement (more than half of women and 80 percent of men having been arrested at least once between ages 17–26);
- have difficulty obtaining high school-equivalent education (3 times more likely not to have a high school diploma or General Educational Development [GED] certificate by age 26); and
- experience higher rates of substance use disorders than the general population.
Dalton said that Allegheny County is limited in the amount of directly relevant local insight that it can draw from a federal survey like the NYTD; NYTD Cohort 1 data, which follows foster/child welfare youth aged 17 in 2011, includes 34 Allegheny County youth, precluding very detailed analysis. The NYTD and federal survey data do provide some rough sense of outcomes on which Allegheny County is doing well relative to Pennsylvania or the nation as a whole (i.e., 14 percent of foster youth becoming young parents by age 21, relative to 28 percent for the state and 31 percent nationwide), or worse (e.g., 64 percent with a high school diploma or GED by age 21, about 10 percentage points lower than the state and nation).
Dalton summarized a number of findings derived from analysis of a variety of administrative data series entering the department’s integrated data systems:
- 75 percent of youth aged 14 or older who left the child welfare system in 2017 exited to a permanent placement arrangement.
- The number of youth with a child welfare placement history at age 16 or older who exited without permanency (i.e., aged out of eligibility for service and had to be released) decreased from 190 youth (52 percent) in 2010 to 76 youth (30 percent) in 2016. Dalton described this as “significant change over 6 years.”
- 80 percent of youth with some history of child welfare placement by age 16 or older, who exited the department’s services between 2006 and 2016, accessed publicly-funded mental health services in their early adult years, ages 16–21. Dalton hastened to add that this is actually a “good” number—the department certainly wants to have mental health services available to those who need them, so high take-up rate can actually be viewed as encouraging. The aspect of those mental health service numbers that does require further consideration and response by the department is that just less than half (48 percent) of those youth accessed mental health services on an inpatient or crisis basis—that is, as the result of an emergency, which is later than the department would like.
- Among youth with a history of child welfare placement, ages 16 and older who exited the system between 2006 and 2016, just over half (52 percent) had substance use disorders documented in administrative,
-
Medicaid data—with the bulk of those being disorders involving cannabis and alcohol use.
- Of that 2006–2016 exiting cohort, 8 percent accessed homeless services from the department, including emergency shelter and transitional housing.
In terms of information gleaned from agencies’ case management systems, Dalton drew several findings from a “youth summary” compiled from those systems in 2017. That summary suggested that 87 percent of 21-year-olds currently accessing Allegheny County’s Independent Living services reported their housing condition as stable. The youth summary also suggested that 37 percent of 21-year-olds accessing department services reported being employed (Dalton said that they are continuing work on supplementing these results with data from the county and state Department of Labor and Industry.
But Dalton suggested that the real analytic value, suggested by the “triangulation” nomenclature, was in comparing and contrasting related results from different sources. For instance, she said that 54 percent of women with a history of child welfare placement, exiting the system in 2006, had given birth before age 24—a figure that dropped to 21 percent in the 2016-exiting cohort. That compares with the case-management-derived 2017 youth summary that suggested that 37 percent of 21-year-old female youth, and 30 percent of al youth, accessing Allegheny County services had reported being parents.
In the client experience/feedback mode of data collection, as it relates to the example of transition-aged youth, Dalton showed the results of a few service-receipt questions for which the results were obtained by kiosks. She also described that the Allegheny County Department of Human Services’s own Youth Voice Survey has, on an annual basis since 2012, sought to canvass the experience of youths in out-of-home placement. The Youth Voice Survey is continually examining new technology to enhance the survey experience and improve the quality of resulting data. The survey asks youth about their participation in school, community, and personal activities during their time in placement; for youth in group care settings, researchers conduct survey interviews in person, while youth in kinship and foster care are recruited principally by mail and allowed to complete the survey on paper or online. Survey results, and other products from the department’s work, are planned to be put on the department’s web portal at http://www.alleghenycountyanalytics.us.
In beginning her remarks and again in closing, Dalton recognized the inherent difficulties faced by a national survey program like the ACS, grappling with the demands to reduce burden and resolve data disclosure concerns. She reiterated her belief that there is increasing capacity at the local government level to develop and use administrative data, for things that might usefully “roll up” into state and national data series. She said one challenge is current data on
state and local jail inmates. The national Survey of Jail Inmates is conducted on a semiregular basis, but it seems “counterintuitive” (or at least unusual) that some more detailed information beyond basic head counts has not become more available, from correctional facility records, on a more frequent basis. Dalton expressed hope that administrative data will be able to provide a more regular view. She statedAllegheny County’s support for the census and for data analytics in general—and the desire to partner on data research projects on combining administrative and survey data if appropriate and helpful.
In the discussion period for this bloc of presentations, Emily Molfino (U.S. Census Bureau) noted her previous work with local governments in northern Virginia and thanked Dalton for providing the local perspective—which she argued is very underrated in conversations about replacing national/federal data with administrative sources. Molfino argued that administrative data are inherently local in nature; it is typically individuals at the local level creating that particular data point in a series, based on programs that are very local in terms of administration. She argued that there is a need to find ways to better examine the quality and properties of those data, which she said should include helping the local personnel do their data “generating” work more effectively. Data aggregators like CoreLogic try to “clean up” and improve the data that they assemble from a variety of sources, but Molfino asked what local governments would need to create better local administrative data, of the kind that would eventually come to places like the Census Bureau. In reply, Dalton stated her belief—in phrasing that would recur through the remainder of the workshop—that “data that gets used gets better.” That is why Allegheny County focuses on pushing data back to as many users and clients as possible. Dalton said that the clients who provide the raw data can be a source of “truth” on what they actually submitted. Practically speaking, she suggested that “pressure”—or incentive—to circulate data and simply get the data into wider use would be most helpful; so, too, would federal funding to support local development of data collection technology and analytics. Dalton said that Allegheny County is fortunate to have made major investment in technology and analytics, with about 35 people working on its integrated data systems. Other localities might have (at best) one person per major service area, and it will always be tough to do more than the most routine reporting with low staffing.
Session moderator Dillman asked Dalton whether the demand for aggregating data comes from within the Department of Human Services or from other sources (e.g., clients encouraging the combination of data)? Dalton replied that the most pressure that they get for combining data sources is from local leaders wanting to characterize and study their own populations and from the federal government (i.e., child welfare information system requirements at the federal level forcing attention to compatibility and theoretically pushing integration). In Allegheny County’s case, the motivation for creating the integrated data system 20 years ago came from clients who were chafing at being asked to
provide the same information many times, “tell our story a thousand times,” and so forth. Because of that, the mindset of the integrated collection is very much service-oriented, adapting to client demand. Dalton said demand can usefully come from all sources—federal/aggregator pressure from “above,” local-leader pressure from “below,” and a large client base in the middle.
2.3.3 Improving ACS Estimation with Multiple Surveys and Third-Party Data
While other presentations in these workshop sessions were designed as arguments by analogy, and not necessarily rooted in the ACS itself, the perspective brought by Scott Holan (University of Missouri and U.S. Census Bureau) in his presentation was uniquely ACS-centric. The presentation summarized work combining ACS data products with external administrative records or third-party data sources in careful ways. That said, while the ACS was used as the motivating example, the approach described by Holan is more general and applies to other surveys.
Holan described the basic motivation for this line of research—the trend in recent years toward flat or declining budgets for national data collection efforts, leading to the desire to do “more with less.” A big part of this effort, he said, is the drive to incorporate third-party data and administrative records where possible, as described throughout the workshop. Holan suggested that this line of inquiry involves wrangling data sources that share several common features:
- They can be very large datasets, on the order of millions of records;
- They typically include a large number of variables;
- They typically involve spatially referenced data over many geographic regions (e.g., counties, states, etc.);
- They are typically data observations recorded in discrete (not purely continuous) time;
- The variables are often non-Gaussian in their distribution; and
- The data and variables within a source may be measured on multiple spatiotemporal scales.
Holan described hierarchical Bayesian modeling as a natural methodology for combining information from multiple sources. In very quick summary, Holan recounted that hierarchical Bayesian models are premised on separating unknown parameters into two groups, the process variables that are the actual quantities of interest and the parameters upon which probability models for the distribution of the unknown variables are based. Accordingly, the joint probability distribution [data, process, parameters] can be factored into three component distributions:
- [data | process, parameters],
- [process | parameters], and
- [parameters].
Moreover, Bayes’ Theorem yields the critical result that the posterior distribution, of the unknowns conditional on knowledge of the (known) data is proportional to the product of these three component distributions:

Holan referred interested readers to Cressie and Wikle (2015) for fuller background.
With that as a premise, Holan examined two case-study illustrations of the use of hierarchical Bayesian modeling in official statistics, both involving information from the ACS. The first case involved the combination of functional covariates (derived from social media data) with ACS-based information; specifically, the example explored the combination of Google Trends data with the ACS and is described more completely by Porter et al. (2014). Holan said that this work sought to demonstrate that so-called “big data” sources can be used effectively with data from federal government surveys to improve estimates of population parameters of interest. A second objective was to be expansive in the handling of those “big data.” Such sources, Holan said, can frequently be viewed as functional data, such as an entire curve, image, or other construct generated by some underlying function. The intent of this research was to extract information from the whole curve, image, or other construct, rather than a more conventional approach of using summary measures of the underlying function as covariates. The specific model that Holan said was brought to bear in this problem is the Fay-Herriot (FH) model, which he characterized as a “well-vetted model” for small-area estimation problems and a “natural choice” for incorporating “big data” covariates. He described the standard FH model as taking the form
where i = 1, . . . , n indexes location, θi is the underlying parameter of interest for location i (e.g., the “superpopulation” mean). In this first “observation equation,” εi is random error and is typically assumed to be normally distributed with survey error variance ![]() at location i, with that variance often considered to be known. The second equation, the model for θi, consists of auxiliary covariates
at location i, with that variance often considered to be known. The second equation, the model for θi, consists of auxiliary covariates ![]() and a random spatially indexed effect ui. Holan noted that this work expanded the basic FH model to include both functional covariates and spatial dependence (the latter through the ui spatial effect, positing that localities that neighbor each other are more likely to be similar than ones far apart). Hence, their model became what the full Porter et al.
and a random spatially indexed effect ui. Holan noted that this work expanded the basic FH model to include both functional covariates and spatial dependence (the latter through the ui spatial effect, positing that localities that neighbor each other are more likely to be similar than ones far apart). Hence, their model became what the full Porter et al.
(2014) paper dubbed the spatial functional Fay-Herriot model (SFFH), i.e., the spatial Fay-Herriot model with functional covariates.
In this case study, the outcome of interest was the percentage change, between 2008 and 2009, in households for which Spanish was the principal language spoken at home. Language spoken at home is a variable measured in the ACS, and Holan and his fellow researchers used ACS data directly from the summaries on the Census Bureau’s American FactFinder website (though he said that this methodology could easily extend to data from the ACS public use microdata samples [PUMS] files or to the complete confidential microdata available at the Census Bureau). He said that the summarized ACS data provided by the Census Bureau necessarily contains more possible outcomes than simply Spanish-speaking at home, and that total survey variances can be computed based on the provided margins of error. Because of limitations of the social media data (described next), this analysis was restricted to the state level rather than smaller geographies; Holan noted that other social media and functional data sources could be used to estimate effects at finer levels of geography. Holan commented that the basic outcome of interest, the difference between the percentage of households speaking Spanish in 2009 and the percentage in 2008, is approximately normally distributed, which makes it suitable for the traditional FH framework.
As described more fully by Porter et al. (2014), the functional data utilized in this application were from Google Trends, Google’s repository of time series for search terms used in Google web queries (number of searches on the Google search engine for particular terms). What Google makes most easily (and freely) available to researchers are state-level time series based on weekly Google search loads, hence the restriction to state as the unit of analysis. This research was conducted (and the data accessed from Google) at a time when Google’s policy was to scale the data relative to the first non-negligible search load for a particular term—which Holan said had the effect of permitting within-state comparisons but not across-state comparisons. (Google changed this procedure in September 2013.) To make across-state comparisons valid (while still preserving functional features of the time series), Holan said that the researchers rescaled all of the search loads to be time series with mean 0 and variance 1.
Specific to the problem of interest, measuring predominantly Spanish speaking in the home, Holan said that this application and modeling makes use of Google Trends data for searches involving the terms “el,” “yo,” and “y”—the Spanish translations of “the,” “I,” and “and,” respectively, and terms the researchershad concluded were a reasonable proxy for Internet activity in Spanish-speaking homes and terms that “rarely occurred” in non-Spanish-language searches. Concerns over the Google Trends data caused the researchers to further restrict this analysis to 21 locations (states, including the District of Columbia) in the eastern United States. He said that the reason for the concern,
and restriction, was that Google recoded its routines for geotagging search queries in the Trends data on January 1, 2010—and observed change-points in the data series before and after that recording “casts doubt” on the complete accuracy of the data before that point. Moreover, he said that zeroes in the search load data can represent censored search loads; accordingly, they chose to remove search load feeds with more than 20 percent zeroes to mitigate the effect of this censoring in the data (but without creating “islands” for comparative purposes, which is to say states that lack neighbors with full available data series). Combining both restrictions, Holan said that 21 locations/states remained.
Holan displayed the basic results of the work, which appears as Table 1 in Porter et al. (2014). The table illustrated basic estimates of the relative changes of percent household Spanish speaking for the 21 localities listed in the eastern United States between 2008 and 2009. (Holan noted that the standard FH model was not included in this table because preliminary work demonstrated that “you can certainly do better” than the standard Fay-Herriot model by adding spatial dependence.) Among these 21 states, the results were roughly equally divided between the two model types; Holan said that the work did strongly suggest benefits in estimation through the incorporation of the functional data through the SFFH approach.
Holan’s second case study involved modeling unemployment rates, combining variates from the ACS with data from the Local Area Unemployment Statistics (LAUS) program administered by the Bureau of Labor Statistics (BLS); the presentation was based on the more detailed analysis in Bradley et al. (2016). This specific application focused on counties within Missouri but could be used more widely. The advantage of combining the data sources, here looking at 1-year estimates for the years 2005–2012, is that the ACS 1-year estimates are only available for the most populous counties while the LAUS has more geographic coverage (but lacks the additional covariates in the ACS). Specifically, Holan said that the researchers fit a latent Gaussian process model—more properly, a multivariate spatiotemporal mixed effects model (MSTM)—to the data, because it provides the desired flexibility (to incorporate both fixed and random effects as well as non-Gaussian data) while still incorporating “dependencies in a familiar way.”
Specifically, the MSTM fit by Holan and the Bradley et al. (2016) researchers took as its data model:
![]()
a mixed effects model premised on the process models:

the parameter model:
![]()
and a remaining parameter model assumed for
![]()
that builds spatial dependencies into the error structures. In this application, both ACS and LAUS define “unemployment” as all out-of-work individuals who are available to have a job and have sought work in the past 4 weeks of taking the survey; the concepts are compatible between the two sources and so do not require any intricate conceptual “crosswalking” in constructing the model. For this specific application, the support set ![]() consists of Missouri counties, so let
consists of Missouri counties, so let ![]() The model also considers as a variate ACS median household income (ℓ = 2) from 2005 to 2012. Holan said that exploratory analysis using QQ-plots and histograms lent credence to the assumption that the logit (log) of the unemployment rates (and median income) is roughly Gaussian. He said that the survey variance estimates are approximated on the transformed scale using the Delta method described by Oehlert (1992), and reiterated all specific modeling choices are described in fuller detail in Bradley et al. (2016).
The model also considers as a variate ACS median household income (ℓ = 2) from 2005 to 2012. Holan said that exploratory analysis using QQ-plots and histograms lent credence to the assumption that the logit (log) of the unemployment rates (and median income) is roughly Gaussian. He said that the survey variance estimates are approximated on the transformed scale using the Delta method described by Oehlert (1992), and reiterated all specific modeling choices are described in fuller detail in Bradley et al. (2016).
In their analysis, the predicted unemployment rates are denoted ![]() The multivariate spatial predictors based solely on ACS estimates may be denoted
The multivariate spatial predictors based solely on ACS estimates may be denoted ![]() and those based solely on LAUS estimates as
and those based solely on LAUS estimates as ![]() in both cases, t = 1, …, T, ℓ = 1, 2. The analysis makes use of the “relative leave-one survey-out” criterion RLS(m) for survey/source m; it is essentially the mean squared predictive error (MSPE) of
in both cases, t = 1, …, T, ℓ = 1, 2. The analysis makes use of the “relative leave-one survey-out” criterion RLS(m) for survey/source m; it is essentially the mean squared predictive error (MSPE) of ![]() relative to the MSPE of
relative to the MSPE of ![]() for survey/source m. Defined in this manner, Holan said, values of RLS that are smaller than 1 indicate that combining sources (ACS and LAUS) does not lead to an improvement in MSPE, while values larger than 1 indicate improvement in MSPE. Additionally, if
for survey/source m. Defined in this manner, Holan said, values of RLS that are smaller than 1 indicate that combining sources (ACS and LAUS) does not lead to an improvement in MSPE, while values larger than 1 indicate improvement in MSPE. Additionally, if
1 < RLS(2 = LAUS) < RLS(1 = ACS),
then this would indicate that survey/source 1 (ACS) benefits more from combining sources (in terms of reducing MSPE) than Survey 2. In this case, Holan, said, RLS(2) = 3.03 × 10⁵ and RLS(1) = 3.01 × 10⁷—both considerably larger than 1, and showing “dramatic improvement in the MSPE when using both surveys as opposed to using a single survey.”
The resulting data maps presented at the workshop appear as Figure 1 of Bradley et al. (2016) and underscore why the estimates from the ACS are vastly improved when the ACS and LAUS data are combined—estimates become
available for all counties and not just the select, most populous counties in the 1-year data releases. The fifth subfigure in the series of maps displays the mean squared predictive error—underscoring the fact that the prediction estimates from the modeling have associated measures of uncertainty.
Holan mentioned briefly, in closing, that much additional research work is going on to potentially improve survey (and ACS) estimation using combinations of other data sources. In particular, he mentioned change-of-support (COS) analysis, effectively trying to reconcile the effects of jointly looking at different levels of geography simultaneously, and efforts to fit similar models but using non-Gaussian structures.14 Holan noted spatial and spatiotemporal hierarchical statistical models (dependent data models) provide a powerful approach to this problem; this presentation was only able to illustrate two quick examples of using auxiliary data (third-party data and multiple surveys) to improve survey estimates. The ultimate goal of this work, as of official statistics in general, is to improve the precision of the estimates being disseminated, and there are many opportunities for extension of this line of research.
2.3.4 Insights and Data Products from Linking Health Survey Data with Administrative Housing Data
Veronica Helms (U.S. Department of Housing and Urban Development [HUD])15 described joint work between HUD and the National Center for Health Statistics (NCHS), within the U.S. Department of Health and Human Services (HHS),16 as having been directly motivated by clauses in both departments’ inventory of strategic goals for 2014–2018. Among HHS’s listed strategic goals for the period were to “advance scientific knowledge and innovation” and “ensure efficiency, transparency, accountability, and effectiveness of HHS programs,” both of which are consistent with novel methodological development using HHS data. HUD’s stated strategic goals for 2014–2018 included “use housing as a platform to improve quality of life,” and researchers settled on assessment of health effects associated with housing as very much in keeping with that goal. Moreover, Helms said, the ideas for joint work were encouraged by several directives on increasing the use of administrative records (issued by the U.S. Office of Management and Budget) and increased interest in evidence-based policymaking in general. Still,
___________________
14 Reference was made to, among others, Bradley et al. (2015, 2016, 2017).
15 Helms presented on behalf of herself and Lisa B. Mirel (National Center for Health Statistics), who was unable to attend the workshop in person. Helms and Mirel acknowledged colleagues at the U.S. Department of Housing and Urban Development for contributing to the work and the National Center for Health Statistics Data Linkage Team (url https://www.cdc.gov/nchs/datalinkage/index.htm) for conducting the technical work of the linkage.
16 Administratively, the National Center for Health Statistics falls within the U.S. Centers for Disease Control and Prevention (CDC), which is itself a unit of the U.S. Department of Health and Human Services.
Helms conceded in opening her presentation, it was a tough initial sell and took six years of paperwork to accomplish (predating her tenure at HUD). She characterized HHS’ initial reaction as “HUD data isn’t health data,” that the substantive divide might be too difficult to bridge. But the case for joint work was developed by demonstrating commonality in cause, because both departments collect data on disability, and this was used as a “hook” to contemplate broader integration of housing and health data. Helms said that the case was made that HHS’s Healthy People 2020 initiative had cast the assessment of social determinants of health (SDOH) as a critical research priority. Healthy People 2020’s formulation of SDOH17 comprises five key subtopics:
- Neighborhood and Built Environment,
- Economic Stability,
- Education,
- Social and Community Context, and
- Health and Health Care.
Helms argued that housing data provide important information about all but the last of these subtopics,18 and the research work proceeded with housing data being directly pertinent to the SDOH. The vision emerged for a linked NCHS-HUD data resource that would augment health survey data with administrative, housing program participation data—enhancing the range of analyses that could be performed and enabling researchers to address questions that cannot be answered by either data source alone.
Specifically, Helms said that the joint HUD/NCHS research project involved the combination of administrative data from the three largest HUD rental assistance programs with data from two NCHS health surveys. Helms provided a quick overview of both sources:
- The project drew on data from three principal rental assistance programs administered by HUD: Public Housing, Housing Choice Vouchers, and Multifamily Housing. Ten million individuals receive assistance through HUD’s rental assistance programs. That service population is very diverse: about 4 million of the 10 million persons affected by the rental assistance programs are children, while the recipient base is 64 percent racial or ethnic minority, 20 percent disabled, and 77 percent female head-of-household. Program eligibility depends on citizenship status, gross income, and household size. Helms pointed out that housing assistance is not an entitlement and is, in fact, only awarded to about 25 percent of those eligible.
___________________
17 See https://www.healthypeople.gov/2020/topics-objectives/topic/social-determinants-of-health for additional information.
18 That said, Helms noted that geolocation can be said to drive health care access.
- On the health survey side, researchers made use of the 1999–2012 administrations of both the National Health Interview Survey (NHIS) and the National Health and Nutrition Examination Survey (NHANES). Both NCHS-sponsored surveys are cross-sectional in nature. The NHIS collects data on health characteristics within the civilian, noninstitutionalized U.S. population and is administered to about 35,000 households and 87,500 persons each year; NHIS data are released annually as well. NHANES is also cross-sectional and conducted annually and its interview component collects a variety of demographic, socioeconomic, and health/dietary information, but also includes a direct physical examination component that gathers medical, dental, and physiological measurements and performs certain laboratory tests on participants, via a mobile examination center. The increased scope of NHANES (and richness of its data) involves limitations in timeliness and sample size—biannual data release and only about 5,000 persons per year, respectively.
Helms noted that the memorandum of understanding governing data sharing and linkage in this project defined a critical programmatic role for both sides, in addition to each side bringing detailed subject-matter expertise to the table. NCHS, having core experience with survey data and linkage methodology, performs the data linkage between the HUD administrative and NCHS survey data, but it also underwrites access for HUD researchers at NCHS’s Research Data Center (RDC). In addition to the survey and administrative linkage, HUD provides geocoding services to NCHS.
Details of the data linkage project are detailed on the project webpage (https://www.cdc.gov/nchs/data-linkage/hud.htm).19 Helms said that eligibility for data linkage varied among the surveys in question, varied over time, and varied by respondent characteristics. It depended most critically on the availability of the identifying information required to perform the deterministic record matching (done, basically, by Social Security number, data of birth, sex, and name). But, in addition to respondents not explicitly refusing participation in linked analysis, Helms noted a few other source-specific linkage eligibility criteria. The NHIS includes a question on public housing, and NHIS records for which the respondent refused to answer that question were barred from the linkage. Moreover, child (less than 18 years of age) respondents to NHIS and NHANES were restricted to linkage only to HUD administrative records describing their program participation as a child when they might have become eligible for HUD benefits in their own right. The basic results of deterministic record matching were summarized by Helms in Table 2.5.
For the purposes of this workshop presentation, the main story of the joint HUD-NCHS work on health effects related to housing is procedural, emphasizing the mechanics of getting to a linked data set rather than exploring
___________________
19 See also the series report at https://www.cdc.gov/nchs/data/series/sr_01/sr01_060.pdf.
| NCHS Survey | Total Sample | Linkage Eligible | Linked to HUD |
|---|---|---|---|
| NHIS 1999–2012 | 579,239 | 247,504 | 23,549 |
| NHANES 1999–2012 | 71,915 | 50,559 | 6,532 |
NOTE: NCHS, National Center for Health Statistics. HUD, U.S. Department of Housing and Urban Development. NHIS, National Health Interview Survey. NHANES, National Health and Nutrition Examination Survey. NHIS row in presentation contains the added label text “(sample adult/sample child),” though this was not explained in context.
SOURCE: Workshop presentation by Veronica Helms.
the results of the analysis. However, Helms briefly displayed the covers of a series of technical reports that delve into the results in more detail (Helms et al., 2017, 2018; Lloyd et al., 2017) as well as a number of published studies making use of the linked data (Ahrens et al., 2016; Brucker et al., 2018; Fenelon et al., 2017; Helms et al., 2017; Simon et al., 2017). One empirical result presented was an examination of responses to the NHIS question that asks respondents whether they paid a lower amount of rent due to receipt of some government assistance program. Of 48,062 responses to the NHIS 1999–2012 interviews, 10,295 matched to HUD rental assistance data (the three chosen large programs and not the complete range of assistance programs). Those 10,295 matched records divided 59 percent to 41 percent answering yes and no to the lower-rent question, respectively—results that Helms said showed good concordance between the rent-assistance question on the health survey with the administrative data. She added that it is a good illustration of the value added through record linkage, inasmuch as the survey data alone could miss the 41 percent of people who actually did have their rent reduced due to receipt of HUD program benefits.
Helms said that restricted-use files from the data linkage project are now accessible through the NCHS Research Data Center, to researchers whose study proposals are accepted; she referred to https://www.cdc.gov/rdc/index.htm for more detail. The data files available now include HUD program participation in 1996–2014 and survey participation in NHIS or NHANES in 1999–2012; additional data for 2013–2016 were slated to be added to the center in early 2019. Helms reported that basic files are currently available for research proposals:
- The transaction file, containing one record for each HUD program transaction, including variates such as date of receipt, type of housing
-
assistance received, structure of housing unit, and household characteristics;
- The episode file, with one record for each health survey participant, containing variates such as start and end dates for participation episodes of various HUD programs based on the transaction data; and
- The concurrency file, with one record for each survey participant, containing variables related to the timing of HUD participation in relation to the NCHS survey date.
In addition, NCHS and HUD have made publicly available a set of feasibility files—information on linkage eligibility and limited information on program participation—that could prove useful in estimating maximum potential sample sizes, thus helping researchers decide whether to initiate RDC proposals for more detailed work. The basic structure of the feasibility files is that they contain an NCHS identifier for survey respondent, a variable indicating their eligibility for linkage to HUD data, an indicator of whether the person survey records matches to any HUD program, and an indicator of whether they match to one of the specific HUD rental assistance programs. No information at all is given about the timing or nature of the HUD assistance. The feasibility data are discussed at and available from https://www.cdc.gov/nchs/data-linkage/hudfeasibility.htm.
In closing, Helms noted that linked NCHS-HUD data can be used to examine the association between receipt of housing assistance and health outcomes/characteristics—work that is already expanding the analytic utility of both data sources and allows for insights that are not possible from either source alone. More to the point, Helms suggested that the example demonstrates an effective collaboration between two federal agencies on a complicated topic; NCHS and HUD plan to continue their collaboration, with the aim of performing the data link on the same every-other-year cycle that the NHANES follows.
2.3.5 Lessons Learned from Construction and Use of the National Mortgage Database
Robert Avery (Federal Housing Finance Agency [FHFA]) described the experience of the National Mortgage Database (NMDB) as the opposite of the Census Bureau and ACS situations in a fundamental way: effectively, an agency looking to augment its administrative data information with survey responses. Moreover, Avery noted that the early work on constructing the NMDB—and getting it to the point where supplementation with surveys is desired—has been quite purposefully done in a quiet, “under the radar” way given the sensitive nature of the data involved, but provides useful insights.
Avery noted that the NMDB is now jointly funded and managed by FHFA and what is now styled the Bureau of Consumer Financial Protection (CFPB), but it arose from the realization by the Federal Home Loan Mortgage Corporation (Freddie Mac), during the late-2000s housing crisis, that the nation lacked a comprehensive analytic database on mortgages. Freddie Mac and the Federal National Mortgage Association (Fannie Mae), and other agencies, were involved in the establishment of most, if not all, mortgage agreements, but without any central data analytic structure. Avery said that Freddie Mac initiated the project based on some pilot work and discussions while Avery was working at Cornell University; the idea changed hands administratively to Fannie Mae and to the Federal Reserve (the latter during Avery’s tenure there) before settling into its current shape at FHFA and CFPB. The NMDB is designed as a 1-in-20 nationally representative sample of all first-lien closed-end mortgages reported to the various credit bureaus and active in the United States since 1998; it currently includes records on about 12.1 million mortgage loans, and is updated each quarter with a 1-in-20 sample of new mortgage awards.
Avery said that the credit bureau Experian is a “great partner” in the work of the NMDB. He said that FHFA and CFPB pursued partnership with Experian for several reasons, among them the near-universal reporting of mortgages to the credit bureaus and the possibilities for automatic linkage to ongoing performance data on the mortgage loan as well as on other characteristics of mortgage borrowers (such as credit scores). Moreover, he said that the bureaus maintain “very good information” on basic characteristics (borrower name, Social Security number, address) that enable record linkages to other data sources. More to the point, Avery described Experian’s business as being “all about data linkage”—and securing internal support for the NMDB within Experian was essential to the enterprise’s success. In later discussion, Avery clarified (responding to a question by Scott Keeter, Pew Research Center) that there are many reasons for the restriction to a 1-in-20 rate—when the entire population of mortgages would certainly be large but, strictly speaking, would seem to be both available and tractable. These reasons include computational feasibility and constraints within the agencies, certainly, and Avery reiterated the conscious desire to keep the mortgage database very below the radar during its early development phases as a further safeguard due to the sensitive nature of the data. But, Avery said, the main reason why the NMDB is based solely on a sample is directly related to the partnership with Experian: Experian could not (in compliance with the Fair Credit Reporting Act [15 USC § 1681] and other restrictions) have divulged their entire mortgage data assets. Avery added that the 1-in-20 rate is still ample, and definitely large enough to be representative of states and some localities.
As Avery described, the initial data records provided by Experian are only the base, or the frame, for the NMDB and not the final product. Crucial data items—not the least of which is any information about the underlying
property—are missing from cases when they first enter the NMDB sample, and Avery described the overall type of mortgage as being only “imperfectly reported.” Crucial mortgage characteristics such as owner-occupancy, purpose of the loan, and adjustable-rate mortgage status are also missing. Accordingly, these data items are obtained via matching to other administrative files, with all of the matching being done behind a firewall at Experian. Specifically, Avery said that the matching involves two tasks:
- Matching to administrative loan files, performed based on the basic information about the borrower (name, Social Security number, age, address) and done with data files provided by Freddie Mac, Fannie Mae,20 the Federal Housing Administration (FHA), the U.S. Department of Veterans Affairs (VA), and the Rural Housing Service (RHS). Avery said that the matching is done on a third-party, blind-matching basis, and that FHFA is never given personally identifiable information. He noted that matching based heavily or principally on address yields many “false positives,” apparent matches that do not represent the actual mortgage loan in question. Avery said that the style that has been adopted involves Experian generating initial match “candidates,” with much of NMDB staff’s work in the past few years being refinement of a set of rules for verifying and corroborating those matches. He said that the matching has covered all historical loans (to the 1998-forward nature of the NMDB) and is updated quarterly with new loans. An important part of the lesson of constructing the NMDB is the time and difficulty involved; Avery noted that at least 100 people within the Department of Housing and Urban Development alone had to sign the memorandum of understanding to enable the file sharing needed for this project, and it took about 4 years to work out all of the agreements for the matching to FHA administrative files alone.
- Supplemental matching to obtain property characteristics, based on borrower/seller name, property address, and characteristics of the mortgage (as necessary for transactions). This matching work represents a significant collaboration between two businesses, with CoreLogic making its entire database of property assessment records and lien recordings available for the matching at Experian, behind the Experian firewall. As with the administrative data, this work has been done for all historical loans and is updated on a quarterly basis with new loans added to the sample.
Avery said that there has also been work done on matching to other CoreLogic data resources (such as its data files on private label mortgage-backed securities
___________________
20 Both Freddie Mac and Fannie Mae are regulated by the Federal Housing Finance Agency, and so their provision of data is “ordered” by FHFA, Avery noted.
[PLMBS], effectively the loans that went bad in the housing crisis). He added that they have done work on “fuzzy logic” matching to data collected by banks and institutions under the terms of the Home Mortgage Disclosure Act (HMDA; P.L. 94-200) and Home Loan Bank portfolios (representing about 1 percent of all loans).
Avery displayed a graph showing the percentage composition of the NMDB, by quarter, across four basic administrative sources: enterprise (Fannie Mae and Freddie Mac), other government sources, the PLMBS share, and other. He said that FHFA and CFPB were very satisfied with the quality of the data added to the NMDB from the key administrative sources, which typically account for 70–80 percent or more of the NMDB entries in any given quarter (save for the 2003–2008 housing bubble period, when the PLMBS made up a substantial 20–30 percent share). The “other” share, including mortgages for which substantial imputation had to be performed, remains the major methodological challenge that NMDB staff are working to resolve. Avery said that the NMDB “is just going live now” and will be made available to federal agencies with a need to access mortgage data; “users will access the database on an FHFA server.”
The core NMDB database having reached some developmental maturity, effort is now shifting toward supplementing the NMDB enterprise with additional information that can best or only be obtained by survey methods. In particular, Avery noted that FHFA and CFPB have sponsored two survey programs as part of the broader NMDB effort:
- The National Survey of Mortgage Originations (NSMO) was first collected in 2013 and is conducted by Westat on a quarterly basis. The survey uses a sample of roughly 6,000 new mortgagees drawn from new entries to the NMDB (which, Avery said, works out to a sampling rate of 1-in-260 new mortgagees). It is conducted by mail and has experienced a response rate of roughly 32 percent and a “usable rate” of about 27 percent, which Avery characterized as decent for a mail survey of this nature. Very deliberately, the NSMO questionnaire asks only a few quantitative “factual” questions about the mortgage loan itself, “primarily to determine whether the survey reaches the right person with the right loan,” because other information on the loan is known from the NMDB entry. Instead, the NSMO questionnaire centers on gathering information on “mortgage shopping,” consumer knowledge, and mortgagee expectations and satisfaction, as well as collecting the kind of demographic and life-event data that does not appear in administrative data.
Avery described the NSMO as the direct successor to the fledgling data collection, begun when he was at Cornell, that started the NMDB. But the NSMO was also the data collection Avery had referenced earlier in the day (see Section 2.1.3) with a comment about
-
privacy review. Avery said that a “cleaned, fully imputed, and weighted” dataset of “usable” NSMO responses representing mortgage originations in 2013–2016 was scheduled for release in October 2018; this public-use file combines NSMO responses with information from the NMDB proper. In this, Avery said that the NMDB staff had made use of a new service offered by the Census Bureau to other federal agencies, conducting a privacy review on the planned release. Avery commended the privacy review process and noted, in particular, that using the service has benefited the NMDB project as a whole. He said that the Census Bureau’s reputation for quality and privacy protection proved very reassuring to FHFA management, some of whom were leery of any release. But, as he noted in the earlier comment, the public-release file contains no geographic identifiers whatsoever, the privacy review having suggested that even geolocation to a coarse level might make individual records identifiable.
- The American Survey of Mortgage Borrowers (ASMB) was conducted in summer 2016 and repeated each of the next two summers; Avery said that it is hoped that the annual production cycle will continue. Each of the ASMB samples to date was drawn from the NMDB and represented a sample of about 10,000 ongoing mortgagees who are disproportionately “in distress”—that is, fallen behind on their payments. The ASMB, thus far, has experienced a response rate of roughly 22 percent.
Avery observed several benefits of a combined administrative and survey data approach, among them the benefits already mentioned in structuring the survey. Asking only the mortgage-specific information necessary to assure that the questionnaire has found the intended respondent, the survey is freed to focus on collecting unique information that cannot be obtained from the administrative database. (Avery pointed out that only about 3 percent of responses are removed on the basis that the survey responses suggested a different respondent than intended in drawing the sample.) He added that the approach provided several benefits in imputation. The surveys have what Avery considers low item nonresponse rates—6–8 percent—but there is still some, and the administrative data in the NMDB provide useful predictors in logistic regression models that are used to impute values. Avery said that the NMDB staff has purposefully chosen to use the administrative NMDB entries for predictive imputation purposes but not for direct edit/substitution; even when “hard” administrative data is available for a missing survey response (such as income), their approach is to use the administrative data as a right-hand-side predictor variable and not a direct-imputation donor (except in rare instances of obvious reporting error). Avery also said that a “major benefit” of the approach was that the administrative NMDB data provided a solid base for constructing sample weights for final tabulation of results. Finally, he noted
that the NMDB team had found great benefits in constructing measures of consumer knowledge—comparing survey answers with the administrative data on file on quantities such as the interest rate of a mortgage loan or its original balance. Avery said that FHFA and CFPB are working to examine differences between the sources to “reveal what items consumers are likely to know and where they might be fooled”—to wit, they are much more likely to know payment amounts than standing balances. He said that substantial numbers of “don’t know” answers can be just as telling as “wrong” or incorrect results. For example, they find that over one-third of respondents do not know their mortgage closing costs (and many do not know who paid them).
Data collection, and the combination of administrative and survey data in particular, is an exercise in exploration, and Avery said that the group is learning a great deal about instances when questions are unduly ambiguous. For instance, he said, some consumers will interpret “When did you buy your house?” as corresponding to the time when they made the offer on a house, while others will consider it to be the time when papers were finally signed. Ask “How many units in the property?” and Avery said that some respondents will count all the units in the physical structure while others will implicitly limit their response to those units covered by the specific mortgage loan. The question “Is this a refinance?” needs reformulation and careful thought because some people do not consider normal refinances as new mortgages, but rather as modifications of the original (and so will consider it a “purchase mortgage”). Finally, Avery said, even a question such as “Are you a first-time homebuyer?” was thought to be fairly unambiguous, but comparisons of survey and administrative data suggested that it is not; respondents might not consider a condominium unit a “home” in the same sense as a detached property.
Avery’s final point was that this work requires careful scrutiny of the source data, and the NMDB is now at the point where they are starting to work on challenging problems in integrating property data into the fold. Mortgage data alone are of very little value in assessing or verifying the value of the underlying property, hence the need to work with other information sources. Increasingly, they are finding “significant inconsistencies” in the way that land use codes, property descriptions, and even the number of units in a structure are recorded in different sources and jurisdictions; a duplex owned by the same person may be recorded as a single mortgage or as two mortgages, depending on how the records are completed. Avery characterized these as issues “on the fringe” that the NMDB researchers are just starting to work through. Compromises such as the redaction of all geographic identifiers from the NSMO data release may seem dire on some level, but Avery closed by noting compromise will make it possible to release their first fusion product of administrative and survey data, and they hope that the product will quickly become a definitive source for understanding the characteristics of American mortgages.
2.3.6 Value Added from Linking Multiple Data Resources and Survey Data at the Regional Level
Mike Carnathan (Atlanta Regional Commission; ARC) commented at the outset that his remarks would echo Erin Dalton’s presentation (Section 2.3.2) in important respects. Ultimately, the ARC is focused on a localized geographic area but, as with Dalton’s Allegheny County Department of Human Services, the ARC plays many functional roles. It is a comprehensive planning agency akin to a council of governments, but it also is state-authorized as the area coordinating agency for aging services, water/utility planning, workforce development (as an economic opportunity agency), and others. Among other things, ARC is state-authorized as a municipal planning organization—making it the conduit for disseminating federal transportation funds to localities in the Atlanta area, among other “federal mandate” functions that it performs. It is tasked with producing population estimates and forecasts as well as employment estimates. In other words, Carnathan said, ARC has “a lot of mouths to feed with our data—and so we need lots and lots of data,” from many wide-ranging sources, to meet those needs.
Carnathan said that the ARC, and his research division in particular, operates its Neighborhood Nexus platform (www.neighborhoodnexus.org) as a “community intelligence system,” serving the dual purposes of satisfying the ARC’s own data needs as well as serving as an outreach arm to the public and to constituent local governments—always focused on the best and meaningful ways of using data to inform solutions. Increasingly, part of the work involves outreach to nonprofit organizations in the community to “get them on the same page” about regional needs and promoting their own informed data use to make decisions. He said that Neighborhood Nexus probably winds up involving 6,000–7,000 data elements, down to the neighborhood, small-area level; a lot of that comes from the ACS and other federal sources, others come from state agencies (as in public health and education), and some local jurisdiction data resources. Carnathan said that they use all of that data—similar to Dalton’s remarks—not with the mindset of augmenting or replacing some variables through reference to administrative records, but rather to consider a multiplicity of sources in “telling the bigger story, of the [whole] system” and the whole region.
Carnathan described ARC’s “theory of change” as converting data into information—through the tools of data development, visualization, and storytelling—and thus enabling community “problem solvers” to translate that information into action. It is about trying to propagate a data-driven stance among the nonprofit organizations and other community stakeholders and thus providing increased value to those entities. He said that they have three main approaches to this theory of change, in trying to cultivate a data-driven culture in the Atlanta region and Georgia as a whole:
- The www.neighborhoodnexus.org portal itself—the means of accessing the 6,000–7,000 data elements from a dozen or more data sources, depending on the level of geography being studied—is a big part of the strategy. Carnathan said that constant updating is key to building trust in and awareness of the effort and, moreover, the website exemplifies ARC’s “core value” that data are a public good (and not a commodity, as is the increasing perception).
- A second plank—and the direction in which Carnathan said ARC is pivoting more and more—is actively engaging with community organizations. There is always the important “data intermediary” function to perform, but Carnathan said that ARC is trying to find ways to really “get out and talk about the data”, promoting better data literacy among its stakeholders and clients through training and education on data analysis and storytelling. Their blog (http://33n.atlantaregional.com) is meant to serve as a model for data-driven storytelling, presenting capsule views of “data journalism.”
- Carnathan also noted that the ARC has engaged in some “deep dive” engagements as part of its fee-for-service portfolio, honed specifically on their interests and intended to help those organizations identify key indicators of progress to understand the impact of their own work. Among those deep dives include recent work for the Junior League, as well as a broader effort with various stakeholders working at the intersection of health (e.g., the Atlanta Regional Collaborative for Health Improvement [ARCHI]), education (e.g., Georgia Early Education Alliance for Ready Students [GEEARS]), and income stabilization (e.g., United Way and the City of Atlanta).
To illustrate the kind of stories that ARC tries to tell with data, Carnathan reprised pieces of a presentation prepared for community partners interested in issues of social equity. The presentation consisted of 8 choropleth maps of tracts/neighborhoods in the city of Atlanta, presenting distributions of 8 variables with different shades of blue. Of course, the maps do not translate well to the black-and-white printed page, particularly not to the precision of being able to discern fine differences, and the content of the maps was unlabeled as Carnathan first scrolled through them. That was, indeed, the point: with slight variation, the maps all showed the same basic feature, a rough bisection of the city from northwest to southeast, above which the data values are almost universally low and below which are concentrated the highest values of the variable. The series of maps, Carnathan explained, tell a consistent story playing out across a wide variety of phenomena using data of varying provenance:
- Percent share of violent crimes (data from the City of Atlanta—presumably, the figures reported to the Uniform Crime Reporting program administered by the Federal Bureau of Investigation);
- Percent housing units surveyed that are in poor or deterioriated condition (administrative data from the City of Atlanta);
- Percent of adult population with no high school diploma (data from the ACS);
- Percent of 18–64 year olds with a disability (data from the ACS);
- Percent in poverty (data derived from the ACS);
- Teen birth rate (data source not stated);
- Percent of households with no vehicles available (data from the ACS); and
- Percent black (data from the ACS).
Presenting these kinds of commonalities to nonprofits, even in a very basic manner, is a powerful and important thing, Carnathan said. Just by the nature of their work, nonprofits and other community organizations tend to “have their hammer,” and the challenge is finding ways to get them to work collectively on addressing problems rather than treating “every problem [as] a nail to hit with that one tool.” Reinforcing blunt, systematic differences through analyses like this is critical. And the secondary lesson Carnathan derived from this is similar to Dalton’s: users/stakeholders like the ARC do not just use or concern themselves with one single data resource, “we have to look at all of it” from a variety of perspectives. The notion of replacing information on the ACS with administrative data is not very relevant to how ARC works, but looking for both common features and differences through multiple data views is the real value.
Carnathan also briefly walked through a “deep dive” analysis that ARC had recently performed using ACS information (particularly, median value of owner-occupied housing units in 2016) and mortgage data available from banks under the Home Mortgage Disclosure Act (HMDA; particularly, median amount of newly originated home purchase loans in 2016). Carnathan noted a strong, fairly simple linear relationship between the ACS and HMDA measures by tract for the Atlanta region (R2 = 0.84). With that confidence, ARC has pursued more detailed analysis of outliers in the relationship and trying to detect any important spatial patterning. In particular, they are trying to determine whether these are just “hot” areas in the region where banks are lending the most in general. The analysis further looked for spatial effects in areas where home prices have appreciated most strongly. At this stage, the work is still exploratory and hypothesis-building in nature, but each step in the “deep dive”—seeking some new auxiliary information to explain common structures—is a good example of how regional planners use data on a daily basis.
| Non-Hispanic | Hispanic | |||||
|---|---|---|---|---|---|---|
| White | Black | Asian/PI | American Indian | Two or More Races | ||
| 2000 Census | 86.6 | 10.6 | 0.4 | 0.3 | 1.6 | 0.6 |
| 2010 Census | 83.7 | 11.2 | 0.4 | 0.7 | 1.4 | 2.6 |
| CY Estimate | 81.4 | 12.1 | 0.6 | 0.9 | 1.4 | 3.5 |
NOTES: Asian/PI, Asian and Pacific Islander; CY, current year. All figures are percentages.
SOURCE: Workshop presentation by Sarah Burgoyne.
2.3.7 Private Sector Experience with Data Linking and Blending
Sarah Burgoyne (Claritas) divided her presentation into two segments to cover the two basic topics in her title: first, an illustration of the kind of data linking and inference that goes on in private companies (based on census data) to produce new products and, second, a brief discussion of porting experience in market segmentation to the ACS experience.
To satisfy the demands of its own data customers, Burgoyne said that Claritas regularly generates a series of population estimates and forecasts, such as estimates of race and Hispanic origin for census block groups. She described the basic process as linear extrapolation of the trend between the 2000 census and the 2010 census, using the Census Bureau’s most recent population estimates for counties as controls (and including facility for “moderation for both extreme growth and decline”). The results, for a condensed number of race/Hispanic origin categories, for an example block group in Alabama is shown in Table 2.6. The effects of the county controls are evident in, for example, the 0.6 percent current year estimate for percent non-Hispanic Asian and Pacific Islander, an increase when the 2000–2010 trend is flat at 0.4 percent.
Burgoyne said that, in the absence of more timely 1-year estimates direct from the ACS for all block groups, Claritas is working on revised methodology that it dubs the Names Based method. The method takes as its base a data product from the 2000 census that published counts of respondent surnames—and race and Hispanic origin category percentages for the same—for any surname occurring at least 100 times in the 2000 census. This was then used in conjunction with two private-sector name and address lists, one of 2011 vintage (chosen as closest to the 2010 census) and the other representing current year. Burgoyne explained the anchoring to 2000 as being because the geographic
codes (including block group) available on the commercial, private-sector files still conformed to 2000 census geography. Record matching was done by surname between the census surnames file and the private-sector lists, applying a race/Hispanic percent distribution to the records based on the surname. Doing so, she said, led them to be able to develop probabilities for the demographic composition of a particular block group: that is, the objective of the work, and not the assignment of a specific race/Hispanic origin category to every person record. A ratio-based estimate was then constructed through application to 2010 census data for block-groups:
where A2 is the estimate race/Hispanic origin percentage at time 2, A1 the actual race/Hispanic origin percentage found at time 1 (the 2010 census), N2 the names-based percentage at time 2 (based on the current-year private-sector list) and N1 the names-based percentage at time 1 (based on the 2011-vintage private-sector list).
Burgoyne said that there are critical limitations to the Names Based method. At present, adjustments made by the names-based method are limited to Hispanic origin and Asian race categories. Exploratory analysis had suggested that, in particular, surnames of black/African American individuals “are not overwhelmingly associated with race”—and, thus, the surname data are not particularly telling about the probabilistic demographic composition. Another key limitation imposed on the Names Based method at present is that it is restricted to block groups where the surname analysis suggests a higher Hispanic percentage (or Asian percentage) than the basic (extrapolation) estimate. She added that the estimates of Hispanic origin percentage are redistributed to the seven major race categories using county-level percentages. She briefly displayed the results of the Names Based methods (and the standard methodologies) for a sample block group in Texas to illustrate the process at work, as shown in Table 2.7. She noted, in particular, that the percent Hispanic origin by basic extrapolation was 7.6 percent but ticked higher to 10.2 percent using the Names Based method; the final estimate, controlling to county, was set at 10.5 percent.
Burgoyne noted that this is work in progress and not suitable for use for all block groups; future enhancements will explore the incorporation of 5-year ACS data in the process. She also noted in closing this section of the presentation that the idea of names-based inference of demographic composition is not new and has been tried by other marketing data concerns. In the limited use at Claritas, Burgoyne said that one lesson has been learned and reinforced early. Claritas began developing its own Names Based method after one of its data providers abruptly changed its methodology for estimating Hispanic origin. Hence, the lesson already invoked in discussion in the
| Non-Hispanic | Hispanic | |||||
|---|---|---|---|---|---|---|
| White | Black | Asian/PI | American Indian | Two or More Races | ||
| 2010 Census | 29.3 | 26.5 | 29.2 | 0.2 | 2.3 | 12.2 |
| CY Basic Method | 17.2 | 35.2 | 36.7 | 0.1 | 2.7 | 7.6 |
| CY Names Method | 16.7 | 34.2 | 35.7 | 0.1 | 2.7 | 10.2 |
| CY Final Estimate | 19.4 | 34.0 | 32.7 | 0.1 | 2.9 | 10.5 |
NOTES: Asian/PI, Asian and Pacific Islander; CY, current year. All figures are percentages.
SOURCE: Workshop presentation by Sarah Burgoyne.
workshop: changes in and by the third-party source of data can have major downstream effects.
Burgoyne’s second main topic built upon Claritas’ PRIZM® Premier product for consumer market segmentation and analysis. As she said of surname-based inference for race and Hispanic origin, PRIZM Premier is not a new concept; a “long-time and well known Claritas product,” PRIZM Premier’s premise is to classify block groups (corresponding, very roughly, to neighborhoods) as falling into one of 68 sociodemographic categories. Burgoyne said that it is a “geodemographic” product, simultaneously a “classic” shortcut (saving the time and expense of “full demographic analysis” of a particular market) and a “somewhat outmoded” one. The state-of-the-art in trying to assess consumer behavior is market segmentation at the household or person level, but she said there remains strong value in the geodemographic approach and in the adage that “you are where you live.”
The 68 geodemographic segments named in PRIZM Premier (Box 2.4) were crafted through “creative data linkages” between census and ACS data, private-sector consumer survey data, media usage data, and other third-party data resources on consumer purchases. For example, a block group classified as 04 Young Digerati tends to live in the urban fringe, is wealthy and well-educated, has above-average access to technology in the household, and is mostly composed of small families with children. From connections to other consumer data, 04 Young Digerati areas might be said to have particular lifestyle and media traits: ownership of an Audi, shopping at Bloomingdales, listening to alternative music, and making heavy use of Uber ride-share services. By contrast, block groups classified as 68 Bedrock America tend to be more small-town in nature, low income, have below-average household technology and are high school-only educated and mostly renters; lifestyle and media traits in such a block group
skew more toward Oldsmobile ownership, shopping at Wal-Mart, and listening to contemporary/inspirational music. These segments can be combined and grouped by common characteristics, defining other socioeconomic partitions. For example, Burgoyne’s slide illustrated that five PRIZM Premier segments (42 Multi-Culti Mosaic, 45 Urban Modern Mix, 56 Multi-Culti Families, 61 Second City Generations, 68 Bedrock America) are grouped together under the label (F4) “Sustaining Families,” one of 11 reduced segments in a lifestage/age-by-wealth partitioning (it is the group corresponding to middle years/family life as lifestage and relatively low wealth). Hence, the labels (and their associated market partitioning) can be regrouped, say, into 14 social-mobility categories or 11 lifestage categories.
By linking block groups to PRIZM codes, client businesses can obtain a quick shorthand read of likely propensities in new markets. Of course, inference can also go the other way; results from a new consumer survey can
be analyzed by appending the block-group PRIZM codes and assessing how well the codes seem to correspond to the new information. Along these lines, Burgoyne briefly described a partial “PRIZM Profile” based on a consumer survey that asked respondents about their likelihood to drink imported beer.
Though Burgoyne did not explicitly say so in her talk, construction of geodemographic segments has fairly deep roots in Census Bureau culture; similar market segmentation research was a starting point for the major communication plans of both the 2000 and 2010 censuses, and the Census Bureau has regularly constructed a Planning Database in which ACS (or, in past times, census long-form sample) covariates by census tract have been used to derive “hard-to-count” scores for those small areas and inform particular enumeration strategies. But, even absent that backdrop, Burgoyne suggested that there might be value to all sides in considering a link between ACS data and market segmentation data such as PRIZM Premier. Crosstabulating ACS data by PRIZM code could usefully provide profiles along important ACS variates like employment status, commute/journey to work, and language spoken, potentially adding value and meaning to the PRIZM codes themselves. In return, the Census Bureau might gain a useful tool in identifying particularly hard-to-count areas or targeting its ACS and other-survey mailings more effectively. Operating at the geodemographic level, there would seem to be minimal risk of linking or divulging personally identifiable information through performing this match, and Burgoyne added that matching and tabulation could be done by and at the Census Bureau or through a secure site such as a Research Data Center. Burgoyne commented that the idea might sound daring but could be worth exploring, to both add value to the ACS and to promote wider collaboration with the private sector (as is being promoted by administrative-data efforts in federal statistics in general).
2.3.8 Discussion
Amy O’Hara (Georgetown University) began her remarks by noting that the workshop’s first day profiled a number of products and methods. Some of these products are things that the government itself has wanted and needed, others stemmed from needs by nongovernment actors. Many serve to address gaps in existing collections—something that is commonly a question of great concern within the federal statistical system, whether its products correspond to what the public needs. In some cases, what has been needed is not “replacement” of data sources with new information but the augmentation of internal data resources with government releases, as with Carnathan’s work in Atlanta. The projects and methods also varied in how much extant, third-party or survey data they used: the NCHS-HUD collaborative effectively used all of the available health survey and major-rental-assistance-program data, while the National
Mortgage Database very deliberately restricted itself to samples of available mortgage loan data. Others made very creative use of data already released.
O’Hara said that it is worthwhile to step back and consider the range of data products discussed during the day and that are generally desired from greater combination of multiple data sources. The microdata files themselves are the objective in some cases, but in others the essential product is the processed results rather than the raw data, such as housing price indexes, deprivation indexes, or statistical summaries. There are classes of data users and consumers for whom the desire tends toward causal analysis and intensive examination of potential correlates or causes, because they want to know whether a particular program or policy works. O’Hara noted that several times throughout the day presenters had suggested that the desired product is sometimes simply an increased capacity for analysis (provisions for places to work on the data or the know-how to use them more effectively); she noted that this is something that the ACS does very well. Finally, O’Hara said, there are some for whom the main concern is simply getting an answer to a critical question of interest.
O’Hara said that her questions in thinking about this are: Who is the producer? Is the Census Bureau responsible for anticipating all the questions and providing all of the answers? And what should the Census Bureau do to generate all of the aforementioned products, versus enabling their construction? She noted that the historic norm for the Census Bureau (and other statistical agencies) has been to assume the complete responsibility; if a need for a product was demonstrated, then she said that “old Census” would design a survey, test the questions, collect the data, and release the file. The workshop included instances of the existing products being insufficient, so “we cobbled together our own” or “we’ll create the data collection ourselves.” But in the “new Census”—and new multiple-data-sources—world, O’Hara wondered whether public-use microdata sets will continue to be released? Is it up to Census or the government to come up with the answer that they are looking for?
O’Hara displayed a diagram that she described as a “very bad game of Jenga”—a widest-at-top, narrowest-at-bottom triangle comprised of 15 planks. Some of these planks had come up in previous workshop presentations, but many others had not; from top-to-bottom, the diagram read:
- Knowledge management (data, code, documentation retention)
- Statistical disclosure limitation
- Computing environment
- Data provisioning
- Researcher credentialing
- Data use locations
- Data warehousing
- Data linkage
- Extract, transform, load
- Research proposals
- IT security
- Privacy and Institutional Review Board
- Data use agreements
- Owner buy-in
- Data discovery
O’Hara said that her point, her answer to the questions she raised, is that the Census Bureau—or any other agency “helping people use the data” should be doing all of these things—even though it is a very fragile construct. Most of the weight in this diagram falls on the bottom plank, data discovery, and making all possible users aware of what is available and possible is no easy task. And, she said, it goes all the way up to the very big problems in knowledge management. If the Census Bureau is doing a lot of this (and O’Hara said that they are), how do they manage that load, and how much can actually be done in-house?
In terms of emerging practices, O’Hara urged the Census Bureau and the broader ACS community to keep tabs on the work going on at three distinct levels. First, O’Hara said that there is a need to follow the development of numerous “communities of practice” below the federal level. She noted that Erin Dalton is part of one of these, working with Dennis Culhane’s Actionable Intelligence for Social Policy (AISP) group. A growing number of such communities are developing at the state and substate level, focused on problems of more effective data use, data curation, and data management. O’Hara said that it will be important to work with these groups in figuring out ways to achieve the kinds of capacity-building that Dalton had usefully suggested in previous discussion. Second, O’Hara encouraged greater attention to work going on in the international community—noting with some chagrin that she was only one of about 10 Americans at a recent overseas meeting of the International Population Data Linkage Network, out of hundreds of people. There is important conceptual and methodological work on data linkage and analysis going on in such forums (much of it health related), and the methodological advances in particular might usefully translate into American experience. O’Hara said that, right now, something like matching the National Mortgage Database to wider data holdings at the Census Bureau is not possible; the data reside on different servers, and “never the two shall meet.” But what if “the identifiers never really left home,” if statistics from a match could be done in a secure encrypted way as the international experience is suggesting to be more feasible? Finally, O’Hara commented that her recent work at Stanford had brought her into contact with the “largest data-driven companies in the world,” and that there is much to be learned about “best” practices in data management from the private sector. (Pointedly, O’Hara noted that they do not necessarily have the “safest” such practices, but they are still the “best.”) The private sector also has considerable expertise in federated data systems, data commons models,
and data security/threat modeling that should be gleaned. O’Hara said that the Census Bureau has historically hindered itself by treating “Title 13” census processes as sacred; Census data and Title 13 protections are, of course, critically important—but the private sector has “sacred” data, too, on which companies may rise and fall, so there are lessons to be learned in operating within that “sacred” nature. With respect to threat modeling, O’Hara commented that she understands that the Census Bureau is looking into these matters, particularly in connection with the 2020 census.
O’Hara noted that the objective of the workshop was to stimulate thinking about the next phase of Census/ACS research and development; she closed by urging that the Census Bureau find ways to “lean on outside researchers to help with the R” side of that agenda, without losing sight of strong focus on the “D” side. In terms of research, O’Hara said that she would very much like to see greater production of research through and with the Research Data Centers (RDCs). She said that her opinion is that the RDCs are primarily an academic endeavor at present, but that there is great value in expanding their mandate to meet policymaker and other stakeholder needs. Few of the RDCs currently want to test-drive product development, even though they would seem to be ideally positioned to do so. O’Hara said that the RDCs currently work under stringent policy—but not legal—constraints, putting themselves into “a cage of their own design.” She argued that the RDC process is currently hindered by the requirement that research proposals must demonstrate potential Title 13 benefits and show some capacity to improve the quality of a Title 13 census or survey. It is important to preserve some of that flavor, O’Hara suggested, but the requirements may unduly preempt useful work. Indeed, she suggested that much of what the workshop covered in the afternoon would be improved by adding the two words “and addressing” to one of the criteria required of RDC proposals, making it read: “identifying and addressing shortcomings of current data collection programs and/or documenting new data collection needs.” Such a minor change could stimulate much useful product and methodological development through the RDCs. In the still longer run, O’Hara suggested viewing the ACS research agenda through the prism of a truly radical reimagining of the ACS. She said to imagine an ACS that uses (appropriately) modeled values for most items, wherein the respondent data are much less likely to directly enter the published values (and, indeed, serve primarily to “benchmark” the model results and impressions from administrative data). In this context, O’Hara asked, would it be possible to release data for all areas every year instead of every five? And, if they did, would users and stakeholders find that the primarily model-based data satisfy their needs? She hastened to add that she was not directly suggesting to the Census Bureau or the ACS Office that they start down this path—just to think of research efforts that start to assess whether such a radical vision is even feasible. Finally, turning to the “D” side of R&D, O’Hara closed by saying that
the challenge is to avoid being continually stuck at the “research” side; the need is to develop production uses to help with burden reduction and imputation.
2.3.9 Floor Discussion
In the floor discussion that followed this final session of the workshop’s first day, Dean Resnick (NORC at the University of Chicago) asked O’Hara whether Title 13 limits data access to researchers. O’Hara replied by pointing out the “employees of private organizations to assist the Bureau” clause in 13 U.S.C. § 23(c), authorizing the use of such external personnel but constraining it as well. Stephen Tordella (Decision Demographics) broadened the question by commenting that people have long sought access to the RDCs, but that their posture in return “has always seemed to be, ‘go away.”’ Working with other places like the Food and Nutrition Service has historically been much easier. Practically speaking, he asked, how can the RDCs be opened to researchers? O’Hara reiterated the need to rewrite policies such as the criteria for project approval. She said that it is possible for progress to be made within the Census Bureau by facilitating specific projects or groups of projects—noting in particular that she had tried to do that by brokering access to data during her tenure at the Census Bureau. But the higher-level policies need to be debated.
Warren Brown (Cornell University) asked Carnathan about the Atlanta Regional Commission’s role in generating population estimates. He stated interest in the local/regional perspective on the housing unit-based method for population estimation, saying that the historical view of the relationship between the ACS and the Census Bureau’s Population Estimates program is that the latter provides controls for the former. But it could be much more—how can local or regional data be better leveraged in population estimation? Is there a role for local administrative data there? Carnathan replied it is a question worth exploring—noting that the ARC is actually bound by state law to produce estimates annually, which are then used to generate more fine-grained population estimates at the neighborhood level.
O’Hara asked Robert Avery about the National Mortgage Database’s use of Experian as both a provider of data and as a trusted third party (conducting the actual record linkages) in a public/private partnership, and asked whether there was any alternative to Experian doing the linkage work. Avery responded that the two branches or units within Experian, the credit bureau side and the noncredit bureau side, are treated separately. As Freddie Mac’s regulator, FHFA is acutely aware of the legal restrictions on sharing of data between banks and credit bureaus. It took several years to perfect the work, but it is done such that the personally identifiable information (PII) and the non-PII being transferred “never touch,” that the credit bureau side never sees any mortgage information whatsoever (solely verifying whether the person in question is the right one). The non-credit bureau side of Experian performs the match and, if candidate
match is determined, that is reviewed by FHFA. Arguably, Avery suggested, it is not the most efficient of arrangements, but it is necessary to satisfy the legal requirements—and to address the concerns suggested by O’Hara in raising the question. He said that they have explored ways to work more directly with the credit bureau side, but the Fair Credit Reporting Act and other requirements have made that very complicated. Just to return to the nature of public/private work in general, Avery commented that “somebody at Experian took a very big chance with us,” saw the work as a public good. The NMDB project got attention from the company, and that was essential to success. Later, that internal “champion” of sharing and linkage moved to CoreLogic—which is the principal reason why the NMDB effort gets access to CoreLogic data now. The point that Avery said he wanted to make is that both the “public” and “private” side of partnerships need to be understood; the private sector has no incentive to pursue comprehensive coverage of every rural area and small community (because that’s not where the business activity is) in the same way that drives the federal statistical mindset, and only targeted federal resources will achieve that kind of coverage.
Briefly summarizing the first day of the workshop, Victoria Velkoff (Census Bureau) said that she heard common themes throughout the presentations of the day: the need for criteria (for accepting alternative data sources, etc.) as part of the solution, and support for data quality as the chief goal of the ACS and of applications of the ACS and other data sources. She said that the suggestion to get researchers more involved in using and probing the ACS data—and particularly the idea to involve the RDCs more—is a great one. Velkoff said that she accepted Connie Citro’s suggestion that the ACS needs to put a “stake in the ground” in terms of administrative records use in production—but added that “we’re not quite ready for that, yet.” She said that there are many ways forward in this space, and data collection in the ACS will likely look very different in 10 years; the research agenda arising from this discussion should reflect that. Velkoff said that the workshop conveyed many risks involved in incorporating administrative and third-party data sources but also many potential rewards; she said that the conversations will undoubtedly continue over the coming months and years through the expert meetings and follow-up discussions.
This page intentionally left blank.


