
X-RAY MICROSCOPY AND THE DETECTION OF LIFE
Chris Jacobsen
Department of Physics and Astronomy
State University of New York, Stony Brook
Abstract
The microscopic investigation of possibly life-containing specimens can be greatly aided by looking not just at the morphology of a feature of interest, but at its chemistry as well. Soft x-ray microscopes are well suited to this task. The basic ideas of soft x-ray microscopes, and their application to organic material detection from sample masses as small as 10−17 g, are briefly outlined.
Introduction
In the search for life elsewhere in the solar system, we have some expectations about what life might look like: It will likely involve carbon chemistry, and a spatial segregation of organic compounds in a way that simple chemical processes would not permit. Instrumentation for bulk chemical measurements on robotic probes may well provide more than enough of a signature to convince the scientific community of life elsewhere, but further proof (and proof that might be especially convincing to the general public) could be provided if we could actually see something in a sample returned to Earth that we could somehow recognize as representing life, either with something that was recently living or in a fossil record.
However, seeing something that looks familiar may not be enough. For example, early reports of the imaging of DNA in scanning tunneling microscopes (STMs) used highly ordered pyrolitic graphite (HOPG) substrate, and subsequent investigations showed that at least some of the features reported were not those of DNA at all but of artifacts on the HOPG surface.1 Similar care must be applied to the interpretation of scanning electron microscope (SEM) images of intriguing features; ideally, one would like to know not just what is the morphology of the object under examination, but what is its composition. Better yet, when looking at the composition, one would like to go beyond a map of the concentration of elements in the specimen, to know of their chemical binding states. How does one map the chemistry of a specimen? Simply recording the x-ray fluorescence signal in an energy-dispersive detector in an SEM is not sufficient; the intrinsic energy resolution for detecting x-rays of an energy E (in electron volts) in a silicon detector is about ![]() , giving an energy width of about 30 eV for carbon K x-rays. Since chemical binding energies are in the range of 1-5 eV, one will have no ability to determine the chemical binding state of carbon in such a system. However, there are several microscopes that can be used to look at chemical binding states of carbon compounds:
, giving an energy width of about 30 eV for carbon K x-rays. Since chemical binding energies are in the range of 1-5 eV, one will have no ability to determine the chemical binding state of carbon in such a system. However, there are several microscopes that can be used to look at chemical binding states of carbon compounds:
-
Secondary ion mass spectroscopy microscopes can provide 50-nm spatial resolution mapping of molecular masses, but because the specimen is eroded in the microscope, one can examine a microscopic feature only once.
-
Infrared microspectroscopy provides very good chemical state mapping of organic molecules based on their well-defined vibrational and rotational states; it does so at about 10-µm resolution.
-
Visible-light microscopes can be used to obtain some information about the chemistry of nonfluorescing compounds at a spatial resolution of 200 to 1000 nm.
-
Electron energy loss spectroscopy allows one to look at chemical binding states of 100-nm thin section specimens, with about 0.5-eV energy resolution in most instruments and a spatial resolution of 5 nm or better.
-
X-ray microscopy allows one to look at somewhat thicker sections, with an improved energy resolution of about 0.1 eV and a spatial resolution of 30-50 nm.
While each of these tools has its own set of capabilities and limitations, x-ray microscopy is especially well suited to the examination of possible microbial life if samples can be returned to Earth.
Soft X-ray Microscopy
We outline some of the characteristics of soft x-ray microscopes. More complete discussions can be found elsewhere.2−5
Photons in the energy range of about 100 to 1000 eV are often called “soft” x-rays (though usage of the term varies a bit). In this energy range, x-rays have a wavelength of a few nanometers, so that the potential is there for very high spatial resolution in microscopes. More importantly, soft x-rays are well suited to providing high spatial resolution images of organic specimens. By operating at photon energies above ~289 eV, one has enough energy to remove inner shell electrons from carbon atoms by ionization. However, if the photon energy is kept below ~540 eV, one will not have enough energy to remove inner shell electrons from oxygen. A consequence is that one can image hydrated, organic specimens with very high concentration by operating in the “water window” energy range between about 289 and 540 eV.6,7 Furthermore, by operating at energies slightly below the ionization threshold of carbon, the inner shell electron can be excited to an unoccupied molecular orbital. This gives rise to pre-edge absorption resonances that go by the name of x-ray absorption near-edge structure (XANES) or near-edge x-ray absorption fine structure (NEXAFS). This same effect forms the basis for energy loss near-edge structure (ELNES) in electron energy loss spectroscopy (EELS), except that in EELS the near-edge signal lies upon a large background of various plural inelastic scattering events. The intrinsically higher signal-to-noise ratio of XANES spectroscopy means that one can generally obtain better chemical state mapping information with less radiation dose to the specimen.8,9
While x-ray illumination of a specimen can be used to generate photoelectrons from the outermost 100-nm specimen layer that are then imaged with electron optics,10 transmission imaging is more commonly used for chemical state mapping of features located not just on a specimen surface. Most soft x-ray transmission microscopes use Fresnel zone plates as the focusing optic. These zone plates operate as circular diffraction gratings, and their Rayleigh spatial resolution can be as good as 1.22 times the outermost zone width. The best zone plates now available have an outermost zone width of 20-30 nm,11−13 giving a Rayleigh resolution of 25 to 35 nm. When used in scanning transmission x-ray microscopes with grating monochromators and undulator radiation,14,15 this spatial resolution can be combined with spectroscopy at 0.1 to 0.2-eV energy resolution,16,17 thereby matching the intrinsic width of XANES resonances. With this approach of soft x-ray spectromicroscopy (Figure 1), one can determine the bonding state of organic materials at 1 percent or greater concentration in a 50 × 50 × 200 nm3 volume, or a feature mass of only 10−17 g.
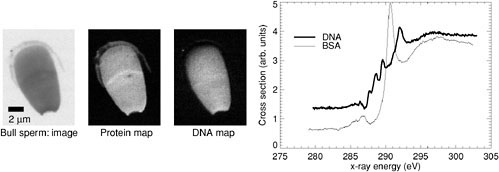
FIGURE 1. X-ray spectromicroscopy in biology. The image on the left was one of six taken at specific photon energies in the carbon XANES spectral region (absorption spectra of a protein standard, bovine serum albumin [BSA], and of DNA are shown on the right). From these images, maps of protein and DNA distributions in bull sperm were obtained as part of a study of protamine binding. SOURCE: X. Zhang, R. Balhorn, J. Mazrimas, and J. Kirz, “Mapping and Measuring DNA to Protein Ratios in Mammalian Sperm Head by XANES Imaging,” Journal Struct. Biol. 116:335-344, 1996.
With these microscopes, one can in favorable circumstances take a single image of an initially living specimen in fully hydrated conditions; however, the radiation dose delivered to the specimen as part of the imaging process is on the order of 106 Gy, which produces immediate changes in a room-temperature specimen. 18 The solution is to examine the specimen at liquid nitrogen temperatures, where the diffusion of irradiation-produced free radicals is essentially stopped; in this case, specimens can withstand radiation doses of about 1010 Gy before mass loss is observed.19,20 When the specimen is stable enough to allow the acquisition of multiple images, one can rotate the specimen within the depth of focus of a zone plate and obtain tomographic reconstructions of the three-dimensional nature of micrometer-size specimens.21-23
X-ray Microscopy for Life Detection
Soft x-ray microscopes are being used for studies in biology24,25 and polymer science,26,27 among other fields.28 In Figure 2, we show the examination of a thin section of the ALH84001 meteorite where one can determine that the ratio of organic carbon to carbonates is significantly higher in the “rim” region. Soft x-ray microscopy studies on astrobiology specimens are only beginning,29,30 but the combination of high spatial resolution and chemical state sensitivity should prove quite powerful. In organic geochemistry, Cody et al. have carried out investigations on the diagenesis of organic matter through geological time, including wood, fossilized plants and wood, and coal.31 X-ray microscopy has been able to reveal that signatures of life, including the presence of carbohydrates and recognizable cell walls, can be unambiguously identified even in partially mineralized fossils in a way that other techniques cannot address. We therefore conclude that x-ray microscopy may prove useful in the study of returned samples to aid the search for life outside of Earth.
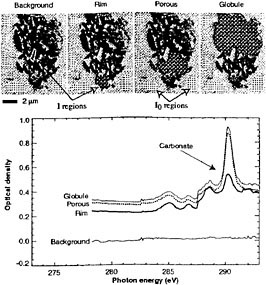
FIGURE 2. Illustration of the use of soft x-ray spectromicroscopy for the study of a thin-section sample of the ALH84001 meteorite. The image shown was taken at a photon energy of 284.0 eV with a pixel size of 48 nm. Different analysis regions were selected (two are indicated by arrows) to highlight a background region within the specimen; the carbonaceous-rich rim, which is rich in polycyclic aromatic hydrocarbons (PAHs); and the porous and globule regions of the meteor chip. The corresponding absorption spectra indicate that the rim has a higher ratio of organic material to carbonate. SOURCE: C. Jacobsen, S. Wirick, G. Flynn, and C. Zimba, “Soft X-ray Spectroscopy from Image Sequences with Sub-100 nm Spatial Resolution, ” Journal Microsc. 197:173-184, 2000.
CHARACTERIZING THE INTACT MICROBE-MINERAL INTERFACE
William W. Barker and Jillian F. Banfield
Department of Geology and Geophysics
University of Wisconsin, Madison
Abstract
A predictive model for mineralogical and textural biosignatures has been developed from a descriptive model of geomicrobial influences on silicate mineral weathering by lithobiontic microbial communities. Zone 1, represented by the upper thallus of lichens, is devoid of substratum-derived minerals. In the lower thallus, physical disruption of the mineral substratum by microbial communities delineates Zone 2 (direct biochemilithic). Complex mixtures of organic polymers and secondary phases coat extensively corroded mineral surfaces. Mineral weathering reactions in Zone 3 (indirect biochemilithic) occur within spaces too small for microbes, resemble physiochemical processes, and are accelerated by soluble organic compounds. Physiochemical weathering and unaltered primary silicates characterize Zone 4. Textures defined by detrital and authigenic minerals trapped in extracellular polymers, mineralization of cell walls and sheaths, and the presence of biominerals may generate recognizable mineralogical biosignatures within Zones 1 and 2. Distinctive etch patterns of mineral surfaces may comprise mineralogical biosignatures within Zones 1, 2, and 3. Sample preparation techniques designed to preserve the morphology, antigenicity, and mineralogy of these highly hydrated and complex samples for high-resolution electron microscopy are an important tool for evaluating these materials.
Introduction
An ideal biosignature should be widespread, easily recognized, and preservable in the planetologic record. Despite the inherent necessity for biosignatures to be non-“Earth centric,” important clues may be extracted through examination of elemental, isotopic, mineralogical, and textural heterogeneities that arise due to interactions between living entities and their mineralogical environment. In the foreseeable future, time, resources, and engineering constraints will limit the search for extraterrestrial life to sites within our own solar system and to the near surface of these targets, where it is likely that organic material is scarce and the bulk of the material is mineralogical in nature. A reasonable biosignatures program must likewise address these realities.
Herein we describe the microbe-mineral environment and potential mineralogical biosignatures in the context of a model based upon electron microscopic characterization of the intact organic-inorganic interface between silicate mineral assemblages and lithobiontic microbial communities, and laboratory studies. Interactions in the rhizosphere, soils, and sediments share similarities with those at the lichen-mineral interface, so data gathered on microbe-mineral interactions in the context of mineralogical biosignature formation may apply widely.
Zone Model of Mineralogical Biosignature Formation
The lichen mineral interface, comprised of an extremely complex microbial community in contact with a limited mineral assemblage grading from fresh to deeply weathered, is an ideal microcosm for studying processes that ultimately result in mineralogical biosignatures. Based on several years of high-resolution electron microscopic characterization of the intact microbe-mineral interface and supporting laboratory investigations, we developed a descriptive model (Figure 1) of biogeochemical weathering, which we have here adapted to predict the potential for biosignature formation.32
In Zones 1 and 2 of lichens (which for the purposes of geomicro-or astrobiology are best considered biofilms), mineral particles derived from either the air (Zone 1) or the underlying rock (Zone 2) are in intimate contact with a diverse microbial community. Minerals range from almost unaltered, cleavage-bound fragments to highly corroded grains displaying etch pits on external surfaces and extensive internal porosity. In all cases, mineral fragments are coated and bound together by films composed of complex mixtures of organic polymers and secondary minerals (Figure 2).
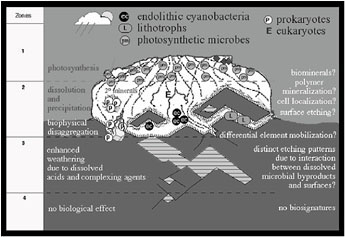
FIGURE 1. A zone model of mineralogical biosignatures.
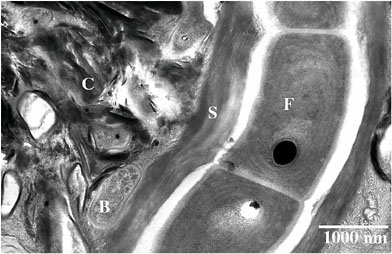
FIGURE 2. A filamentous cyanobacterium (F) inside a thick sheath (S), coccoid cells (B), and a complex mixture of nanocrystalline clays and oxyhydroxide minerals bound in extracellular polymers (C) define the complex geochemical environment of biosignature formation. High-pressure cryofixed, freeze substituted zero loss energy-filtered transmission electron microscopy micrograph of ultramicrotomed thin section.
While surface-parallel layers of adsorbed cations and water on mineral surfaces probably provide nucleation sites for clays, textures and distribution of secondary minerals also are controlled in large part by extracellular organic polymers. In addition to trapping and binding allochthonous mineral particles, these act as substrates for precipitation and affect crystallization of clays on mineral surfaces and in the polysaccharide capsules surrounding microbial cells.
Zone 3 occurs within the intact substratum beneath the lichen community and grades upward into the “direct biochemilithic zone.” However, the small size of openings precludes microbial colonization, so it is defined based upon the absence of direct contact between high molecular weight microbial polymers and mineral surfaces. While silicate mineral reactions in this zone resemble those seen in strictly physiochemical weathering, they differ from the dissolution and recrystallization mechanisms seen in Zones 1 and 2. Comparison with nearby uncolonized surfaces, which show no evidence of reaction, indicates appreciable enhancement of weathering due to downward percolation of solutions containing dissolved low molecular weight organic products, especially acids. These findings have been quantified though experimental studies. 33 Consequently, we term this the “indirect biochemilithic” zone.
A fourth “physiochemilithic” zone results from abiotic weathering. It may be found at distance from the microbe-mineral interface (as in Figure 1) or in environments where microorganisms are not present. This zone represents a standard against which mineralogical biosignatures must be measured, in part to ensure that nonbiological explanations cannot be provided for chemical and textural patterns detected.
Possible biosignatures applicable to our model identified through characterization and experimental studies of microbe-mineral interactions include the following:
-
Entrained or authigenic reaction products (e.g., clays) in extracellular polymers;
-
Mineralization of cell walls and sheaths; and
-
Crystallographically controlled etching of mineral surfaces.
Recommended Analytical Protocols
A research program in which qualitative findings from field studies of natural materials are quantitatively pursued by laboratory experiments is recommended.
Characterization of complex mixtures of nanocrystalline minerals, highly hydrated extracellular polymers of variable composition and structure, and a diverse microbial assemblage is required to understand microbe-mineral interactions leading to formation and preservation of mineralogical biosignatures. The size of the components and the scale of the heterogeneities dictate the use of high-resolution analytical scanning and transmission electron microscopy in combination with biological cytochemical methods. Specimen preparation techniques must rigorously avoid changes in colloidal chemistry, hydration state, and mineralogy, all of which drastically affect organic-mineral adsorption and, hence, textural relationships. Additionally, specimen preparation must provide superior ultrastructural and antigenic preservation while minimizing changes in elemental concentrations.
Many important characterization techniques will provide new information about processes occurring at the microbe-mineral interface. For example, elemental and valence state mapping by X-ray methods34 and surface characterization by atomic force microscopy35 appear promising.
Ultrarapid cryoimmobilization is a superior specimen preparation technique for both scanning electron microscopy (SEM) and transmission electron microscopy because it minimizes dehydration artifacts. Furthermore, fixation is instantaneous (as opposed to the tens of minutes to hours required for more conventional chemical fixation methods) and provides superior ultrastructural and antigenic preservation. The goal of all cryofixation techniques is to freeze the water component rapidly and prevent sample damage from ice crystal nucleation and growth resulting in vitreous ice.36,37 High-pressure cryofixation offers the potential for achieving this in large volumes, in some cases up to 1 mm3. The ability to produce vitreous ice conditions in samples of these dimensions makes this technique particularly useful for preserving samples containing intact microbial biofilm communities on colonized minerals. Once cryoimmobilized, samples can be stored indefinitely under liquid nitrogen and subjected to a wide variety of preparation and analytical techniques (Figure 3).
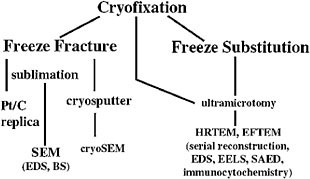
FIGURE 3. Recommended analytical flow chart for samples containing mixtures of microbes and minerals.
Given the aforementioned constraints imposed by geobiological samples, freeze substitution appears to be an extremely useful preparative method for mineralogical biosignatures research. Resultant epoxy-embedded samples are amenable to standard ultramicrotomy. Thin sections can be examined at high resolution with immunocytochemical methods and microanalytical and structural techniques appropriate for mineralogical investigation.
Freeze fracture and examination of partially freeze dried samples in a cryostage-equipped field emission gun SEM is a useful correlative technique for examining the hydrated textures and structures of extracellular polymers, expansible clays, and microorganisms. These data are necessary to better understand formation of biosignatures as a consequence of biologically induced precipitation, dissolution, enzymatic redox reactions, uptake and redistribution of nutrients and toxins, and elemental mobility arising from complexation of metal ions by organics.
Acknowledgments
This research is supported by the Department of Energy Basic Energy Sciences, the National Science Foundation, the National Aeronautics and Space Administration, and NASA's Astrobiology Institute.
SINGLE-POLYMER MODEL DETECTION USING NANOPORES
Amit Meller
Rowland Institute at Harvard
Daniel Branton
Department of Molecular and Cellular Biology
Harvard University
Abstract
The transmembrane channel created by α-hemolysin can be used to detect single linear charged molecules. Detection relies on drawing the linear molecule into the channel, thus reducing or blocking the ionic current that moves through the open pore. Translocation of the charged macromolecule through the channel is driven by a bias that is applied across the channel-containing membrane. This detection method does not rely on specific interactions between the protein pore and the translocating molecule. Rather, it is based on modulating the open pore cross section and depends on the “bulkiness” of the linear molecule. Information about the exact chemical composition of the molecules is not required to perform the measurements. Therefore, this method may lend itself to general use with a broad spectrum of uncharacterized materials. We have shown that different types of DNA molecules can be discriminated based on the blockade level and duration they produce when forced to translocate through our pore. Although the basic mechanism responsible for the translocation process and the resulting blockade level is not fully understood, we think that these measurements constitute the first step toward a fast and low-cost polymer characterization method.
Introduction
The genetic code of the form of life we are familiar with is stored in DNA molecules. By analogy to computers, we can think of DNA as the “media” used for code storage. When we speak about new life forms we may ask for alternative or analogue media to the familiar DNA. Although the existence of “alternatives” remains unknown, we can nonetheless conceive suitable tools to examine unfamiliar genetic material. When developing these tools one would face two fundamental requirements: First, since we may encounter situations where only small samples of the material under test will be available, our detection method should be able to resolve single molecules. Second, we would require a generic detection method that does not rely on particular enzymatic reactions but rather relies on more general properties of the molecule such as its bulkiness or local density. For example, the common modern techniques used for DNA sequencing make use of a particular set of nucleotides and rely on specific interaction between these molecules and enzymes.38 This chemistry may or may not be compatible with the new genetic material we will need to probe.
We have recently developed a novel single-molecule DNA or RNA detection method that does not rely on specific interactions or chemistry. We have shown that DNA and RNA molecules can be probed by monitoring the ionic current blockade they produce as they are drawn through a narrow pore.39,40 We embed a single α-hemolysin pore from Staphylococcus aureus in a lipid bilayer that separates two small containers. The inner dimension of the self-assembled α-hemolysin channel is comparable with the typical cross section of polynucleotides. The pore allows free motion of small electrolytes that are present in the buffer solution. Charged molecules such as DNA or RNA are drawn through the channel under the influence of an external electric field (see Figure 1a). When a single polynucleotide molecule enters the pores it blocks most of the otherwise unper-turbed ionic current, thus signaling its presence in the pore.
Our method makes use of sensitive ionic current measurements. We use a commercial patch-clamp electrometer to apply a constant electric field across the membrane and measure the resulting current. When a DNA molecule enters our pore the current drops from its initial (“open pore”) value of about 116 pA (at 120 mV applied voltage, KCl concentration of 1 M, and 22.0°C) to about 14 pA (see Figure 1b). The current is restored to its initial value when the molecule exits from the pore. We define the translocation time duration, tD , as the time that the signal stays at its lower state. We have found that tD is proportional to the linear length of the probed molecule.
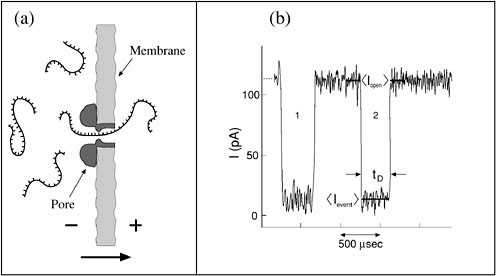
FIGURE 1. (a) Schematic view of the nanopore detection method. The nanopore is embedded in a membrane separating two small containers filled with electrolyte solution. Charged polymers such as DNA are drawn through the pore under the influence of an electric field. The arrow indicates the translocation direction. (b) Typical current trace showing two DNA translocation events when a 120-mV gradient is applied across a membrane containing the α-hemolysin channel. For each event, we measured the translocation duration, tT, and the normalized blockade level defined as
The fractional blockade level, IB, is defined as the ratio of the average current at the translocation period to the average open pore current. We have found that tD and IB may be used to discriminate different types of DNA molecule “on the fly.”
Polynucleotides Discrimination
To illustrate the capability of our system to discriminate single polynucleotides we characterized the blockade signals produced as homopolymers containing cytosines (poly(dC)100) or adenines (poly(dA)100) translocated through an α-hemolysin channel. Each DNA molecule was characterized by the duration of the blockade it produced, tD, and the average blockade current, IB. These parameters were plotted on an event diagram in which each point represents a single translocation event (Figure 2a and the corresponding histograms on Figures 2b and 2c). The most prominent features of these plots are the following:
-
The events corresponding to the two polymers, each cluster in well-separated regions; less than 1 percent of the poly(dA)100 events fall in the poly(dC)100 region and vice versa. Thus, discrimination between the two polymer types is readily achieved.
-
The poly(dA)100 events separate into two groups. So too do the poly(dC)100 events, albeit the separation into two groups is not as clear for poly(dC)100 as it is for poly(dA)100. The two groups are evident as two peaks in the current histograms for each polymer type (Figure 2b).
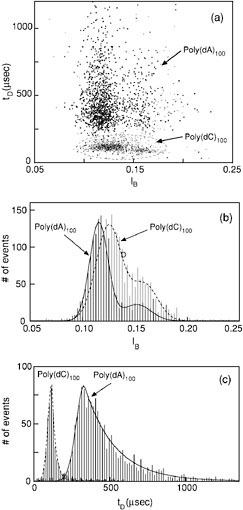
FIGURE 2. (a) Event diagram showing translocation duration versus blockade level for poly(dA)100 (heavy markers) and poly(dC)100 (light markers). The two polymers were examined separately. The poly(dC)100 events were circled by a dashed line for clarity. Each point on this diagram represents the translocation of a single molecule that was characterized by its translocation duration, tD, and blockade current, IB. (b) Current histogram projected from the above event diagram for the poly(dA)100 events (solid line) and the poly(dC)100 events (dashed line). The two peaks corresponding to the two groups of events are denoted by IP1 and IP2. The lines are fits of the data to a sum of two Gaussian distributions. (c) Duration histogram projected from (a) for the first group of events. Note the well-defined peak locations of 120 µsec for the poly(dC)100 and 330 µsec for the poly(dA)100 events. At times longer than the peak time, tP, the distribution decays exponentially. The longer exponential decay corresponding to the poly(dA)100 events reflects their larger temporal dispersion compared with the poly(dC)100 events.
-
Histograms of group 1 translocation durations exhibit a clear peak which we define as tP. The separation between the peaks corresponding to the two polymer types is large: 330 µsec for poly(dA)100 and 120 µsec for poly(dC)100.
Mixed polymers containing adenines and cytosines as well as thymines were tested in a similar way. Together the IP, tP, and τT values unambiguously characterizes each of the polymer types.41 They can provide a simple tool for rapidly discriminating between the different populations. To demonstrate discrimination between individual polymer molecules, albeit for the best case reported here, we mixed a sample of poly(dA)100 with a sample of poly(dC)100 and performed translocation experiments similar to those described above.
A simple computer algorithm that made use of a probability distribution function derived from Figure 2c was used to estimate the probability that each successive event is a molecule of poly(dA)100 or poly(dC)100 (Figure 3). As expected, more than 98 percent of the events are assigned to either poly(dA) or poly(dC) with probabilities larger than .90. Preliminary experiments show that algorithms that take into account the other parameters will make it possible to discriminate between other types of polynucleotides mixtures.
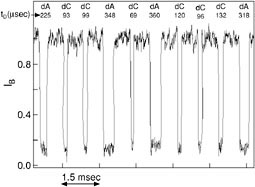
FIGURE 3. Representative current trace showing 10 events recorded from a mixture of equal molar concentration of poly(dA)100 and poly(dC)100. The time between events is truncated. The individual events are identified, on the basis of tD alone, as traversal of either the poly(dA)100 or the poly(dC)100 molecule (Meller et al.42), in real time.
We have found that temperature has a strong, nonlinear, effect on the translocation duration. At low temperatures the translocation process is slowed down dramatically. Although further investigation is needed to fully understand this behavior, this finding explains why unambiguous detection and characterization of much shorter DNA molecules (down to 4-mers)43 is possible at low temperatures. The ratio between the translocation duration times of different polymer types is also extended at lower temperatures, allowing easier discrimination between several polymer types in the same sample.
Probing Foreign Groups on DNA Molecules
As discussed earlier, the electrical current and translocation time measurements are expected to be sensitive to the bulkiness of the probed molecule. This feature may be used to detect “foreign” or irregular groups attached on individual DNA molecules. To test this idea, we prepared 50-base-long single-stranded DNA molecules that were “decorated” with two bulk groups: the first at position 25 from the molecule 's 5'-end and the second at position 37. Figure 4 shows two typical current traces corresponding to the translocation of two such molecules. In each of the
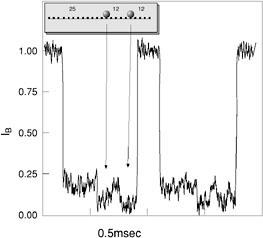
FIGURE 4. Typical current traces recorded from 50-mer DNA molecules each labeled with two bulk groups at positions 25 and 37 from the 5'-end. In this experiment, more than 85 percent of the events showed a clear two dips in the current from the initial plateau at around 18 percent, corresponding to the additional blockades caused by the extra groups.
traces the current initially drops to about 18 percent of the open pore current, followed by an additional two drops to about 5 percent corresponding to the location of the two bulk groups on the molecules. Between the two drops, the blockade current goes up to the initial blocked level of about 18 percent. Out of about 700 molecules in this experiment, more than 85 percent showed this pattern suggesting a relatively high fidelity of our detection method.
Conclusions
A nanopore makes it possible to record the coincident observation of several independent parameters (e.g., IB and tD) upon traversal of a single molecule. Experimental work suggests that a nanopore can discriminate between several different polynucleotides of similar length on the basis of three well-defined statistical parameters: (1) the current peak, IP; (2) the translocation duration peak, tP; and (3) the temporal dispersion of individual events, represented by τT. Furthermore, in a favorable case, measurement of just one parameter, tD, makes it possible to discriminate between individual polynucleotides on a molecule-by-molecule basis.
We have shown that the current trace can be further modulated by the addition of bulk groups on the tested polymers. Our detection method is not limited by the requirement of having specific interaction between the tested molecules and the nanopore. Thus, other types of charged polymers such as DNA analogues can be tested. Although our present detection resolution is limited by the given geometry of the α-hemolysin pore, our results provide an initial proof of the underlying concepts. Attempts to make artificial silicone-based nanopores with a controlled geometry are already under way. We expect that these types of nanopores will provide the basis for a more robust nanopore device capable of detecting any polymer-based life form.
Acknowledgments
This research was supported by Defense Advanced Research Projects Agency (DARPA) award N65236-981-5407. We would like to acknowledge Dr. Charles R. Cantor for financial support (DARPA contract number N65236-98-1-5410) and the Rowland Institute at Harvard.
EXTANT LIFE DETECTION USING STABLE ISOTOPES AND PROTEIN-CHIP TECHNOLOGY
Marilyn L. Fogel
Geophysical Laboratory
Carnegie Institution of Washington
Abstract
Stable isotopes are used in geological studies to distinguish processes that have occurred under the influence of biological as opposed to geological processes. They are therefore a potentially valuable signature of the past or present existence of life in extraterrestrial samples. To reliably use stable isotopes as tools for finding the signatures of life on other planetary bodies, it is important to know whether biological isotopic signatures survive on geologic time scales. Crucial for linking the isotopic patterns seen in ancient Earth rocks to those in modern ecosystems is a systematic study of the alterations in the primary isotopic signal as organic matter enters the geologic record. ProteinChip analysis is a promising approach to providing the type of data needed to link the biochemical inventory with the biogeochemical record on Earth, and its development is described here.
Introduction
Stable isotopes at the natural abundance levels in living organisms or geological materials are among the most effective means for studying biochemical and ecosystem processes on Earth. The methodology, background principles, and applications are well established; however, this is a very active area of research with new methodology, broader principles, and new applications emerging at a logarithmic pace. Almost all Earth science departments have stable isotope ratio mass spectrometers, the necessary analytical equipment for undertaking studies in rocks, carbonate fossils, or other geological materials. In recent years, owing to the development and marketing of stable isotope instrumentation that can be largely automated, the technology is becoming an integral part of most ecological and biological studies. Many of Earth's major ecosystems have been studied isotopically, although as in any field, golden opportunities for discovery still remain (Table 1). For example, while igneous rock and the
TABLE 1. Applications of Stable Isotopes for Studying Biological Processes
|
Carbon |
13C/12C |
Photosynthesis Methanogenesis Central metabolism Biochemical fractions |
|
Nitrogen |
15N/14N |
Biochemical fractions Nitrogen fixation Denitrification Ammonification |
|
Oxygen |
18O/16O |
Photosynthesis Environmental conditions |
|
Hydrogen |
D/H |
Photosynthesis Biochemical fractions Methanogenesis Hydrological cycle |
|
Sulfur |
33, 34, 36S/32S |
Sulfate reduction Sulfur oxidation Redox conditions Biochemical fractions |
leaves of plants have been studied for almost 50 years, there is almost nothing known about the isotope systematics of the Archae or the Fungi. Research into the isotopic behavior in microbes and their remains in the fossil record is one of the active areas of research in astrobiology.
In contrast to the richness in studies of stable isotopes in living organisms, an inventory of the proteins and enzymes responsible for isotopic partitioning is at an early stage of a new pulse of active growth. Gel electrophoresis, the separation of molecules based on molecular weight and charge by applying an electrical field to a gel containing a mixture of proteins, has been the principal tool for protein biochemical studies. Two-dimensional gel electrophoresis involves combining two different electrical fields in subsequent analyses to completely separate the complex array of molecules in living organisms. The analyses are difficult to quantify exactly; they are time consuming; and most importantly, the final results and comparisons of one protein pattern relative to another rely on converting the pattern on a gel to a digital image. Thus, it is difficult to compare very complex protein patterns from one organism to the next to determine which, if any, of the proteins are unique. New technology has emerged that is capable of rapidly determining the protein inventory, or proteomics, of a biological material sensitively, quantitatively, and quickly. Studies on genomics, the inventory of an organism's complete genetic code, are the impetus for studies on the genetically expressed products, the proteins.
The goal of the workshop was to describe Earth-based methods for detecting life that might be adapted to search for life elsewhere in the universe. Stable isotopes are commonly used in geological studies to distinguish processes that have occurred under the influence of biological versus geological processes. The extraterrestrial materials that we have in hand today include meteorites and Moon rocks, which have been extensively examined for stable isotope systematics and compared to those of rocks on Earth. For detecting extant or extinct life on Earth, interpretations of stable isotope analyses are based on what we do know about biochemistry versus geochemistry versus astrochemistry (Tables 2 and 3). Beyond the general classification of bio-, geo-, and astro-, there is the distinction of ecology, which is one of the strongest signatures of extant life. Living organisms never live in isolation and they almost always leave some trace of their activity on the environment. An effective strategy for studying the biosignatures of extant life on any planetary body would be a combination of detailed sampling of individual specimens with broader spatial and temporal coverage to detect gradients driven by biological reactions or fluctuations indicative of metabolic activity.
TABLE 2. Isotopic Fractionation Comparisons
|
BIOCHEMICAL PROCESSES |
GEOCHEMICAL PROCESSES |
|
Large isotope fractionations |
Smaller isotope fractionations |
|
Out of equilibrium |
Equilibrium |
|
Associated with |
Associated with |
|
Specific biochemicals |
Graphite or reduced C |
|
Cellular remains |
Absence of cellular evidence |
|
Regulated |
Random |
TABLE 3. Isotopic Fractionation Comparisons Between Biochemical and Astrochemical Processes
|
BIOCHEMICAL |
ASTROCHEMICAL |
|
Fractionations based on kinetic principles |
Fractionations based on many principles |
|
Moderate temperatures |
Radical temperatures |
|
Minimum −50°C |
Extreme lows 50 K |
|
Maximum 200°C |
Extreme highs 2000 K |
|
Higher molecular weight biochemicals |
Smaller, random polymers |
|
Moderate range of isotopic compositions |
Extreme range in isotopic compositions |
Isotopic measurements are determined on increasingly smaller amounts of material on more compact and sensitive instruments. Compound-specific isotopic analysis, for example, allows us to interrogate the isotopic composition of just a few nanograms of almost any individual molecule that can be processed through a gas chromatograph. On the alternate side, almost any material, rock fragment, soil, sediment, or fossil can be reacted in high-temperature furnaces interfaced to isotope ratio mass spectrometers for analyzing as little as 2-5 µg of C, N, O, or H. As the isotopic ratio is generated, elemental data can be acquired as well, which is one of the most common applications of stable isotope technology for studying modern ecosystem processes. Living organisms have elemental ratios of C:N:P and %H and %O levels that are consistent with the distributions of the major biochemicals in the organism. For example, any organism such as a bacterium contains 50 percent of its dry biomass in the form of proteins, composed of nitrogen-rich amino acids. Plant material on the other hand is principally composed of cellulose, which contains no nitrogen. The ratio of C:N in bacteria is 3, but in plants it is 25-60. Thus, a measurement of elemental abundance (nature of organism) linked to a stable isotope measurement (biological process) can be used to assemble a quick snapshot of extant life.
While it is important to study the stable isotope compositions and fractionations in living organisms as tools for finding signatures of life on other planetary bodies, it is equally important to know whether biological isotopic signals survive on geological time scales. We can surmise from the genetic record that many of the biological processes that occur today were important on early Earth. In fact, projections of the origins of life and/or specific biochemical reactions (e.g., photosynthesis) have been based principally on the stable isotope record. Compound-specific isotopic analyses of lipids at the Precambrian-Cambrian boundary have provided an even more complex, if not controversial, picture of the ecology of the ocean at that time.44 One of the critical elements for linking the isotopic patterns in these ancient rocks to modern ecosystems, therefore, is a systematic study of the alterations in the primary isotopic signal as organic matter enters the geological record. Ziegler and Fogel have shown that heterotrophic bacteria living on photosynthetically derived protein alter the compound-specific isotopic profile during metabolism (Figure 1).45 The change in the photosynthetic isotopic biosignature to the microbial isotopic biosignature at the compound-specific level of analysis is a reminder that a broader suite of isotopic measurements (e.g., bulk isotopes and compound-specific isotopes) on planetary samples is important.
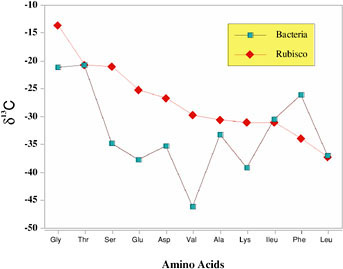
FIGURE 1. Carbon isotopic compositions of the photosynthetic protein, Rubisco, and the heterotrophic microorganisms that consumed the protein. Note that a majority of the compound-specific signals have changed in the amino acids of the bacteria.
Compound-specific isotopic analyses, therefore, can go only so far in providing diagnostic, specific signals of biological activity. A second step is to examine isotopic biosignatures in specific high molecular weight biochemicals, for example, cellular membranes, specific proteins, or isolated mRNA. Biological molecules at this level relate directly to certain types of organisms and their metabolic processes. Very sensitive techniques for identifying these biochemical molecules in biological and environmental samples are being developed.46,47 Characterization of the protein inventory by chip technology might provide the type of data needed to link the biochemical inventory with the biogeochemical record.
The basic principle of ProteinChip analysis (Ciphergen Biosystems) is the development of specially modified surfaces that serve as “bait” for trapping organic molecules out of complex mixtures (Figure 2). Once molecules are selectively bound to the surface of the chip, they are desorbed and analyzed by time-of-flight mass spectrometry, which is capable of resolving 1 dalton in molecular weight in a molecule that may be as large as 100,000 daltons. The molecular weights of molecules that are desorbed by laser energy are then stored digitally, and the patterns of their molecular weights can be compared to what is expected from genome analyses. Each protein coded for by a gene has a specific molecular weight, based on the linear structure of the amino acids of the protein. Often, after the genetic information is translated into a specific protein, further biochemical reactions modify the protein either for increased catalysis or for stability. These small but important changes in protein biochemistry, posttranslational modifications, cannot be detected purely by genomic analysis.
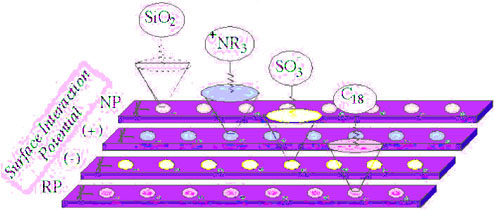
FIGURE 2. Diagram of surface enhancements of the ProteinChip system designed by Ciphergen Biosystems.
Advantages of using the ProteinChip technology include the need for only a few microliters of sample in liquid. The instrumentation is capable of detecting femtomoles of organic matter, theoretically a single molecule. Because the molecules are captured on an enhanced surface, rather than in a matrix, biochemical manipulations can be performed on the molecules on the chip's surface. For example, microbial cell walls have been shown to be highly stable components that are important for deriving a principal component of the ocean's dissolved carbon
pool.48 These analyses are based on monomeric structural signatures of amino acids and specific sugar analyses. ProteinChip analyses of these samples give the intact molecular weight distribution, a complex pattern that can be related to the presence of microbial cell wall structures (Figure 3). To confirm the presence of cell wall material, lysozyme—the enzyme that breaks down the peptidoglycan cell wall—could be used on the surface of the chip to break the higher molecular weight materials down into smaller fragments.
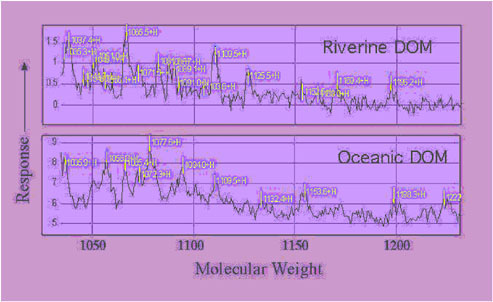
FIGURE 3. Analysis of dissolved organic matter (DOM) by the ProteinChip instrument. The samples are from two very different locations, a riverine environment and the deep ocean. There were 14 peaks in these samples that had identical molecular weights. The material has resisted chemical identification by other conventional analyses, such as gas chromatography-mass spectrometry. On this graph, it can be seen that there are numerous molecules in the molecular weight region greater than 1,000 and less than 1,200. Peptidoglycan units, the backbones of microbial cell walls, have molecular weights in this range. Many of the peaks correspond to degraded fragments of the original peptidoglycan molecule.
Currently, this technology is being used to look for biomarkers in cancer research or to detect the action of a drug treatment on a patient's metabolism. The search for one or two diagnostic molecules in a field of others is accomplished by comparing the spectral data from one tissue (e.g., precancerous) with that from another (e.g., cancerous). The application of this technology to the field of astrobiology is just beginning. The proteins of microorganisms grown in cultures will be studied and compared with environmental samples in which these organisms are known to occur. It should be possible by comparison of the complex spectra to find molecules that are similar in cultures and in the environment, and to relate these molecules to a specific protein structure. The integrative goal will be to connect the dots between specific protein molecules and stable isotopic analyses of these compounds. The chip technology is not limited to the study of well-defined proteins. With modification to the surface environment, perhaps the molecules absorbing the laser energy, and the laser intensity, it should be possible to examine a wider range of organic compounds.
Summary
Stable isotope analyses are advancing to include a wider range of isotopes at smaller and smaller scales and amounts. The instrumentation is increasingly automated and becoming miniaturized. The challenges to the field in the next decade include adapting the technique to spaceflight and to other chromatographic links (e.g., routine liquid chromatography-isotope ratio monitoring). The community is at the start of introducing compound-specific analyses of molecules other than those containing carbon,49 which should open new avenues for isotopic bio-signature development. Because stable isotope technology is so widespread in the community, it will be an important tool for detecting biological signatures in any returned planetary sample. ProteinChip technology is a wide-open field for microbial profiling,50 environmental sampling, and geochemical analysis. The technology is changing rapidly as new innovations in nanotechnology are developed and incorporated. Future research in stable isotopes at the molecular level, coupled to molecular fingerprinting of biochemical molecules in the geological record, should provide a new level of biosignature for the search for extant or extinct life on other planets.
IRON BIOMINERALS AS BIOMARKERS
Joseph L. Kirschvink
Division of Geological and Planetary Sciences
California Institute of Technology
Abstract
Because iron is an essential trace element in virtually all living organisms, the low solubility of Fe3+ in most aerobic environments on Earth has driven the evolution of a wide variety of iron acquisition and storage mechanisms. Many of these involve precipitation of iron in the form of well-ordered biominerals, including ferrihydrite, magnetite, goethite, and lepidocrocite. Of these, biogenic magnetite in the magnetotactic bacteria shows one of the clearest fingerprints of natural selection, particularly adapting to perfect its role as a “biological bar magnet.” Magnetofossils, the fossil remains of bacterial magnetosomes, have been studied extensively for the past 20 years, primarily because of their importance to the field of paleomagnetism. In sedimentary materials from Earth, magnetofossils have been accepted without controversy as unambiguous biomarkers. Their presence in materials returned from Mars or Europa would provide strong support for life in those places.
Introduction
Chemical energy in the form of oxidation-reduction pairs is a central component of all life on Earth, and organisms have been surprisingly adept at exploiting energy-yielding reactions.51 Frequently, the redox reactions utilized by microorganisms result in the precipitation of inorganic mineral phases. Examples include elemental sulfur, manganese oxides, and various iron oxides.52 Often these mineral phases prove to be the most enduring traces of past microbial life, leaving unambiguous biosignatures. Iron is one of the major elements on planetary surfaces (including Earth) and particularly Mars (~20 atomic percent). The geochemical cycle of iron, and particularly the derived iron phases, is strongly coupled to the chemistry of biogenic elements, H, C, O, and S. As one of the best oxidation-reduction agents available, it is not surprising that the Fe2+/Fe3+ cycle has a central role in some of the most primitive metabolic pathways known (e.g., the cytochrome system). As Rudyard Kipling noted, “Iron, cold iron, is master of them all!”
On the Archaean Earth, geochemical evidence supports strongly the idea that the bulk of the oceans and atmosphere were reducing environments. 53 Under these conditions, Fe2+ remains in solution and is easily available for biological use. However, after the Paleoproterozoic Snowball Earth event about 2.4 billion years ago,54,55 all geological evidence points to the presence of more oxygen-rich conditions at the surface.56 At this time, iron must have become a limiting resource, forcing the evolution of acquisition and storage mechanisms. For a motile bacterium capable of moving across the redox boundary in a vertically stratified system, natural selection could favor the gathering of iron in the anaerobic zone, and storing it for use when it is needed to function in an aerobic environment. As noted next, this need for iron storage probably resulted in the first bioprecipitation of the mineral magnetite (Fe3O4).
Magnetite Biomineralization
Most iron in living tissues is stored in the form of the mineral ferrihydrite (basically, a hydrated mineral with a hematite-like structure) in the core of the iron storage protein ferritin.57 However, aggregations of ferric iron, in the presence of phospholipids and in moderately reducing conditions, can reduce spontaneously to magnetite.58 In the presence of a local or planetary magnetic field with a strength comparable to that of Earth, natural selection for magnetotaxis provides an obvious mechanism for perfecting magnetite's role as a biological bar magnet.59-61 In the process, it also yields a definitive set of biomarkers.
Magnetotactic bacteria are the simplest organisms known to contain biogenic magnetite,62,63 a typical example of which is shown in Figure 1. They precipitate individual submicron-sized magnetite crystals within an
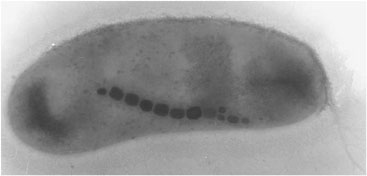
FIGURE 1. A typical magnetotactic bacterium. The individual crystals are ~50 nm in size and composed of pure magnetite (Fe3O4).
intracellular phospholipid membrane vacuole, forming structures termed “magnetosomes.”64,65 The presence of lipid-bilayer membranes demonstrates that magnetosomes are proper organelles, and their alignment in linear chains will maximize the net magnetic moment of the individual cells. These are “Nature's biological compasses,” and natural selection has perfected the size, shape, composition, crystallographic orientation, and ultrastructure of individual crystals within the cells in order to enhance their magnetic properties.66 Chains of these magnetosomes act as simple compass needles that passively torque the bacterial cells into alignment with Earth's magnetic field and allow them to seek the microaerophilic zone at the mud-water interface of most natural aqueous environments. These bacteria swim to the magnetic north in the Northern Hemisphere,67 to the magnetic south in the Southern Hemisphere,68,69 and both ways on the geomagnetic equator.70,71 Magnetosomes have also been found in eukaryotic magnetotactic algae, with each cell containing several thousand crystals.72Figure 2 illustrates in schematic
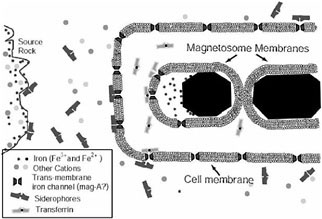
FIGURE 2. Schematic illustration of the typical iron uptake and purification process in a magnetotactic bacterium. Iron in the environment is bound selectively by a variety of siderophores, transported actively into the cell via specialized transmembrane iron receptors (often accompanied by oxidation-reduction activity), and eventually dumped into a preformed magnetosome membrane. The shape of the membrane vesicle limits diffusion to specific surfaces of the growing crystallites, allowing the particles to assume specific shapes, as well as producing a sharp size distribution.
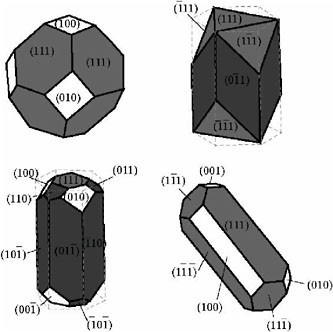
FIGURE 3. Typical morphologies found in natural populations of magnetotactic bacteria. Only the cubo-octahedral form shown on the upper left is commonly found in natural systems. Elongation of the other forms involves breaking of the cubic crystal symmetry of magnetite. For nanometer-size crystals, the surface free energy is quite high compared with the energy of formation, and the minimum energy configuration favors an equant crystal. Elongation of these particles involves breaking symmetry rules. In the upper right particle (similar to strain MV-1 and the ALH84001 prismatic fraction), the particle is elongated along only one of four possible (111) directions, which are all chemically equivalent. The magnetosome membrane (Figure 2) stops diffusion to the (011) and equivalent faces by simply blocking ionic access to them. (Adapted from S. Mann, N.H.C. Sparks, and V.J. Wade, “Crystallochemical Control of Iron Oxide Biominerals,” in Iron Biomineralization, R.B. Frankel and R.P. Blakemore (eds.), Plenum Press, New York, 1991, p. 435.)
form the process by which these bacteria form magnetosomes, and Figure 3 illustrates typical magnetosome morphologies.
Inorganic magnetites are usually small octahedral crystals, often with lattice dislocations, chemical impurities, and other crystal defects. In contrast, magnetite crystals formed within these magnetosome vesicles have five main features that serve to distinguish them from magnetites formed through geological processes: (1) High-resolution transmission electron microscopy (HRTEM) studies reveal that bacterial magnetites are nearly perfect crystals, which (2) have unusual crystal morphologies. They (3) are usually elongate in the (111) crystal direction,73-76 (4) are chemically quite pure Fe3O4, and (5) are of just the right size and shape to be single domains, requiring restricted anisotropic width-length ratios. The elongation of biogenic crystals in the (111) direction serves to stabilize the magnetic moment of the particle and presumably is the result of natural selection for their magnetic properties.77,78 It may also be the passive effect of the growth of individual crystallites in the strong
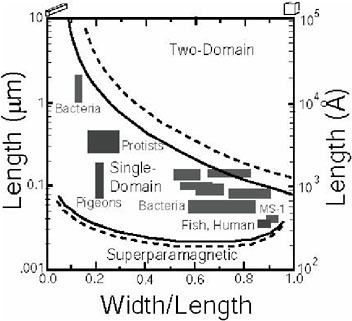
FIGURE 4. Experimentally and theoretically determined size and shape requirements for the production of magnetic singledomain particles in pure magnetite parallelipipeds. Particles in the single-domain field are uniformly and permanently magnetized, perfect little bar magnets. In smaller particles, thermal agitation will cause the magnetic moment of the crystals to wander relative to the particle, yielding “superparamagnetic” behavior. Larger particles will break down into regions of multiple domains. The moments will cancel, reducing the magnetization of the particle. Interparticle interactions will slightly stabilize the single-domain field, as indicated by the dashed lines. Natural selection for magnetotaxis or magnetoreception will yield single-domain crystals.
magnetic field at the end of a magnetosome.79 As shown in Figure 4, bacterial magnetite crystals are restricted to a size range from 35 to about 500 nm, with shapes that confine them to the single-domain magnetic stability field.80,81 Inorganic magnetites tend to have log-normal size distributions that often spill up into the multidomain size region; this arises from fundamental inorganic growth principles.82 Bacterial magnetites tend to be rather pure iron oxide, with no detectable titanium, chromium, or aluminum, which are often present in geologically produced magnetite. This is presumably due to the biopurification processes produced by the iron-specific binding and transport proteins shown in Figure 2. An additional feature is the alignment of the crystals into linear chains, which can often be preserved in the fossil record.83,84 The Venn diagram of Figure 5 summarizes these features.
In higher animals, an obvious function for magnetite biomineralization is its role in magnetoreception.85-87 Magnetoreception is now well established in virtually all major groups of animals,88 and specialized cells containing single-domain chains of magnetite are the best candidates for the receptor cells.89,90 In the brown trout, Walker et al. have shown elegantly that magnetically sensitive nerves in the ophthalmic branch of the trigeminal nerve connect to specialized, trilobed cells in the olfactory laminae that contain magnetite crystals.91 More recently, they have used magnetic force microscopy (MFM) and confocal techniques both to image the magnetic field of these receptors and to identify the neural processes that connect the magnetoreceptor cells to the nervous system.92
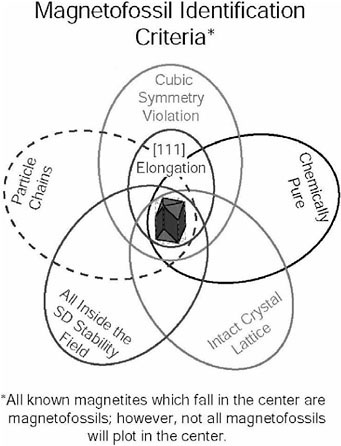
FIGURE 5. Venn diagram summary of the criteria used for identification of intracellularly produced biogenic magnetite. These criteria include unusual crystal morphology (e.g., elongated hexagonal prismatic magnetite with faceted ends produced by magnetotactic bacteria strain MV-1); chemically pure composition; an intact crystal lattice that is relatively free of defects (though it may occasionally have (111) twinned crystals); restricted width-length ratios and volumes that place the crystals in the single-domain stability field; and occurrence in chains that maximize the magnetic moments of the magnetite crystals. Although bacterial magnetite crystals produced by some common strains (e.g., equant cubo-octahedra crystals of Magneto-sprillum magnetotacticum) fall outside the central area of the diagram, no inorganically produced population of magnetite crystals has yet been found that inhabits this central region. With the exception of particles in chains, elongated prismatic magnetite crystals in ALH84001 meet all other criteria and thus fall within the central region of this diagram.
Similarly, behavioral work with honeybees and birds has shown that brief magnetic pulses are able to alter the magnetic responses, confirming that a ferromagnetic material such as magnetite is indeed part of the magnetic sensory system.93−99
Magnetofossils as Biomarkers
The distinctive features of magnetosomes outlined in Figure 5 have enabled bacterially precipitated magnetites (dubbed “magnetofossils”100) to be identified in earthly sediments up to 2 billion years old. 101 Because of natural selection, these bacterial magnetofossils are as clearly and uniquely biogenic as are the teeth or skulls from a vertebrate. There has never been a controversy with their recognition in earthly sediments, despite a 20-year history of investigation. 102-120 Many of the bacterial magnetite crystals are simply not found anywhere outside of the biosphere. Chemists working in the ferrite industry (which makes magnetic particles for recording tape, disk drives, etc.) have failed consistently for the past 50 years to produce synthetic magnetite crystals with a similar set of properties. They have failed for very good reason: they cannot duplicate the microenvironment of the bacterial magnetosome membrane. They cannot contain magnetite to stay within its single-domain stability field (Figure 4) and produce the (111) elongated morphology, which is rather peculiar for a cubic mineral. These properties are the end result of natural selection for magnetic properties of the magnetite crystals, and they are a unique biological fingerprint.
Discussion: Martian Magnetofossils in ALH84001 Carbonates?
Among their original arguments for ancient life on Mars, McKay et al. noted the similarity between some of the fine-grained magnetite in the carbonate blebs and those of the magnetotactic bacteria.121 Unlike the other lines of evidence cited in support of their claim for ancient martian life, subsequent examination (by HRTEM) of the ALH84001 magnetites have strengthened the magnetofossil hypothesis considerably. In an extraordinarily thorough paper, Thomas-Keprta et al. summarize the crystallographic measurements on nearly 600 magnetite particles extracted from the carbonate globules, comparing them with similar measurements from biogenic and inorganic magnetites. 122 Approximately 27 percent of the ALH84001 crystals have an elongated, chemically pure hexagonal prismatic morphology that is identical to bacterial strain MV-1. These particles have simply not been found anywhere outside of the biosphere. Since the carbonate blebs that contain the magnetite crystals are ~4.0 billion years old,123 these putative magnetofossils predate the oldest terrestrial fossils by 500 million years. Their presence in the ALH84001 carbonates is therefore as solid evidence as any fossil materials could provide for the past existence of life on Mars.
Weiss et al. have shown that ALH84001 traveled from Mars to Earth without ever experiencing temperatures as high as 40°C.124 Hence, martian life would have had ample opportunity to reach Earth through a natural process. Magnetotactic bacteria may have evolved first on Mars at least 4 billion years ago and only established themselves on Earth via the process of meteorite seeding (Panspermia) when suitably oxidizing conditions were produced after the Paleoproterozoic snowball event.125 This line of reasoning argues that the genes that control magnetite biomineralization in animals could be of martian origin.
Acknowledgments
This work was supported in part by the NASA Astrobiology Institute, and Tim Raub made helpful comments on the manuscript.
TIME-OF-FLIGHT MASS SPECTROMETERS: MINIATURIZED INSTRUMENTS WITH A BIOLOGICAL MASS RANGE
Robert J. Cotter
Middle Atlantic Mass Spectrometry Laboratory
Johns Hopkins University School of Medicine
Abstract
While many types of mass spectrometers are used for the analysis of molecules from living species, time-offlight (TOF) mass spectrometers are unique in their ability to provide high mass range when miniaturized. Thus there is considerable interest in their use for the detection of biomarkers, both those that might be used to identify biological threat agents and those that would indicate the presence of life.
Introduction
Mass spectrometers have been used for a number of years to determine the chemical structures of simple (and volatile) organic compounds. In recent years, new ionization, mass-analysis, and other instrumental techniques have made it possible to analyze more complex biological structures, including peptides and proteins, complex carbohydrates, glycolipids, and DNA or RNA. In particular, two techniques: matrix-assisted laser desorption and ionization (MALDI) and electrospray ionization (ESI) provide the capability for ionizing these complex and generally nonvolatile molecules. And the resulting ions are then analyzed on time-of-flight, quadrupole ion trap (IT), and Fourier transform ion cyclotron resonance (FT-ICR) mass spectrometers that have very high mass range and sensitivity.
Mass spectrometers have been found in space applications where they have been used to measure atmospheric species and small organic compounds. A double-focusing (electric and magnetic sector) mass spectrometer developed by A.L. Nier for the Viking I mission to Mars launched on August 20, 1975, was used to measure the concentration of species in the Mars atmosphere and had a mass range of 49 daltons. In addition, a gas chromatograph-mass spectrometer (GC-MS) developed by Klaus Biemann, with a mass range from 12 to 200 daltons, was used on the Viking lander to measure volatile species on the martian surface. The Cassini Mission to Saturn includes an ion and neutral mass spectrometer (INMS) composed of a quadrupole mass analyzer. Recently, Richard Zare and others have used multiphoton ionization and TOF mass spectrometry to selectively ionize and mass-analyze polyaromatic hydrocarbons (PAHs) from an interior fracture surface of the ALH84001 martian meteorite located in Antarctica. Also, Luann Becker and coworkers have analyzed trapped noble gases in fullerenes found in the 4.6-billion-year-old Allende meteorite.
Nearly every type of mass analyzer has been miniaturized. Recently, Jorge Diaz at the University of Minnesota has developed a subminiature double-focusing mass spectrometer with crossed electric and magnetic fields and a radius of curvature of 2 cm. The instrument has a mass range of 103 daltons and a mass resolution of one part in 106. At the Jet Propulsion Laboratory, Mahadeva P. Sinha has developed a miniaturized sector mass spectrometer with a focal plane detector, while at the Lawrence Livermore National Laboratories, Dan Dietrich and Mari Prieto have developed a miniaturized (15-inch) FT-ICR mass spectrometer. Ion traps are generally small mass analyzers; however, R. Graham Cooks and others at Purdue University have developed ion traps with a simplified 2.5-mm-diameter cylindrical ion trap geometry. These traps can then be assembled in arrays, with different portions of the mass range assigned to each of the traps. J. Michael Ramsey and William B. Whitten at Oak Ridge National Laboratories have developed ion traps with a radius of 0.5 mm, while Ferran Scientific in San Diego, California, has introduced bundled quadrupole mass filters known as micropole arrays.
Time-of-flight mass spectrometers have also been miniaturized. Kore technology offers an electron impact (EI) ionization instrument in a suitcase for detecting and identifying volatile and semivolatile organics. The Applied Physics Laboratory of the Johns Hopkins University, in collaboration with the Defense Advanced Research Projects Agency (DARPA), is developing tiny TOF mass spectrometers for the detection of biological
agents. Our laboratory has been involved in that project as well, developing a high-order kinetic energy focusing TOF mass analyzer known as the endcap reflectron, which is also being developed by Science & Engineering Services.
The Time-of-flight Mass Spectrometer
In the TOF mass spectrometer ions are formed in a short source region (Figure 1), accelerated by the electric field formed by the voltage V to a constant energy and injected into a longer drift region (D). The time of flight of the ion across this drift region is a function of the ion mass:
t = (m/2eV)1/2D.
Mass resolution is generally improved using a reflectron, a device that corrects for the spread in ion velocities due to difference in initial kinetic energy by reversing the direction of the ion motion in the drift region back toward the ion source. Most of these provide first- or second-order energy correction, which is sufficient in instruments of the size used in the laboratory (1 meter or greater) to provide mass resolutions of 10,000 or more. Our own approach to miniaturization has been to develop a high-order reflectron in which a quadratic reflecting field is achieved by capping a grounded cylinder with a reflection electrode at high voltage (Figure 2).
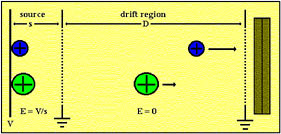
FIGURE 1. Diagram of a TOF mass spectrometer.
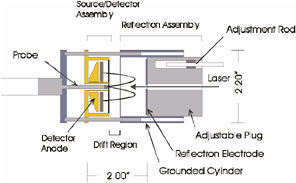
FIGURE 2. Diagram of endcap reflectron TOF mass spectrometer.
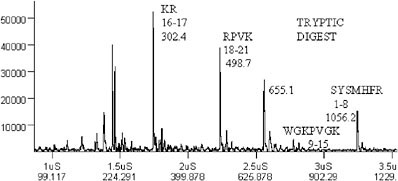
FIGURE 3. Mass spectrum of the tryptic peptides from a protein digest.
This instrument can be used to identify proteins from the mass spectra of their tryptic digests and comparison of the masses observed with protein or genomic databases (Figure 3).
Conclusions for Life Detection
At the University of Maryland, Catherine Fenselau and Plamen Demirev have obtained mass spectra for microorganisms, including bacterial spores lysed with a corona plasma discharge. The masses observed in the range of 500 to 10,000 daltons are generally those that can be identified with peptides in the bacteria. Rather than utilizing pattern recognition techniques, which require prior mass spectral investigation of each specific microorganism, these masses are compared directly with the protein database, which generally yields the protein source. This approach, which they have termed phyloproteomics, is a robust technique for identification of organisms that does not depend upon reproducible growth conditions or mass spectra. One should expect that MALDI time-of-flight mass spectrometers would provide similar biomarkers in both terrestrial and extraterrestrial scenarios, in which it would be possible to rapidly assess whether these are of known origin or are similar to known species.
LIFE DETECTION USING MOLECULAR METHODS
David A. Stahl
Department of Civil and Environmental Engineering
University of Washington
Abstract
Most molecular detection methods have not been designed to clearly resolve living from dead cellular material. Many diagnostic biopolymers —for example, DNA—may persist for very long periods of time within dead cells or following release from the cell. This contribution considers several basic features of the living cell that could serve as a basis to develop more definitive molecular tests of viability, independent of culture-based criteria. Molecular signatures that may serve this need include the transcriptional and translational machinery, the adenylate pool, and cell-membrane structure.
Introduction
The ultimate measure of life is documentation of the capacity for replication. Life detection has traditionally relied upon cultivation, and this remains the principal criterion presently used by NASA. However, recent advances in molecular biology and molecular systematics have revealed that most environmental populations of microorganisms resist cultivation. Therefore, available culture-based techniques are inadequate.
From a planetary protection mandate, current and future life detection needs can be assigned to two general categories:
-
Life detection—quantification of viable microorganisms and evaluation of physiological status; and
-
Identification—taxonomic and functional group assignment.
The higher priority is given to the first category, since the absence of life negates concerns of possible survival and propagation. However, estimations of survival and propagation require information provided by the second category. Thus, this brief overview is divided into two sections. The first section addresses available methods for life detection; the second addresses methods of identification. In addition to basic methodological approaches, some consideration is given to available sample size and sample collection since the abundance of organisms on spacecraft components is expected to be low. Although these are key issues that must be considered in the implementation of a comprehensive microbiological interrogation of a spacecraft, they are not elaborated here. Another area not explicitly addressed is detection of specialized microbial resting states, such as endospores.
Life Detection: Molecular Features Relevant to Life Detection
Intact Transcriptional and Translational Systems
Ribosomal RNA and mRNA Content It is well recognized that DNA-based techniques may not distinguish between living and dead materials. DNA is known to persist in some noncellular contexts, and DNA bound to surfaces such as clay is resistant to degradation.126 However, other biopolymers such as RNA and phospholipids are much less stable and generally are rapidly degraded following cell death. 127,128 For example, reverse transcriptase polymerase chain reaction (RT-PCR) has been used to confirm that microbial populations detected at the ribosomal DNA level are metabolically active.129 A major advantage of an rRNA-based measure of viability is the universal distribution of these biopolymers and the availability of PCR primers for highly efficient amplification from virtually any source organism.
Recent studies of Escherichia coli suggest that the loss of mRNAs for key housekeeping genes (e.g., rpoH, groEL, and tufA) could provide a sensitive measure of viability. All mRNAs comprising this study set were
undetectable by RT-PCR within 2 to 16 hours of heat killing.130 However, the mechanism of killing, ethanol versus heat, also influenced mRNA stability. All mRNAs remained detectable in ethanol-killed cells for the entire 16-hour post-kill incubation period. The rRNAs were detected at the end of 16 hours' incubation in both ethanoland heat-inactivated cells. Since PCR-based techniques are extremely sensitive—in principle detecting a single target molecule—rRNA- and mRNA-based viability testing may be a fruitful area for detection development. However, more complete characterization of rRNA and mRNA stability in relationship to different killing agents and post-killing incubation conditions is essential.
ATP and Energy Charge The presence of adenosine 5'-triphosphate (ATP) is one of the most general markers of life and has frequently been used in environmental studies to map the distribution of active microbiota. Chemiluminescent-based detection of ATP using luciferase is the most sensitive assay currently available; most luminometers can detect as little as 1 picomole of ATP. A recent study evaluated a commercial kit (Clean-Trace, Biotrace Ltd.) for detecting microorganisms on wet or dry surfaces.131 The detection limit was approximately 104 colony-forming units (CFUs) per 100 cm2 on surfaces artificially contaminated with E. coli or Staphylococcus aureus. A second study using this method to evaluate microbial contamination of milk reported similar detection limits. ATP content among different microbial species was found to be 0.8 ± 0.1 × 10⁻¹⁸ mol/CFU in coliforms; 12.0 ± 8.1 × 10⁻¹⁸ mol/CFU in S. aureus; 35.2 ± 16.9 × 10⁻¹⁸ mol/CFU in S. thermophilus; and 42.5 ± 1.3 × 10⁻¹⁸ in Streptococcus group D.132
A related measure of cellular energy status is energy charge, as defined by D.E. Atkinson:133
Energy Charge = {[ATP] + [ADP]/2}/{[ATP] + [ADP] + [AMP]}.
Energy charge reflects the relative number of high-energy phosphate bonds (anhydride-bound phosphate groups) in the adenylate pool. The energy charge of bacteria under normal conditions varies between 0.87 and 0.95 irrespective of growth rate. Energy charge decreases slowly with starvation, and values below about 0.5 are thought to be incompatible with life. Although ATP content and energy charge are attractive physiological parameters for assessing viability, current detection formats provide relatively low sensitivity.
Intact Membrane Structure
Phospholipid Fatty Acid Analysis The presence of an intact membrane is a well-established measure of viability. Viable microbes have intact membranes containing phospholipids. Cellular enzymes hydrolyze (release) the phosphate group from phospholipids within minutes to hours of cell death.134 Therefore, the determination of the total phospholipid ester-linked fatty acids (PLFAs) has been reported to provide a quantitative measure of the viable or potentially viable biomass. A study of subsurface sediment showed the viable biomass determined by PLFA was equivalent (but with a much smaller standard deviation) to that estimated by intercellular ATP, cell wall muramic acid, and very carefully done acridine orange direct counts (AODC).135 Reported detection limits are in the range 10 to 100 bacteria.
Viability Staining Microscopy alone is insufficient to assess the viability of a cell. However, a variety of fluorescent and fluorogenic stains provide a mechanism to evaluate viability when used in combination with epifluorescence microscopy or flow cytometry. There are two complementary types of stains used to achieve discrimination. The first type are lipid-soluble fluorogenic compounds that freely diffuse into most cells and become fluorescent following cleavage by nonspecific intracellular esterases. The structure of the fluorescent product retards subsequent loss from cells with intact membranes. The other class of dyes has high affinity for nucleic acid but will not penetrate intact cell membranes. Therefore, only nonviable cells are stained. One recent study evaluated several dyes (fluorescein diacetate [FDA] derivatives carboxyfluorescein diacetate, 2',7'-bis-(2-carboxyethyl)-5(6)-carboxyfluorescein acetoxymethyl ester, and calcein acetoxymethyl ester, and ChemChrome B) for the assessment of microbial viability.136 None of these dyes stained all organisms in the study set. ChemChrome B stained the greatest variety of Gram-negative and Gram-positive organisms, whereas FDA derivatives were reported to preferentially stain Gram-negative organisms. A commercial product based on this general
screening (BacLight, Molecular Probes) is now being evaluated at the Jet Propulsion Laboratory.137 In its current format, samples are collected from spacecraft surfaces by swapping, resuspended in buffer, and stained with the BacLight reagents. Stained samples are then filtered and quantified using epifluorescence microscopy. Reported technical problems include low efficiency of cell removal from surfaces and high error associated with quantifying extremely low cell numbers microscopically.
Molecular Identification—Taxonomic and Functional Group Assignment
Molecular Systematics—The Foundation for Comprehensive Detection Strategies
The conceptual foundation for molecular systematics was formally introduced in 1965 by E. Zuckerkandl and L. Pauling.138 Biopolymers (DNA, RNA, or polypeptides) were classified according to the degree to which they reflected the genealogy of an organism. The central model of molecular evolution is one of random evolutionary changes occurring at a stochastically constant rate. This model was introduced in the form of the “molecular clock,” which requires a constant rate of change in the sequence of a common biopolymer, the “molecular chronometer.” Useful chronometers must display certain properties including the following:
-
Molecular clock-like behavior;
-
Range—rates of change must be commensurate with the spectrum of evolutionary distances measured; and
-
Size—the molecule must be large enough to provide an adequate amount of information.
A good molecular chronometer should also fulfill a number of additional criteria, including universal distribution, functional constancy, and the absence of lateral transfer.
The ease by which nucleic acid sequence can be determined has resulted in its near routine use in microbial systematics and increasing application to direct microbial detection. Genes so far employed in general phylogenetic studies include the ribosomal RNAs, ATPases, protein elongation factors, gyrB,139,140 dnaK, and cytochromes.141,142 Among all available, the ribosomal RNAs (rRNAs) remain the target of choice. The establishment of a robust microbial phylogeny based on comparative sequencing of the rRNAs provided the first consistent taxonomic description of microorganisms143 and was an essential prelude to the unambiguous characterization of environmental populations (Pace et al.,144 Stahl,145 Stahl and Amann,146 Ward et al.,147 Hugenholtz et al.148). Three types of rRNA are common to the ribosomes of prokaryotes and eukaryotes, the 16S (and 16S-like), the 23S (and 23S-like), and the 5S rRNAs. Since the larger rRNAs of many eukaryotes and some prokaryotes differ significantly in size, the terms 16S-like and 23S-like have been used to refer to the two larger rRNAs. Certain attributes of the rRNAs favor their use as molecular chronometers and their use in direct detection. Although the genes that code for the rRNAs are among the most highly conserved,149 sequence conservation is not uniform along the length of these genes. Some regions of sequence are highly conserved and others show intermediate levels of sequence conservation. Regions that vary sufficiently slowly allow inference of relationships between members of the three domains (Bacteria, Eucarya, and Archaea),150 whereas the most variable regions provide for discrimination between organisms of approximate genus and species rank differences. Regional variation in sequence conservation has provided the basis for designing nucleic acid probes of varying specificity; group- and species-specific oligonucleotide probes have been used for direct assessment of population presence and abundance.151 The most highly conserved regions have also been used as general PCR priming sites for the selective amplification of virtually any rRNA. Well over 10,700 16S-like rRNA sequences are now available in the Ribosomal Database Project (RDP) database.152,153 Thus, the 16S-like rRNA is now the most encompassing of available molecular frameworks for identification and detection of microorganisms.
Identification of Diagnostic Nucleic Acid Sequences in Environmental Samples
There are three basic methods now used to recover nucleic acid sequence information from environmental samples:
-
PCR amplification, cloning, and sequencing;
-
DNA probe hybridization; and
-
Restriction enzyme digestion.
The PCR-based methods can use either DNA or RNA as template, the latter requiring initial use of reverse transcriptase to generate cDNA from an rRNA template. As noted above, the use of rRNA as a template may serve to provide a more direct measure of viable population numbers, although this has yet to be rigorously evaluated. The PCR-based methods are of exquisite sensitivity. Less than a single microorganism can be detected by RT-PCR using rRNA as a template (a single organism generally contains more than a thousand copies of each rRNA species). However, its sensitivity also makes this method very prone to artifacts of laboratory or reagent contamination.
Sequencing Methods As discussed above, for a variety of technical and practical considerations (size, information content, ease of sequencing), the 16S-like rRNA has become the standard measure for identification.154,155 The now well-established techniques of PCR amplification, DNA cloning, and nucleic acid sequencing have become general tools for identification of microorganisms in the environment based on rRNA sequence relationship. They are not elaborated upon here.
Terminal Restriction Fragment-Length Polymorphism Terminal restriction fragment length polymorphism (T-RFLP) is a refined fingerprinting technique. It has been most productively used to resolve amplified rRNA gene products by virtue of sequence differences detected following digestion with restriction enzymes. 156 The general steps include PCR amplification of a conserved target sequence (most commonly a region of the 16S-like rRNA gene) followed by restriction enzyme digestion and gel fractionation of the resulting fragments. Thus, the method incorporates two levels of target recognition —the first provided by selective PCR amplification and the second by virtue of presence and location of restriction enzyme recognition sequences.
Following recovery of DNA or RNA from an environmental sample, the 16S-like rRNA sequences are amplified using one of the many well-characterized PCR primer sets. However, in this method one of the two PCR primers is fluorescent labeled at the 5'-end. This results in PCR amplification products that are tagged with a fluorescent dye at only one terminus. Following restriction enzyme digestion (usually with a tetrameric restriction enzyme) the restricted products are resolved using an automated DNA sequencer or a capillary electrophoresis system equipped with laser-induced fluorescence detector. Only the fluorescently tagged terminal fragments are detected and quantified. This is an extremely sensitive technique (as low as 100 attomole of dye can be detected), and fragment lengths between 37 and 937 can be accurately assigned (±1-2 base pairs) by comparison to a set of size markers labeled with a different fluorescent dye and incorporated in each sample prior to electrophoresis.
As a whole, each T-RFLP pattern can be regarded as a fingerprint of population structure that provides information on population diversity (each terminal fragment and associated restriction site sequence define different “ribotypes”) and a semiquantitative estimate of relative abundance (peak area). T-RFLP provides an advantage over most molecular fingerprinting methods in that phylogenetic inference of predominant terminal fragment lengths within a community can be made once an appropriate database for the given sample is constructed.157 Thus, comparison of T-RFLP fingerprints derived from both the rRNA gene and the rRNA of an environmental sample serves to confirm that microbial populations detected at the rDNA level are metabolically active and also provides some information of relative activity.158 T-RFLP has also been extensively applied to examine variation among different functional genes in different environmental settings. Thus, this general approach might be used for highly sensitive detection of viable and commonly occurring assembly-room contaminants.
DNA Probes There are two basic categories of DNA probes, group-specific (phylogenetic or taxonomic) and functional. Group-specific probes generally target conserved biopolymers that can be used to infer phylogenetic relationships among the host organisms.159,160 Today, the most widely used target molecule is the small subunit rRNA (16S-like rRNA), and probes have been designed to target phylogenetic groups of varying evolutionary diversity (“phylotypes”). Phylogenetic probes therefore have the potential to provide explicit quantification of
microbial contamination at different levels of resolution. This approach could be used for the detection of very general classes of assembly area microbial contaminants.
Quantification of Populations or Single Cells There are two basic formats for using phylogenetic probes to study the environmental distribution of microorganisms. These are hybridization to total rRNA recovered from environmental samples and hybridization to fixed whole cells for subsequent microscopic visualization and enumeration. The latter technique, fluorescent in situ hybridization (FISH), uses fluorescent dye-labeled probes for microscopic detection of cells that hybridize to the probe. Both methods are well developed and in routine application.161-163 Both methods avoid the biases associated with PCR amplification by taking advantage of the natural amplification of the rRNAs. There are generally thousands of copies of each rRNA per cell, although the number for slow-growing cells is not well defined. However, both detection formats are much less sensitive than PCR-based methods. The lower limit of detection for radio-labeled probes is approximately 103-104 cells,164 and although a single cell can be observed microscopically, enumeration of low-abundance samples is limited by the image analysis requirements previously discussed. The efficiency of sample recovery and cell lysis or permeabilization are also poorly defined variables.
Functional Probes An important distinction is made between probes designed to identify phylogenetic or taxonomic groups, and probes designed to monitor specific metabolic functions. There has been considerable development of probes targeting genes encoding specific enzymes to evaluate specific chemical transformations or potential activity of environmental populations. These “functional” gene probes should have application in determining whether spacecraft contaminants harbor microbial phenotypes more likely to proliferate in nonterrestrial habitats (e.g., autotrophs). Some examples of traits, and corresponding genes, sufficiently conserved to be easily identified in environmental samples include genes for nitrogen fixation,165 Ni-Fe hydrogenase,166 CO2 fixation, and the dissimilatory sulfite reductase.167,168
Other Technical Issues
The following technical issues are key considerations in detection. However, since relatively little explicit or comparative data is available, they are only briefly listed here:
-
Time and cost of analysis;
-
Confidence levels;
-
Signal to noise—the ability to “see” life in a complex background matrix;
-
Sensitivity;
-
Specificity;
-
Analytical framework;
-
Destructive sampling versus replication;
-
In situ analyses versus the requirement for sample collection;
-
Efficiency of sample collection and possible associated loss of viability; and
-
Witness plates-active versus passive collection.
A Possible Role for Improved Culture- and Activity-Based Methods
The NASA Standard Assay is based on standard culture-based enumeration of cells and spores. However, the current protocol requires extended incubation periods and may miss more than 99 percent of microorganisms. Although this and other standard culture-based methods are now recognized to be inadequate, there may be merit in exploring alternative culture-based methods to either enumerate or measure physiological activity. For example, a recent study of low-abundance ice-entrained bacteria (200-300 cells/ml) showed that at least some of the assemblage was viable as measured by respiration of 14C-labeled acetate and glucose.169
A ROBOTIC-PCR DETECTOR FOR DNA-BASED LIFE ON OTHER PLANETS
Gary Ruvkun
Harvard Medical School, Department of Molecular Biology, Massachusetts General Hospital
Michael Finney
MJ Research, 590 Lincoln St., Waltham, Massachusetts
Walter Gilbert
Department of Molecular and Cellular Biology, Harvard University
George M. Church
Department of Genetics, Harvard Medical School
Abstract
Key genetic components such as the ribosomal RNA genes are conserved in all living organisms on Earth. The polymerase chain reaction (PCR) with DNA primers corresponding to conserved elements in the ribosomal RNA genes is now used to amplify minute quantities of DNA from extreme Earth environment samples, allowing the detection and classification of life in those samples without need to isolate, culture, or grow the organisms in any way. This is currently our most sensitive detector of life on Earth. These same primers can be used to search for life on Mars that is related to life on Earth. Life on Mars would be ancestrally related to life on Earth if there was exchange of viable organisms between Mars and Earth, or more generally, common ancestry from a source outside of the solar system, something we call Panarchaea. If microbial life exists on Mars currently and is more abundant than about one cell per gram at the landing site, PCR is sensitive enough to detect the signature of life. This signature is the amplification of a 500 base-pair-long DNA fragment that can be sequenced in situ on Mars using simple gene array technology to determine its phylogenetic placement. PCR technology is very mature. A low power consumption, very light, robotic PCR thermal cycler could be sent to the surface of Mars to sample the soil for microbial life.
Even though life has so far only been found on Earth, most strategies for the detection of life on other planets and moons assume independent evolution on those planets. General life detection strategies involve the detection of structural and informational polymers, of microscopic or macroscopic structures, or of chemical signatures of metabolism. It is worth noting, however, that these are not the tools currently used by molecular biologists to search for the most divergent life on Earth. First, the rate of metabolism for many of the most divergent organisms, and the numbers of individual organisms in many niches, is so low that such detection tests currently fail. For the detection of the most diverse microbial life on Earth, there is a much more sensitive and simple DNA-based search strategy that is essentially definitive.
The exploration of the diversity of life on Earth has revealed key genetic components that are conserved in all free-living organisms. The most conserved of these genes are the ribosomal RNA genes, one class of which is called the 16S or 18S RNA genes.170 Ribosomal RNAs are the main structural and catalytic components of the ribosome, the molecular machine that translates RNA into proteins. Because of this universality, all organisms are thought to have inherited their ribosomal RNA gene (as well as hundreds of other genes that have drifted more significantly during the past 3 billion years) from a common ancestor. The root of that tree has been hypothesized to be an archaeal-like hyperthermophile.171
Within the approximately 1500 nucleotides of the ribosomal RNA gene, there are multiple 20-nucleotide segments that are exactly conserved between organisms as disparate as the single-celled extremophile Archaeae that live in Earth's crust and humans, or corn.172 These conserved elements in the ribosomal genes are our most sensitive detectors of life on Earth and are being used to drastically expand the known universe of life. The reason they are so sensitive is that the PCR with DNA primers corresponding to these absolutely conserved elements can be used to amplify any DNA species, without the need to isolate, culture, or grow the organsims in any way.
The polymerase chain reaction amplifies the number of copies of a specific region of DNA in order to produce enough DNA, for example, for DNA sequence analysis. In PCR, one must know the sequences that flank a given region, but one need not know the DNA sequence in between. In addition to the range of organisms that can be detected, the PCR approach has the added advantages of extreme sensitivity and almost trivial ease. PCR can often detect a single DNA double helix in a clean sample in a two-hour analysis. The biochemical processing of the sample can be as crude as a cheek swab from humans to agitation of a soil sample. The technology of PCR involves adding stable 20-nucleotide-long DNA primers, a stable enzyme and nucleotide monomers that function at 370 Kelvin, and a simple heat pump that thermally cycles 40 times in two hours to amplify DNA from a few strands to billions of identical DNA fragments. In the case of the ribosomal genes, the DNA primer 5' GTGCCAGCAG CCGCGGTAAT, which corresponds to nucleotides 601 to 621 of a ribosomal gene, and GGTGGTCCTG ACCTCGGAC 5', which corresponds to the base pairing complement of nucleotides 1213 to 1233, are added to a soil extract. These DNA primers pair with their complement on each DNA strand, even if there are only a few DNA molecules in a sample. When DNA polymerase and mononucleotides are added, that DNA strand is duplicated. If one repeats the thermal cycle with all the same components in the same tube, there will be eight strands. Twenty cycles produce one million copies of the original sequences.
This PCR technology is standard in small labs all over the world. Currently, hundreds of research groups are using ribosomal RNA PCR primers to amplify samples isolated from a wide range of environments —for example, from marine water samples or extreme environments.173 In this way, vast numbers of new archaeal and bacterial species have been found in extreme temperature or in dehydrated or radioactive environments as well as in the most typical ocean sample. Interestingly, most of the life that is detected in these samples cannot be cultured, suggesting either very slow growth rates or very particular growth conditions not met in the laboratory. This also suggests that metabolic detection of life can be very problematic since the growth rates can be slow or nil in simple culture conditions.
Since universal PCR primers from the ribosomal RNA gene can detect essentially all living organisms on Earth, these same primers can be used to search for life on Mars that is related to life on Earth. If such microbial life exists on Mars currently and is more abundant than about one cell per gram at the landing site, PCR is sensitive enough to detect the signature of life—amplification of DNA with particular DNA sequence features using these DNA primers.
There are two conditions under which life on Mars should resemble life on Earth to the point of sharing ribosomal RNA sequences: exchange between Mars and Earth or, more generally, common ancestry from another source, perhaps even outside of the solar system. In either case, organisms (or perhaps the hardier spores that many microbes form) would have to survive the passage. Ultraviolet radiation damage appears to be easily shielded for example, by simple embedding in a rock, though survival for millions of years has not been addressed. 174,175
The ability of a crustal sample to escape Mars and land on Earth without sterilizing heating is demonstrated by ALH84001 martian meteorite. While the ALH84001 meteorite evidence for fossils is debated, this rock may not have been heated above the survival temperature of modern spores,176 though this too is debated.177 The flux of such meteoritic exchange between Mars and Earth would be much more intense at the heavy bombardment stage of the solar system, as well as in the period of sporadic collisions towards the end of that era. Thus, life in the solar system may have evolved on Earth, Mars, or another planet and exchanged between those planets.
There is also a reasonable argument for life on Earth coming from outside the solar system, something we call Panarchaea. The fossil record of Earth shows that within a few hundred million years of the cessation of the bombardment phase (at 4.0 billion to 4.2 billion years ago), living organisms morphologically similar to contemporary stromatolites, a mat composed of billions of bacteria, had already become abundant (at 3.6 billion years ago).178 This observation is usually marshaled as evidence that the evolution of life from simple molecules to
simple organisms was rapid. In that 300 million to 500 million years, life had to evolve from simple organic molecules to a bacteria-like organism with DNA-based genetic material, a very complex ribosome, and many other “core” genetic components now shared between the disparate branches on the tree of life.179
A different interpretation of the appearance of bacteria-like organisms within a short period of time after the end of bombardment is that it may represent the time it took for preexisting microbes to colonize the virgin chemical gradients and reduced carbon substrates in Earth 's crust. If one accepts that evolution to microbes can occur in 500 million years, then there may have been planets with microbial life that evolved during the 8 billion years of galactic evolution that preceded the birth of the solar system. Since planets are thought to be common and the habitable zone for life has broadened to much of the solar system, life may have evolved on many planets. Once life evolved in any planetary system, ejection of that life by meteorite and comet impacts or by chaotic planetary orbit pertubation and ejection could allow exchange within and between solar systems.180 Of course, if extraterrestrial life seeded Earth, Mars might have been seeded by the same source.
The ability of microbial life to survive such long transits in vacuum and high radiation strains credulity, though protection could be afforded if the ejecta was as large as a planet or asteroid.181 However, the improbability of the arrival of life on Earth from another source must be compared to the similarly improbable scenario that the isotopic record in ancient rocks implies: that life evolved on Earth within 500 million years from primordial soup to full-fledged microbes.
A strength of the Panarcheal argument is that it makes clear predictions of what extraterrestrial life should look like. For both the case of exchange between Mars and Earth and the general case of exchange between planetary systems, life on Mars should share ribosomal RNA genes with DNA sequence homology to earthly ribosomal genes, and PCR will be able to detect them.
Life on Mars related to life on Earth may have flourished a billion years ago, when water was more plentiful. PCR has been used to detect DNA in samples thousands of years old but not a million or a billion years old—we do not expect to detect microbial fossils with this procedure. But microbial life may still flourish in the very low temperature and low hydration of martian soils. Microbes are very adaptable: we find them growing in the extreme cold and dryness of Antarctica, as well as the extreme heat and pressure of Earth 's crust.182 Martian microbes may have solved the problem of life at 150 to 210 K with near zero water. In addition, the signs of massive recent water flows on Mars suggest more hospitable microbial niches in the not too distant past.183 Also, evidence for recent martian volcanism, suggests that temperatures may rise below the martian surface, especially near the sites of the most recent volcanism.184 And even if life flourishes only in isolated oases away from any landing site, the dust storms evident on Mars may blow recently alive or living microbial cells and/or spores into the landing site and be detectable with a technique as sensitive as PCR.
The technology to amplify and detect the ribosomal RNA signature of life on Mars is simple and can be engineered into a lightweight and reliable automated form. PCR thermal cyclers involve very simple heating and cooling that can use just a few watts. The technology is very mature, with thousands of solid-state thermal cycling machines, which cost from $1,000 to $10,000 each, installed in small laboratories all over the world. Many of these machines are robotically controlled in genome centers for high-throughput genome sequencing. PCR can thus be done with very little weight, low power consumption, and very forgiving technology.
The soil sample handling capabilities of a future Mars lander could deliver samples to a suspension and dilution station. Filtration would be used to sieve out microbial-sized particles (microbial size on Earth is remarkably uniform, across vast phylogenetic distances). A simple extraction procedure can release the contents of any cells and remove contaminants. Samples would then be mixed with reagents including PCR primers corresponding to the universal elements of ribosomal genes and thermally cycled. Bona fide ribosomal RNA genes would be expected to generate a PCR product of a size in a narrow range. The DNA fragment from the PCR reaction would be probed to a gene array bearing 100,000 small oligonucleotides representing the DNA sequence space for the ribosomal RNA gene, to remotely determine the DNA sequence. In this way, any organism detected on Mars, could be placed in or outside of known microbial phylogeny.
The phylogenetic placement of the detected ribosomal RNA gene is important for a quite different reason. PCR is so powerful that contamination is a critical issue. A ribosomal RNA gene sequence corresponding to a known earthly clade (such as humans or any of the common bacteria that live on the skin) would be rejected.
Another key to ruling out contamination will be dilution of the soil samples followed by PCR analysis; any true martian organism should be found in proportion to the input soil amount. There are also a number of well-established procedures, such as chemical and ultraviolet treatments to eliminate DNA contamination.
The fluid handling components to handle the soil samples and transit to the PCR module could be microfluidic and weigh less than 100 grams. The thermal cycler for amplification could weigh just a few hundred grams. In principle, the DNA sequence analysis chip and charge coupled device electronics to read the chip scanner could be similar in size to a portable CD player. Such a micromicrobial analysis machine would also encourage useful advances in portable terrestrial DNA analyses as spinoffs.
Acknowledgment
We thank Jonathan Lunine for helpful comments on the manuscript.
REFERENCES FOR PAPERS IN SESSION 3
1. C.R. Clemmer and T.P. Beebe, “Graphite: A Mimic for DNA and Other Biolmolecules in Scanning Tunneling Microscope Studies,” Science 251:640-642, 1991.
2. See, for example, A.G. Michette, Optical Systems for Soft X Rays, Plenum Press, New York, 1986.
3. See, for example, J. Kirz, C. Jacobsen, and M. Howells, “Soft X-ray Microscopes and Their Biological Applications, Q. Rev. Biophys. 28:33-130, 1995.
4. See, for example, J. Thieme, G. Schmahl, E. Umbach, and D. Rudolph (eds.), X-ray Microscopy and Spectromicroscopy, Springer-Verlag, Berlin, 1998.
5. See, for example, W. Meyer-Ilse, D.T. Attwood, and A. Warwick (eds.), X-ray Microscopy: Proceedings of the Sixth International Conference, Berkeley, California, 2-6 August 1999, American Institute of Physics (AIP), Melville, New York, 2000.
6. H. Wolter, “Spiegelsysteme Streifenden Einfalls als Abbildende Optiken für Röntgenstrahlen,” Ann. Phys. 10:94-114, 286, 1952.
7. D. Sayre, J. Kirz, R. Feder, D.M. Kim, and E.D. Spiller, “Potential Operating Region for Ultrasoft X-ray Microscopy of Biological Materials,” Science 196:1339-1340, 1977.
8. M. Isaacson and M. Utlaut, “A Comparison of Electron and Photon Beams for Determining Micro-chemical Environment,” Optik 50:213-234, 1978.
9. E.G. Rightor, A.P. Hitchcock, and H. Ade, “Spectromicroscopy of Polyethylene terephthalate: Comparison of Spectra and Radiation Damage Rates in X-ray Absorption and Electron Energy Loss,” Journal of Physical Chemistry B 101:1950-1960, 1997.
10. See, for example, G. De Stasio, D. Dunham, B.P. Tonner, D. Mercanti, M.T. Ciotti, P. Perfetti, and G. Margaritondo, “Application of Photoelectron Spectromicroscopy to a Systematic Study of Toxic and Natural Elements in Neurons,” Journal of Synchrotron Radiation 2:106-112, 1995.
11. S. Spector, C. Jacobsen, and D. Tennant, “Process Optimization for Production of Sub-20 nm Soft X-ray Zone Plates,” Journal of Vacuum Science and Technology B 15:2872-2876, 1997.
12. E. Anderson and D. Kern, “Nanofabrication of Zone Plate Lenses for High-resolution X-ray Microscopy, ” in X-ray Microscopy III: Proceedings of the Third International Conference, London, September 3-7, 1990, A.G. Michette, G.R. Morrison, and C.J. Buckley (eds.), Springer-Verlag, New York, 1992.
13. D. Weiss, M. Peuker, and G. Schneider, “Radiation-enhanced Network Formation in Copolymer Galvanoforms for Diffractive Nickel X-ray Optics with High Aspect Ratios,” Applied Physics Letters 72:1805-1807, 1998.
14. C. Jacobsen, S. Williams, E. Anderson, M.T. Browne, C.J. Buckley, D. Kern, J. Kirz, M. Rivers, and X. Zhang, “Diffraction-limited Imaging in a Scanning Transmission X-ray Microscope, ” Optics Communications 86:351-364, 1991.
15. T. Warwick, H. Ade, S. Cerasari, J. Denlinger, K. Franck, A. Garcia, S. Hayakawa, A. Hitchcock, J. Kikuma, S. Klingler, J. Kortright, G. Morisson, M. Moronne, E. Rightor, E. Rotenberg, S. Seal, H.-J. Shin, W.F. Steele, and B.P. Tonner, “Development of Scanning X-ray Microscopes for Materials Science Spectromicroscopy at the Advanced Light Source,” Journal of Synchrotron Radiation 5:1090-1092, 1998.
16. X. Zhang, H. Ade, C. Jacobsen, J. Kirz, S. Lindaas, S. Williams, and S. Wirick, “Micro-XANES: Chemical Contrast in the Scanning Transmission X-ray Microscope,” Nuclear Instruments and Methods in Physics Research A 347:431-435, 1994.
17. C. Jacobsen, S. Wirick, G. Flynn, and C. Zimba, “Soft X-ray Spectroscopy from Image Sequences with Sub-100 nm Spatial Resolution,” Journal Microsc. 197:173-184, 2000.
18. See, for example, J. Kirz, C. Jacobsen, and M. Howells, “Soft X-ray Microscopes and Their Biological Applications, Q. Rev. Biophys. 28:33-130, 1995.
19. G. Schneider, “Cryo X-ray Microscopy with High Spatial Resolution in Amplitude and Phase Contrast,” Ultramicroscopy 75:85-104, 1998.
20. J. Maser, A. Osanna, Y. Wang, C. Jacobsen, J. Kirz, S. Spector, B. Winn, and D. Tennant, “Soft X-ray Microscopy with a Cryo Scanning Transmission X-ray Microscope: I. Instrumentation, Imaging and Spectroscopy,” Journal Microsc. 197:68-79, 2000.
21. W.S. Haddad, I. McNulty, and J.E. Trebes, “Ultrahigh-resolution X-ray Tomography,” Science 266:1213-1215, 1994.
22. J. Lehr, “3D X-ray Microscopy: Tomographic Imaging of Mineral Sheaths of Bacteria Leptothrix ochracea with the Göttingen X-ray Microscope at BESSY,” Optik 104:166-170, 1997.
23. Y. Wang, C. Jacobsen, J. Maser, and A. Osanna, “Soft X-ray Microscopy with a Cryo Scanning Transmission X-ray Microscope: II. Tomography,” Journal Microsc. 197:80-93, 2000.
24. See, for example, Figure 1 from X. Zhang, R. Balhorn, J. Mazrimas, and J. Kirz, “Mapping and Measuring DNA to Protein Ratios in Mammalian Sperm Head by XANES Imaging,” Journal Struct. Biol. 116:335-344, 1996.
25. J. Kirz, C. Jacobsen, and M. Howells, “Soft X-ray Microscopes and Their Biological Applications, Q. Rev. Biophys. 28:33-130, 1995.
26. H. Ade, X. Zhang, and S.H. Cameron, “Chemical Contrast in X-ray Microscopy and Spatially Resolved XANES Spectroscopy of Organic Specimens,” Science 258:972-975, 1992.
27. H. Ade, “Compositional and Orientational Characterization of Polymeric Systems with X-ray Microscopy,” Trends in Polymer Science 5:58-66, 1997.
28. For further examples see, for example, W. Meyer-Ilse, D.T. Attwood, and A. Warwick (eds.), X-ray Microscopy: Proceedings of the Sixth International Conference, Berkeley, California, 2-6 August 1999, American Institute of Physics (AIP), Melville, New York, 2000.
29. C. Jacobsen, S. Wirick, G. Flynn, and C. Zimba, “Soft X-ray Spectroscopy from Image Sequences with Sub-100 nm Spatial Resolution,” Journal Microsc. 197:173-184, 2000.
30. G.J. Flynn, L.P. Keller, C. Jacobsen, and S. Wirick, “Carbon and Potassium Mapping and Carbon Bonding State Measurements on Interplanetary Dust,” Meteoritics and Planetary Science 33(supplement):A50-51, 1998.
31. G. Cody, R.E. Botto, H. Ade, and S. Wirick, “Soft X-ray Microscopy and Microanalysis: Applications in Organic Geochemistry,” in X-ray Microbeam Technology and Applications, W. Yun (ed.), International Society for Optical Engineering (SPIE), Bellingham, Washington, 1995.
32. W.W. Barker and J.F. Banfield, “Zones of Chemical and Physical Interaction at Interfaces Between Microbial Communities and Minerals: A Model,” Geomicro. Journal 15:223-244, 1998.
33. S.A. Welch, W.W. Barker, and J.F. Banfield, “Microbial Extracellular Polysaccharides and Plagioclase Dissolution, ” Geochim. Cosmochim. Acta 63:1405-1409, 1999.
34. S.C.B. Myneni, J.T. Brown, G.A. Martinez, and W. Meyer-Ilse, “Imaging of Humic Substance Macromolecular Structures in Water and Soils,” Science 286:1335-1337, 1999.
35. H.H. Teng and P.M. Dove, “Surface Site-specific Interactions of Aspartate with Calcite During Dissolution: Implications for Biomineralization,” Am. Mineral. 82:878-887, 1997.
36. See P. Echlin, Low-Temperature Microscopy and Analysis, Plenum Press, New York, 1992, 539 pp.
37. See R.A. Steinbrecht and K. Zierold, Cryotechniques in Biological Electron Microscopy, Springer-Verlag, New York, 1987, 297 pp.
38. R.C. Cantor and L.C. Smith, Genomics: The Science and Technology Behind the Human Genome Project , John Wiley & Sons, New York, 1999.
39. J.J. Kasianowicz, E. Brandin, D. Branton, and D.W. Deamer, “Characterization of Individual Polynucleotide Molecules Using a Membrane Channel,” Proc. Natl. Acad. Sci. USA 93:13770-13773, 1996.
40. M. Akeson, D. Branton, J.J. Kasianowicz, E. Brandin, and D.W. Deamer, “Microsecond Time-scale Discrimination Among Polycytidylic Acid, Polyadenylic Acid, and Polyuridylic Acid as Homopolymers or as Segments Within Single RNA Molecules,” Biophys. J. 77:3227-3233, 1999.
41. A. Meller, L. Nivon, E. Brandin, J. Golovchenko, and D. Branton, “Rapid Nanopore Discrimination Between Single Polynucleotide Molecules, ” Proc. Natl. Acad. Sci USA. 97:1079-1084, 2000.
42. A. Meller, L. Nivon, E. Brandin, J. Golovchenko, and D. Branton, “Rapid Nanopore Discrimination Between Single Polynucleotide Molecules, ” Proc. Natl. Acad. Sci USA 97:1079-1084, 2000.
43. A. Meller, L. Nivon, and D. Branton, “Voltage-driven DNA Translocations Through a Nanopore,” Phys. Rev. Lett. 86:3435-3438, 2001.
44. G.A. Logan, J.M. Hayes, G.B. Hieshima, and R.E. Summons, “Terminal Proterozoic Reorganization of Biogeochemical Cycles,” Nature 376:53-56, 1995.
45. S. Ziegler and M.L. Fogel, “Seasonal and Diel Determinants of the Isotopic Composition of Organic Matter in a Freshwater Wetland,” American Chemical Society Abstract 221, GEOC 61, 2001.
46. See paper by D. Stahl, Session 3, in this appendix.
47. See paper by J.M. Muldowan, Session 4, in this appendix.
48. M.D. McCarthy, J.I. Hedges, and R. Benner, “Bacterial Origin of a Major Fraction of Dissolved Organic Nitrogen in the Sea,” Science 281:231-233, 1998.
49. M.L. Fogel and N. Tuross, “Transformation of Plant Biochemicals to Geological Macromolecules During Early Diagenesis,” Oecologia 120:336-346, 1999.
50. See paper by R.J. Cotter, Session 3, in this appendix.
51. E.J. Gaidos, K.H. Nealson, and J.L. Kirschvink, “Life in Ice-covered Oceans,” Science 284:1631-1633, 1999.
52. H.A. Lowenstam and S. Weiner, On Biomineralization, Oxford University Press, Oxford, U.K., 1989, p. 324.
53. J.F. Kasting, “Earth's Early Atmosphere,” Science 259:920-926, 1993.
54. D.A. Evans, N.J. Beukes, and J.L. Kirschvink, “Low-latitude Glaciation in the Paleoproterozoic,” Nature 386(6622):262-266, 1997.
55. J.L. Kirschvink, E.J. Gaidos, L.E. Bertani, N.J. Beukes, J. Gutzmer, L.N. Maepa, and R.E. Steinberger, “Paleoproterozoic Snowball Earth: Extreme Climatic and Geochemical Global Change and Its Biological Consequences,” Proc. Natl. Acad. Sci. USA 97:1400-1405, 2000.
56. R. Rye and H.D. Holland, “Paleosols and the Evolution of Atmospheric Oxygen: A Critical Review, ” Amer. Journal Sci. 298(8):621-672, 1998.
57. P.M. Harrison, “The Structure and Function of Ferritin,” Biochem. Ed. 14:154-162, 1986.
58. S. Mann, J. Hannington, and R. Williams, “Phospholipid Vesicles as a Model System for Biomineralization,” Nature 324:565-568, 1986.
59. J.L. Kirschvink and H.A. Lowenstam, “Mineralization and Magnetization of Chiton Teeth: Paleomagnetic, Sedimentologic, and Biologic Implications of Organic Magnetite,” Earth Planet. Sci. Lett. 44:193-204, 1979.
60. J.L. Kirschvink, “Paleomagnetic Evidence for Fossil Biogenic Magnetite in Western Crete, ” Earth Planet. Sci. Lett. 59:388-392, 1982.
61. H. Vali and J.L. Kirschvink, “Observations of Magnetosome Organization, Surface Structure, and Iron Biomineralization of Undescribed Magnetic Bacteria: Evolutionary Speculations,” in Iron Biomineralization, R.P. Frankel and R.P. Blakemore (eds.), Plenum Press, New York, 1991, pp. 97-115.
62. R.P. Blakemore, “Magnetotactic Bacteria,” Science 190:377-379, 1975.
63. R.B. Frankel, R.P. Blakemore, and R.S. Wolfe, “Magnetite in Freshwater Magnetotactic Bacteria,” Science 203:1355-1356, 1979.
64. H. Vali and J.L. Kirschvink, “Observations of Magnetosome Organization, Surface Structure, and Iron Biomineralization of Undescribed Magnetic Bacteria: Evolutionary Speculations,” in Iron Biomineralization, R.P. Frankel and R.P. Blakemore (eds.), Plenum Press, New York, 1991, pp. 97-115.
65. Y.A. Gorby, T.J. Beveridge, and R.P. Blakemore, “Characterization of the Bacterial Magnetosome Membrane,” Journal Bacteriol. 170:834-841, 1988.
66. R. Blakemore, “Magnetotactic Bacteria,” Annu. Rev. Microbiol. 36:217-238, 1982.
67. R.P. Blakemore, “Magnetotactic Bacteria,” Science 190:377-379, 1975.
68. J.L. Kirschvink, “South-seeking Magnetic Bacteria,” Journal of Experimental Biology 86:345-347, 1980.
69. R.P. Blakemore, R.B. Frankel, and A.J. Kalmijn, “South-seeking Magnetotactic Bacteria in the Southern Hemisphere,” Nature 286:384-385, 1980.
70. R.B. Frankel, R.P. Blakemore, F.F. Torres de Araujo, E.M.S. Esquivel, and J. Danon, “Magnetotactic Bacteria at the Geomagnetic Equator,” Science 212:1269-1270, 1981.
71. S.-B.R. Chang and J.L. Kirschvink, “Magnetofossils, the Magnetization of Sediments, and the Evolution of Magnetite Biomineralization,” Annu. Rev. Earth Planet. Sci. 17:169-195, 1989.
72. F.F. Torres de Araujo, M.A. Pires, R.B. Frankel, and C.E.M. Bicudo, “Magnetite and Magnetotaxis in Algae,” Biophys. Journal 50:375-378, 1985.
73. H. Vali and J.L. Kirschvink, “Observations of Magnetosome Organization, Surface Structure, and Iron Biomineralization of Undescribed Magnetic Bacteria: Evolutionary Speculations,” in Iron Biomineralization, R.P. Frankel and R.P. Blakemore (eds.), Plenum Press, New York, 1991, pp. 97-115.
74. S. Mann, R.B. Frankel, and R.P. Blakemore, “Structure, Morphology and Crystal Growth of Bacterial Magnetite,” Nature 310:405-407, 1984.
75. S. Mann, T.T. Moench, and R.J.P. Williams, “A High-resolution Electron Microscopic Investigation of Bacterial Magnetite: Implications for Crystal Growth,” Proceedings of the Royal Society of London B 221:385-393, 1984.
76. S. Mann, “Structure, Morphology, and Crystal Growth of Bacterial Magnetite, ” in Magnetite Biomineralization and Magnetoreception in Animals: A New Biomagnetism, J.L. Kirschvink, D.S. Jones, and B.J. McFadden (eds.), Plenum Press, New York, 1985, pp. 311-332.
77. H. Vali and J.L. Kirschvink, “Observations of Magnetosome Organization, Surface Structure, and Iron Biomineralization of Undescribed Magnetic Bacteria: Evolutionary Speculations,” in Iron Biomineralization, R.P. Frankel and R.P. Blakemore (eds.), Plenum Press, New York, 1991, pp. 97-115.
78. J.L. Kirschvink, “Magnetite Biomineralization and Geomagnetic Sensitivity in Higher Animals: An Update and Recommendations for Future Study,” Bioelectromagnetics 10:239-259, 1989.
79. J.L. Kirschvink, “On the Magnetostatic Control of Crystal Orientation and Iron Accumulation in Magnetosomes,” Automedica 14:257-269, 1992.
80. R.F. Butler and S.K. Banerjee, “Theoretical Single-domain Size Range in Magnetite and Titanomagnetite, ” Journal of GeophysicalResearch 80:4049-4058, 1975.
81. J.C. Diaz-Ricci and J.L. Kirschvink, “Magnetic Domain State and Coercivity Predictions for Biogenic Greigite (Fe3O4): A Comparison of Theory with Magnetosome Observations,” Journal of Geophysical Research 97:17309-17315, 1992.
82. K.L. Thomas-Keprta et al., “Elongated Prismatic Magnetite Crystals in ALH84001 Carbonate Globules: Potential Martian Magnetofossils,” Geochim. Cosmochim. Acta 64:6049-6081, 2000.
83. J.L. Kirschvink and S.-B.R. Chang, “Ultra Fine-grained Magnetite in Deep-sea Sediments: Possible Bacterial Magnetofossils,” Geology 12:559-562, 1984.
84. N. Petersen, T. von Dobeneck, and H. Vali, “Fossil Bacterial Magnetite in Deep-sea Sediments from the South Atlantic Ocean,” Nature 320:611-615, 1986.
85. J.L. Gould, J.L. Kirschvink, and K.S. Deffeyes, “Bees Have Magnetic Remanence,” Science 201:1026-1028, 1978.
86. C. Walcott, J.L. Gould, and J.L. Kirschvink, “Pigeons Have Magnets,” Science 205:1027-1029, 1979.
87. J.L. Kirschvink and J.L. Gould, “Biogenic Magnetite as a Basis for Magnetic Field Detection in Animals, ” Biosystems 13:181-201, 1981.
88. R. Wiltschko and W. Wiltschko, “Magnetic Orientation in Animals,” Zoophysiology, Vol. 33, Springer, Berlin, 1995, p. 297.
89. M.M. Walker, C.E. Diebel, and C.V. Haugh, “Structure and Function of the Vertebrate Magnetic Sense,” Nature 390:371-376, 1997.
90. J.L. Kirschvink, “Magnetoreception: Homing in on Vertebrates,” Nature 390:339-340, 1997.
91. M.M. Walker, C.E. Diebel, and C.V. Haugh, “Structure and Function of the Vertebrate Magnetic Sense,” Nature 390:371-376, 1997.
92. C.E. Diebel, R. Proksch, C.R. Green, P. Neilson, and M.M. Walker, “Magnetite Defines a Vertebrate Magnetoreceptor,” Nature 406:299-302, 2000.
93. J.L. Kirschvink and A. Kobayashi-Kirschvink, “Is Geomagnetic Sensitivity Real? Replication of the Walker-Bitterman Conditioning Experiment in Honey Bees,” American Zoologist 31:169-185, 1991.
94. J.L. Kirschvink, S. Padmanabha, C.K. Boyce, and J. Oglesby, “Measurement of the Threshold Sensitivity of Honeybees to Weak, Extremely Low Frequency Magnetic Fields,” Journal of Experimental Biology 200:1363-1368, 1997.
95. R.C. Beason, R. Wiltschko, and W. Wiltschko, “Pigeon Homing: Effects of Magnetic Pulses on Initial Orientation, ” Auk 114(3):405-415, 1997.
96. U. Munro, J.A. Munro, J.B. Phillips, and W. Wiltschko, “Effect of Wavelength of Light and Pulse Magnetization on Different Magnetoreception Systems in a Migratory Bird,” Australian Journal of Zoology 45(2):189-198, 1997.
97. U. Munro, J.A. Munro, J.B. Phillips, R. Wiltschko, and W. Wiltschko, “Evidence for a Magnetite-based Navigational Map in Birds,” Naturwissenschaften 84(1):26-28, 1997.
98. W. Wiltschko, U. Munro, R.C. Beason, H. Ford, and R. Wiltschko, “A Magnetic Pulse Leads to a Temporary Deflection in the Orientation of Migratory Birds,” Experientia 50:697-700, 1994.
99. W. Wiltschko and R. Wiltschko, “Migratory Orientation of European Robins Is Affected by the Wavelength of Light as Well as by a Magnetic Pulse,” Journal of Comparative Physiology 177(3):363-369, 1995.
100. J.L. Kirschvink and S.-B.R. Chang, “Ultra Fine-grained Magnetite in Deep-sea Sediments: Possible Bacterial Magnetofossils,” Geology 12:559-562, 1984.
101. S.-B.R. Chang and J.L. Kirschvink, “Magnetofossils, the Magnetization of Sediments, and the Evolution of Magnetite Biomineralization,” Annu. Rev. Earth Planet. Sci. 17:169-195, 1989.
102. J.L. Kirschvink and H.A. Lowenstam, “Mineralization and Magnetization of Chiton Teeth: Paleomagnetic, Sedimentologic, andBiologic Implications of Organic Magnetite,” Earth Planet. Sci. Lett. 44:193-204, 1979.
103. S.-B.R. Chang and J.L. Kirschvink, “Magnetofossils, the Magnetization of Sediments, and the Evolution of Magnetite Biomineralization,” Annu. Rev. Earth Planet. Sci. 17:169-195, 1989.
104. J.L. Kirschvink and S.-B.R. Chang, “Ultra Fine-grained Magnetite in Deep-sea Sediments: Possible Bacterial Magnetofossils,” Geology 12:559-562, 1984.
105. H. Vali, O. Forster, G. Amarantidis, and N. Petersen, “Magnetotactic Bacteria and Their Magnetofossils in Sediments,” Earth Planet. Sci. Lett. 86:389-400, 1987.
106. T. von Dobeneck, N. Petersen, and H. Vali, “Bakterielle Magnetofossilien,” Geowissenschaften in unser Zeit 5:27-35, 1987.
107. H. Vali and J.L. Kirschvink, “Magnetofossil Dissolution in a Paleomagnetically Unstable Deep-sea Sediment,” Nature 339:203-206, 1989.
108. B.M. Moskowitz, R.B. Frankel, and D.A. Bazylinski, “Rock Magnetic Criteria for the Detection of Biogenic Magnetite,” Earth Planet. Sci. Lett. 120(3-4):283-300, 1993.
109. P.P. Hesse, “Evidence for Bacterial Paleoecological Origin of Mineral Magnetic Cycles in Oxic and Sub-oxic Tasman Sea Sediments,” Marine Geology 117:1-17, 1994.
110. T. Yamazaki and H. Kawahata, “Organic Carbon Flux Controls the Morphology of Magnetofossils in Marine Sediments,” Geology 16(12):1064-1066, 1998.
111. Z. Gibbs-Eggar, “Possible Evidence for Dissimilatory Bacterial Magnetite Dominating the Magnetic Properties of Recent Lake Sediments,” Earth Planet. Sci. Lett. 168:1-6, 1999.
112. R.B. Frankel, J.P. Zhang, and D.A. Bazylinski, “Single Magnetic Domains in Magnetotactic Bacteria, Journal of Geophysical Research 103:30601-30604, 1998.
113. J.A. Peck and J.W. King, “Magnetofossils in the Sediment of Lake Baikal, Siberia,” Earth Planet. Sci. Lett. 140(1-4):159-172, 1996.
114. P.P. Hesse, “Evidence for Bacterial Paleoecological Origin of Mineral Magnetic Cycles in Oxic and Sub-oxic Tasman Sea Sediments, Marine Geology 117:1-17, 1994.
115. J.F. Stolz, “Magnetosomes,” Journal of General Microbiology 139:1663-1670, 1993.
116. T. Yamazaki, I. Katsura, and K. Marumo, “Origin of Stable Remanent Magnetization of Siliceous Sediments in the Central Equatorial Pacific,” Earth Planet. Sci. Lett. 105(1-3):81-93, 1991.
117. J. Akai, T. Sato, and S. Okusa, “TEM Study on Biogenic Magnetite in Deep-sea Sediments from the Japan Sea and the Western Pacific Ocean,” Journal of Electron Microscopy 40(2):110-117, 1991.
118. M. Farina, D.M.S. Esquivel, and H. Debarros, “Magnetic Iron-sulfur Crystals from a Magnetotactic Microorganism, ” Nature 343(6255):256-258, 1990.
119. S. Mann, N.H.C. Sparks, R.B. Frankel, D.A. Bazylinski, and H.W. Jannasch, “Biomineralization of Ferrimagnetic Greigite (Fe3S4) and Iron Pyrite (FeS2) in a Magnetotactic Bacterium,” Nature 343:258-261, 1990.
120. D.A. Bazylinski, R.B. Frankel, and H.W. Jannasch, “Anaerobic Magnetite Production by a Marine, Magnetotactic Bacterium, ” Nature 334:518-519, 1988.
121. D.S. McKay, E.K. Gibson, K.L. Thomas-Krepta, H. Vali, C.S. Romanek, S.J. Clemett, X.D.F. Chillier, C.R. Maechling, and R.N. Zare, “Search for Past Life on Mars: Possible Relic Biogenic Activity in Martian Meteorite ALH84001,” Science 273:924-930, 1996.
122. K.L. Thomas-Keprta et al., “Elongated Prismatic Magnetite Crystals in ALH84001 Carbonate Globules: Potential Martian Magnetofossils,” Geochim. Cosmochim. Acta 64:4049-4081, 2000.
123. L.E. Borg, J.N. Connelly, L.E. Nyquist, C.-Y. Shih, H. Wiesmann, and Y. Reese, “The Age of the Carbonates in Martian Meteorite ALH84001,” Science 286:90-94, 1999.
124. B.P. Weiss, J.L. Kirschvink, F.J. Baudenbacher, H. Vali, N.T. Peters, F.A. MacDonald, and J.P. Wikswo, “A Low Temperature Transfer of ALH84001 from Mars to Earth,” Science 290:791-895, 2000.
125. J.L. Kirschvink, E.J. Gaidos, L.E. Bertani, N.J. Beukes, J. Gutzmer, L.N. Maepa, and R.E. Steinberger, “Paleoproterozoic Snowball Earth: Extreme Climatic and Geochemical Global Change and Its Biological Consequences,” Proc. Natl. Acad. Sci. USA 97:1400-1405, 2000.
126. A.J. Alvarez, M. Khanna, G.A. Toranzos, and G. Stotzky, “Amplification of DNA Bound on Clay Minerals,” Mol. Ecol. 7:775-778, 1998.
127. D.C. White, W.M. Davis, J.S. Nickels, J.D. King, and R.J. Bobbie, “Determination of the Sedimentary Microbial Biomass by Extractable Lipid Phosphate,” Oecologia 40:51-62, 1979.
128. D.L. Balkwill, F.R. Leach, J.T. Wilson, J.F. McNabb, and D.C. White, “Equivalence of Microbial Biomass Measures Based on Membrane Lipid and Cell Wall Components, Adenosine Triphosphate, and Direct Counts in Subsurface Sediments,” Microbial Ecology 16:73-84, 1988.
129. M.M. Moeseneder, J.M. Arrieta, G. Muyzer, C. Winter, and G.J. Herndl, “Optimization of Terminal-restriction Fragment Length Polymorphism Analysis for Complex Marine Bacterioplankton Communities and Comparison with Denaturing Gradient Gel Electrophoresis,” Appl. Environ. Microbiol. 65:3518-3525, 1999.
130. G.E.C. Sheridan, C.I. Masters, J.A. Shallcross, and B.M. Mackey, “Detection of mRNA by Reverse Transcription PCR as an Indicator of Viability in Escherichia coli Cells,” Appl. Environ. Microbiol. 64(4):1313-1318, 1998.
131. C.A. Davidson, C.J. Griffith, A.C. Peters, and L.M. Fielding, “Evaluation of Two Methods for Monitoring Surface Cleanliness—ATP Bioluminescence and Traditional Hygiene Swabbing,” Luminescence 14(1):33-38, 1999.
132. V.G. Frundzhyan, L.Y. Brovko, V.S. Babunova, V.M. Kartashova, and N.N. Ugarova, “A Bioluminescence Assay of Total Bacterial Contamination of Fresh Milk,” Appl. Biochem. Microbiol. 35:321-327, 1999.
133. D.E. Atkinson, “The Energy Charge of the Adenylate Pool as a Regulatory Parameter. Interactions with Feedback Modifiers,” Biochemistry 7:4030-4034, 1968.
134. D.C. White, W.M. Davis, J.S. Nickels, J.D. King, and R.J. Bobbie, “Determination of the Sedimentary Microbial Biomass by Extractable Lipid Phosphate,” Oecologia 40:51-62, 1979.
135. D.L. Balkwill, F.R. Leach, J.T. Wilson, J.F. McNabb, and D.C. White, “Equivalence of Microbial Biomass Measures Based on Membrane Lipid and Cell Wall Components, Adenosine Triphosphate, and Direct Counts in Subsurface Sediments,” Microbial Ecology 16:73-84, 1988.
136. J.P. Diaper and C. Edwards, “The Use of Fluorogenic Esters to Detect Viable Bacteria by Flow-cytometry, ” Journal of Applied Bacteriology 77(2):221-228, 1994.
137. K. Venkateswaran, personal communication.
138. E. Zuckerkandl and L. Pauling, “Molecules as Documents of Evolutionary History,” Journal of Theoretical Biology 8:357-366, 1965.
139. S. Yamamoto and S. Harayama, “PCR Amplification and Direct Sequencing of Gyrb Genes with Universal Primers and Their Application to the Detection and Taxonomic Analysis of Pseudomonas putida Strains,” Appl. Environ. Microbiol. 61(3):1104-1109, 1995.
140. K. Venkateswaran, D.P. Moser, M.E. Dollhopf, D.P. Lies, D.A. Saffarini, B.J. MacGregor, D.B. Ringelberg, D.C. White, M. Nishijima, H. Sano, J. Burghardt, E. Stackebrandt, and K.H. Nealson, “Polyphasic Taxonomy of the Genus Shewanella and Description of Shewanella oneidensis sp. nov.,” International Journal of Systematic Bacteriology 49:705-724, 1999.
141. D. Jones and N.R. Krieg, “Serology and Chemotaxonomy,” in Bergey's Manual of Systematic Bacteriology, N.R. Krieg and J.G. Holt (eds.), Vol. 1, Williams & Wilkins, Baltimore, 1984, pp. 15-18.
142. M. Goodfellow and A.G. O'Donnell, “Roots of Bacterial Systematics,” in Handbook of New Bacterial Systematics, M. Goodfellow and A.G. O'Donnell (eds.), Academic Press, London, 1993, pp. 3-54.
143. C.R. Woese, “Bacterial Evolution,” Microbiol. Rev. 51:221-271, 1987.
144. N.R. Pace, D.A. Stahl, D.J. Lane, and G.J. Olsen, “The Analysis of Natural Microbial Populations by Ribosomal RNA Sequences, ” Advances in Microbial Ecology 9:1-55, 1986.
145. D.A. Stahl, “Evolution, Ecology and Diagnosis: Unity in Variety,” Bio/Technology 4:623-628, 1986.
146. D.A. Stahl and R. Amann, “Development and Application of Nucleic Acid Probes in Bacterial Systematics, ” in Sequencing and Hybridization Techniques in Bacterial Systematics, E. Stackebrandt and M. Goodfellow (eds.), John Wiley and Sons, Chichester, England, 1991, pp. 205-248.
147. D.M. Ward, M.M. Bateson, R. Weller, and A.L. Ruff-Roberts, “Ribosomal RNA Analysis of Microorganisms as They Occur in Nature, ” Advances in Microbial Ecology 12:219-286, 1992.
148. P. Hugenholtz, B.M. Goebel, and N.R. Pace, “Impact of Culture-independent Studies on the Emerging Phylogenetic View of Bacterial Diversity,” Journal Bacteriol. 180:4765-4774, 1988.
149. C.R. Woese, “Bacterial Evolution,” Microbiol. Rev. 51:221-271, 1987.
150. C.R. Woese, “Bacterial Evolution,” Microbiol. Rev. 51:221-271, 1987.
151. D.A. Stahl, “Application of Phylogenetically Based Hybridization Probes to Microbial Ecology,” Mol. Ecol. 4:535-542, 1995.
152. See <http://rdp.cme.msu.edu>.
153. B.L. Maidak, J.R. Cole, T.G. Lilburn, C.T. Parker, P.R. Saxman, J.M. Stredwick, G.M. Garrity, B. Li, G.J. Olsen, S. Pramanik, T.M. Schmidt, and J.M. Tiedje, “The RDP (Ribosomal Database Project) Continues,” Nucleic Acids Research 28(1):173-174, 2000.
154. B.L. Maidak, J.R. Cole, C.T. Parker, G.M. Garrity, N. Larsen, B. Li, T.G. Lilburn, M.J. McCaughey, G.J. Olsen, R. Overbeek, S. Pramanik, T.M. Schmidt, J.M. Tiedje, and C.R. Woese, “A New Version of the RDP (Ribosomal Database Project),” Nucleic Acids Research 27(1):171-173, 1999.
155. B.L. Maidak, J.R. Cole, T.G. Lilburn, C.T. Parker, P.R. Saxman, J.M. Stredwick, G.M. Garrity, B. Li, G.J. Olsen, S. Pramanik, T.M. Schmidt, and J.M. Tiedje, “The RDP (Ribosomal Database Project) Continues,” Nucleic Acids Research 28(1):173-174, 2000.
156. W.-T. Liu, T.L. Marsh, H. Cheng, and L.J. Forney, “Characterization of Microbial Diversity by Determining Terminal Restriction Fragment Length Polymorphisms of 16S Ribosomal DNA,” Appl. Environ. Microbiol. 63:4516-4522, 1997.
157. W.-T. Liu, T.L. Marsh, H. Cheng, and L.J. Forney, “Characterization of Microbial Diversity by Determining Terminal Restriction Fragment Length Polymorphisms of 16S Ribosomal DNA,” Appl. Environ. Microbiol. 63:4516-4522, 1997.
158. M.M. Moeseneder, J.M. Arrieta, G. Muyzer, C. Winter, and G.J. Herndl, “Optimization of Terminal-restriction Fragment Length Polymorphism Analysis for Complex Marine Bacterioplankton Communities and Comparison with Denaturing Gradient Gel Electrophoresis,” Appl. Environ. Microbiol. 65:3518-3525, 1999.
159. D.A. Stahl and R. Amann, “Development and Application of Nucleic Acid Probes in Bacterial Systematics, ” in Sequencing and Hybridization Techniques in Bacterial Systematics, E. Stackebrandt and M. Goodfellow (eds.), John Wiley and Sons, Chichester, U.K., 1991, pp. 205-248.
160. R.I. Amann, W. Ludwig, and K.-H. Schleifer, “Phylogenetic Identification and In Situ Detection of Individual Microbial Cells Without Cultivation,” Microbiol. Rev. 59:143-169, 1995.
161. E.F. DeLong, G.S. Wickham, and N.R. Pace, “Phylogenetic Stains: Ribosomal RNA-based Probes for the Identification of Single Cells,” Science 243:1360-1363, 1989.
162. R.I. Amann, W. Ludwig, and K.-H. Schleifer, “Phylogenetic Identification and In Situ Detection of Individual Microbial Cells Without Cultivation,” Microbiol. Rev. 59:143-169, 1995.
163. D.A. Stahl, “Application of Phylogenetically Based Hybridization Probes to Microbial Ecology,” Mol. Ecol. 4:535-542, 1995.
164. D.A. Stahl and R. Amann, “Development and Application of Nucleic Acid Probes in Bacterial Systematics, ” in Sequencing and Hybridization Techniques in Bacterial Systematics, E. Stackebrandt and M. Goodfellow (eds.), John Wiley and Sons, Chichester, England, 1991, pp. 205-248.
165. H. Hennecke, K. Kaluza, B. Thony, M. Fuhrmann, W. Ludwig, and E. Stackebrandt, “Concurrent Evolution of Nitrogenase Genes and 16S rRNA in Rhizobium Species and Other Nitrogen-fixing Bacteria,” Arch. Microbiol. 142:342-348, 1985.
166. C. Wawer and G. Muyzer, “Genetic Diversity of Desulfovibrio spp. in Environmental Samples Analyzed by Denaturing Gradient Gel Electrophoresis of [NiFe] Hydrogenase Gene Fragments,” Appl. Environ. Microbiol. 61:2203-2210, 1995.
167. M. Wagner, A.J. Roger, J.L. Flax, G.A. Brusseau, and D.A. Stahl, “Phylogeny of Dissimilatory Sulfite Reductases Supports an Early Origin of Sulfate Respiration,” Journal Bacteriol. 180:2975-2982, 1998.
168. D. Minz, J.L. Flax, S.J. Green, G. Muyzer, Y. Cohen, M. Wagner, B.E. Rittmann, and D.A. Stahl, “Diversity of Sulfate-reducing Bacteria in Oxic and Anoxic Regions of a Microbial Mat Characterized by Comparative Analysis of Dissimilatory Sulfite Reductase Genes,” Appl. Environ. Microbiol. 65:4666-4671, 1999.
169. D.M. Karl, D.F. Bird, K. Bjorkman, T. Houlihan, R. Shackelford, and L. Tupas, “Microorganisms in the Accreted Ice of Lake Vostok, Antarctica,” Science 286:2144-2147, 1999.
170. N.R. Pace, B.C. Thomas, and C.R. Woese, “Probing RNA Structure, Function, and History by Comparative Analysis, ” in The RNA World: The Nature of Modern RNA Suggests a Prebiotic RNA, R.F. Gesteland, T.R. Cech, and J.F. Atkins (eds.), 2nd ed., Cold Spring Harbor Laboratory Press, Cold Spring Harbor, New York, 1999, pp. 79-112.
171. N.R. Pace, “Origin of Life—Facing Up to the Physical Setting,” Cell 65:531-533, 1991.
172. S.M. Barns, R.E. Fundyga, M.W. Jeffries, and N.R. Pace, “Remarkable Archaeal Diversity Detected in a Yellowstone National Park Hot Spring Environment,” Proc. Natl. Acad. Sci. USA 91:1609-1613, 1994.
173. S.M. Barns, R.E. Fundyga, M.W. Jeffries, and N.R. Pace, “Remarkable Archaeal Diversity Detected in a Yellowstone National Park Hot Spring Environment,” Proc. Natl. Acad. Sci. USA 91:1609-1613, 1994.
174. W.L. Nicholson, N. Munakata, G. Horneck, H.J. Melosh, and P. Setlow, “Resistance of Bacillus Endospores to Extreme Terrestrial and Extraterrestrial Environments,” Microbiol. Mol. Biol. Rev. 64:548-572, 2000.
175. C. Mileikowsky, F.A. Cucinotta, J.W. Wilson, B. Gladman, G. Horneck, L. Lindegren, J. Melosh, H. Rickman, M. Valtonen, and J.Q. Zheng, “Natural Transfer of Viable Microbes in Space. 1. From Mars to Earth and Earth to Mars,” Icarus 145:391-427, 2000.
176. J.W. Valley, J.M. Eiler, C.M. Graham, E.K. Gibson, C.S. Romanek, and E.M. Stolper, “Low-temperature Carbonate Concretions in the Martian Meteorite ALH84001: Evidence from Stable Isotopes and Mineralogy,” Science 275:1633-1638, 1997.
177. E.R. Scott, A. Yamaguchi, and A.N. Krot, “Petrological Evidence for Shock Melting of Carbonates in the Martian Meteorite ALH84001,” Nature 387:377-379, 1997.
178. S.J. Mojzsis, R. Krishnamurthy, and G. Arrhenius, “Before RNA and After: Geophysical and Geochemical Constraints on Molecular Evolution,” in The RNA World: The Nature of Modern RNA Suggests a Prebiotic RNA , R.F. Gesteland, T.R. Cech, and J.F. Atkins (eds.), 2nd ed., Cold Spring Harbor Laboratory Press, Cold Spring Harbor, New York, 1999, pp. 1-48.
179. K.S. Makarova, L. Aravind, M.Y. Galperin, N.V. Grishin, R.L. Tatusov, Y.I. Wolf, and E.V. Koonin, “Comparative Genomics of the Archaea (Euryarchaeota): Evolution of Conserved Protein Families, the Stable Core, and the Variable Shell, ” Genome Research 9:608-628, 1999.
180. P.D. Ward and D. Brownlee, Rare Earth: Why Complex Life Is Uncommon in the Universe, Copernicus, New York, 2000.
181. W.L. Nicholson, N. Munakata, G. Horneck, H.J. Melosh, and P. Setlow, “Resistance of Bacillus Endospores to Extreme Terrestrial and Extraterrestrial Environments,” Microbiol. Mol. Biol. Rev. 64:548-572, 2000.
182. K. Pedersen, “Exploration of Deep Intraterrestrial Microbial Life: Current Perspectives, ” FEMS Microbiol. Lett. 185:9-16, 2000.
183. M.C. Malin and K.S. Edgett, “Evidence for Recent Groundwater Seepage and Surface Runoff on Mars, ” Science 288:2330-2335, 2000.
184. M.C. Malin, A. McEwen, M. Carr, L. Soderblom, P. Thomas, E. Danielson, P. James, J. Veverka, and W.K. Hartmann, “Evidence for Recent Volcanism on Mars from Crater Counts,” Nature 397:586-589, 1999.


