National Academies Press: OpenBook

Effects of Trawling and Dredging on Seafloor Habitat (2002)

Chapter: Appendix B: Regional Distribution of Fishing Effort

« Previous: Appendix A: Committee and Staff Biographies
Suggested Citation:"Appendix B: Regional Distribution of Fishing Effort." National Research Council. 2002. Effects of Trawling and Dredging on Seafloor Habitat. Washington, DC: The National Academies Press. doi: 10.17226/10323.
×

Appendix B Regional Distribution of Fishing Effort

Commercial fisheries using trawls for groundfish and shrimp and dredges fo\r scallops take place in the 6 fishery management regions of the contiguous United States. The information collected about those fisheries by the National Marine Fisheries Service (NMFS) and state agencies varies in quality and content from one region to another. Relatively good qualitative information is available for bottom trawl and scallop dredge fisheries, and detailed information on the location of bottom trawling, the duration of tows and the associated catches is available for most of the intensively trawled areas. However, the methods of data collection, the details maintained, and the geographic resolution differ. Four of the six regions have sufficient information about the distribution of trawling effort during the 1990s to allow depiction of fishing effort by geographic statistical area. The material in this appendix was collected and prepared by Natural Resources Consultants. It appears in this report with their permission.

ATLANTIC SEABOARD (FIGURES B.1–B.5)

Information about the trawl effort off New England and the mid-Atlantic states was provided to the committee by the Northeast Fisheries Science Center. Between 1964 and 1993 catch and fishing effort data were collected through a voluntary program using NMFS port agents in various fishing communities from Maine to Virginia. The system relied on interviews with captains of a portion of the fleet. Additional data were collected from weigh-out (dealer) transactions, auction sales, and from trucking companies. The objective of the program was to interview a large portion of the offshore-vessel operators, because their vessels were likely to fish in different areas from one trip to the next (or even on the same trip). Inshore, fixed-gear fleets that were more likely to fish the same grounds were thus interviewed less frequently.

For each vessel’s trip interview, the port agent assigned a 10-minute square (10′ latitude by 10′ longitude) that best characterized the location of landings from the trip. When data were available, the trip landings were split into several 10-minute squares, particularly if the catches of various species changed during the trip. All non-interviewed trips were assigned to the most appropriate quarter-degree square, based on the vessels known fishing patterns, port landings, or vessel location, as supplied by captains. Thus, the effort database is a combination of interviewed trips wherein data are located to 10-minute squares and noninterviewed trips wherein the data were assigned to quarter-degree squares. Effort data are defined in 24-hour days, not including steaming time.

Suggested Citation:"Appendix B: Regional Distribution of Fishing Effort." National Research Council. 2002. Effects of Trawling and Dredging on Seafloor Habitat. Washington, DC: The National Academies Press. doi: 10.17226/10323.
×

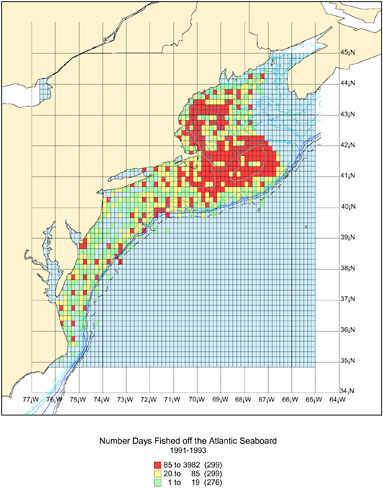
FIGURE B.1 Distribution of bottom trawl effort in New England and mid-Atlantic regions, 1991–1993. After Canada extended its fisheries jurisdiction to 200 miles, the U.S. trawl fisheries of the region were limited to waters south of 44°30′N latitude. Fishing off the mid-Atlantic states, except at the northern edge, is directed at shrimp and occurs relatively close to shore at depths <100 m. Effort is measured as the number of days fished.

Suggested Citation:"Appendix B: Regional Distribution of Fishing Effort." National Research Council. 2002. Effects of Trawling and Dredging on Seafloor Habitat. Washington, DC: The National Academies Press. doi: 10.17226/10323.
×

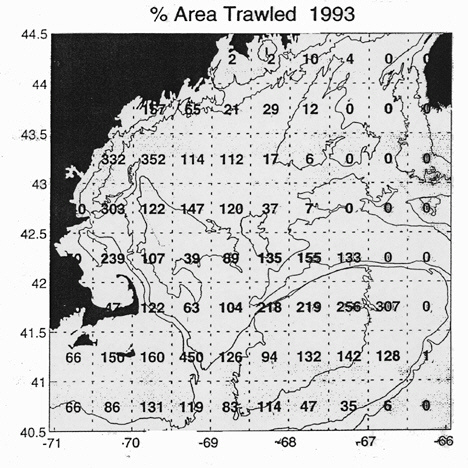
FIGURE B.2 Trawled area in northeast region. Trawled area is expressed as a percentage of the area towed within each statistical block in 1993. Recent data for the region were not available in a similar format. Intense bottom trawling occurred from nearshore to the outer edge of Georges Bank on the extensive continental shelf and slope areas extending east between about 40°30′N and 42°N latitude. Relatively heavy fishing also occurred in the Gulf of Maine. Data for Georges Bank and the Gulf of Maine indicate that in 1993 a number of statistical blocks, 0.5° latitude by 0.5° longitude, were swept 2–5 times a year, and about 56 percent of the area was swept more than once a year (Churchill, 2001). NMFS effort data for the region indicate that close to 4000 fishing days were spent in some 10′ × 10′ statistical blocks from 1991 through 1993.

Suggested Citation:"Appendix B: Regional Distribution of Fishing Effort." National Research Council. 2002. Effects of Trawling and Dredging on Seafloor Habitat. Washington, DC: The National Academies Press. doi: 10.17226/10323.
×

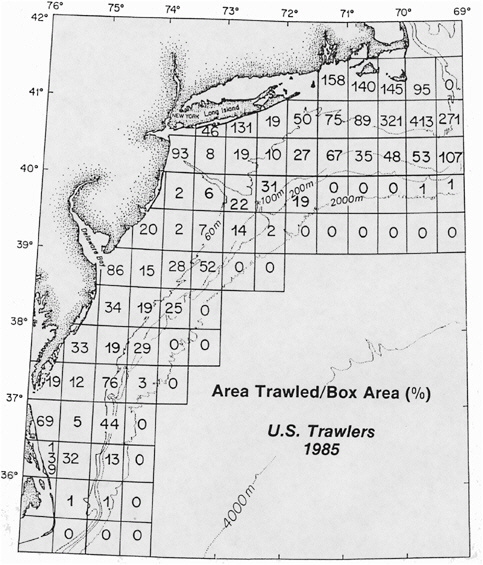
FIGURE B.3 Trawled area in the mid-Atlantic region. Trawled area is expressed as a percentage of the area towed within each statistical block (0.5° latitude by 0.5° longitude) in 1985. Trawl activity declined rapidly south of 39°30′N latitude, and there were no blocks that were swept more than once each year in the southern half of the region. About 32 percent of the area from 40.5°N to 35.5°N was swept during 1985. Trawling effort declined to the south of Long Island and occurred closer to shore as a function of shelf width and slope.

Suggested Citation:"Appendix B: Regional Distribution of Fishing Effort." National Research Council. 2002. Effects of Trawling and Dredging on Seafloor Habitat. Washington, DC: The National Academies Press. doi: 10.17226/10323.
×

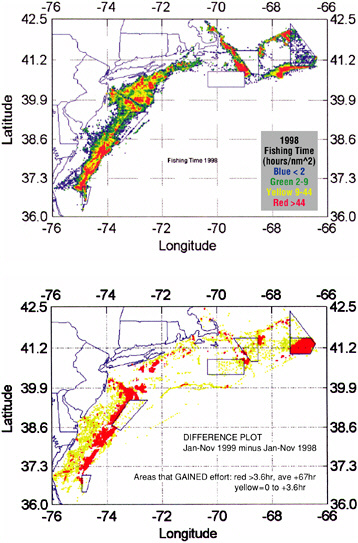
FIGURES B.4 and B.5 Scallop fishing effort off New England and the mid-Atlantic Bight, 1998 and 1999. These figures illustrate the distribution of scallop fishing effort for the years 1998 and 1999 in the New England and mid-Atlantic Bight regions. Although extensive areas of the region were dredged for scallops, the effort was considerably less than the bottom trawl fisheries. Recent data (1999–2000) for the region were not available in a similar format.

Suggested Citation:"Appendix B: Regional Distribution of Fishing Effort." National Research Council. 2002. Effects of Trawling and Dredging on Seafloor Habitat. Washington, DC: The National Academies Press. doi: 10.17226/10323.
×

SOUTH ATLANTIC COAST (FIGURES B.6–B.7)

Fishery data along the southeastern coast of the United States has been collected by different agencies for the past 100 years. NMFS has been involved in fisheries data collection in the region for a considerable period, either as the sole entity, or in cooperation with state agencies. Unfortunately, because of the lack of effective regulations, states have been handicapped and trawl effort data in many instances are not very quantitative. Current estimates of the bottom trawling effort are patchy. Only two states, Florida and North Carolina, have implemented the use of trip tickets, thus improving the collection of effort data. Those two states, along with most of the Atlantic coast states, are developing a coast-wide, unified data collection system. In 1998–1999, there were 15,067 trawl trips by 901 licensed vessels reported off North Carolina.

In recent years more than 900 vessels have been involved in the North Carolina trawl fishery. About 82 percent of shrimp trawl trips during 1994–1997 occurred in estuaries. Occasional catches of shrimp are taken in the ocean areas and offshore vessels land close to a quarter of the state’s shrimp landings. Most of the shrimp and crab trawling along the North Carolina coast occurs close to the beach, generally at depths <18.3 m.

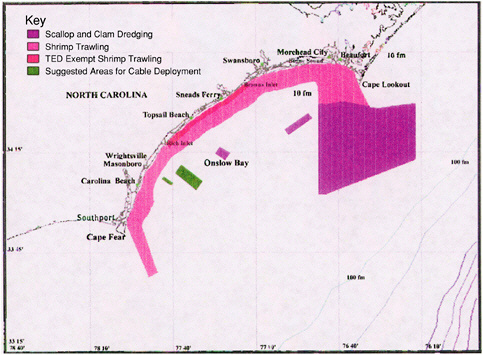
FIGURE B.6 Shrimp trawling and scallop and clam dredging in Onslow Bay. The distribution of trawling, scallop and clam dredging in Onslow Bay, North Carolina, is characteristic of the inshore trawl fisheries along the southeastern Atlantic region. An area between Rich’s Inlet and Brown’s Inlet extending 1 nm offshore is particularly heavily fished because of a special management opportunity. In 1995, 229 shrimp trawlers completed 3190 trips and covered 9570 nm2 of the seabed, about four times the available trawl area (Natural Resources Consultants, 1997).

Suggested Citation:"Appendix B: Regional Distribution of Fishing Effort." National Research Council. 2002. Effects of Trawling and Dredging on Seafloor Habitat. Washington, DC: The National Academies Press. doi: 10.17226/10323.
×

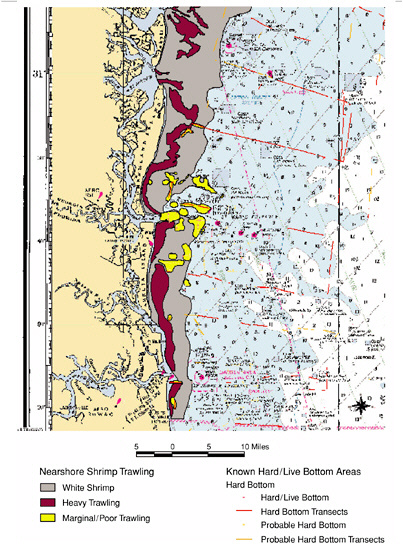
FIGURE B.7 Nearshore shrimp bottom trawling grounds off southeast Georgia. Karma Dunlop (Natural Resources Consultants) interviewed fishermen in Georgia and developed charts showing the relative distribution of shrimp trawling off the southeastern portion of the state. The figure illustrates the proximity of the trawl effort to the shoreline; most of the fishing occurs within four miles of the shoreline. Trawling off South Carolina also is carried out close to shore. During 1999, about 530 vessels were licensed to fish off Georgia.

Suggested Citation:"Appendix B: Regional Distribution of Fishing Effort." National Research Council. 2002. Effects of Trawling and Dredging on Seafloor Habitat. Washington, DC: The National Academies Press. doi: 10.17226/10323.
×

GULF OF MEXICO (FIGURES B.8–B.10)

Although there has been small-scale trawl fishing for finfish for food and industrial purposes in the Gulf, essentially all bottom trawling now is directed at harvesting various species of shrimps. Scallop dredging and trawling also occurs in the region.

NMFS began collecting standardized fishery statistics for the Gulf in l960 (catch, effort, gear, locale) using a shore-based sampling program, that more recently has been coupled with a low-level at-sea observer program. James M. Nance, NMFS Galveston Laboratory, provided the committee with detailed effort data for the Gulf of Mexico. Additional information was provided by Ecological Research Associates, Byran, Texas, a company involved in a voluntary sampling program that uses remote-sensing satellite positioning to track trawling in the Gulf throughout the year. NMFS notes four areas of shrimp bottom trawling concentration, as follows:

  • Subarea 1–3, middle depths off Florida;

  • Subarea 11, middle depths off Mississippi and Alabama;

  • Subareas 13–17, shallow depths off Louisiana (west delta); and

  • Subareas 18–19, shallow and mid-depths off west Texas.

Although the distribution of fishing effort can and does change daily, weekly, and monthly, annual averages over the 1990s did not vary much from one locality to another. Overall the bottom trawl effort declined 41 percent between the 1991–1993 and 1998–1999 periods. However, the Gulf of Mexico is still one of the most intensely bottom trawled areas off the United States. It has been noted (Sheridan, 2001) that the effort in some statistical blocks translates into a block area swept 37–75 times per year.

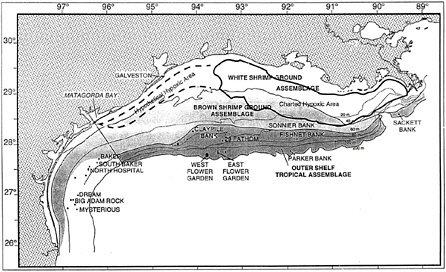
FIGURE B.8 Major shrimp grounds and faunal assemblages on continental shelf adjacent to Texas and Louisiana. This figure illustrates the major white and brown shrimp grounds, located primarily in the western Gulf, off the coasts of Louisiana and Texas. White shrimp typically are found in shallower nearshore waters.

Suggested Citation:"Appendix B: Regional Distribution of Fishing Effort." National Research Council. 2002. Effects of Trawling and Dredging on Seafloor Habitat. Washington, DC: The National Academies Press. doi: 10.17226/10323.
×

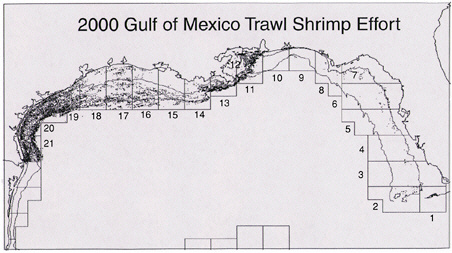
FIGURE B.9 Shrimp trawling effort distribution in the Gulf of Mexico. The distribution of shrimp trawling throughout the Gulf of Mexico in 2000 is based on passive “black box” positioning information obtained by Ecological Research Associates. The data were collected from vessel owners who volunteered to place positioning devices on their vessels. The graphic depiction represents only a small fraction of the total fishing effort. Nevertheless, the data provide a general picture of the major trawling areas.

Suggested Citation:"Appendix B: Regional Distribution of Fishing Effort." National Research Council. 2002. Effects of Trawling and Dredging on Seafloor Habitat. Washington, DC: The National Academies Press. doi: 10.17226/10323.
×

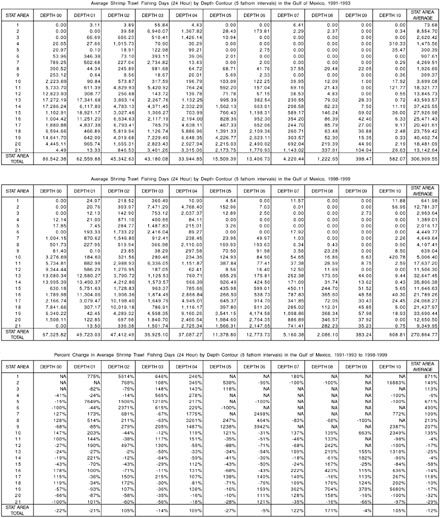
FIGURE B.10 Shrimp trawl effort (days fished) in the Gulf of Mexico: Comparison of 1991–1993 and 1998–1999 effort by depth and statistical area. These tables provide data on the average number of 24-hour days fished in each of the 21 statistical areas and 10 depth zones in the Gulf of Mexico for 1991–1993 and 1998–1999. For the earlier period an average of 306,909 24-hour fishing days was expended per year. In 1998–1999, this decreased to an average of 270,864 24-hour days per year. Although the greatest portion of the fishing effort in both periods occurred in the shallower depths, 0–20 m, the intensity of trawling per unit area has not always followed the same pattern.

Suggested Citation:"Appendix B: Regional Distribution of Fishing Effort." National Research Council. 2002. Effects of Trawling and Dredging on Seafloor Habitat. Washington, DC: The National Academies Press. doi: 10.17226/10323.
×

ALASKA (FIGURES B.11–B.32)

Data and graphs for the Alaska region were provided to the committee by Alaska Fisheries Science Center, NMFS. The data were based on observer records. Rebecca F. Reuter (Alaska Fisheries Science Center) and Cathy Coon (North Pacific Fisheries Management Council) compiled and summarized the data and provided supporting text. Jonathan Heifetz of the Auke Bay Laboratory, NMFS, provided data on the total trawl effort. Only fishery data from hauls taken when observers were onboard were included. Catcher processors and catcher vessels were included in the data summaries discussed below. Vessels longer than 38 m had 100 percent observer coverage while vessels 20– 38 m had 30 percent coverage. Thus, the smaller vessels are underrepresented in the effort distribution charts. No information was available for vessels less than 20 m.

Regardless, the observed tows are assumed to be representative of the general distribution of the total bottom fishing effort. Only the endpoints of each tow were used to summarize the data for the maps, so the lengths of the tows are not represented in the grid, and some tows extend across several grids. The trawling effort data do not include the pollock fishery, because this fishery converted to pelagic trawl gear starting in 1990 (Box 6.1). It is known that during some midwater trawling, the footrope will make contact with the seabed. However, the amount of bottom contact and the effects of that gear on the seafloor are unknown.

Over large portions of the Bering Sea (about 94,000 km2 total) there were either no observed bottom trawls or about four observed tows (averaged over two years) per 25 km2 cell per year in 1999 and 2000 (FigureB.24). In the Gulf of Alaska also, there was a reduction in the number of observed tows and in the intensity of trawling in many of the geographic cells. Closed areas, less productive grounds, and unobserved tows are responsible for much of the untrawled area. The relatively low intensity of trawling (compared with other regions of the United States) over a large part of the Bering Sea reflects the distribution of flounder populations in time and space over much of the large flats that extend out to near the continental break, the relatively high catch rate for the harvested species, and unobserved tows and the growing use of midwater trawls. Within any year there are open and closed seasons, limiting bottom trawling to only a portion of the year.

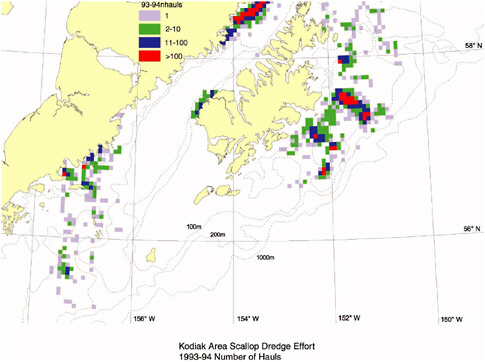
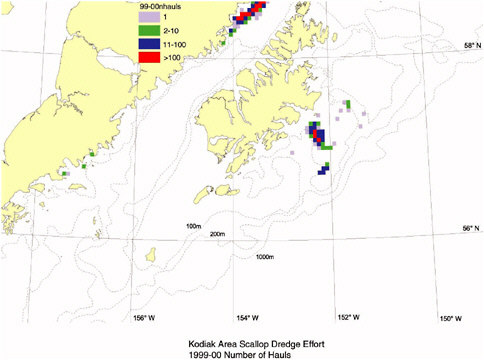
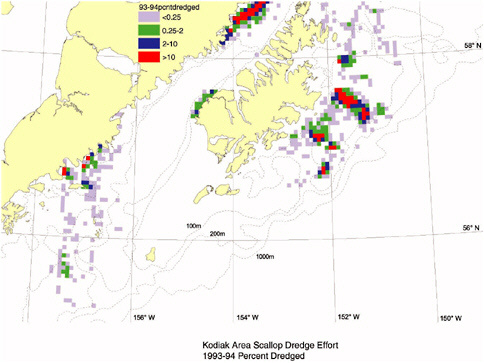
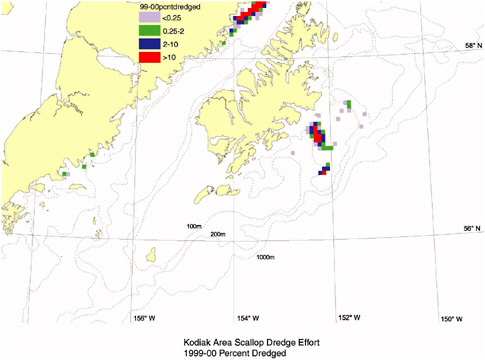
Small-scale scallop dredging occurs in several areas in the Gulf of Alaska and the Bering Sea, and a beam trawl fishery for shrimp occurs in the inside waters of southeastern Alaska, near Petersburg (Figures B.25B.32). The Alaska Department of Fish and Game has maintained excellent records of the state’s distribution and intensity of scallop dredging.

Suggested Citation:"Appendix B: Regional Distribution of Fishing Effort." National Research Council. 2002. Effects of Trawling and Dredging on Seafloor Habitat. Washington, DC: The National Academies Press. doi: 10.17226/10323.
×

FIGURE B.11 Percentage of total tows by depth interval for the Bering Sea, Gulf of Alaska, and Aleutian Islands. For the 1991–1994 and 1999–2000 periods, most of the observed bottom trawl effort took place on the continental shelf, generally in waters shallower than 101 m. Most of the trawling in the Bering Sea occurred at even shallower depths (<50 m). In the Gulf of Alaska and the Aleutian Islands, most trawling occurred at 51–100 m; and some occurred well down the slope—almost to depths of 500 m off the Aleutian Islands, where the shelf is narrow.

Suggested Citation:"Appendix B: Regional Distribution of Fishing Effort." National Research Council. 2002. Effects of Trawling and Dredging on Seafloor Habitat. Washington, DC: The National Academies Press. doi: 10.17226/10323.
×

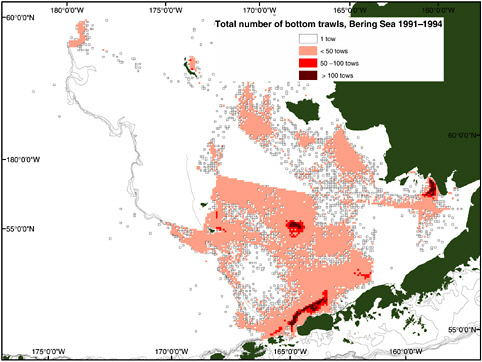
FIGURE B.12 Bottom trawl tows in the Bering Sea, 1991–1994. The cumulative number of trawl tows (1991–1994) within each 25 km2 statistical block are mapped 25 km2 grid for the Bering Sea. Therefore, the average number of tows per year is about one-fourth the values shown. Even during this period of relatively heavy bottom trawling, tows were not observed for large areas of the Bering Sea.

Suggested Citation:"Appendix B: Regional Distribution of Fishing Effort." National Research Council. 2002. Effects of Trawling and Dredging on Seafloor Habitat. Washington, DC: The National Academies Press. doi: 10.17226/10323.
×

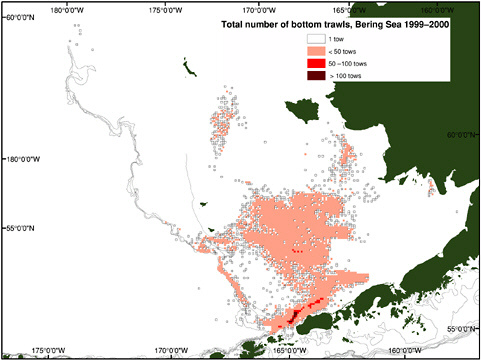
FIGURE B.13 Bottom trawl tows in the Bering Sea, 1999–2000. The effort distribution data for 1999–2000 shows that the total trawl effort declined toward the end of the decade. The average number of observed tows per year in the Bering Sea during the first half of the decade (1991–1994) was 18,925; at the end of the decade (1999–2000) the average was 13,266. This presumes that the sampling effort by vessel classes was similar between periods. There was a reduction in the number of fished cells compared to the first half of the decade and there was a significant reduction in the number of blocks having tows exceeding 100 per year. The reduction reflects North Pacific Fishery Management Council regulations, including those requiring use of midwater trawl gear.

Suggested Citation:"Appendix B: Regional Distribution of Fishing Effort." National Research Council. 2002. Effects of Trawling and Dredging on Seafloor Habitat. Washington, DC: The National Academies Press. doi: 10.17226/10323.
×

FIGURE B.14 Duration of bottom trawl tows in the Bering Sea, 1991–1994. In the first half of the decade, most of the tows averaged 1–5 hours in length, although for some statistical blocks the average exceeded five hours.

Suggested Citation:"Appendix B: Regional Distribution of Fishing Effort." National Research Council. 2002. Effects of Trawling and Dredging on Seafloor Habitat. Washington, DC: The National Academies Press. doi: 10.17226/10323.
×

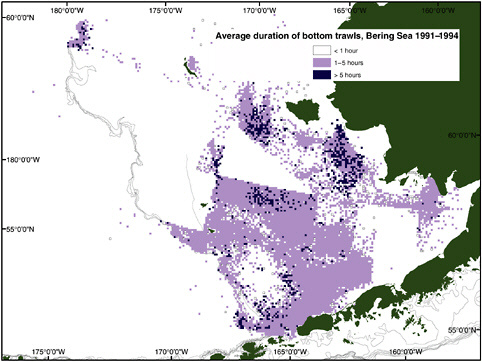
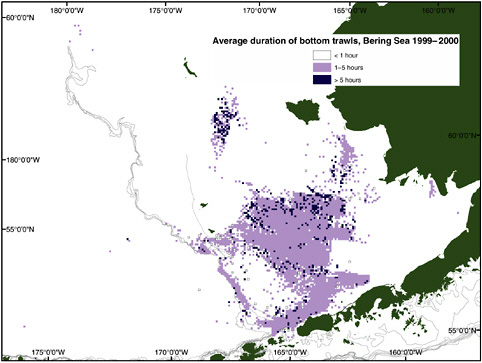
FIGURE B.15 Duration of bottom trawl tows in the Bering Sea, 1999–2000. As in the 1991–1994 period, most of the tows averaged 1–5 hours in length, although for some statistical blocks the average exceeded five hours. There was a dramatic decrease in long duration bottom tows compared to 1991–1994, especially in the northern Bering Sea fishing grounds.

Suggested Citation:"Appendix B: Regional Distribution of Fishing Effort." National Research Council. 2002. Effects of Trawling and Dredging on Seafloor Habitat. Washington, DC: The National Academies Press. doi: 10.17226/10323.
×

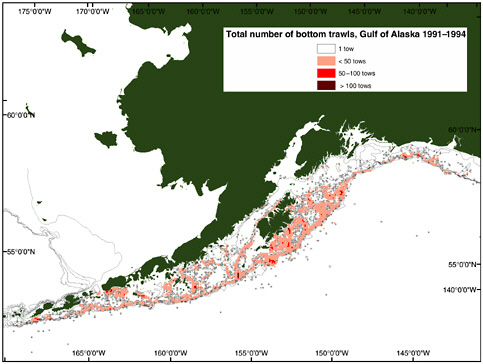
FIGURE B.16 Bottom trawl tows in the Gulf of Alaska, 1991–1994. The Gulf of Alaska does not contain distinct blocks where there were large numbers of hauls relative to the Bering Sea. A few scattered grids show 50–100 tows over the period 1991–1994, but they do not necessarily represent areas where trawling occurred consistently each year.

Suggested Citation:"Appendix B: Regional Distribution of Fishing Effort." National Research Council. 2002. Effects of Trawling and Dredging on Seafloor Habitat. Washington, DC: The National Academies Press. doi: 10.17226/10323.
×

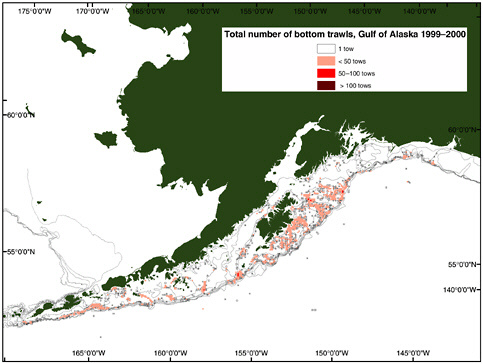
FIGURE B.17 Bottom trawl tows in the Gulf of Alaska, 1999–2000. In the 1999–2000 distribution of tows, the map shows many areas where only one tow occurred, especially within the gullies south of Kodiak Island. In 1999–2000 there were major portions of the shelf and slope that did not have observed tows. The average observed density of trawling in most of the blocks was below 3.25 tows per year (Figure B.24). This reduction in effort, in part, reflects the establishment of no-trawling zones, including the area east of the 140°W longitude line.

Suggested Citation:"Appendix B: Regional Distribution of Fishing Effort." National Research Council. 2002. Effects of Trawling and Dredging on Seafloor Habitat. Washington, DC: The National Academies Press. doi: 10.17226/10323.
×

FIGURE B.18 Duration of bottom trawl tows in the Gulf of Alaska, 1991–1994. The length of tows generally ranged 1–5 hours. The average number of observed tows per year were 6842 in 1991–1994. The total (observed plus non-observed) number of tows per year could be significantly higher.

Suggested Citation:"Appendix B: Regional Distribution of Fishing Effort." National Research Council. 2002. Effects of Trawling and Dredging on Seafloor Habitat. Washington, DC: The National Academies Press. doi: 10.17226/10323.
×

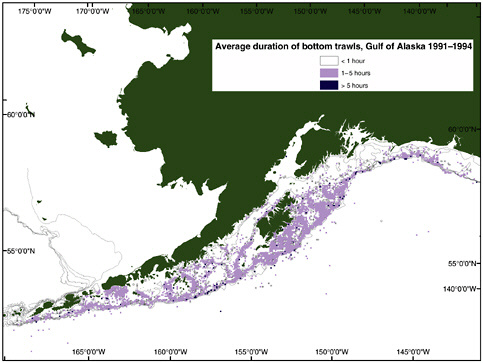
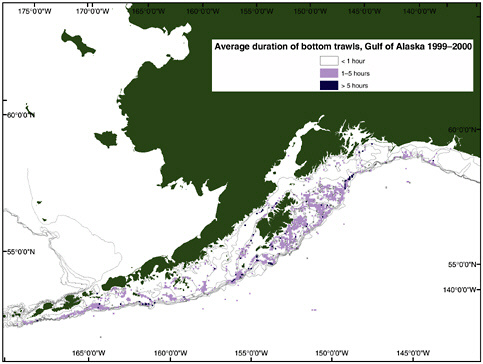
FIGURE B.19 Duration of bottom trawl tows in the Gulf of Alaska, 1999–2000. At the end of the decade, the length of tows generally ranged 1–5 hours. The average number of observed tows per year decreased to 3456 in 1999–2000 compared to 1991–1994. However, the total number of tows per year (observed plus non-observed) could be more than twice these amounts.

Suggested Citation:"Appendix B: Regional Distribution of Fishing Effort." National Research Council. 2002. Effects of Trawling and Dredging on Seafloor Habitat. Washington, DC: The National Academies Press. doi: 10.17226/10323.
×

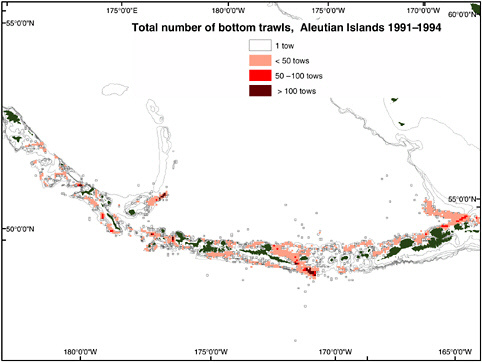
FIGURE B.20 Bottom trawl tows in the Aleutian Islands, 1991–1994. Bottom trawling extends west along the Aleutian Islands from Unimak Island to about 168°E. Trawling intensity is lighter than in the Bering Sea, but distinct concentrations of effort occurred during 1991–1994 in the Sequam Pass area, on Petrel Bank, and off Tanaga Island. There was a relatively large number of single tows for the period, scattered throughout the Aleutian Islands area.

Suggested Citation:"Appendix B: Regional Distribution of Fishing Effort." National Research Council. 2002. Effects of Trawling and Dredging on Seafloor Habitat. Washington, DC: The National Academies Press. doi: 10.17226/10323.
×

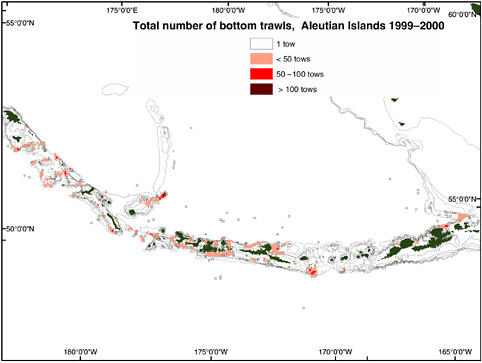
FIGURE B.21 Bottom trawl tows in the Aleutian Islands, 1999–2000. A reduction in bottom trawling effort was observed in 1999–2000. Only a few blocks had more than 100 tows, the number of single-tow blocks declined, and the number of blocks with fewer than 50 tows was greatly reduced. For 1999–2000, no trawling was observed for extensive regions of the shelf and slope. The reduction largely reflects trawl closures intended to protect endangered populations of the Steller sea lion.

Suggested Citation:"Appendix B: Regional Distribution of Fishing Effort." National Research Council. 2002. Effects of Trawling and Dredging on Seafloor Habitat. Washington, DC: The National Academies Press. doi: 10.17226/10323.
×

FIGURE B.22 Duration of bottom trawl tows in the Aleutian Islands, 1991–1994. The duration of most tows was typically 0–5 hours. The average number of observed tows per year during 1991–1994 was 4058.

Suggested Citation:"Appendix B: Regional Distribution of Fishing Effort." National Research Council. 2002. Effects of Trawling and Dredging on Seafloor Habitat. Washington, DC: The National Academies Press. doi: 10.17226/10323.
×

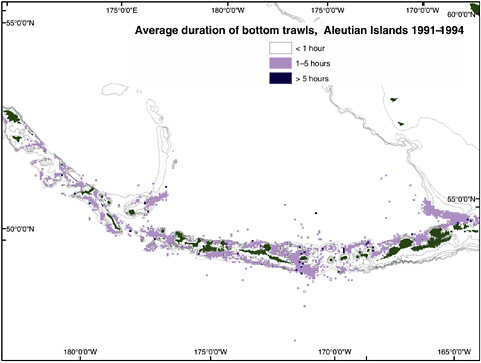
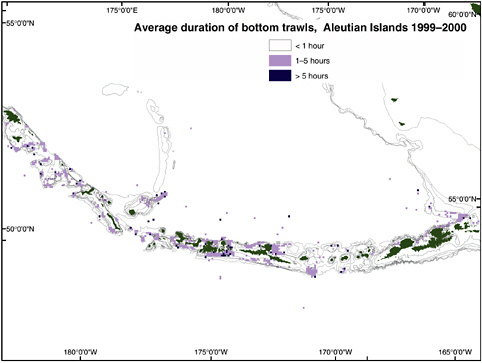
FIGURE B.23 Duration of bottom trawl tows in the Aleutian Islands, 1999–2000. The duration of most tows was typically 0–5 hours. The average number of observed tows per year in 1999–2000 was 2738. It is estimated that only 75 percent of the tows were observed and that the average number of tows during 1999–2000 was 3650.

Suggested Citation:"Appendix B: Regional Distribution of Fishing Effort." National Research Council. 2002. Effects of Trawling and Dredging on Seafloor Habitat. Washington, DC: The National Academies Press. doi: 10.17226/10323.
×

FIGURE B.24 Density of trawl fishing off Alaska. This table summarizes the observed bottom trawl tows for the Bering Sea, Gulf of Alaska, and Aleutian Islands for 1991–1994 and 1999–2000. These data were used to approximate areal coverage and the density of tows.

Suggested Citation:"Appendix B: Regional Distribution of Fishing Effort." National Research Council. 2002. Effects of Trawling and Dredging on Seafloor Habitat. Washington, DC: The National Academies Press. doi: 10.17226/10323.
×

FIGURE B.25 Scallop dredge effort in the eastern Aleutian Islands, 1993–1994. Most of the scallop dredge effort is concentrated in the Bering Sea north of Unimak Pass (northeast of Dutch Harbor). Fishing depths vary, but generally range from 55 m to 128 m.

Suggested Citation:"Appendix B: Regional Distribution of Fishing Effort." National Research Council. 2002. Effects of Trawling and Dredging on Seafloor Habitat. Washington, DC: The National Academies Press. doi: 10.17226/10323.
×

FIGURE B.26 Scallop dredge effort in the eastern Aleutian Islands, 1999–2000. The density distribution of scallop dredge tows is similar to that seen in 1993–1994, but at lower effort levels.

Suggested Citation:"Appendix B: Regional Distribution of Fishing Effort." National Research Council. 2002. Effects of Trawling and Dredging on Seafloor Habitat. Washington, DC: The National Academies Press. doi: 10.17226/10323.
×

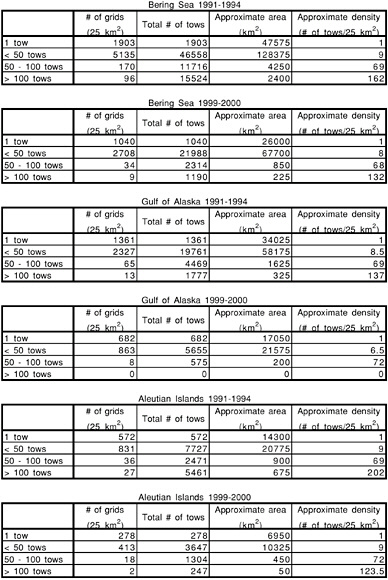
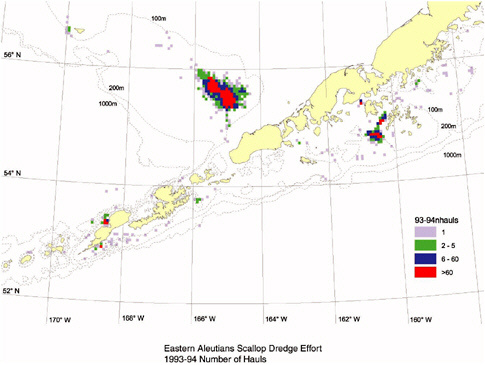
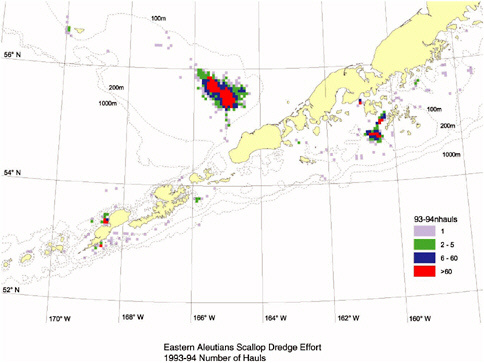
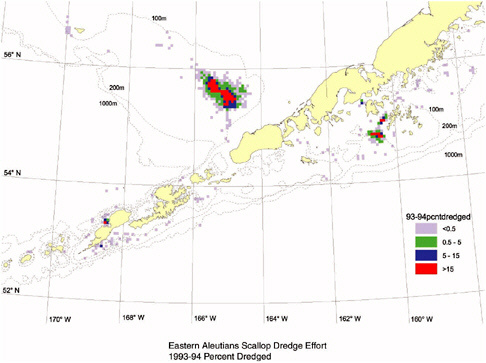
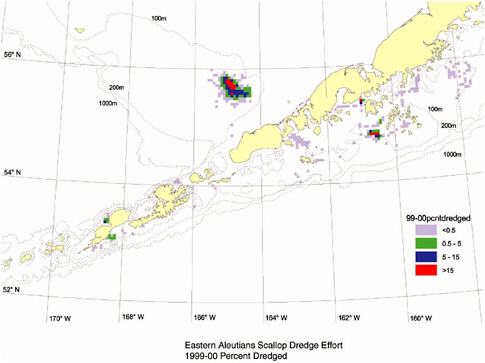
FIGURE B.27 Area dredged in the eastern Aleutian Islands, 1993–1994. The percentage of area in each 25 km2 grid box swept by scallop dredge gear parallels the effort data, showing the highest level of coverage in the area north of Unimak Pass. In most blocks, less than 15 percent of the area is swept by dredge gear.

Suggested Citation:"Appendix B: Regional Distribution of Fishing Effort." National Research Council. 2002. Effects of Trawling and Dredging on Seafloor Habitat. Washington, DC: The National Academies Press. doi: 10.17226/10323.
×

FIGURE B.28 Area dredged in the eastern Aleutian Islands, 1999–2000. This figure shows the reduction in the amount of area swept by dredge gear in 1999–2000 compared relative to 1993–1994.

Suggested Citation:"Appendix B: Regional Distribution of Fishing Effort." National Research Council. 2002. Effects of Trawling and Dredging on Seafloor Habitat. Washington, DC: The National Academies Press. doi: 10.17226/10323.
×

FIGURE B. 29 Scallop dredge effort in the Kodiak Area, 1993–1994. Scallop dredge effort is concentrated in the Gulf of Alaska southeast of Kodiak Island and in the Shelikof Straits close to the mainland between Kodiak Island and the mainland. Most dredging occurs at depths <100 m.

Suggested Citation:"Appendix B: Regional Distribution of Fishing Effort." National Research Council. 2002. Effects of Trawling and Dredging on Seafloor Habitat. Washington, DC: The National Academies Press. doi: 10.17226/10323.
×

FIGURE B.30 Scallop dredge effort in the Kodiak Area, 1999–2000. The density distribution of scallop dredge tows is similar to that seen in 1993–1994, but at lower effort levels.

Suggested Citation:"Appendix B: Regional Distribution of Fishing Effort." National Research Council. 2002. Effects of Trawling and Dredging on Seafloor Habitat. Washington, DC: The National Academies Press. doi: 10.17226/10323.
×

FIGURE B.31 Area dredged in the Kodiak Area, 1993–1994. The percentage of area in each 25 km2 grid box swept by scallop dredge gear shows a similar distribution as the effort data. Few areas have more that 10 percent coverage by scallop dredging.

Suggested Citation:"Appendix B: Regional Distribution of Fishing Effort." National Research Council. 2002. Effects of Trawling and Dredging on Seafloor Habitat. Washington, DC: The National Academies Press. doi: 10.17226/10323.
×

FIGURE B.32 Area dredged in the Kodiak Area, 1999–2000. This figure shows the reduction in the amount of area swept by dredge gear in 1999–2000 compared relative to 1993–1994.

Suggested Citation:"Appendix B: Regional Distribution of Fishing Effort." National Research Council. 2002. Effects of Trawling and Dredging on Seafloor Habitat. Washington, DC: The National Academies Press. doi: 10.17226/10323.
×

CONTIGUOUS WEST COAST STATES (FIGURES B.33–B.37)

Information on the trawling effort off California, Oregon, and Washington was provided by the Natural Resources Consultants, the California Department of Fish and Game, the Oregon Department of Fish and Wildlife, and the Washington Department of Fish and Wildlife. The data were compiled and graphed by Karma Dunlop (Natural Resources Consultants). Oregon and Washington data are 1991–1993 and 1998–1999; California data are 1994–1996. The calculated effort distribution data and the number of tows and duration from all three states are based on log books. Some of the tows are not included in this data set because they could not be geographically resolved to the data cells. Shrimp trawl data are provided for 1979–1999. In August 2001, a compulsory observer program was implemented for California, Oregon, and Washington (Randy Fisher, Pacific State Marine Fisheries Commission, personal communication).

The intensity of trawling off the contiguous West Coast states appears relatively similar for the three states, with perhaps somewhat higher effort occurring off Washington and Oregon (the years for which data have been summarized for Washington, Oregon, and California differ). The average number of tows per year off California during 1994–1996 was 15,535. Although we do not have a 1998–1999 database for California, it is obvious from the Oregon and Washington data that the trawl effort along the West Coast declined sharply between the early 1990s and the latter part of the decade. For example, the number of blocks in the four highest effort categories off Oregon and Washington declined 36 percent, or from 102 to 68 blocks. The decline in effort is demonstrated even more dramatically by the reduction in the average number of tows per year. Between the 1991–1993 and 1998–1999 periods the number of tows declined from 28,489 to 11,487, a reduction of 60 percent in the average number of tows per year. The reduction in effort has followed declines in the abundance of target species and subsequent Pacific Fishery Management Council reductions in quotas and fishing time. The decline continued for all three states in 2000–2001 (Randy Fisher, Pacific State Marine Fisheries Commission, personal communication).

Swept-area information for the region has not been published. To provide an estimate of the affected area, preliminary calculations were performed assuming 3-hour towing times at 3 knots/hour, and a 300-foot door spread. Under these assumptions, one tow would sweep 16.4 million square feet. An average statistical block between 41° and 42° is roughly 71.7 square miles or 2.64 billion square feet. Based on these calculations, it would take about 160 three-hour tows to sweep one statistical block.

Suggested Citation:"Appendix B: Regional Distribution of Fishing Effort." National Research Council. 2002. Effects of Trawling and Dredging on Seafloor Habitat. Washington, DC: The National Academies Press. doi: 10.17226/10323.
×

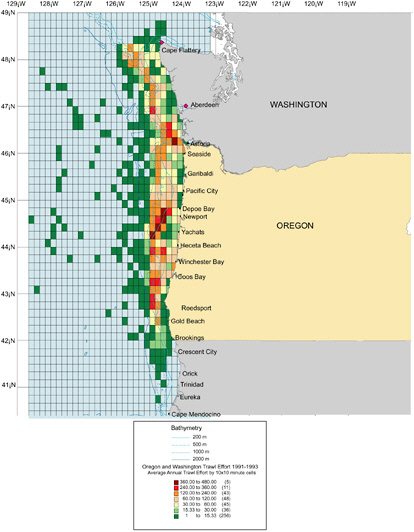
FIGURE B.33 Trawl effort off Oregon and Washington, 1991–1993. The major bottom trawled grounds off Washington are found off Cape Flattery and to the southwest, and from Westport to the Columbia River. The grounds off southern Washington were fished relatively heavily by vessels from Washington and Oregon ports. Off Oregon, the trawl fisheries are concentrated near major fishing ports, such as Astoria, Newport, and Coos Bay. The number of tows located offshore could contain log book errors. No trawling is allowed within 3 nautical miles of shore (state waters).

Suggested Citation:"Appendix B: Regional Distribution of Fishing Effort." National Research Council. 2002. Effects of Trawling and Dredging on Seafloor Habitat. Washington, DC: The National Academies Press. doi: 10.17226/10323.
×

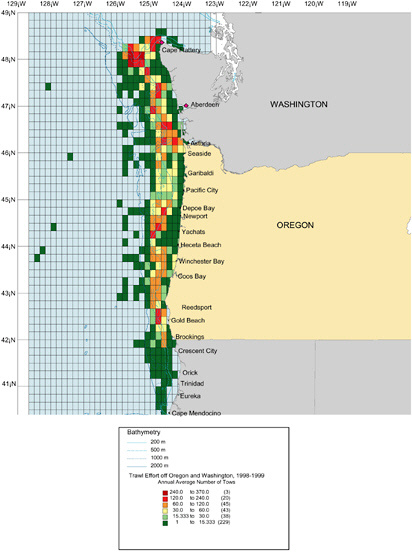
FIGURE B.34 Trawl effort off Oregon and Washington, 1998–1999. Trawl effort decreased in 1998–1999, with some redistribution of the tow density. In Washington greater effort occurs near Cape Flattery and Aberdeen in 1998–1999 relative to earlier in the decade, but effort decreased off most fishing ports in Oregon.

Suggested Citation:"Appendix B: Regional Distribution of Fishing Effort." National Research Council. 2002. Effects of Trawling and Dredging on Seafloor Habitat. Washington, DC: The National Academies Press. doi: 10.17226/10323.
×

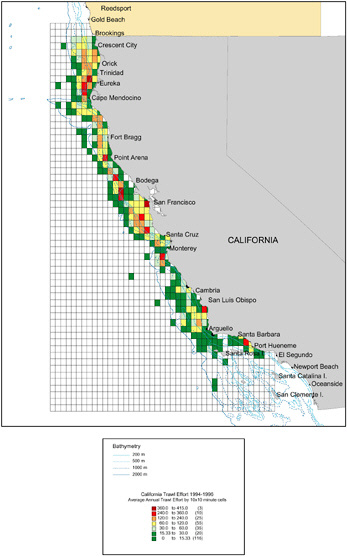
FIGURE B.35 Trawl effort off California, 1994–1996. Important trawl grounds off California, for the most part, are found from Monterey north to the Oregon border, and there is relatively intense fishing between Santa Cruz and San Francisco and between Cape Mendocino and Crescent City. Two relatively heavily fished cells also are reported off Grover City and Ventura. State regulations prohibit trawl fishing on the continental shelf south of El Segundo to the Mexican border, although some trawling occurs on the offshore banks of Southern California. No trawling is allowed within state waters (3 nautical miles).

Suggested Citation:"Appendix B: Regional Distribution of Fishing Effort." National Research Council. 2002. Effects of Trawling and Dredging on Seafloor Habitat. Washington, DC: The National Academies Press. doi: 10.17226/10323.
×

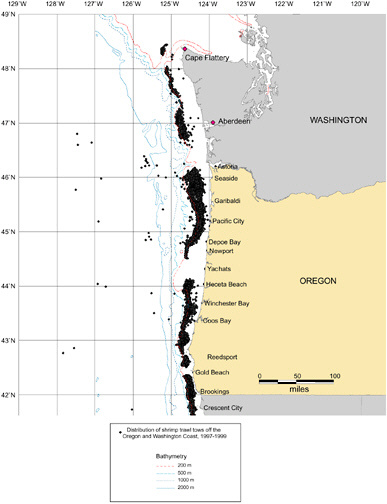
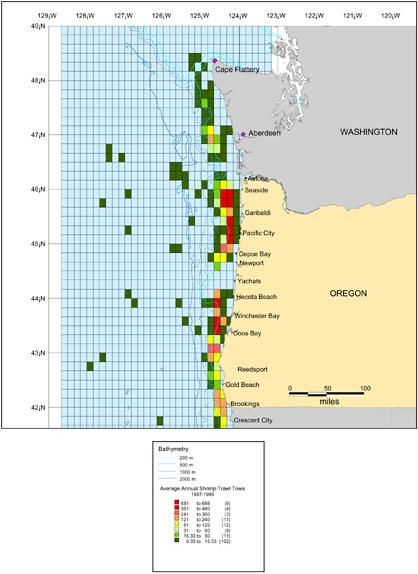
FIGURE B.36 Distribution of shrimp trawls off Oregon and Washington, 1997–1999. There is a significant trawl fishery for northern shrimp. The general distribution of shrimp trawling off Oregon and Washington 1997–1999 is shown. During 1997–1999, an average of 10,000 shrimp tows per year was reported for areas off Oregon and Washington.

Suggested Citation:"Appendix B: Regional Distribution of Fishing Effort." National Research Council. 2002. Effects of Trawling and Dredging on Seafloor Habitat. Washington, DC: The National Academies Press. doi: 10.17226/10323.
×

FIGURE B.37 Density of shrimp trawl effort off Oregon and Washington, 1997–1999. This map shows the range of effort in 10′ × 10′ statistical blocks. The most intensive effort occurs off Oregon in the vicinity of Coos Bay, between Seaside and Garibaldi, and off Pacific City.

Suggested Citation:"Appendix B: Regional Distribution of Fishing Effort." National Research Council. 2002. Effects of Trawling and Dredging on Seafloor Habitat. Washington, DC: The National Academies Press. doi: 10.17226/10323.
×

DECLINE IN TRAWL EFFORT (FIGURE B.38)

Although scientists do not have trawl effort data for all NMFS regions, sufficient data are available to document a considerable decline in trawling in Alaska, Oregon and Washington, and the Gulf of Mexico between the early 1990s (1991–1994) and later in the decade (1998–2000).

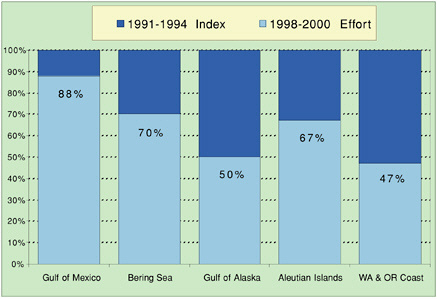
FIGURE B.38 Trawl effort for U.S. trawl fisheries by region, 1991–1994 and 1998–2000. Although scientists do not have trawl effort data for all NMFS regions, sufficient data is available to document a decline in trawling in Alaska, Oregon and Washington, and the Gulf of Mexico between the early 1990s (1991–1994) and later in the decade (1998–2000). The percentage decline in fishing effort (number of tows or fishing days) were calculated for the Gulf of Mexico, Bering Sea, Gulf of Alaska, Aleutian Islands, and Washington and Oregon. The 1998–2000 effort is depicted relative to the effort level in the 1991–1994 period.

NOTE: With regard to this figure, a statement within the text needs to be changed. On page 44 (column two, first sentence), the sentence beginning “Comparing the two periods…” should read “…declined 12 percent…” (instead of 41 percent).

Suggested Citation:"Appendix B: Regional Distribution of Fishing Effort." National Research Council. 2002. Effects of Trawling and Dredging on Seafloor Habitat. Washington, DC: The National Academies Press. doi: 10.17226/10323.
×
Page 80
Suggested Citation:"Appendix B: Regional Distribution of Fishing Effort." National Research Council. 2002. Effects of Trawling and Dredging on Seafloor Habitat. Washington, DC: The National Academies Press. doi: 10.17226/10323.
×
Page 81
Suggested Citation:"Appendix B: Regional Distribution of Fishing Effort." National Research Council. 2002. Effects of Trawling and Dredging on Seafloor Habitat. Washington, DC: The National Academies Press. doi: 10.17226/10323.
×
Page 82
Suggested Citation:"Appendix B: Regional Distribution of Fishing Effort." National Research Council. 2002. Effects of Trawling and Dredging on Seafloor Habitat. Washington, DC: The National Academies Press. doi: 10.17226/10323.
×
Page 83
Suggested Citation:"Appendix B: Regional Distribution of Fishing Effort." National Research Council. 2002. Effects of Trawling and Dredging on Seafloor Habitat. Washington, DC: The National Academies Press. doi: 10.17226/10323.
×
Page 84
Suggested Citation:"Appendix B: Regional Distribution of Fishing Effort." National Research Council. 2002. Effects of Trawling and Dredging on Seafloor Habitat. Washington, DC: The National Academies Press. doi: 10.17226/10323.
×
Page 85
Suggested Citation:"Appendix B: Regional Distribution of Fishing Effort." National Research Council. 2002. Effects of Trawling and Dredging on Seafloor Habitat. Washington, DC: The National Academies Press. doi: 10.17226/10323.
×
Page 86
Suggested Citation:"Appendix B: Regional Distribution of Fishing Effort." National Research Council. 2002. Effects of Trawling and Dredging on Seafloor Habitat. Washington, DC: The National Academies Press. doi: 10.17226/10323.
×
Page 87
Suggested Citation:"Appendix B: Regional Distribution of Fishing Effort." National Research Council. 2002. Effects of Trawling and Dredging on Seafloor Habitat. Washington, DC: The National Academies Press. doi: 10.17226/10323.
×
Page 88
Suggested Citation:"Appendix B: Regional Distribution of Fishing Effort." National Research Council. 2002. Effects of Trawling and Dredging on Seafloor Habitat. Washington, DC: The National Academies Press. doi: 10.17226/10323.
×
Page 89
Suggested Citation:"Appendix B: Regional Distribution of Fishing Effort." National Research Council. 2002. Effects of Trawling and Dredging on Seafloor Habitat. Washington, DC: The National Academies Press. doi: 10.17226/10323.
×
Page 90
Suggested Citation:"Appendix B: Regional Distribution of Fishing Effort." National Research Council. 2002. Effects of Trawling and Dredging on Seafloor Habitat. Washington, DC: The National Academies Press. doi: 10.17226/10323.
×
Page 91
Suggested Citation:"Appendix B: Regional Distribution of Fishing Effort." National Research Council. 2002. Effects of Trawling and Dredging on Seafloor Habitat. Washington, DC: The National Academies Press. doi: 10.17226/10323.
×
Page 92
Suggested Citation:"Appendix B: Regional Distribution of Fishing Effort." National Research Council. 2002. Effects of Trawling and Dredging on Seafloor Habitat. Washington, DC: The National Academies Press. doi: 10.17226/10323.
×
Page 93
Suggested Citation:"Appendix B: Regional Distribution of Fishing Effort." National Research Council. 2002. Effects of Trawling and Dredging on Seafloor Habitat. Washington, DC: The National Academies Press. doi: 10.17226/10323.
×
Page 94
Suggested Citation:"Appendix B: Regional Distribution of Fishing Effort." National Research Council. 2002. Effects of Trawling and Dredging on Seafloor Habitat. Washington, DC: The National Academies Press. doi: 10.17226/10323.
×
Page 95
Suggested Citation:"Appendix B: Regional Distribution of Fishing Effort." National Research Council. 2002. Effects of Trawling and Dredging on Seafloor Habitat. Washington, DC: The National Academies Press. doi: 10.17226/10323.
×
Page 96
Suggested Citation:"Appendix B: Regional Distribution of Fishing Effort." National Research Council. 2002. Effects of Trawling and Dredging on Seafloor Habitat. Washington, DC: The National Academies Press. doi: 10.17226/10323.
×
Page 97
Suggested Citation:"Appendix B: Regional Distribution of Fishing Effort." National Research Council. 2002. Effects of Trawling and Dredging on Seafloor Habitat. Washington, DC: The National Academies Press. doi: 10.17226/10323.
×
Page 98
Suggested Citation:"Appendix B: Regional Distribution of Fishing Effort." National Research Council. 2002. Effects of Trawling and Dredging on Seafloor Habitat. Washington, DC: The National Academies Press. doi: 10.17226/10323.
×
Page 99
Suggested Citation:"Appendix B: Regional Distribution of Fishing Effort." National Research Council. 2002. Effects of Trawling and Dredging on Seafloor Habitat. Washington, DC: The National Academies Press. doi: 10.17226/10323.
×
Page 100
Suggested Citation:"Appendix B: Regional Distribution of Fishing Effort." National Research Council. 2002. Effects of Trawling and Dredging on Seafloor Habitat. Washington, DC: The National Academies Press. doi: 10.17226/10323.
×
Page 101
Suggested Citation:"Appendix B: Regional Distribution of Fishing Effort." National Research Council. 2002. Effects of Trawling and Dredging on Seafloor Habitat. Washington, DC: The National Academies Press. doi: 10.17226/10323.
×
Page 102
Suggested Citation:"Appendix B: Regional Distribution of Fishing Effort." National Research Council. 2002. Effects of Trawling and Dredging on Seafloor Habitat. Washington, DC: The National Academies Press. doi: 10.17226/10323.
×
Page 103
Suggested Citation:"Appendix B: Regional Distribution of Fishing Effort." National Research Council. 2002. Effects of Trawling and Dredging on Seafloor Habitat. Washington, DC: The National Academies Press. doi: 10.17226/10323.
×
Page 104
Suggested Citation:"Appendix B: Regional Distribution of Fishing Effort." National Research Council. 2002. Effects of Trawling and Dredging on Seafloor Habitat. Washington, DC: The National Academies Press. doi: 10.17226/10323.
×
Page 105
Suggested Citation:"Appendix B: Regional Distribution of Fishing Effort." National Research Council. 2002. Effects of Trawling and Dredging on Seafloor Habitat. Washington, DC: The National Academies Press. doi: 10.17226/10323.
×
Page 106
Suggested Citation:"Appendix B: Regional Distribution of Fishing Effort." National Research Council. 2002. Effects of Trawling and Dredging on Seafloor Habitat. Washington, DC: The National Academies Press. doi: 10.17226/10323.
×
Page 107
Suggested Citation:"Appendix B: Regional Distribution of Fishing Effort." National Research Council. 2002. Effects of Trawling and Dredging on Seafloor Habitat. Washington, DC: The National Academies Press. doi: 10.17226/10323.
×
Page 108
Suggested Citation:"Appendix B: Regional Distribution of Fishing Effort." National Research Council. 2002. Effects of Trawling and Dredging on Seafloor Habitat. Washington, DC: The National Academies Press. doi: 10.17226/10323.
×
Page 109
Suggested Citation:"Appendix B: Regional Distribution of Fishing Effort." National Research Council. 2002. Effects of Trawling and Dredging on Seafloor Habitat. Washington, DC: The National Academies Press. doi: 10.17226/10323.
×
Page 110
Suggested Citation:"Appendix B: Regional Distribution of Fishing Effort." National Research Council. 2002. Effects of Trawling and Dredging on Seafloor Habitat. Washington, DC: The National Academies Press. doi: 10.17226/10323.
×
Page 111
Suggested Citation:"Appendix B: Regional Distribution of Fishing Effort." National Research Council. 2002. Effects of Trawling and Dredging on Seafloor Habitat. Washington, DC: The National Academies Press. doi: 10.17226/10323.
×
Page 112
Suggested Citation:"Appendix B: Regional Distribution of Fishing Effort." National Research Council. 2002. Effects of Trawling and Dredging on Seafloor Habitat. Washington, DC: The National Academies Press. doi: 10.17226/10323.
×
Page 113
Suggested Citation:"Appendix B: Regional Distribution of Fishing Effort." National Research Council. 2002. Effects of Trawling and Dredging on Seafloor Habitat. Washington, DC: The National Academies Press. doi: 10.17226/10323.
×
Page 114
Suggested Citation:"Appendix B: Regional Distribution of Fishing Effort." National Research Council. 2002. Effects of Trawling and Dredging on Seafloor Habitat. Washington, DC: The National Academies Press. doi: 10.17226/10323.
×
Page 115
Suggested Citation:"Appendix B: Regional Distribution of Fishing Effort." National Research Council. 2002. Effects of Trawling and Dredging on Seafloor Habitat. Washington, DC: The National Academies Press. doi: 10.17226/10323.
×
Page 116
Suggested Citation:"Appendix B: Regional Distribution of Fishing Effort." National Research Council. 2002. Effects of Trawling and Dredging on Seafloor Habitat. Washington, DC: The National Academies Press. doi: 10.17226/10323.
×
Page 117
Suggested Citation:"Appendix B: Regional Distribution of Fishing Effort." National Research Council. 2002. Effects of Trawling and Dredging on Seafloor Habitat. Washington, DC: The National Academies Press. doi: 10.17226/10323.
×
Page 118
Suggested Citation:"Appendix B: Regional Distribution of Fishing Effort." National Research Council. 2002. Effects of Trawling and Dredging on Seafloor Habitat. Washington, DC: The National Academies Press. doi: 10.17226/10323.
×
Page 119
Next: Appendix C: Mapping Tools »
Effects of Trawling and Dredging on Seafloor Habitat Get This Book
×
Buy Paperback | $53.00 Buy Ebook | $42.99
MyNAP members save 10% online.
Login or Register to save!
Download Free PDF

Concerns over the potential ecological effects of fishing have increased with the expansion of fisheries throughout the marine waters of the United States. Effects of Trawling and Dredging on Seafloor Habitat describes how assessment of fishing impacts depends on gear type, number and location of bottom tows, and the physical and biological characteristics of seafloor habitats. Many experimental studies have documented acute, gear--specific effects of trawling and dredging on various types of habitat. These studies indicate that low mobility, long--lived species are more vulnerable to towed fishing gear than short--lived species in areas where the seabed is often disturbed by natural phenomena. Trawling and dredging may also change the composition and productivity of fish communities dependent on seafloor habitats for food and refuge. The scale of these impacts depends on the level of fishing effort. This volume presents color maps of fishing effort for all regions with significant bottom trawl or dredge fisheries -- the first time that such data has been assembled and analyzed for the entire nation.

  1. ×

    Welcome to OpenBook!

    You're looking at OpenBook, NAP.edu's online reading room since 1999. Based on feedback from you, our users, we've made some improvements that make it easier than ever to read thousands of publications on our website.

    Do you want to take a quick tour of the OpenBook's features?

    No Thanks Take a Tour »
  2. ×

    Show this book's table of contents, where you can jump to any chapter by name.

    « Back Next »
  3. ×

    ...or use these buttons to go back to the previous chapter or skip to the next one.

    « Back Next »
  4. ×

    Jump up to the previous page or down to the next one. Also, you can type in a page number and press Enter to go directly to that page in the book.

    « Back Next »
  5. ×

    Switch between the Original Pages, where you can read the report as it appeared in print, and Text Pages for the web version, where you can highlight and search the text.

    « Back Next »
  6. ×

    To search the entire text of this book, type in your search term here and press Enter.

    « Back Next »
  7. ×

    Share a link to this book page on your preferred social network or via email.

    « Back Next »
  8. ×

    View our suggested citation for this chapter.

    « Back Next »
  9. ×

    Ready to take your reading offline? Click here to buy this book in print or download it as a free PDF, if available.

    « Back Next »
Stay Connected!