
4
Rolling Resistance, Traction, and Wear Performance of Passenger Tires
Tires have two basic operating functions in addition to carrying the weight of the vehicle: they mitigate shocks from the road surface and provide the longitudinal and lateral control forces for vehicle acceleration, steering, and braking.1 All tires perform these functions, but not equally well. Some provide more friction for traction on dry surfaces, while others offer more traction in rain, snow, and mud. Some provide lower spring rates and more damping for shock mitigation, while others are stiffer for tighter cornering and general maneuverability. Of course, many other attributes are demanded of tires. As discussed in Chapter 3, good fuel economy performance is one. Others include low noise, slow wear, and durability and structural integrity at high speeds. Styling is especially important for some tire lines. Some of these attributes have little bearing on a tire’s operating functions, but they are often key design considerations. Like other consumer products, tires are engineered in various ways to meet an assortment of operating requirements and user expectations and preferences.
Chapter 3 examined the effects of tire design, construction, and operational influences on rolling resistance, which was then related to vehicle fuel consumption. A complex picture of the numerous factors affecting tire rolling resistance and fuel economy emerged. Among the factors are tire geometry, tread compounds, inflation pressure, alignment, operating temperature, load, and tire construction type. Moreover, a change in any one of these variables was found to affect other variables, which leads to a chain of effects on rolling resistance and other tire characteristics. The
statement of task for this study calls for an examination of these many relationships.
The statement of task also calls for the study to address factors that can affect vehicle safety and scrap tire generation. There is a public interest in tire safety and scrap tire generation, as there is in fuel economy. Some 40,000 motorists die in highway crashes each year, most in passenger cars and light trucks. Thousands more are critically injured. Improving the safety performance of the nation’s highways is a public safety goal. During the past two decades, concerns about the environmental effects of tires, particularly the disposal of scrap tires, have also emerged. While aggressive recycling programs have reduced the entry of tires into the waste stream, the large number of tires discarded each year poses a continuing mitigation challenge.
The rolling resistance, traction, and wear characteristics of tires are not independent of one another, if for no other reason than their association with the tire’s tread. As explained earlier, the tread has a major influence on rolling resistance because it contains much of the viscoelastic rubber in the tire that causes hysteretic energy loss. The same tread deformation contributes to the tire’s traction capabilities. A loss in traction capability because of tread wear is the main reason for tire replacement. When the tread wears and traction capabilities are diminished beyond a point deemed acceptable for safe operation, especially in wet and snow conditions, the tire is normally scrapped—and thus becomes a candidate for the waste stream.
Years of tire testing and experimentation have helped tire manufacturers understand the chemical and physical relationships that affect tire traction, wear resistance, and rolling resistance. This has led to a growing appreciation—but still limited understanding—of how such factors relate to the practical outcomes of vehicle fuel consumption, crash incidence, and tire service life. Data sets examined in Chapter 3 show how rolling resistance can differ significantly from tire to tire and how these differences can translate into differentials in vehicle fuel consumption. The same data sets can be examined to gain a better understanding of the relationships among rolling resistance and other tire performance characteristics, including traction and wear resistance. The results of several statistical analyses of the available data sets are therefore presented in this chapter to explain these relationships.
Consideration is first given to traction effects, including implications for vehicle safety. Tread wear factors and their implications for scrap tires are then considered. In both cases, the paucity of public data limits the analyses and a broad extrapolation of the results. Whereas the rolling resistance coefficient (RRC) is a standard metric for characterizing and comparing tire energy performance, less comprehensive data exist in the public domain for accurate characterizations of tire traction and wear resistance. The federal Uniform Tire Quality Grading (UTQG) system ratings for traction and tread wear are the only metrics for which consistent data are widely available for a range of tires. These metrics are less precise than measures of RRC and provide only a partial indication of the underlying characteristics they seek to describe. Nevertheless, in combination with data on other tire properties, such as tread depth, their analysis can be helpful in identifying potential relationships and highlighting factors warranting further examination.
EFFECTS ON TRACTION AND SAFETY PERFORMANCE
Most data on the involvement of tires in motor vehicle crashes cover tire structural failures, as opposed to the safety role of specific tire operating characteristics such as traction. Analyses of federal motor vehicle crash data indicate that tire problems such as flats, ruptures, and component separations contribute to about 24,000 tow-away crashes per year, or about 0.5 percent of all such crashes (NHTSA 2005, IV-7–IV-8; Gardner and Queiser 2005). The National Highway Traffic Safety Administration (NHTSA) estimates that these crashes result in 400 to 650 fatalities and about 10,000 nonfatal injuries in total. Thus the number of fatalities attributable to crashes caused by damaged tires is small, especially in comparison with the 40,000 deaths in motor crashes each year.2 Service failures, however, do not necessarily indicate that a tire is inherently defective or unsafe (Gardner and Queiser 2005). Poor tire and wheel maintenance, such as low inflation pressure, improper mounting, and misalignment, can also precipitate failures in any tire.
The focus of federal safety regulations is on preventing tire structural failures that can cause the driver to lose control of the vehicle. As described in Chapter 2, the regulations prescribe a series of tests ensuring minimum tire strength, resistance to high-speed overheating, endurance, and— starting in 2007—low-pressure performance. All passenger tires must meet these minima. In practice, most tires on the market, if not all, will surpass them and offer safety margins in excess of those sought by federal regulation. In considering the safety of tires with low rolling resistance, a natural question is whether vehicles equipped with them exhibit disproportionate crash involvement because of tire structural failures. There is no apparent reason to suspect such an association, but in any case, national crash data cannot provide an answer because the rolling resistance of a tire at a crash scene cannot be determined.
More germane to this study is whether reducing tire rolling resistance will lead to changes in tire properties that are related to vehicle handling and control and thus could affect crash incidence and severity. A vehicle’s tires are its only points of contact with the road. They generate all the forces that control its motion and direction, and a tire’s properties clearly could be a factor in motor vehicle crashes and their avoidance. However, at what point a change in tire traction characteristics will lead to measurable changes in crash incidence and severity is unknown.
Through its National Accident Sampling System Crashworthiness Data System (NASS/CDS), NHTSA conducts detailed investigations of approximately 4,000 light vehicle crashes per year. The sample consists of police-reported crashes, which are examined for the purpose of national extrapolation. NHTSA investigators study the vehicles involved in the crash 1 to 60 days after the event. Recently, NHTSA added several tire-related elements to NASS/CDS. For vehicles involved in the sampled crashes, the investigators record the vehicle manufacturer’s recommended tire size, construction, and inflation pressure. They also record the make, model, size, and type of tires used on the vehicle (although U.S. Department of Transportation tire identification numbers are not recorded); measure and record the depth of the tires’ treads and inflation pressures; and record whether one or more of the tires exhibited damage and the type of damage (i.e., sidewall puncture, tread separa-
tion). Data for 2002 and 2003, which are the first full years to contain the tire details, will be released in 2006. The coverage and quality of the tire-related data have yet to be examined. The time lapse between the crash event and follow-up investigation may limit the usefulness of some of the data elements such as recorded tire pressure.
With the NASS/CDS infrastructure, NHTSA is also undertaking a national survey of passenger vehicle crashes in which investigators are mobilized to the scene of a sampled crash to obtain more timely information on the event and factors involved. The data gathered in this project, known as the National Motor Vehicle Crash Causation Survey, are intended to help identify opportunities to improve crash avoidance systems and technologies. For each vehicle involved in the crash, investigators record the Department of Transportation serial numbers on the tires if they are visible. Tire inflation pressure, tread depth, and visible evidence of damage are also recorded. Results from the first 3,000 to 4,000 crashes surveyed will be released in 2006.
As the tire-related information from these NHTSA data sets becomes available in sufficient quantity and quality, it may prove helpful in monitoring and evaluating aspects of tire safety performance. Whether the data can eventually be used to detect the safety effects associated with differentials in specific tire design and construction characteristics such as traction is unclear. Earlier uses of these data will likely be in studies of tire structural performance, inflation pressure, and aging.
NHTSA has not established safety-related standards for tire operating characteristics, such as traction, resistance to hydroplaning, and cornering capability. Instead, the agency provides consumers with related information through the UTQG system. Tires are graded for wet traction, temperature resistance, and tread wear. However, these grades are not safety ratings, and NHTSA has not studied how they relate to tire and motor vehicle safety performance in the field.
The most recent major federal legislation covering passenger tires was the Tire Recall Enhancement, Accountability, and Documentation Act of 2000 (TREAD Act). Provisions in the act have prompted NHTSA to assess the effects of certain tire operating conditions—most notably inflation pressure—on vehicle crashes. The legislation requires the agency to mandate a tire pressure monitoring system (TPMS) in each new pas-
senger vehicle to indicate when a tire is significantly underinflated. In support of the TPMS rulemaking, NHTSA has conducted an assessment of the benefits and costs of TPMS, in which it estimated how changes in tire traction characteristics caused by the effects of inflation pressure on a tire’s footprint and stopping capability would impinge on safety. The results of the assessment are provided later in this section since they offer one quantitative indication of how tire traction characteristics and vehicle crashes may be related.
The main challenge in assessing the effect of lowering tire rolling resistance on vehicle safety is largely an empirical one. At present, there are no viable data with which to examine the safety effects of changes in tire traction. Marginal changes are difficult to discern and even more difficult to relate to crash initiations and outcomes. The one measure of traction that is available for all passenger tires is the UTQG system grade for wet traction, as described in Chapter 2. All of the passenger tires sampled for rolling resistance in the 2002 Ecos Consulting and the 2005 Rubber Manufacturers Association (RMA) data sets (presented in Chapter 3) have UTQG traction grades. These data sets are therefore analyzed below in combination. No inferences can be drawn with regard to safety relationships, but the data analyses do offer some indications of the degree of correlation between tire rolling resistance and UTQG traction. As noted in Chapter 3, there may be inconsistencies in the data derived from multiple sources (e.g., three tire companies in the case of the RMA data) and testing facilities. Nevertheless, the committee believes that the combined data sets offer greater analytical opportunity for a general investigation of possible relationships.
UTQG Traction Grades and Rolling Resistance
Chapter 2 describes how passenger tires are tested by the UTQG system for wet traction and assigned a grade of AA, A, B, or C. NHTSA data indicate that of the 2,371 rated passenger tire lines, 4 percent are graded AA, 78 percent A, and 18 percent B or C (Table 4-1).3 In comparison, the
|
3 |
www.safercars.gov/Tires/pages/Tires2.cfm. The data are undated but presumed to be for 2004 tire models. |
TABLE 4-1 UTQG Wet Traction Grades for All Rated Tire Lines and in the Combined Ecos Consulting and RMA Data
|
Traction Grade |
Grade Criterion for Traction on Wet Asphalt (Measured Sliding Friction Coefficient) |
Grade Criterion for Traction on Wet Concrete (Measured Sliding Friction Coefficient) |
Percentage of All NHTSA-Graded Tire Lines Receiving Grade |
Tires in Combined Ecos and RMA Data Receiving Grade |
|
|
Percentage |
Number |
||||
|
AA |
>0.54 |
>0.38 |
4 |
21 |
42 |
|
A |
>0.47 |
>0.35 |
78 |
72 |
141 |
|
B |
>0.38 |
>0.26 |
18 |
7 |
13 |
|
C |
<0.38 |
<0.26 |
<1 |
0 |
0 |
|
Total |
|
|
100 |
100 |
196 |
combined Ecos Consulting and RMA data contain a much larger proportion of AA-graded tires, probably because of the large percentage of high-performance tires in these samples (Table 4-1). Of the 40 tires in the combined data set having W, Y, or Z speed ratings, all but four have a grade of AA for wet traction. Only six other tires, including only one S- or T-rated tire, have a grade of AA. However, neither the NHTSA percentages nor the percentages in the combined data set are sales weighted; hence, which distribution of UTQG grades is more representative of tires found on the road is unknown.
The utility of the UTQG traction grades for exploring possible relationships with other tire characteristics such as rolling resistance is diminished by the wide range of friction coefficients within each grade, which leads to a preponderance of tires across a wide array of sizes and types receiving a grade of A. Without access to the measured friction coefficients underlying the grades assigned to individual tires, the relationships between traction and other characteristics cannot be established precisely.
A simple two-variable analysis can help describe the data. Figure 4-1 shows that tires with higher wet traction grades tend to have higher RRCs. At the same time, the graph reveals a wide spread in RRCs within all three grades. More than one-quarter of the AA-graded tires have RRCs below 0.010, and one-quarter have values above 0.012. Not found
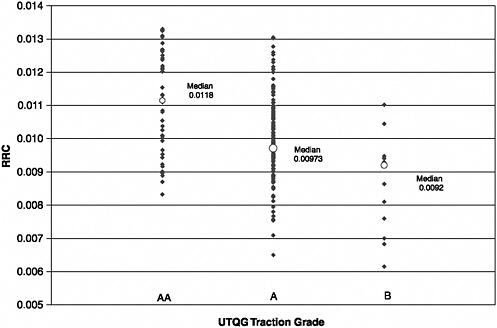
FIGURE 4-1 RRCs by UTQG wet traction grade, combined Ecos and RMA data.
among the AA-graded tires are very low RRCs; none of these tires has an RRC lower than 0.008. The absence of very low RRCs among AA-graded tires may indicate a lack of consumer demand for energy performance in high-traction tires, or it may be indicative of a technical or cost difficulty in achieving both qualities. The RRCs for A-graded tires cover a wider spectrum, from a low of 0.0065 to a high of 0.013. The wide spread suggests the technical feasibility of achieving both low rolling resistance and A levels of wet traction, although the production cost implications of doing so are not evident from the data.
As reported in Chapter 3, RRCs tend to decline as rim diameter increases. Thus, whether achieving a low RRC and a wet traction grade of A is more difficult for tires designed for 13-, 14-, and 15-inch rims than it is for tires with larger rim diameters would be useful to determine. Figure 4-2 suggests that low RRCs are less common among the smaller tires with an A traction grade. Only three of the 76 tires with 13-, 14-, and 15-inch rim diameters have an RRC lower than 0.008, and only one of the three received an A traction grade, as shown in Figure 4-2.
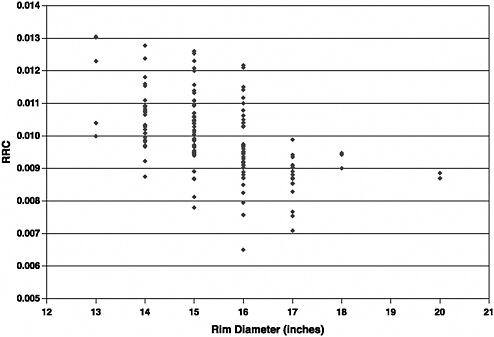
FIGURE 4-2 RRCs for tires with a UTQG grade of A for wet traction, sorted by rim diameter (combined Ecos and RMA data).
Although the statistical analyses do suggest a relationship, characterizing traction as negatively related to rolling resistance on the basis of these data alone would be an oversimplification. There is a wide spread in RRCs within all three traction grades. RRCs below 0.01 are found among all traction grades, and more than 25 percent of the highest-traction (AA) tires in the combined data have such RRCs (Figure 4-1).
In summary, the data suggest the difficulty of achieving both an AA traction grade and very low rolling resistance, even among tires having larger rim diameters in the current market. They do not, however, reveal the cost implications or the technological requirements, such as changes in tire design or materials, of achieving such an outcome.
Safety Implications of Traction Differentials
As explained earlier, the UTQG system is of limited usefulness in judging tire traction characteristics. The four-letter classification in the grading system results in large numbers of tires receiving the same
grade, and marginal differences in traction that may exist among tires graded the same are difficult to observe. In addition, the sliding friction coefficients used to derive the grades are measured under a limited set of operating conditions (locked-wheel, straight-line braking on either of the two wet pavements at one speed). Thus the coefficients do not indicate traction characteristics under a range of speeds or under common operating conditions such as travel on dry surfaces, cornering, and antilock braking. Moreover, the UTQG test does not take into account the drainage characteristics of the tire’s tread pattern, which may affect susceptibility to hydroplaning as well as wet traction.
One cause of the UTQG limitations is that the traction grades were developed not to provide comprehensive tire safety assessments but rather to provide consumers with more information on one aspect of tire performance relevant in making purchase decisions. If more precise metrics on tire traction were available, the effects of modifications in tire designs and materials to reduce rolling resistance on this particular characteristic might be explored further. Whether more precise traction data would, in turn, permit the examination of subsequent effects on vehicle safety performance is an open question.
The factors that influence the incidence and severity of motor vehicle crashes, such as the behavior of the driver and the condition of the vehicle and operating environment, are many and complex. Only rarely does analysis point to a single factor, especially a factor as difficult to measure and quantify by one number as tire traction. It is of interest that passenger tires with a wet traction grade of AA—which are disproportionately tires with speed ratings of W, Y, or Z—are more likely to be used on high-performance sports cars than are tires with A or B traction grades.
Few studies associating tire traction and crash incidence and severity have been undertaken. As described in Box 4-1, NHTSA has recently calculated the safety effects of improved vehicle stopping distances resulting from the proper maintenance of tire inflation, which affects a tire’s traction footprint. These estimates in support of regulation provide some indication of how traction capabilities may affect motor vehicle safety. However, they are too general for use in estimating the safety effects result-
|
BOX 4-1 NHTSA Evaluation of Safety Effects of Improved Traction from TPMS As part of its assessment of TPMS, NHTSA quantified expected reductions in crashes associated with improvements in tire traction stemming from maintenance of proper inflation. The agency estimated that if the occurrence of underinflated tires was curbed by TPMS, the average stopping distance for all injury crash–involved cars and light trucks would decline by about 1.5 percent, equivalent to what would be achieved by increasing the tire–road friction coefficient by 1.5 percent (NHTSA 2005, V-22).* Quicker braking deceleration would prevent some crashes and reduce the severity of others by lowering impact velocities. The agency estimated that each 1 percent reduction in stopping distance would prevent 25 to 30 fatalities, 130 to 140 severe injuries, and 2,300 to 2,500 moderate and slight injuries (NHTSA 2005, Table V-22).** |
ing from changes in tire designs and materials specifically to reduce average rolling resistance.
The present study was not undertaken to assess the effects—safety or otherwise—of replacement tires achieving very low or atypical levels of rolling resistance. “Low” is a relative term. Differentials of 25 percent or more in RRCs can be found today among replacement tires having the same UTQG traction grades and other characteristics. Narrowing the range of rolling resistance among tires within the same traction grades, perhaps by targeting the highest-rolling-resistance tires in the group, is
one potentially benign way (with respect to traction and perhaps safety) to lower average rolling resistance. In other words, reducing the average energy loss from tires can be brought about by various means, not simply by reducing rolling resistance in all tires by the same amount.
EFFECTS ON TREAD LIFE AND SCRAP TIRES
Scrap tires are a significant component of the nation’s solid waste stream. Much progress has been made during the past two decades in finding uses for scrap tires that reduce landfill disposals and open stockpiles and thus in lowering risks from fire and insect-borne diseases.4 Concerns related to scrap tires and the progress and challenges in controlling scrap tire generation are explained in Box 4-2. Today, more than three-quarters of all scrap tires generated each year are recovered or recycled. However, new recycling opportunities are needed because more tires are discarded each year by the nation’s expanding fleet of motor vehicles.
The mass introduction of longer-wearing radial-ply tires during the 1970s and 1980s may have helped control the population of scrap tires in relation to the large growth in car ownership and vehicle travel. Radialply tires are not as amenable to retreading as bias-ply tires, but they last much longer. Passenger car and light truck travel has grown by an average of 1 to 3 percent per year during the past 25 years. Without additional gains in tire life, further increases in scrap tire generation can be expected, and commensurate growth in recycling and recovery capabilities will be required.
Tread wear is the main cause of tire replacement. A review of discarded tire samples by Michelin revealed that tread wear, both normal and abnormal, accounts for between two-thirds and three-quarters of discarded tires.5 Factors affecting tread wear and life span are therefore important not only from the standpoint of the motorist, who must buy tires more often if they wear out sooner, but also from the standpoint of society’s interest in controlling scrap tire populations.
|
BOX 4-2 Scrap Tire Recycling Progress and Challenges During the past two decades, states have become heavily involved in regulating scrap tires and in developing markets for them. In 1985, Minnesota became the first state to pass legislation governing many aspects of scrap tire storage, collection, processing, and use. Since then, most states have established scrap tire programs aimed at controlling disposal, encouraging recycling and reprocessing, abating stockpiles, and reducing the generation of scrap tires. Some typical features of state programs are (a) licensing or registration requirements for scrap tire haulers, processors, and some end users; (b) manifests for scrap tire shipments and controls concerning who can handle scrap tires; (c) financial assurance requirements for scrap tire handlers, storage facilities, and disposers; (d) market development activities for recycling and processing; and (e) tire pile cleanup programs. To help offset the cost of these programs, most states impose fees on purchases of new tires and removal of used tires. The three largest uses for scrap tires are in tire-derived fuel, civil engineering applications, and ground rubber applications. The most common uses of tire-derived fuel are in the production of cement, in pulp and paper mills, and in the generation of electricity. The civil engineering market encompasses a wide range of uses for scrap tires, such as leachate liner, backfill, septic field drainage, and road base material. The tires are usually shredded for these applications, and a considerable amount of the tire shreds come from stockpile abatement projects. Applications of ground rubber, sometimes called crumb rubber, include the production of sheet and molded rubber products (such as floor mats and truck bed liners), new tires, and sports floor surfacing. |
|
Some states—most notably Arizona, Florida, and California—use ground tire rubber to produce asphalt binder, pavement sealers, and substitutes for aggregate in pavements. The cost of transporting scrap tires, especially in rural areas, can be a significant obstacle in finding economical markets for both newly generated and stockpiled scrap tires. Many scrap tire applications are low-value and low-margin uses. They are subject to fluctuations in market demand that hinge on the availability of substitute products and macroeconomic conditions, such as the price of energy. To keep scrap tire markets growing, many states have taken an active role in developing markets and in using scrap tires themselves in highway construction and other civil engineering projects. Some also support research to assess the environmental effects of using tires in various ways, including analyses of emissions from tire-derived fuels, leaching from tires used as fill, and the disposition of residue from tire processing. According to RMA data, 130 million of the 290 million scrap tires generated in 2003 were reused as tire-derived fuel in various industrial facilities and about 100 million were recycled into new products (RMA 2005, 48). Of the remaining 60 million tires, about half were buried in landfills and the other half are unaccounted for.* In addition to these newly generated tires, about 275 million scrap tires have accumulated in stockpiles across the country. Four states—Texas, Colorado, Michigan, and New York—accounted for about half this total, which has been reduced considerably during the past decade. The U.S. Environ |
|
mental Protection Agency has estimated that more than 700 million scrap tires were stockpiled 10 years ago. The scrap tires in long-standing stockpiles have fewer uses than cleaner, newly generated tires because of their poorer condition and limited accessibility. Nevertheless, the abatement of these stockpiles adds supply to the scrap tire markets, which complicates efforts to find economical uses for the millions of new scrap tires generated each year. |
UTQG Tread Wear Grades and Rolling Resistance
Tires are rated for tread wear as part of UTQG. As discussed in Chapter 2, these grades are numerical, and most assigned values range from 100 to 800. The scale is an index intended to reflect relative wear life. In general, tires graded 400 should outwear tires graded 200. Whether tires rated 400 wear twice as long, on average, as tires rated 200 is unknown, since there have been no follow-up examinations of average tire wear experience in the field and how this compares with UTQG ratings. The test is conducted on an outdoor track under controlled conditions. Both NHTSA and tire manufacturers warn against assuming that an individual tire will achieve wear performance proportional to its rating, because tires can be subject to different applications and operating environments. Nevertheless, some proportional relationship, on the average for large numbers of tires, is implied by the numerical design of the rating system.
Table 4-2 compares the UTQG tread wear grades of the new tires in the combined Ecos Consulting and RMA data with the grades received by all passenger tire lines reported by NHTSA. A larger percentage of tires in the combined data have very high tread wear ratings, and a smaller percentage have very low ratings. More than half of the tires in the combined data set have a rating between 300 and 500, which is comparable with national levels reported by NHTSA. The average tread
TABLE 4-2 Comparison of UTQG System Grades for All Passenger Tires and for the Tires in the Combined Ecos Consulting and RMA Data
|
UTQG Tread Wear Rating |
Percentage of All Tires with Grade According to NHTSA |
Tires in Combined Ecos Consulting and RMA Data |
|
|
Percentage |
Number |
||
|
200 or less |
11 |
3 |
6 |
|
201–300 |
21 |
18 |
36 |
|
301–400 |
33 |
28 |
55 |
|
401–500 |
22 |
23 |
45 |
|
501–600 |
8 |
17 |
33 |
|
601 or more |
5 |
11 |
21 |
|
Total |
100 |
100 |
196 |
wear grade for the data set is 440. As noted previously, neither the combined data nor NHTSA’s national ratings are sales weighted. Therefore, neither can be used to calculate an average UTQG wear rating for all tires sold.
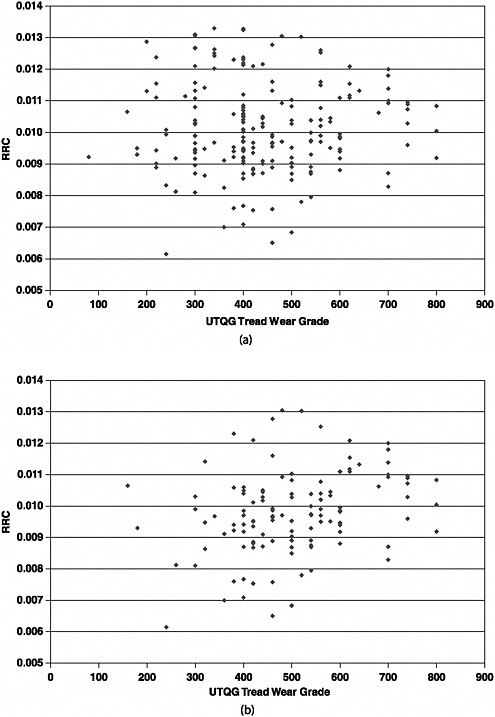
A scatter graph of all 196 tires in the combined data set does not exhibit any noticeable association between RRC and tread wear rating, as shown in Figure 4-3a. Disaggregating the data by graphing only the tires in the data set rated S or T reveals a slightly noticeable, but still weak, pattern (Figure 4-3b). Further disaggregation by graphing only those S or T tires with 15-inch rim diameters (Figure 4-3c) suggests the possibility of a relationship between rolling resistance and UTQG tread wear grade, which warrants more data for thorough statistical analysis involving more explanatory variables.
Explaining Variability in RRC and Tread Wear Grades
Multivariate analysis can help determine whether there is a relationship between RRC and UTQG tread wear rating and other variables among the 196 tires in the combined data. The original variables in the data set are
-
RRC,
-
Speed rating (S, T; H, V; W, Y, Z),
-
Tire manufacturer,
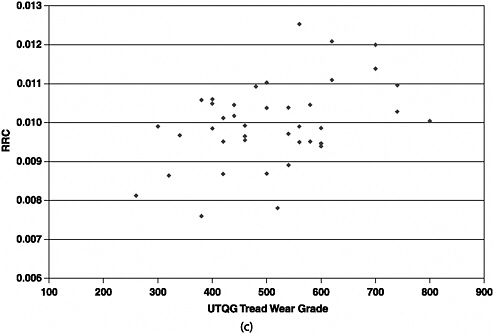
Scatter graphs of RRC and UTQG tread wear ratings, combined data set: (c) tires with speed rating of S or T and 15-inch rim diameter.
-
Aspect ratio,
-
Rim diameter (inches),
-
UTQG temperature grade (A, B, C),
-
UTQG traction grade (AA, A, B),
-
UTQG tread wear rating, and
-
Market [replacement or original equipment (OE)].
The committee added data for the following three variables:
-
Tread depth,
-
Retail price, and
-
Tire weight.
Tread depth and tire weight were obtained from the catalogue of tire specifications accessible on each tire manufacturer’s website. Tread depth was found for 170 of the 196 tires in the sample, and tire weight was found for all but six of the tires. The former is a measure of the depth of the tread grooves and thus excludes the tread base. Retail
prices were established for each of the tires from Internet searches of several popular tire mail order sites, including www.Tirerack.com (price sources are noted in the data table). The price data are examined in Chapter 5.
As noted in Chapter 1, because the RMA data did not become available until late in this study, a limited number of statistical analyses and tests could be performed on the data. Multiple regression models were tested with RRC as the dependent variable and combinations of the other variables listed above as independent variables. RRC is expressed as a natural logarithm to provide a better model fit and to allow for interpretations of the regression coefficients in terms of percentage change. Some of the categoric variables (e.g., speed rating, manufacturer, traction grade) are included as dummy variables.6 The results of the two best-fitting regression models are presented below.7 The first model seeks to explain variability in RRC. The second seeks to explain variability in UTQG tread wear rating. The implications of the results of the two models are discussed later.
Explaining Variability in RRC
Table 4-3 gives the results of a model explaining the natural logarithm of RRC as a function of tire rim diameter, aspect ratio, and tread depth, as well as dummy variables for tires having a speed rating of W, Y, or Z (hispeed), H or V (midspeed), and a UTQG traction grade of B (tractionB). Dummies were also created for tires made by Michelin and for those observations from the Ecos Consulting (ecosdummy) data set.8 All independent variables, except ecosdummy, are significant at the 95 percent confidence level, and the model statistically explains about half the variation observed in RRC, as indicated by the adjusted R2 of 0.50.
TABLE 4-3 Output of Multiple Regression: RRC (Natural Logarithm) as a Function of Eight Independent Variables
Under the assumption that all other variables are held constant, the regression coefficients and their confidence intervals indicate each variable’s relationship with RRC. The results are consistent with the findings in Chapter 3 that, on average, RRC declines as rim diameter increases and that RRC increases with higher speed ratings.
The results indicate that increasing rim diameter by 1 inch, or about 6.3 percent for the average tire in the data set, reduces RRC by 5 to 8 percent. Compared with tires with lower speed ratings (S, T), tires with the highest speed ratings (W, Y, Z) have 10 to 22 percent higher RRCs, while tires with middle speed ratings (H, V) have 1 to 9 percent higher RRCs.
Tires with thicker tread tend to have higher RRCs. Tread depth is measured and reported in increments of 1/32 inch, and an increase of one unit, or 1/32 inch, leads to a 2.5 to 6 percent increase in RRC, with a midpoint of 4.3 percent. An increase of 1/32 inch is an approximate increase in tread depth of 9 percent for the average tire in the data set. These results imply that to obtain a 10 percent reduction in RRC, an average tire’s tread depth would need to decrease by about 22 percent.
The relationship between RRC and traction is more difficult to explore because most tires are graded A for UTQG wet traction (out of a possible AA, A, or B), which is indicative of the broad band of grades in this rating scheme. Nevertheless, the dozen or so tires in the data set with
a B grade have a 5 to 19 percent lower RRC than all other tires, all else being equal.
Variables not included in the model are tire weight and dummies for UTQG temperature grade, neither of which was found to be statistically significant. Retail price was not included in the model, since it is not a parameter that can be changed directly to affect RRC in the same manner as a physical property.9 Nevertheless, to the extent that tire prices reflect tire manufacturing costs, price is an important consideration. Analyses of the selling prices of tires in the combined data set are presented in Chapter 5.
A dummy for OE tires was tested, but the small number (eight) of OE tires in the data set limited its significance. The data set consists almost entirely of replacement tires. To the degree that OE tires are constructed on the basis of technologies not common in replacement tires—for instance, by using alternative tread compounds to reduce rolling resistance—the kinds of relationships reported in Table 4-3 might not emerge from an analysis of large numbers of OE tires. Whether differences exist in OE and replacement tire technologies is an open question that is considered further in Chapter 5.
Explaining Variability in UTQG Tread Wear Rating
Table 4-4 shows the results of a regression explaining UTQG tread wear rating as a function of six variables. Once again, speed rating is a highly significant variable; tires rated for higher speeds tend to have lower tread wear grades. Compared with all other tires in the data set, tires with a speed rating of W, Y, or Z have average tread wear ratings that are 175 to 275 points lower. Tread wear ratings of tires having speed ratings of H or V are lower by 50 to 130 points.
As might be expected, there is also a statistical relationship between a tire’s tread wear rating and tread depth. The regression coefficient indicates that each increase of 1/32 inch in tread depth results in a 1- to 39-point increase in the tread wear rating, with a midpoint of about 20.
TABLE 4-4 Output of Multiple Regression Performed on Combined Data Set Explaining UTQG Tread Wear Rating as a Function of Six Variables
The difference between the lowest and highest tread depths in the data set is 4/32 inch (the range is 9/32 to 13/32 inch, excluding two outliers). Hence, as a general approximation, a 2/32-inch change in tread depth would result in a change in UTQG of ±40 points, or about 10 percent for a tire having the average grade of 440 observed in the combined data set.
Regression Results with Respect to Tread Life
While these statistical analyses are not substitutes for experimental investigations of engineering relationships, they provide insights that are difficult to observe from experiments. Experimental investigations are often limited to changing a few design or operating parameters at a time. They can be cumbersome and costly to perform because of the many factors influencing rolling resistance. The multiple regression results are consistent with findings from previous experimental studies showing that RRC can be lowered by reducing tread depth, as discussed in Chapter 3.10 The overall results indicate that tread depth must be reduced by slightly more than 2/32 inch to achieve a 10 percent reduction in RRC, if tread reduction is the only change made. This would amount to an
18 percent reduction in tread depth for the average tire in the combined data set.
A relationship between a new tire’s tread depth and its anticipated tread life is suggested, although it was not tested directly. The UTQG tread wear ratings were developed to provide consumers with an indication of expected tread life. The ratings, however, cannot be translated into a specific number of miles of expected wear. The regression results do show that reductions in UTQG tread wear ratings are explained in part by lower tread depth. The 18 percent reduction in tread depth (about 2/32 inch) required to achieve an approximate 10 percent reduction in RRC would lead to a 10 percent reduction in the UTQG tread wear rating for the average tire.
Reducing hysteretic tread material is one approach to reducing rolling resistance. This raises the question of whether such an approach, if widely applied, would have an adverse effect on tread wear and average tire life. The data, however, do not indicate the combination of means by which tire manufacturers would lower the rolling resistance of new tires, nor do they indicate whether consumers would accept tires with lower rolling resistance if their wear lives were shortened. This simplified approach relates only to the single dimension of tread depth. In practice, tire designers could minimize tread volume and mass by reducing tread width, shoulder profile, and section width in order to affect rolling resistance while minimizing losses in wear life.
Reducing tread may achieve a lower RRC value at the outset of a tire’s life, but it may not translate into a significant reduction in rolling resistance over the tire’s entire life. A tire starting out with a thicker tread will eventually assume a wear profile similar to that of an otherwise comparable tire starting out with less tread. Because all tires exhibit lower rolling resistance as they wear, a tire starting out with more tread will have higher rolling resistance only until the tread wears down to the starting depth of the thinner-treaded tire. If consumers replace their tires at the same wear depth (e.g., 2/32 inch), the differential in average lifetime rolling resistance of the two tires should be less than the differential in the tires’ RRCs measured when both tires are new.
New technologies may improve tire energy performance without the need to sacrifice tread wear or other desired capabilities. Examples of technologies developed with these goals in mind are given in Chapter 5.
Environmental Implications of Changes in Tread Life
Tread life is important to motorists, since it affects the service life of tires and the frequency of replacement tire purchases. It is also important from the standpoint of environmental policy because of concerns with regard to scrap tire generation and disposal.
From 1970 to 2003, the number of passenger cars and light trucks in the U.S. fleet more than doubled and total vehicle miles traveled grew by more than 130 percent (FHWA 1995, Table VM-201; FHWA 2003, Table VM-201). The number of tires sold (for both OE and replacement uses) went up at a much slower rate, by 48 percent—from 167 million to 250 million tires. A plausible cause of this marked differential in trends is that passenger tires became much more durable and longer lasting after the mass introduction of radial-ply tires during the 1970s and 1980s. Even though radial tires are not as amenable to retreading, they last twice as long as the bias-ply tires they replaced.
Had these substantial gains in tire life not occurred, many additional tires would have been sold to U.S. motorists in 2003—probably about 100 million more, absent a significant increase in bias-ply retreading. Additional tires would have been sold during the two preceding decades as well. The additional tires would have been accompanied by a comparable increase in the number of scrap tires entering the waste and recycling streams. The gains in tire life attributable to radial-ply construction are an example of technological progress. Yet even as average tire life has been extended, the constantly expanding fleet of passenger vehicles and increases in vehicle travel have resulted in increasing numbers of tires being sold. Fifty million more passenger tires are shipped in the OE and replacement markets today than were shipped in 1990 (RMA 2005).
Much progress has been made during the past two decades in finding new methods of recycling scrap tires. Productive uses of scrap tires and the efforts of states and private industry to promote recycling and reuse
are described in Box 4-2. In 1990, only about 11 percent of scrap tires generated were recovered or recycled, compared with more than 80 percent today (RMA 2005). Nevertheless, many states, such as Pennsylvania and California, remain concerned that trends in motor vehicle travel will lead to growing numbers of scrap tires that will overwhelm recycling markets. They have therefore started promoting ways to reduce the rate of scrap tire generation. For example, they urge motorists to buy tires promising longer tread wear and to be more vigilant with regard to tire maintenance. States (as well as the U.S. Environmental Protection Agency) are also paying attention to trends in the tire marketplace that can affect average tire life.
Some simple calculations illustrate the challenge inherent in controlling scrap tires in the face of 1 to 3 percent annual growth in motor vehicle travel. In 1995, each passenger car in the U.S. fleet averaged about 11,000 miles per year (FHWA 1995, Table VM-1). Accordingly, a set of four tires averaging 45,000 miles of service life needed to be replaced every 4.09 years. This replacement activity generated an average of 0.98 scrap tires each year for each of the 198 million passenger cars in the fleet at that time, or about 194 million scrap passenger tires nationally. By 2003, average miles driven per passenger car had increased to 12,000 miles (FHWA 2003, Table VM-1). Hence, a comparable set of tires would need to be replaced every 3.75 years, which would generate 1.07 scrap tires per year for each of the 220 million passenger vehicles in the fleet, or about 235 million scrap passenger tires nationally. Under these circumstances of increasing motor vehicle use, average tire life would need to have increased by more than 20 percent just to keep the annual generation of scrap tires constant at 1995 levels.
While holding scrap tire populations constant at earlier levels may be unrealistic, these rough calculations illustrate the importance of continued progress in extending tire life. If efforts to reduce rolling resistance raise the possibility of even modest adverse effects on tire life, the collective outcome may be problematic with regard to tire recycling and disposal. Of course, the same challenge may emerge as a result of other trends in tire design and construction that can affect tire life, such as
growth in the use of tires rated for higher speeds, which are associated with shorter wear life.
SUMMARY
Tire energy performance, traction, and wear life are related primarily because of their association with the tire’s design and construction, and especially its tread. Deformation of the tread accounts for much of the hysteretic energy losses from a tire exhibiting rolling resistance. The tread’s main operating function is to provide traction, especially in wet and snow conditions. The gradual loss of traction capability as the tread wears is a main determinant of a tire’s service life.
Statistical analyses of sampled replacement tires suggest that most tires having high (AAA) UTQG wet traction grades are rated for high speeds and that few such tires attain low levels of rolling resistance. These results may reflect the technical difficulty of designing tires that can achieve high levels of wet traction and low rolling resistance. They may also reflect a lack of interest in energy performance among users and makers of high-performance tires or a general lack of consumer information on this characteristic. Among the majority of tires that have an A grade for wet traction, the spread in RRCs is much wider. Indeed, the existence of numerous tires having both low RRCs and an A grade for wet traction suggests the potential to reduce rolling resistance in some tires while maintaining the most common traction capability as measured by UTQG. RRC differentials of 20 percent or more can be found among tires of the same size, speed rating, and UTQG traction grade.
The RRC of new tires can be lowered by reducing tread volume and mass, among other possible means. Experimental studies indicate that a new tire’s rolling resistance typically declines by 20 percent or more as the tread diminishes to its worn-out depth, a loss that may exceed 8/32 inch. The statistical analyses presented in this chapter yield results that are consistent with those of these previous studies. They indicate that reducing tread pattern depth in new tires by 18 percent, or about 2/32 inch, is associated with a 10 percent reduction in the RRC (again, measured when the tires are new). At the same time, a re-
duction in new-tire tread depth of 2/32 inch is associated with roughly a 10 percent reduction in the UTQG wear grade for an average tire in the data set.
Reducing a tire’s RRC when it is new may not appreciably reduce its average RRC over its lifetime. A reduction in tread depth that lowers initial RRC may translate into a much smaller reduction in rolling resistance measured over a tire’s full lifetime of use, which will limit the energy savings. The reason is that all tires experience diminished rolling resistance with wear; hence, a tire with thicker tread will have higher rolling resistance only until the added tread wears down to the tread depth of the thinner-treaded tire. At the same time, the likelihood of shorter wear life for tires designed with reduced tread depth or with less wear resistance for any other reason works against controlling the growth in scrap tires caused by escalating motor vehicle travel. The potential for such adverse outcomes suggests the importance of exploring means of reducing tire rolling resistance that do not degrade wear life.
REFERENCES
Abbreviations
FHWA Federal Highway Administration
NHTSA National Highway Traffic Safety Administration
RMA Rubber Manufacturers Association
FHWA. 1995. Highway Statistics. U.S. Department of Transportation, Washington, D.C.
FHWA. 2003. Highway Statistics. U.S. Department of Transportation, Washington, D.C.
French, T. 1989. Tyre Technology. Adam Hilger, Bristol, England.
Gardner, J. D., and B. J. Queiser. 2005. Introduction to Tire Safety, Durability, and Failure Analysis. In The Pneumatic Tire (J. D. Walter and A. N. Gent, eds.), National Highway Traffic Safety Administration, Washington, D.C., pp. 612–640.
Isayev, A. I., and J. S. Oh. 2005. Tire Materials: Recovery and Re-Use. In The Pneumatic Tire (J. D. Walter and A. N. Gent, eds.), National Highway Traffic Safety Administration, Washington, D.C., pp. 670–693.
NHTSA. 2005. Tire Pressure Monitoring System FMVSS No. 138: Final Economic Assessment. Office of Regulatory Analysis and Evaluation, National Center for Statistics and Analysis, Washington, D.C., March.
Pottinger, M. G. 2005. Forces and Moments. In The Pneumatic Tire (J. D. Walter and A. N. Gent, eds.), National Highway Traffic Safety Administration, Washington, D.C., pp. 286–363.
RMA. 2005. Factbook 2005: U.S. Tire Shipment Activity Report for Statistical Year 2004. Washington, D.C.
Schuring, D. J. 1980. The Rolling Loss of Pneumatic Tires. Rubber Chemistry and Technology, Vol. 53, No. 3, pp. 600–727.
Walter, J. D. 2005. Tire Properties That Affect Vehicle Steady-State Handling Behavior. In The Pneumatic Tire (J. D. Walter and A. N. Gent, eds.), National Highway Traffic Safety Administration, Washington, D.C., pp. 594–611.


