
APPENDIX Explanation and Comparison of Society of Automotive Engineers Test Procedures for Rolling Resistance
MARION G. POTTINGER
M’gineering, LLC
Two standardized tests are used in the United States to measure the rolling resistance of tires. The two tests are detailed in recommended practices of the Society of Automotive Engineers (SAE): J1269, “Rolling Resistance Measurement Procedure for Passenger Car, Light Truck, and Highway Truck and Bus Tires,”1 and J2452, “Stepwise Coastdown Methodology for Measuring Tire Rolling Resistance.” J1269 is the older of the two practices. It was approved in 1979 and reaffirmed in 2000. J1269 is intended to “provide a way of gathering data on a uniform basis, to be used for various purposes (for example, tire comparisons, determination of load and pressure effects, correlation with test results from fuel consumption tests, etc.).”2 J2452 was approved by SAE in 1999. Its primary intent is “estimation of the tire rolling resistance contribution to vehicle force applicable to SAE Vehicle Coastdown recommended practices J2263 and J2264.”3
COMMON FEATURES OF THE TWO TEST PRACTICES
The two practices have common features such as test wheel diameter, surface texture, and ambient temperature. The commonalities are noted in
TABLE A-1 Items Common to J1269 and J2452
|
Item |
Specification |
|
Test wheel diameter |
1.7 m (67 in.) |
|
Measurement methodsa |
Force |
|
|
Torque |
|
Surface |
80-grit paperb |
|
Allowed ambient temperature |
20°C (68°F) ≤ T ≤ 28°C (82°F) |
|
Reference temperature |
24°C (75°F) |
|
a J1269 also allows rolling resistance determination by measurement of electrical power consumption, but this method is no longer in common use. b This is actually an emery cloth. J2452 contains a surface conditioning procedure for the material. |
|
Table A-1. The practices use the same test rims. The normally used test rims are the measuring rims,4 but other rims approved in a tire and rim standards organization yearbook such as that of the Tire and Rim Association may be used. The rim used is always noted in the test report because rim width affects test results.
DIFFERENCES BETWEEN THE TWO PRACTICES
There are a number of differences between the two practices, which are detailed below.
Inflation Pressure and Load
Tire rolling resistance is dependent on inflation pressure and load. In both test practices inflation pressure is defined in terms of a base pressure. Base pressure is not defined in precisely the same manner in the two practices. In J1269 it is the inflation pressure molded on the tire sidewall together with the maximum load. This is straightforward for P-tires, but it only applies to single-tire loading in the case of LT-tires.5 In J2452, P-tire base pressures are defined in the first table in the recommended practice.
They are different from those given in J1269 for some tires. The base pressure for LT-tires matches that given in J1269.
In both practices load is defined in terms of maximum load. “Maximum load” is defined in both practices as the maximum load molded on the tire sidewall and listed as the load limit in the tire load tables of the current yearbook for the relevant tire and rim standards organization. For LT-tires this is the maximum load for single-tire operation.
Test Elements
Test elements include break-in, warm-up, and the actual test conditions. Break-in is to be used with tires that change in dimensions or material properties during first operation. Break-in is usually not required since the first 30 minutes of warm-up for Test Condition 1 is considered to be an allowable substitute for formal break-in. Also, until the tire has passed through first operation, there is no way to determine whether it will change in dimensions or material properties. Furthermore, since the load and inflation for Test Condition 1 in J1269 and J2452 are not the same, the resultant effective break-in is Recommended Practice–specific.
During the warm-up process, which occurs before each test condition, the tire is brought to thermal equilibrium. There are two approved ways to perform the warm-up: timed and rolling resistance force rate of change determined. In the timed method the tire is operated for a defined time at the conditions for each test step before data acquisition for that step. For P-tires the time period before Condition 1 is 30 minutes. It is 10 minutes before other steps. For LT-tires the period before Condition 1 is 60 minutes. It is 15 minutes before other steps. In the rate of change method, after a short waiting period for Condition 1 (10 minutes for P-tires and 20 minutes for LT-tires) and without a waiting period for other conditions, the rolling resistance is monitored with equilibrium being defined to exist when the rolling resistance gradient is less than or equal to 0.13 newtons per minute over a 90-second period. Regardless of the warm-up method, once equilibrium formally exists for each condition, data acquisition can begin.
The test conditions used for P-tires are defined in Table A-2, and those for LT-tires are defined in Table A-3. The test conditions for J1269 and J2452 are not identical. The exact procedure for executing the test under the test conditions is discussed under the subject of test execution.
TABLE A-2 Regulated Pressure Test Conditions for P-Tires
HANDLING OF DATA CORRECTIONS
Raw data taken during testing contain tares (offsets), parasitic losses such as bearing losses, force measurement crosstalk, and perhaps alignment errors. Additional data besides the basic data acquired according to the section on test execution are required to eliminate these errors. These correction data are used during data analysis.
The load cell output with the test tire and rim mounted but not loaded is acquired for each test condition to obtain tares. During analysis, these data are subtracted from the data taken for the test condition to which they pertain.
With the tire loaded just enough so that it will continue to rotate, force or torque data, whichever are relevant for the test machine being used,
TABLE A-3 Regulated Pressure Test Conditions for LT-Tires
|
|
J1269 |
J2452 |
||
|
Test Point |
% Max Load |
% Base Pressure |
% Max Load |
% Base Pressure |
|
1 |
100 |
110 |
20 |
110 |
|
2 |
70 |
60 |
40 |
50 |
|
3 |
70 |
110 |
40 |
100 |
|
4 |
40 |
30 |
70 |
60 |
|
5 |
40 |
60 |
100 |
100 |
|
6 |
40 |
110 |
|
|
are acquired for each speed. These data contain the parasitic bearing losses and aerodynamic losses. During analysis, these data are subtracted from the data taken for the test condition to which they pertain.
Crosstalk occurs in all multidimensional force measurement machines. A matrix to remove this effect is derived during machine calibration. If errors exist because of machine load application alignment imperfections not fully compensated by the crosstalk matrix, the test must be run in both directions of rotation on force measurement rolling resistance test machines, and the results must be averaged.
HOW THE TESTS ARE EXECUTED
J1269
With the test machine operating at a steady 80 km/h, data are acquired according to the following sequence:
-
Warm-up at P1 and FZ1.
-
Acquire data at P1 and FZ1.
-
Warm-up at P2 and FZ2.
-
Acquire data at P2 and FZ2.

-
Acquire data at Pn and FZn as prescribed in the relevant practice.
J2452
For each test condition, the tire is warmed up at 80 km/h until steadystate rolling resistance is achieved. At that point the tire is quickly accelerated to 115 km/h and then subjected to a stepwise approximation to a 180-second coastdown to 15 km/h. The stepwise approximation contains six or more approximately equally spaced steps. Figure A-1 is an example of such a coastdown.
COMMON DATA ANALYSIS
The first step is to apply the required data corrections. At that point the rolling resistance is computed. Next the data are adjusted to give the rolling resistance at 24°C (75°F) by using Equation 1.
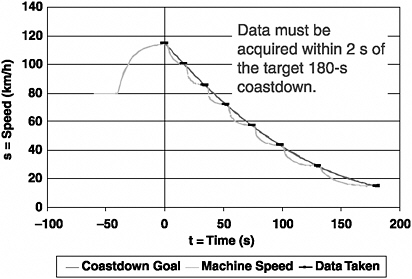
FIGURE A-1 Example of stepwise coastdown in J2452 test practice.
(1)
where
|
RRT |
= |
rolling resistance at 24°C, |
|
RR |
= |
rolling resistance at TA, |
|
TA |
= |
ambient temperature during a test condition, and |
|
TR |
= |
reference temperature = 24°C. |
The k-values given in J1269 and J2452 are not the same.
Since the data are taken on a 1.7-meter-diameter test dynamometer, they are not correct for other diameters, for example, ∞ (flat) or 1.22 meters (48 inches), which is used in federal vehicle emission and fuel economy tests. An approximate correction for curvature is obtained by applying the Clark equation, Equation 2.6 Equation 3 is the Clark equation for the special case of a flat surface.
(2)
(3)
where
|
R1 |
= |
measurement surface radius, |
|
R2 |
= |
radius of the surface to which the data are being adjusted, and |
|
r |
= |
unloaded tire nominal radius. |
DATA FITTING
For modeling and other engineering purposes, empirical relationships are fit by using the J1269 and J2452 data. Because consistency with J1269 was not considered during the development of J2452, the J2452 equation does not devolve to the J1269 equation when velocity is set to 80 km/h. J1269 was not revised so that its equations are the J2452 equation at a single velocity.
For J1269 P-tire fitting,
(4)
For J1269 LT-tire fitting,
(5)
In Equations 4 and 5, FZ is load, P is inflation pressure, and A0, A1, …, A4 are constants.
For J2452 fitting,
(6)
where
|
a, b, c, α, β |
= |
constants; |
|
FZ |
= |
load; |
|
P |
= |
inflation pressure; and |
|
V |
= |
speed. |
SINGLE-NUMBER EXPRESSION OF RESULTS
In comparing tire specifications, it is important to be able to characterize tire rolling resistance with a single number. The model derived from J1269 or J2452 can be queried to yield a rolling resistance value at a single point.
Simplified Standard Reference Condition
Because of the possibility of needing to produce data on a large array of tires, J2452 contains a Simplified Standard Reference Condition, which yields data at the following single condition.
-
Load = 70 percent of maximum,
-
Inflation = base + 20 kPa, and
-
V = 80 km/h.
(At the time this appendix was prepared, a single-point test at the Simplified Standard Reference Condition was in ballot as a revision of J1269.)
Mean Equivalent Rolling Force
J2452 contains a method for deriving a single number representative of a known driving cycle. This is the mean equivalent rolling force (MERF). It is calculated by Equation 7.
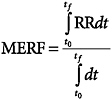
(7)
where
|
RR |
= |
rolling resistance as a function of time within the chosen cycle, |
|
tf |
= |
final time in the cycle, and |
|
t0 |
= |
initial time in the cycle. |
Equation 7 is the time integration of the rolling resistance during the cycle under study divided by the time during which the cycle occurs.
Typically, the cycle under consideration would be one of the federal test procedure (FTP) driving cycles such as the urban or highway schedule.
If MERF is computed for both FTP cycles, a MERF related to corporate average fuel economy (CAFE) can be computed as indicated in Equation 8.
(8)
Standard MERF
This is a MERF computed at the standard reference conditions discussed above. (88)


