
6
Socioeconomic Dimensions of Immigrant Integration
Immigrants come to the United States for many reasons, but the predominant one is to make a better life for themselves and their children. European immigrants and their descendants experienced a great deal of social mobility throughout the 20th century. Immigrants from countries such as Germany, Greece, Ireland, Italy, and Poland often arrived with no possessions and very little or no education. Through hard work and the opportunities provided by an expanding labor market, they achieved some socioeconomic progress in their own lives and remarkable progress by the second and third generation. By the 1980s, groups that had started out in dire poverty and without skills and formal education saw their grandchildren achieve parity and then surpass other third generation native-born whites (Alba, 1985; Lieberson, 1980; Lieberson and Waters, 1988). The sociologist Andrew Greeley (1976) called this the “Ethnic Miracle.”
Have recent immigrants who have come from Asia, Latin America, Africa, and the Caribbean experienced the same socioeconomic mobility? Will their children do better than their immigrant parents? Will they also achieve parity with other native-born Americans? Today’s immigrants bring with them many of the same attributes as their European predecessors: ambition, a capacity for hard work and sacrifice, and a strong belief in America as a land of opportunity. Immigrants are actually more likely to believe in the American dream than the native-born (see Chapter 7). In 2014, almost 70 percent of immigrant parents said their children will prosper relative to
themselves, compared with only 50 percent of native-born parents.1 They also are less uniformly poor than earlier waves of immigrants, with a large proportion of highly educated immigrants who enter the labor market in high status occupations (Foner, 2000). Yet there are also reasons to worry about their advancement, especially for the one-third of immigrants who have less than a high school education and thus have a long way to go to reach the middle class. Immigrants today face different conditions than their predessors, including rising income inequality and declining wages for unskilled workers, greater racial and ethnic discrimination, failing and segregated public schools, and a legal regime that leaves large proportions of some groups in temporary or undocumented statuses.
This chapter examines the integration of immigrants and their children in education, occupation, earnings, and poverty. As the panel did in other domains, we examined change over time for the immigrants themselves and intergenerational change across the first, second, third, and later generations. As detailed below, we found a great deal of progress for immigrants and their descendants over time and generationally. Yet the panel’s ability to draw reasoned conclusions was hampered by substantial gaps in the available data. Because the American Community Survey lacks a question on parental birthplace, the panel had to rely instead on aggregated data from the Current Population Survey (CPS) to derive estimates for the second generation of major national origin groups. In addition, the panel could not separate the third generation specifically from all later generations in federal data sources, and we found no information on legal status for the first generation (the foreign-born). These gaps make it hard to interpret some of the trends for later generation Mexican-Americans in particular, a topic discussed in depth below.
CHANGING CONDITIONS IN AMERICAN SOCIETY
As discussed in Chapter 1, European immigrants in 1910 came with very little education and had, on average, half the education of native-born Americans of that time, with high rates of illiteracy in many groups. The second generation of children of these immigrants entered the labor market at the height of the Great Depression. Yet the children and grandchildren of these immigrants were ultimately able to achieve upward social mobility during the remarkable post–World War II expansion of the American economy from the 1940s through the 1970s, an expansion that particularly benefited those at the bottom of the economic distribution. This period has been called the “Great Compression” because the wage structure nar-
___________________
1 Data from NORC’s General Social Survey (GSS) at http://www3.norc.org/Gss+website/ [September 2015].
rowed and became more equal than at any time since (Goldin and Margo, 1992), and for immigrants and their children it created opportunities to rise to the middle class and beyond. With rising real wages at the bottom of the distribution, the low-skilled and low-educated saw their wages rise over time. Immigrants and their children with higher levels of educational attainment reaped the rewards of their own effort as well as the structural uplift of rising real wages.
The situation for immigrants and their children who entered the labor market since the early 1970s is exactly the opposite. Those at the bottom of the distribution, particularly men, who maintain the same level of education and skill have seen their real wages decline over time. Real hourly earnings for men without a high school education dropped 22 percent between 1980 and 2012; for high school graduates, they dropped by 11 percent. Only those with a college degree or higher have seen increases (Autor, 2014). And while real wages for women with less than a college degree did not decline over this period, they experienced very modest growth.
Rising inequality in the labor market and the increasing returns to higher education in recent decades mean that immigrants and especially their children need rapid growth in educational attainment to experience rising incomes over time. While Italians, for instance, took three or four generations to reach educational parity with the general population of native-born whites, there was an abundance of jobs that paid a family wage for men with less than a college degree. Descendants of these immigrants had the luxury of time to catch up educationally with other Americans, and they did (Perlmann, 2005). Education is much more highly valued in today’s labor market, and the children of immigrants with low education must not only surpass their parents’ educational attainment but make large strides beyond them just to stay in place (Goldin and Katz, 2008; Card and Raphael, 2013). One consequence of this focus on educational attainament is that the public schools serving the children of low-skilled immigrants are incredibly important to their chances for social mobility—an issue the panel returns to later in the chapter.
EDUCATIONAL ATTAINMENT AMONG IMMIGRANTS
As described in Chapter 1, immigrants are still overrepresented at the bottom of the educational distribution, but a sizeable proportion now come with advanced educational credentials. These differences in educational attainment also map onto source countries, with Asia and Africa sending relatively more immigrants with high educational attainment, while Latin America and the Caribbean send relatively more immigrants with low attainment. Tables 6-1 and 6-2 show educational attainment among first and second generation men and women, respectively, ages 25-59, by country of
TABLE 6-1 Educational Attainment of First and Second Generation Men, Ages 25-59, by Source Country
| Source Country | First Generation | Second Generation | ||||||
|---|---|---|---|---|---|---|---|---|
| Avg. Educ. | % with Education: | Sample Size | Avg. Educ. | % with Education: | Sample Size | |||
| < 12 | 16+ | < 12 | 16+ | |||||
| Mexico | 9.4 | 55.2 | 5.4 | 24,371 | 12.6 | 15.2 | 14.9 | 5,545 |
| Cuba | 12.9 | 13.6 | 24.7 | 1,614 | 14.2 | 3.5 | 40.4 | 599 |
| Dominican Republic | 11.8 | 26.7 | 15.8 | 1,303 | 13.4 | 7.3 | 23.3 | 254 |
| Central America | 9.8 | 48.0 | 9.5 | 6,414 | 13.4 | 8.1 | 25.7 | 665 |
| South America | 13.2 | 12.6 | 31.6 | 4,718 | 14.3 | 1.7 | 42.9 | 803 |
| China | 14.7 | 10.7 | 58.3 | 2,409 | 15.4 | 3.4 | 67.8 | 672 |
| India | 16.3 | 2.7 | 83.2 | 3,878 | 15.9 | 2.2 | 76.7 | 389 |
| Japan | 15.6 | 0.5 | 72.7 | 456 | 14.3 | 4.5 | 42.8 | 529 |
| Korea | 15.4 | 0.9 | 68.8 | 1,510 | 15.0 | 2.2 | 60.5 | 378 |
| Philippines | 14.4 | 2.5 | 49.1 | 2,977 | 14.3 | 2.2 | 42.7 | 1,168 |
| Vietnam | 13.0 | 15.2 | 30.1 | 2,062 | 14.4 | 4.9 | 48.9 | 256 |
| Haiti | 12.8 | 13.9 | 22.1 | 844 | 13.9 | 2.9 | 32.9 | 131 |
| Jamaica | 13.0 | 10.9 | 20.9 | 980 | 14.1 | 4.3 | 36.8 | 203 |
| Africa | 14.3 | 5.3 | 48.1 | 3,551 | 14.7 | 2.2 | 50.1 | 429 |
| Canada | 15.0 | 3.1 | 57.4 | 1,419 | 14.1 | 4.2 | 38.8 | 2,856 |
| Europe | 14.4 | 5.2 | 47.4 | 8,177 | 14.5 | 2.8 | 46.1 | 10,519 |
| All Countries | 12.1 | 28.2 | 28.4 | 78,471 | 13.9 | 7.1 | 35.6 | 29,631 |
NOTE: The first generation samples include foreign-born men ages 25-59, excluding those born abroad of an American parent. The second generation samples include U.S.-born men ages 25-59 who have at least one foreign-born parent. Sampling weights were used in the calculations. See Duncan and Trejo (2015) for further details on methodology.
SOURCE: Adapted from Duncan and Trejo (2015, p. 119). Data from 2003-2013 CPS outgoing rotation group data.
TABLE 6-2 Educational Attainment of First and Second Generation Women, Ages 25-59, by Source Country
| Source Country | First Generation | Second Generation | ||||||
|---|---|---|---|---|---|---|---|---|
| Avg. Educ. | % with Education: | Sample Size | Avg. Educ. | % with Education: | Sample Size | |||
| < 12 | 16+ | < 12 | 16+ | |||||
| Mexico | 9.5 | 53.9 | 6.5 | 21,762 | 12.8 | 14.6 | 18.2 | 6,034 |
| Cuba | 13.2 | 9.5 | 26.3 | 1,612 | 14.5 | 3.7 | 46.4 | 594 |
| Dominican Republic | 11.9 | 27.1 | 16.8 | 2,071 | 14.0 | 6.6 | 36.2 | 297 |
| Central America | 10.2 | 43.0 | 10.9 | 6,124 | 14.0 | 5.4 | 36.7 | 751 |
| South America | 13.4 | 10.2 | 33.1 | 5,495 | 14.5 | 2.3 | 45.8 | 860 |
| China | 14.2 | 11.5 | 52.6 | 2,918 | 15.4 | 1.9 | 70.1 | 689 |
| India | 15.8 | 4.0 | 78.1 | 3,445 | 16.1 | 2.4 | 79.8 | 397 |
| Japan | 14.8 | 0.6 | 53.4 | 874 | 14.7 | 2.0 | 47.8 | 518 |
| Korea | 14.5 | 3.9 | 53.7 | 2,267 | 15.3 | 2.1 | 65.3 | 387 |
| Philippines | 14.7 | 2.9 | 57.2 | 4,753 | 14.6 | 2.1 | 49.8 | 1,244 |
| Vietnam | 12.5 | 19.3 | 25.9 | 2,340 | 14.8 | 2.5 | 59.5 | 250 |
| Haiti | 12.6 | 17.0 | 21.0 | 975 | 14.7 | 5.8 | 53.3 | 158 |
| Jamaica | 13.4 | 10.6 | 28.4 | 1,408 | 14.7 | 2.1 | 46.2 | 274 |
| Africa | 13.5 | 9.9 | 37.9 | 3,201 | 15.0 | 2.4 | 58.1 | 443 |
| Canada | 14.8 | 2.2 | 51.4 | 1,707 | 14.4 | 3.0 | 43.4 | 2,920 |
| Europe | 14.4 | 4.9 | 47.0 | 9,316 | 14.6 | 2.3 | 46.3 | 11,015 |
| All Countries | 12.3 | 24.8 | 29.8 | 83,028 | 14.0 | 6.4 | 38.9 | 31,608 |
NOTE: The first generation samples include foreign-born women ages 25-59, excluding those born abroad of an American parent. The second generation samples include U.S.-born women ages 25-59 who have at least one foreign-born parent. Sampling weights were used in the calculations. See Duncan and Trejo (2015) for further details on methodology.
SOURCE: Data from 2003-2013 Current Population Survey outgoing rotation group data.
origin for the largest source countries of immigrants to the United States.2 The tables provide the average educational attainment (years of schooling), percentage with less than a high school degree (< 12), and percentage with a college degree or more (16+). Among men (Table 6-1), Mexicans have the lowest average educational attainment (9.4 years), and 55 percent of the first generation from Mexico have less than a high school degree, while only 5 percent have a college degree. The average educational attainment of Central American men is also very low in the first generation (9.8 years); 48 percent have less than high school, while only 10 percent have a college education. Men from the Dominican Republic are less disadvantaged but still have overall low levels, averaging 11.8 years of education; 27 percent with less than high school, and 16 percent with a college degree.
The highest educational attainments among first generation men are among immigrants from Asia, followed closely by Africa, Canada, and Europe (Table 6-1). Indians are the most educated with an average of 16.3 years of education, and 83 percent of Indian immigrant men having a college degree. They are followed by Japanese, Koreans, and Filipinos, who also display high average levels of education, low percentages of people with less than high school attainment (less than 1% of Koreans and Japanese), and high shares with college attainments and beyond. Chinese and Vietnamese immigrant men have high percentages at the top of the educational distribution (58% and 30% with college degrees, respectively) but also relatively high percentages at the bottom of the distribution (11% and 15%, respectively, with less than high school).
The patterns for women are quite similar to those of men in all groups, with average levels of education being somewhat lower for women among Asian and African groups and modestly higher for women among Latino groups (Table 6-2).
Overall, the educational profiles of these groups vary extensively by source country and could also be associated with percentage of immigrants with undocumented status, which cannot be ascertained in most datasets. Mexicans and Central Americans have both the lowest educational attain-
___________________
2 The panel is very grateful to Brian Duncan, Department of Economics, University of Colorado Denver, for his help with much of the data analysis reported in this chapter. These calculations are similar to those presented for second generation men in Duncan and Trejo (2015, Table 1), but here Tables 6-1 and 6-2 incorporate additional years of data and report results for the first generation as well as the second and for women as well as for men. The tables use microdata from all months of the Current Population Survey (CPS) from January 2003 through December 2013. The CPS is a monthly survey of about 60,000 households that the U.S. government administers to estimate unemployment rates and other indicators of labor market activity. The sampling universe for this survey is the civilian noninstitutionalized population of the United States. Pooling together these 11 years of monthly CPS data substantially increases sample sizes and improves the precision of the estimates.
ments in the first generation, by all three measures shown in Tables 6-1 and 6-2, and the highest proportion of undocumented people (Passel and Cohn, 2009). Among Asian immigrants, the profile of high education among immigrants bodes well for the second generation, as the best predictor of a child’s educational outcomes is the educational attainment of the child’s parents (Sewell and Hauser, 1975; Mare, 1981; Haveman and Wolfe, 1994; Mulligan, 1997; Schiller et al., 2002).
Educational Outcomes in the Second Generation
The second generation shows remarkable educational progress compared with the first generation. Overall, the average educational attainment for men increases from 12.1 years in the first generation to 13.9 in the second, surpassing the average educational attainment of 13.8 years for the general population of third generation and higher white Americans. For women the second generation has an average educational attainment of 14.0 years, also surpassing the average of 13.9 years for all third generation and higher white Americans (Table 6-2).
For the groups with overall low levels of education in the first generation, both men and women gain substantially in education from the first to the second generation. Among Mexican American men for instance, average education rises from 9.4 years to 12.6 years in the second generation. Among women the average education rises from 9.5 to 12.8 years. The percentage with less than a high school education falls from 55 percent in the first generation to 15 percent in the second for men and from 54 percent to 15 percent for women. Equivalent strides are made by Central American men, who improve their average educational attainment from 9.8 to 13.4 years, and women, who improve from 10.2 to 14.0 years of education. The percentage with less than a high school education among Central American men falls from 48 percent to 8 percent and among women from 43 percent to 5 percent. These changes represent an impressive amount of upward educational mobility in one generation.
Among the Asian groups with exceptionally high educational attainment in the first generation, the Indians, Koreans, and Japanese show a decline between the first and second generations in the percentage with education above a college degree. This likely reflects the selectivity among the first generation, as well as differing patterns of immigration over time. The second generation descendants of Japanese immigrants, for instance, include many elderly people whose parents immigrated before World War II, as well as the children of more recent, highly selected immigrants. In other words, these cross-sectional generations do not represent true generational cohorts. Most of the other groups show modest increases in education by
generation, which equal or exceed the educational attainment of the general population of third generation and higher native-born whites.
To better approximate true parental and child cohorts, Figures 6-1 and 6-2 plot the average education in years of first and second generation men and women, respectively, restricting the first generation to people ages 50-59 and the second generation to people ages 25-34. The solid regression lines in the figures highlight the central tendencies of the relationships between the average education levels of second-generation individuals from a particular source country and those of their immigrant ancestors. The dashed horizontal and vertical lines represent the average educational attainment for all non-Hispanic third generation and higher white Americans in the younger (25-34 years of age) cohort: 13.7 years of education for men and 14.2 years for women. The R-squared statistic for each regression line suggests that the parents’ cohort educational attainment predicts the child’s attainment quite well for men (.58) and somewhat less well for women (.39).
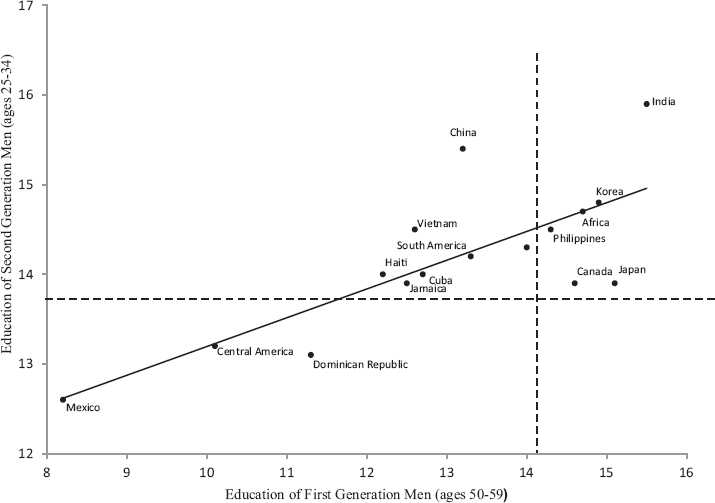
NOTE: The first generation samples include foreign-born men ages 50-59, excluding those born abroad of an American parent. The second generation samples include U.S.-born men ages 25-34 who have at least one foreign-born parent. Sampling weights were used in the calculations.
SOURCE: Adapted from Duncan and Trejo (2015). Data from 2003-2013 Current Population Survey outgoing rotation group data.
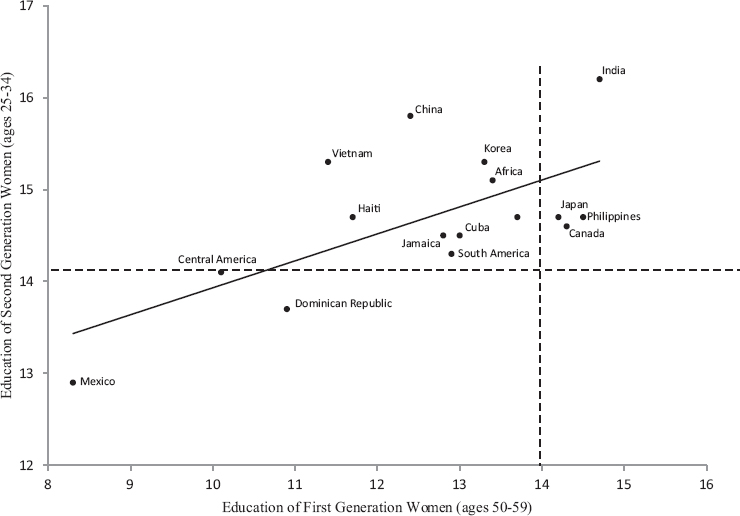
NOTE: The first generation samples include foreign-born women ages 50-59, excluding those born abroad of an American parent. The second generation samples include U.S.-born women ages 25-34 who have at least one foreign-born parent. Sampling weights were used in the calculations.
SOURCE: Adapted from Duncan and Trejo (2015. Data from 2003-2013 Current Population Survey outgoing rotation group data.
The groups with the lowest educational attainment among the young-cohort second generation men (Figure 6-1) are Mexicans, Central Americans, and Dominicans. Among the young-cohort women (Figure 6-2), Mexicans and Dominicans are still below the third generation and higher white American reference group, but Central American women are almost equal to their reference group. The relatively low educational attainment of most of these groups reflects the lower educational attainment of their immigrant parents, but may also be attributed to a variety of factors, including discrimination (Telles and Ortiz, 2008; Brenner and Graham, 2011), residential instabililty (Green, 2003; Bohon et al., 2005; Palerm, 2006), limited English proficiency (Crosnoe and Lopez-Turley, 2011; Terriquez, 2012), and cultural differences (González et al., 2013; Valenzuela, 2000). Context of reception also matters: immigrants who come in with socioeconomic disadvantages often come to live in poor neighborhoods with underfunded
schools (Portes and Rumbaut, 2001; Suárez-Orozco and Suárez-Orozco, 2002).
The “hyperselectivity” of Asian immigrants (i.e., the highly educated and highly selective background of these immigrants) also factors into cumulative advantages in immigrant integration compared to Latin American groups (Lee and Zhou, 2014). However, it is important to note that sharp contrasts between the educational outcomes of Mexican and Central American children of immigrants on the one hand and of Asian Americans on the other obscure the situation of Asian immigrants like the Hmong (Xiong, 2012), whose socioeconomic background and educational outcomes more closely resemble the Mexican immigrants than the Chinese and Korean immigrants in other studies.
Overall this analysis suggests that the second generation of all groups are converging with the native-born in terms of educational attainment and that the remaining deficits among the three Latino second generation groups are primarily due to the very low starting point of their immigrant parents. All of this is positive evidence of rapid educational integration.
Assessing Education Patterns in the Third+ Generation
Examining patterns of educational attainment in the third generation requires the use of a different categorization system for the population. While the Current Population Survey (CPS) data analyzed above provides data on the first generation (based on the birthplace question) and the second generation, (based on the birthplace of parents question) there is no birthplace of grandparents question that allows analysts to identify the true third generation: the grandchildren of immigrants. In order to examine patterns of integration beyond the second generation, the panel instead used the CPS self-identification questions on race and Hispanic origin. Using their responses to these questions, each individual is assigned to one of five mutually exclusive and exhaustive racial/ethnic groups: Hispanic (of any race), and non-Hispanic white, black, Asian (including Native Hawaiian and Pacific Islander), and a residual “other race” category. Hispanics are disaggregated further by national origin group (Mexican, Cuban, Central/ South American, or Other Hispanic). Those whom the panel could not identify as first or second generation through the birthplace questions noted above were classified by default as third+ generation members of their racial/Hispanic origin category.
For Mexican Americans, this might include the “true” third generation—people whose grandparents immigrated from Mexico, but because Mexican migration has occurred over centuries, it would also include, fifth, sixth, and seventh generation Mexicans, including those people whose ancestors never “immigrated” but instead remained in the Southwest as it changed
hands from Mexico to the United States via the Treaty of Guadalupe Hidalgo at the end of the Mexican American War in 1848. For blacks, this analysis would capture the true third generation grandchildren of immigrants from countries such as Jamaica and Trinidad, along with people who are descendants of slaves brought to the United States in the 16th through 18th centuries. Therefore these categories are very heterogeneous for whites, blacks, and Hispanics. Because Asian immigration is generally more recent, the third+ generation is less varied but still contains higher generations than the third within the category.
Table 6-3 provides data on average education by race/ethnicity, sex, and generation for Hispanic subgroups and for whites, blacks and Asians. Among all groups, the data show generational progress between the first and second generations, but the data suggest little progress and even some decline between the second and third+ generations. For instance, among non-Hispanic white men, average education declines from 14.4 to 13.8 between the second and third+ generations, among blacks it declines from 13.9 years to 12.9, and for Asians it declines from 15.0 to 14.3 years. Among Mexicans there is no change from the second to the third+ generation. A similar pattern of stagnation or decline appears for all of the groups examined among women.
However, Smith (2003) and Borjas (1993, 2006) pointed out that cross-sectional data do a poor job of matching immigrant parents and grandparents with their offspring to measure true generational progress. Smith (2003, 2006, 2012) examined educational progress by birth cohort—beginning with the first generation born in 1880-1884 and continuing through to immigrants born in 1940-1944—and by age to better match generations across time. He concluded that “measured across all three or just two generations and for men and women alike, the education advances made by Latinos are actually greater than those achieved by either European or Asian migrants” (Smith, 2012, p. 24). Table 6-4 presents a similar type of analysis using the CPS data available to the panel. Specifically, we compared age/ generation groups that potentially match parents with their children (i.e., by moving northwest [diagonally up and to the right] between the connected cells with similar shading in Table 6-4). With this analysis, one begins to see educational gains for Mexicans after the second generation. Among men, for example, average schooling rises slightly from 12.4 years for the older, second generation to 12.6 years for the younger, third+ generation. The analogous educational increase between the second and third+ generations is larger for women, from 12.2 to 12.9 years. Moreover, calculating schooling progress between the first and second generations in this same way produces larger gains than those shown in Table 6-3: gains of 4.4 years for men and 4.6 years for women. Despite these intergenerational advances,
TABLE 6-3 Average Education, Ages 25-59, by Race/Ethnicity, Sex, and Immigrant Generation
| Race/Ethnicity | Men, by Immigrant Generation | Women, by Immigrant Generation | ||||
|---|---|---|---|---|---|---|
| First | Second | Third+ | First | Second | Third+ | |
| Hispanic (aggregate) | 10.2 (0.02) | 12.9 (0.02) | 12.7 (0.02) | 10.5 (0.02) | 13.1 (0.02) | 12.8 (0.02) |
|
Mexican |
9.4 (0.02) | 12.6 (0.03) | 12.6 (0.02) | 9.5 (0.03) | 12.8 (0.03) | 12.7 (0.02) |
|
Cuban |
12.9 (0.07) | 14.2 (0.11) | 13.8 (0.21) | 13.2 (0.07) | 14.5 (0.11) | 13.8 (0.18) |
|
Central or South American |
11.1 (0.04) | 13.7 (0.07) | 13.2 (0.14) | 11.6 (0.04) | 14.1 (0.07) | 13.6 (0.13) |
|
Other Hispanic |
11.8 (0.15) | 13.5 (0.12) | 13.1 (0.05) | 12.2 (0.13) | 13.5 (0.12) | 13.1 (0.04) |
| Non-Hispanic: | ||||||
|
White |
14.3 (0.02) | 14.4 (0.02) | 13.8 (0.004) | 14.1 (0.02) | 14.5 (0.02) | 13.9 (0.004) |
|
Black |
13.4 (0.04) | 13.9 (0.08) | 12.9 (0.01) | 13.1 (0.04) | 14.4 (0.07) | 13.2 (0.01) |
|
Asian |
14.7 (0.02) | 15.0 (0.04) | 14.3 (0.04) | 14.2 (0.02) | 15.2 (0.04) | 14.4 (0.04) |
|
Other race |
14.1 (0.16) | 14.2 (0.08) | 13.0 (0.02) | 14.4 (0.14) | 14.6 (0.08) | 13.3 (0.02) |
|
All Race/Ethnic Groups |
12.1 (0.01) | 13.9 (0.01) | 13.6 (0.004) | 12.3 (0.01) | 14.0 (0.01) | 13.8 (0.003) |
NOTE: Standard errors are reported in parentheses. The samples include people ages 25-59. The “first generation” consists of foreign-born individuals, excluding those born abroad of an American parent. The “second generation” consists of U.S.-born individuals who have at least one foreign-born parent. Remaining persons are members of the “third+ generation” (i.e., the third and all higher generations), which consists of U.S.-born individuals who have two U.S.-born parents. Sampling weights were used in the calculations. See Duncan and Trejo (2015) for further details on methodology.
SOURCE: Data from 2003-2013 Current Population Survey outgoing rotation group data.
TABLE 6-4 Average Education of Mexicans Ages 25-34 and 50-59, by Sex and Immigrant Generation
| National Origin and Age Group | Men, by Immigrant Generation | Women, by Immigrant Generation | ||||
|---|---|---|---|---|---|---|
| First | Second | Third+ | First | Second | Third+ | |
| Mexican | ||||||
|
Ages 25-34 |
9.8 (0.04) | 12.6 (0.04) | 12.6 (0.04) | 10.0 (0.04) | 12.9 (0.04) | 12.9 (0.03) |
|
Ages 50-59 |
8.2 (0.07) | 12.4 (0.11) | 12.4 (0.06) | 8.3 (0.08) | 12.2 (0.11) | 12.3 (0.05) |
NOTE: Standard errors are reported in parentheses. The samples include people ages 25-34 and 50-59. The “first generation” consists of foreign-born individuals, excluding those born abroad of an American parent. The “second generation” consists of U.S.-born individuals who have at least one foreign-born parent. Remaining persons are members of the “third+ generation” (i.e., the third and all higher generations), which consists of U.S.-born individuals who have two U.S.-born parents. Sampling weights were used in the calculations. See Duncan and Trejo (2015) for further details on methodology.
SOURCE: Data from 2003-2013 Current Population Survey outgoing rotation group data.
young third- and higher-generation Mexican Americans continue to trail the average schooling of their non-Hispanic white peers by more than a year.
Explaining Mexican American Educational Outcomes in the Third Generation
Because Mexican Americans are the largest immigrant group to the United States and have one of the longest histories of migration, an important question is whether their educational gains continue after the second generation, as Smith (2012) suggested, or stall or stagnate as other scholars have argued, such as Telles and Ortiz (2008). This issue has been much debated in the immigration literature (Perlmann, 2005; Portes, 2006; Telles and Ortiz, 2008; Alba et. al., 2011a; Haller et al., 2011a, 2011b; Perlmann, 2011; Alba et al., 2014; Park et al., 2014; Bean et al., 2015; Duncan and Trejo, 2015).
There are two interpretations of the outcomes among third generation and higher Mexican Americans. One is that the outcomes found are due in large part to measurement error stemming from the problem of identifying this group in the available data. The second interpretation holds that there has not in fact been progress beyond the second generation in educational attainment and explains this outcome in terms of both the legacy of high levels of undocumented immigration across generations and the reality
of racial and ethnic discrimination in the United States toward Latinos, including educational segregation and poor quality schooling for Mexican American children. Both interpretations and their supporting arguments are examined below.
Accurately Measuring the Third Generation
Intermarriage and selective identification among mixed ancestry individuals is a serious obstacle when using self-identification data such as the CPS data on third and higher generation Mexican Americans. Mexican Americans have had relatively high levels of intermarriage with other American ethnic groups, especially in later generations, and the children of such intermarriages are less likely to self-identify as Mexican than are the children of two Mexican-origin parents (Alba and Islam, 2009; Duncan and Trejo, 2009). This phenomenon, known as ethnic attrition, can bias estimates of characteristics such as education. Alba and Islam (2009) call this problem the “missing Mexicans.” Duncan and Trejo (2007, 2009, 2011a, 2011b) have extensively examined this phenomenon and found that this ethnic attrition is “highly selective, because Mexican Americans who intermarry tend to have much higher education and earnings than Mexican Americans who do not intermarry.3 Consequently, available data for third- and higher-generation Mexicans, who usually can be identified only by their subjective responses to questions about Hispanic ethnicity, understate the socioeconomic attainment of this population.” (Duncan and Trejo, 2015, p. 125). They concluded that “those Mexicans who intermarry tend to have higher levels of education and earnings, and many of the resulting children are not identified as Mexican in census data. In this way, selective intermarriage interacts with the intergenerational transmission of human capital and ethnic identity to create a situation in which available data for later-generation Mexican Americans may omit an increasingly large share of the most successful descendants of Mexican immigrants” (Duncan and Trejo, 2015, p. 126).
The complexity of ethnic identity among third generation Mexicans is evident in the analysis of CPS data on Mexican-ancestry children living with both parents (Duncan and Trejo, 2015). Only 17 percent of these children have a majority of their grandparents born in Mexico, and about 30 per-
___________________
3 The panel notes that although most of the research on ethnic attrition has studied Mexican Americans, and Mexican Americans are the focus of the analysis in this section of ther report, there is evidence that ethnic attrition occurs for other post-1965 immigrant groups, including other groups with Latin American origins (Duncan and Trejo, 2012; Emeka and Vallejo, 2011; Rumbaut, 2004) and Asian origin groups (Duncan and Trejo, 2012). Ethnic attrition may therefore be an important part of the explanation for third generation “stalling” or decline in socioeconomic progress of other immigrant groups, as well.
cent of third generation Mexican American children do not self-identify as Mexican. This is highly selective on education, and the high school dropout rate is 25 percent higher if the sample is limited to only those who self-identify as Mexican (Duncan and Trejo, 2015, p. 127). Research that has tried to correct for this ethnic attrition has found that educational attainment levels for third-only generation Mexican American groups are higher than those for second generation groups (Alba et al., 2011b; Bean et al., 2015). The hypothesis of ethnic attrition suggests that there is in fact educational progress in the third generation, but it is difficult to measure it well.
Explanations for Slow Educational Progress
The other interpretation of apparent Mexican American educational “stagnation” is to accept that there is less progress for the third generation and attempt to explain it through discrimination, racialization, and other factors such as family socialization. There is substantial historical evidence of third generation stagnation among Mexican Americans. Using data from a 1965 study of Mexican Americans in Los Angeles and San Antonio, Telles and Ortiz (2008) tracked down many of the original respondents and also found their children and grandchildren. The original respondents were mostly immigants who settled in the United States before 1929 and their children. The children of these respondents grew up in the 1940s and 1950s, and their grandchildren came of age in the 1960s and 1970s.
The analysis by Telles and Ortiz of these data, comparing actual grandparents, parents and children, found that the third generation experienced little or no educational mobility, which they attributed to racial discrimination and exclusion. Alba and colleagues (2014) reanalyzed these data and noted that educational attainment among Mexican Americans was particularly low in Texas as compared to California. They attributed this in part to higher degrees of discrimination and exclusion in Texas as a result of the legacies of “conquest and colonization.” Until the civil rights movement in the 1960s, Mexican American children in Texas attended segregated schools and had very low levels of educational attainment. Although it was less intense, Mexican Americans in California also experienced significant discrimination well into the civil rights era (Obregon Pagan, 2006; Fox, 2012). Whether similar patterns of discrimination and exclusion will limit educational attainment among the grandchildren of post-1970 Mexican and Central American immigrants is hotly debated and difficult to resolve, since the third generation of that wave of immigrants is very young and their educational attainment will not be measurable for several more decades.
Educational progress within and across generations for youth of recent immigrant ancestry depends on both school and family characteristics, so
inequalities in American schools constitute a source of concern. A national study found that Mexican-origin students are overrepresented, for example, in schools that are larger, have lower levels of teacher experience on average, and have higher concentrations of low-income students, compared with schools that have higher levels of students from other low-income immigrant or native-born backgrounds (Crosnoe, 2005). Other research found that teachers of students who are of immigrant origin and who have limited English proficiency not only have less teaching experience but also are more likely to report not feeling prepared to teach their students, compared with teachers of the native-born (Samson and Lesaux, 2015). In another study, although first generation Latino parents held relatively high expectations for the quality of U.S. schooling, teacher expectations for Latino immigrant students were lower than expectations for other pan-ethnic groups, such as East Asian immigrant students (Tenenbaum and Ruck, 2007).
Recent research has found that legal status is another important factor in socioeconomic integration and that the legacy of parents’ undocumented status can reverberate across generations (e.g., Bean et al., 2011, 2015). And undocumented status was found to hinder socioeconomic advancement not just for the undocumented immigrants themselves but also for their U.S.-born children (Bean et al., 2015). This handicap of legal status is relevant in considering the low educational attainment of second generation Mexicans and Central Americans, both of which are groups with high rates of undocumented status in the immigrant generation.
The legacies of earlier low levels of education can also influence children through family socialization practices that lead to slower intergenerational advancement in education. For example, higher levels of the kinds of parental stimulation that can aid cognitive development in early childhood—reading picture books with children, interactive play, singing songs—were observed among immigrant parents with higher levels of education (Cabrera et al., 2006). In other studies, immigrant mothers who increased their own education also appeared to engage more with their children’s schools (Crosnoe and Kalil, 2010; Kalil and Crosnoe, 2009). And parents from immigrant groups with lower levels of education, on average, were found to have young children with lower levels of cognitive skills than those from groups with higher levels (Cabrera et al., 2006; Crosnoe, 2007). In another study, such parents were also less likely to enroll their children in preschool education, which can help reduce early school-readiness disparities in cognitive skills between low-income immigrant-origin children and their higher-income, native-born counterparts (Yoshikawa et al., 2013).
Parents’ support of learning among older children can encompass a range of behaviors, including not just the traditional forms of academic socialization such as homework help but also behaviors that depend less on
language proficiency, such as structuring household routines, emphasizing academic values, ensuring attention to schoolwork, enrolling children in extracurricular activities, and engagement with children’s schools. Researchers have found that these behaviors differ by cultural group (e.g., Caplan et al., 1991; Chao, 1994), with some commonalities such as emphasis on obedience and proper behavior at school across the more often-studied Latino and Asian immigrant groups (Chao, 1994; González et al., 2013; Valenzuela, 2000). Others reported that socioeconomic class had a powerful influence across immigrant-origin and native-born groups in parents’ investments in learning opportunities such as supplemental lessons and after-school programs (Kornrich and Furstenberg, 2013; Lareau, 2011) and in time spent with children (Guryan et al., 2008).
However, barriers have been found to academic socialization of immigrant-origin parents, especially if they had limited English proficiency (Hill and Torres, 2010; Terriquez, 2012). Communication barriers between teachers, very few of whom were Latino, in high-concentration Latino schools and the students’ parents were an issue that researchers thought could be responsible for a disconnect between understanding of and intervention for students with low levels of achievement (Suárez-Orozco et al., 2015). Cultural differences in parent-teacher relationships in immigrants’ origin countries were also reported to impede efforts at academic socialization (Smith et al., 2008; Sohn and Wang, 2006). However, another study found that, with increasing time in the United States, immigrant parents’ involvement in their children’s schools increased (Terriquez, 2012).
Relevant to this debate, recent research highlights three promising trends. The first is rising high school completion rates for U.S.-educated Hispanics from 1990 to 2010, with particularly large gains during the second half of this period (Murnane, 2013). In another study, the dropout rate in 2012 fell to a record low of 15 percent (Lopez and Fry, 2013). Second, steady and substantial improvement from 2003 to 2013 were found in how Hispanic fourth and eighth graders scored on standardized math tests (Pane, 2014). Finally, Lopez and Fry (2013) reported that among recent high school graduates, for the first time a greater share of Hispanic graduates (49%) than white graduates (47%) were enrolled in college. And although the same researchers found that college completion rates for Hispanics continued to lag behind their white counterparts (Fry and Lopez, 2012), these recent results, if confirmed as continuing trends, point to rising educational levels for young Hispanic Americans.
In sum, although there is historical evidence to worry about the educational progress of Hispanic American youth, and Mexican American generations over time, recent studies provide reasons to be more optimistic. Nonetheless, the significant number of second generation immigrants with undocumented parents tempers this optimism. In the end, the current data
do not allow the panel to project with confidence what the long term patterns of educational advance will be for Mexican Americans and others of Hispanic ancestry.
EMPLOYMENT
Unlike many European countries, the United States has a very open labor market, and immigrants, even undocumented ones, have ready access to employment (Gautie and Schmitt, 2009). Table 6-5 provides employment rates, based on statistical sampling of CPS data, by generation and education for both men and women. Throughout this discussion, an employment rate represents the percentage of individuals of the stated group who were employed during the week they were surveyed by the CPS. For the period from 2003 through 2013, the employment rate for all males and all educational levels was slightly higher for the foreign-born (86%) than for U.S.-born generations (83% for the second generation and 82% for the third and higher generations). Among women, the pattern is reversed, with a substantially lower employment rate for immigrants (61%) than for the native born (roughly 72% for both the second generation and the third and higher generations).4
For the first generation, prior research found that employment integration occured relatively quickly, with immigrant employment rates rising sharply (e.g., by as much as 20 percentage points) during the first few years after arrival in the United States; thereafter, employment rates did not change much with further time in the country.5 As a result, if one disregards recent arrivals and instead focuses on the employment rates of immigrants who have been here long enough to be past the initial period of adjustment to the U.S. labor market, employment rates for the foreign-born are a few percentage points higher than those shown in Table 6-5 (Duncan and Trejo, 2012).
These modest overall differences obscure the dramatic differences in employment at the bottom of the educational attainment distribution. For just men with low education, the differentials in employment by generation in Table 6-5 are very large. Among males with less than 12 years of schooling, the average employment rate of the first generation during 2003-2013 (84%) exceeded that of the second generation by 21 percentage points and
___________________
4 Perhaps not surprisingly, U.S. employment rates were lower during this period for immigrant women originating in countries with more traditional gender roles and lower levels of female participation in labor-market work (Antecol, 2000; Blau and Kahn, 2011; Blau et al., 2011). A large share of U.S. immigration originates in such countries, which helps to explain the lower overall employment rate of foreign-born women relative to U.S.-born women.
5 See, for example, Chiswick and colleagues, (1997), Funkhouser and Trejo (1998), Schoeni (1998a), Funkhouser (2000), and Antecol and colleagues (2006).
TABLE 6-5 Employment Rates (percentage), Ages 25-59, by Education Level, Sex, and Immigrant Generation
| Men, by Immigrant Generation | Women, by Immigrant Generation | |||||
|---|---|---|---|---|---|---|
| Education Level | First | Second | Third+ | First | Second | Third+ |
| Years of education: | ||||||
|
< 12 |
83.9 (0.25) | 63.4 (1.09) | 58.2 (0.30) | 47.5 (0.35) | 42.9 (1.15) | 40.8 (0.32) |
|
12 |
84.9 (0.24) | 80.0 (0.44) | 78.3 (0.11) | 59.7 (0.32) | 65.6 (0.54) | 66.6 (0.13) |
|
13-15 |
84.0 (0.33) | 83.0 (0.41) | 83.6 (0.11) | 68.1 (0.38) | 73.1 (0.45) | 73.6 (0.12) |
|
16+ |
89.0 (0.21) | 89.8 (0.29) | 91.3 (0.08) | 70.4 (0.29) | 80.1 (0.36) | 81.1 (0.10) |
| All education levels | 85.7 (0.13) | 83.2 (0.22) | 82.3 (0.06) | 61.4 (0.17) | 72.1 (0.25) | 71.9 (0.07) |
NOTE: The reported figures give the percentage of individuals who were employed during the week they were surveyed by the CPS. Standard errors are reported in parentheses. The samples include people ages 25-59. The “first generation” consists of foreign-born individuals, excluding those born abroad of an American parent. The “second generation” consists of U.S.-born individuals who have at least one foreign-born parent. Remaining persons are members of the “third+ generation” (i.e., the third and all higher generations), which consists of U.S.-born individuals who have two U.S.-born parents. Sampling weights were used in the calculations. See Duncan and Trejo (2015) for further details on methodology.
SOURCE: Data from 2003-2013 Current Population Survey outgoing rotation group data.
exceeded that of the third and higher generations by 26 percentage points. The data for women did not show such dramatic differences, even among women with less than 12 years of schooling, where the immigrant employment rate exceeds that of natives by just 5-7 percentage points.
The high employment levels for the least educated immigrants indicates that employer demand for low-skilled labor remains high. There are still many jobs in the United States for low skilled workers (Lockard and Wolf, 2012). Among the important reasons cited for this high demand have been the substantial shrinkage since 1990 of the U.S.-born, younger, less-skilled working-age population (those who are native born, ages 25-44, and with educational attainment of a high school diploma or less), owing to the aging of Baby Boomers; higher educational attainment among the U.S.-born; and a fertility rate below the replacement rate for the U.S.-born (Alba, 2009; Bean et. al., 2011; Bean et al., 2015). In other words, immigrants appear to be taking low-skilled jobs that natives are either not available or unwilling to take.
Next, the panel uses CPS data sampled over the same period, 2003-2013, to explore how employment patterns vary across racial/ethnic groups. Figures 6-3 (for men) and 6-4 (for women) show how employment patterns varied across racial/ethnic groups by generation, comparing them to the reference group of third and higher generation, non-Hispanic whites. A negative differential implies that the reference group had a higher employment rate than the group in question, whereas a positive differential indicates the opposite. The top panel of each figure displays the employment differentials that remain after using regression analysis to control for the influence of age, geographic location, and survey month/year. The bottom panel of each figure shows what happens to the estimated employment differentials when the underlying regressions also control for education level.
Figure 6-3 indicates that, for men, in spite of the low educational levels of Hispanic immigrants in general and Mexican immigrants in particular, these two groups had employment rates very similar to those of third and higher generation non-Hispanic whites. Second generation and third and higher generation Hispanic and Mexican men did have modest employment deficits relative to the reference group, but the bottom panel of Figure 6-3 suggests that these deficits are explained in large part by the lower education levels of U.S.-born Hispanics and Mexicans relative to the reference group. Asian men of all generations exhibit employment propensities similar to those of third and higher generation non-Hispanic whites.6 However, employment rates for black men are much lower; the corresponding employment deficits are modest (4 percentage points) for
___________________
6 Though not shown in Figure 6-3, employment rates for non-Hispanic white men are almost identical across generations, with or without controls for education.
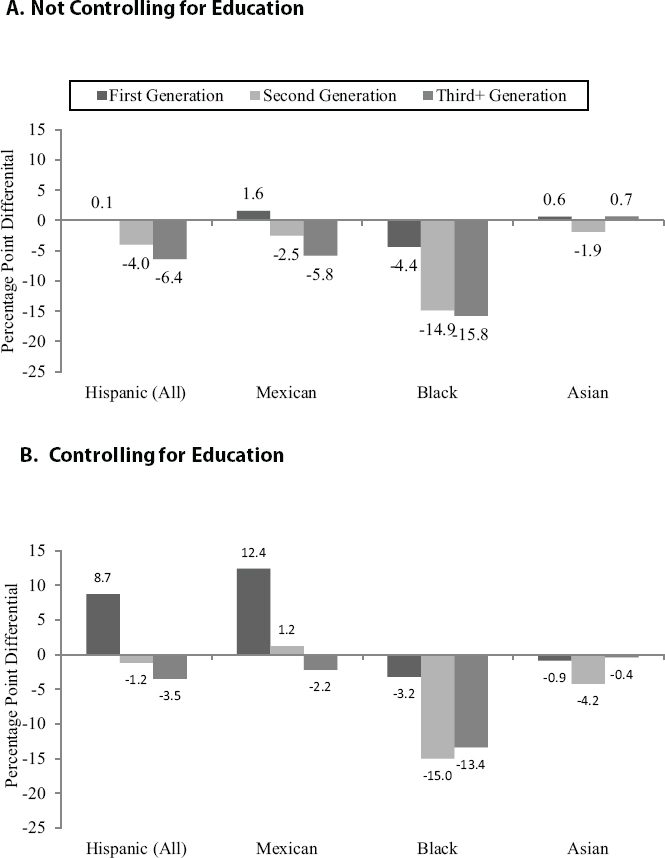
NOTE: The reported figures represent employment rate differentials between each race/ethnicity and immigrant generation group and the reference group of third+ generation, non-Hispanic whites. These differentials are estimated from least squares regressions in which the dependent variable is a dummy identifying individuals who were employed during the CPS survey week. The samples include men ages 25-59. All regressions include controls for age, geographic location, and survey month/year. The differentials shown in the bottom panel are from regressions that also control for education level.
SOURCE: Data from 2003-2013 Current Population Survey outgoing rotation group data.
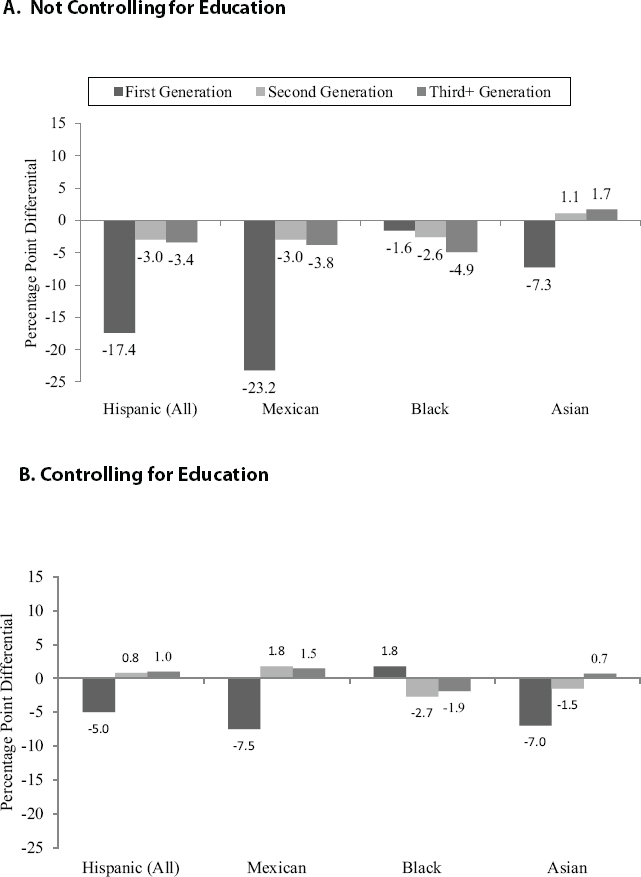
NOTE: The reported figures represent employment rate differentials between each race/ethnicity and immigrant generation group and the reference group of third+ generation, non-Hispanic whites. These differentials are estimated from least squares regressions in which the dependent variable is a dummy identifying individuals who were employed during the CPS survey week. The samples include women ages 25-59. All regressions include controls for age, geographic location, and survey month/ year. The differentials shown in the bottom panel are from regressions that also control for education level.
SOURCE: Data from 2003-2013 Current Population Survey outgoing rotation group data.
black male immigrants but much larger (15 percentage points) for the second and later generations. Conditioning on education has only minor effects on these deficits.7
For women, Figure 6-4 shows that employment rates were relatively low for first-generation Hispanics, especially for immigrants from Mexico. For first-generation Hispanic women, the employment deficit relative to the reference group of third generation and higher non-Hispanic white women is 17 percentage points; for first-generation Mexican women the deficit climbs above 23 percentage points. These deficits shrink considerably, to 5 and 7.5 percentage points, respectively, after accounting for the low education levels of Hispanic immigrant women (see lower half of Figure 6-4). The corresponding employment deficits are much smaller for foreign-born black (2 percentage points) and Asian (7 percentage points) women. Boyd (1984) concluded that immigrant women are particularly disadvantaged in the labor market due to their gender. Schoeni (1998b) cited immigrant women’s lower human capital as a limiting factor on their employment prospects, while Donato and colleagues (2014) cited marital status. Among U.S.-born women, however, the employment rates in Figure 6-4 do not vary much by race/ethnicity, particularly after conditioning on education.8
EARNINGS
When they first arrive, immigrants earn less than natives of comparable skill levels. This may be because they are not sufficiently proficient in English or because they lack knowledge that is valued by the U.S. labor market. Early research on the economic integration of immigrants focused on how long it would take for immigrant earnings to catch up with the native-born. Chiswick (1978) concluded that immigrants would catch up within 15 years as they acquired language and U.S.-specific labor market experience. Borjas (1985) pointed out that these conclusions were based on cross-sectional data but were making longitudinal cohort conclusions; he suggested that Chiswick had been overly optimistic and that recent immigrants would not catch up to the native-born over time. More recently, research by Lubotsky (2007) examined true longitudinal data on immigrants earnings using Social Security records. He found that immigrants do experience earnings growth as length of residency increases, but they do
___________________
7 Research by Donato and colleagues (2015) indicates that black immigrants of both genders from the Caribbean actually have higher employment rates than do the black native-born, suggesting within-race variation based on country or region of origin.
8 Among non-Hispanic white women, employment rates, determined as in Figures 6-3 and 6-4, were about 9 percentage points lower for immigrants than for U.S.-born women, with little variation between the second and later generations of the U.S.-born (not shown in Figure 6-4). Controlling for education did not alter this pattern.
not fully catch up to the native-born. He concluded that “over their first 20 years in the United States, immigrant earnings grow by 10-15 percent relative to the earnings of native-born workers” (Lubotsky, 2007, p. 864).
Consistent with other research (Borjas, 1995; Trejo, 2003; Blau and Kahn, 2007; Borjas and Katz, 2007), Lubotsky also found that earnings assimilation is considerably slower for Hispanic (predominantly Mexican) immigrants than for other immigrants. A majority of Mexican immigrants currently present in the United States are undocumented, and one possible reason for the slower wage growth among Mexican immigrant workers, beyond their low educational levels, is the effect of being undocumented on wages. Studies show that the 1986 Immigration Reform and Control Act (IRCA), which criminalized the hiring of undocumented workers, and the massive increase in the number of undocumented migrants in labor markets throughout the United States have put substantial downward pressure on the wages not just of undocumented migrants but of all immigrant workers (Donato and Massey, 1993; Donato et al., 2008; Massey and Gelatt, 2010; Massey and Gentsch, 2014; Warren and Warren, 2013). Whereas undocumented status did not negatively affect earnings prior to IRCA, afterward it carried a 21 percent wage penalty (Phillips and Massey, 1999). Caponi and Plesca (2014) found that, in addition to lowering wages among immigrant workers, undocumented status itself carries a substantial wage penalty. Hall and colleagues (2010) estimated a 17 percent wage disparity between documented and undocumented Mexican immigrant men and a 9 percent wage disparity among Mexican immigrant women, as well as large differences in returns to human capital by legal status. Gentsch and Massey (2011) likewise found that the shift to a new and more intense regime of harsh border and internal enforcement coincided with a drop in the economic returns to a variety of forms of human and social capital, constraining both occupational attainment and earnings. The high proportion of undocumented immigrants therefore may drag down Mexican immgrants’ overall earnings.
Another potential barrier to earnings mobility among immigrants is skin color discrimination. Using data from the New Immigrant Survey, Hersch (2008) demonstrated that wages systematically decline as skin color darkens. After controlling for education, English-language ability, source country occupation, family background, ethnicity, race, and country of birth, she found that immigrants with the lightest skin color earned 17 percent more than those with the darkest skin color. In a later analysis of the spouses of main respondents to the New Immigrant Survey, Hersch (2011) found that compared to immigrants with the darkest skin tone, those with the lightest experienced 16 to 23 percent greater earnings, even after controlling for labor market conditions in addition to respondent characteristics. Moreover, the skin color penalty did not disappear with time spent
in the United States, underscoring the persistence of color stratification in U.S. labor markets.
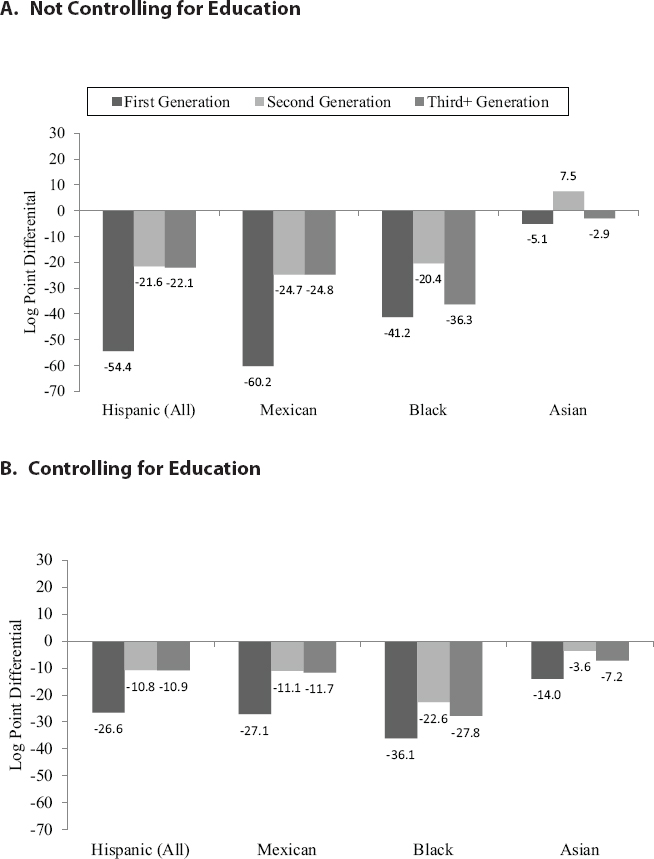
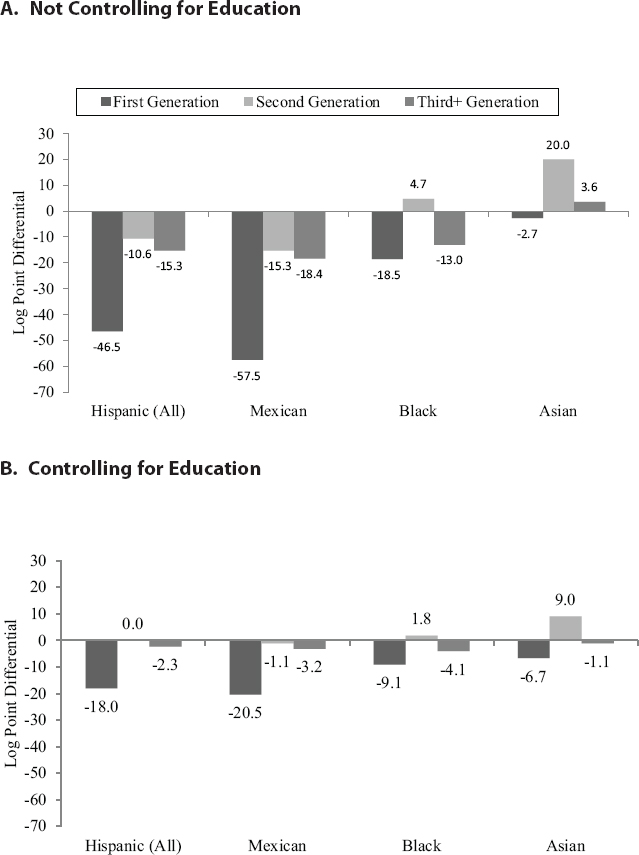
What about earnings mobility beyond the immigrant generation? To illustrate some basic patterns relevant for this question, Figures 6-5 (for men) and 6-6 (for women) present weekly earnings differentials similar to the employment differentials shown previously in Figures 6-3 and 6-4.9 As before, the reported differentials are all relative to the reference group consisting of non-Hispanic whites in the third and higher generations.10 Because the outcome is weekly earnings, these differentials measure the cumulative effect of differences in both hourly wages and hours worked per week.
For Hispanics overall and for Mexicans in particular, the earnings deficits in Figures 6-5 and 6-6 display a similar pattern across generations as the education data presented earlier (see Table 6-3): large gains for the second generation over the first, with little or no evidence of further gains for third and higher generations. Among men, for example, the Hispanic earnings deficit (relative to third and higher generation non-Hispanic whites) drops from about 50 percent for the first generation to 22 percent for the second generation, but there is no additional decline for third and higher generations. The corresponding pattern for Mexican men is quite similar. However, comparing the top and bottom panels of Figure 6-5, the earnings deficits for Hispanic and Mexican men of every generation shrink by more than half after controlling for education. Earnings gains for Hispanic and Mexican women between the first and second generations are even larger than for men, and earnings deficits all but disappear for U.S.-born Hispanic and Mexican women when controlling for education (see Figure 6-6). On the whole, these results suggest that the educational disadvantage of Hispanics accounts for much of their earnings deficit. In addition, Hispanic gains in educational attainment between the first and second generations appear to play an important role in the earnings progress between these generations.
Among the U.S.-born groups, third and higher generation black men stand out, with earnings deficits that remain large even after controlling for
___________________
9 Here, the dependent variable for the underlying regressions is the natural logarithm of weekly earnings from wage and salary work (the CPS outgoing rotation group data do not report self-employment income), and the samples include individuals ages 25-59 who are employed in civilian wage and salary jobs. Otherwise, these regressions are the same as those described previously for employment.
10 For ease of exposition, we will refer to the estimated log earnings differentials as if they represented percentage earnings differences. Strictly speaking, however, log differentials closely approximate percentage differences only when the log differentials are on the order of .25 or less in absolute value. For larger differentials, the implied percentage difference can be calculated as ec – 1, where c is the log differential and e is Euler’s number (i.e., the base of natural logarithms).
NOTE: The reported figures represent log weekly earnings differentials between each race/ethnicity and immigrant generation group and the reference group of third+ generation, non-Hispanic whites. These differentials are estimated from least squares regressions in which the dependent variable is the natural logarithm of weekly earnings. The samples include men ages 25-59 employed in civilian wage and salary jobs. All regressions include controls for age, geographic location, and survey month/year. The differentials shown in the bottom panel are from regressions that also control for education level.
SOURCE: Data from 2003-2013 Current Population Survey outgoing rotation group data.
NOTE: The reported figures represent log weekly earnings differentials between each race/ethnicity and immigrant generation group and the reference group of third+ generation, non-Hispanic whites. These differentials are estimated from least squares regressions in which the dependent variable is the natural logarithm of weekly earnings. The samples include women ages 25-59 employed in civilian wage and salary jobs. All regressions include controls for age, geographic location, and survey month/year. The differentials shown in the bottom panel are from regressions that also control for education level.
SOURCE: Data from 2003-2013 Current Population Survey outgoing rotation group data.
educational attainment. Third and higher generation black men earn about 28 percent less than their non-Hispanic white counterparts with similar education. The corresponding deficit is much smaller for Hispanics (11% overall, 12% for Mexicans). These findings corroborate other research suggesting that, among men, U.S. labor market opportunities for Hispanics are more similar to those of whites than are the opportunities for blacks (Trejo, 1997; Grogger and Trejo, 2002; Duncan et al., 2006). The bottom panel of Figure 6-6 shows that, after controlling for education, earnings of U.S.-born women do not vary much with race/ethnicity.
In contrast with blacks and Hispanics, earnings deficits (relative to third and higher generation non-Hispanic whites) are either small or nonexistent for first and second generation white immigrants (not shown in the figures) and for Asian immigrants of all generations. However, earnings comparisons for Asians become less favorable after controlling for education. As others have noted (Sakamoto et al., 2009), the schooling advantage of native-born Asian Americans can obscure the fact that, at least among men, they tend to earn somewhat less than non-Hispanic whites with the same level of education.
OCCUPATION
Immigrants make up 13 percent of the population overall, but 16 percent of the civilian workforce ages 16-64 (Singer, 2012). There is a longstanding tendency of immigrants to concentrate in certain occupations and industries. Most Americans would instantly recognize these concentrations: Filipino American nurses, Mexican American farmworkers, Korean American shopkeepers. These ethnic concentrations have been a springboard for the first generation and sometimes have persisted for several generations (Lieberson and Waters, 1988). Such concentrations occur throughout the occupational structure, but immigrants make a special contribution to highly skilled, creative, and scientific occupations. The panel highlights these concentrations by examining Census Bureau data from 1950-2010 on detailed occupations by nativity, focusing on the subset of occupational roles that correspond to positions of high achievement and creativity.11
In the panel’s analysis, immigrants did not dominate any single occupation. Even in immigrant niches, such as private household workers
___________________
11 The Census Bureau data analyzed here are actually random samples (usually 1%) of the total population, and the samples are restricted to persons ages 25 to 64 in the experienced labor force, who reported an occupation. The 2010 data are based on the American Community Survey, which has replaced the long form census. Some persons are missed (undercounted) in censuses, and the foreign-born are probably more likely to be undercounted than the native-born. These sampling errors are estimated by the Census Bureau to be small (1% to 3%), however, and are unlikely to affect any of the patterns reported here.
(42%) and farm laborers (30%), immigrants were still a minority, although it is possible that in some regions of the country and in more detailed occupational categories immigrants do make up a much larger share. In the highly skilled professions of science and technology, immigrants comprised about one-fifth to one-third of all workers. While immigrants comprised an important, and perhaps a critical, share in some highly skilled occupations, native-born Americans still comprised the majority of workers in these roles.
The summary occupational classification in Table 6-6 contains 7 major and 25 detailed occupational categories.12 In collapsing categories, the panel has highlighted the occupations of immigrant concentration (“niches”) and immigrant participation in scientific and cultural professions. At the least-skilled end of the occupational structure, we have combined two of the largest groups, Operatives and Laborers into one major category. At the top of the earnings distribution, we identified seven detailed occupations within the major group of Managerial and Professional Specialty Occupations. Military Occupations is only included for the sake of completeness among all workers in the Experienced Labor Force, since relatively few immigrants are in military occupations.
In 1950, immigrants comprised about 8 percent of the experienced labor force, and this figure shrank to 5.2 percent in the 1970s as the wave of early 20th century immigrants aged and left the workforce. From 1970 to 2010, the relative share of foreign-born workers increased by 2 to 3 percentage points each decade, reaching 15 percent of all workers in 2010, triple the 1950 level (see Table 6-6).To create a consistent measure of relative immigrant concentration in occupations that is independent of these historical fluctuations in the size of the foreign-born population and the size of each occupation, the panel created an index of immigrant concentration relative to the native-born for each occupation and for each census year in (Table 6-6).13 For managerial or professional specialty occupations in 1950, for instance, the number 1.23 means that immigrants were 23 per-
___________________
12 These are based on the IPUMS USA variable in OCC 1990 (Ruggles et al., 2010). OCC 1990 was constructed by the Minnestoa Population Center to be a consistent occupational classification across all U.S. censuses and surveys since 1950. For further details, see https://usa.ipums.org/usa/chapter4/chapter4.shtml [September 2015].
13 Specifically, each cell in Table 6-10 shows the ratio of the percent of all immigrants in an occupation to the percent of all native-born workers in the same occupation:
Where FBi = the number of foreign-born workers in occupation i
FBt = the total number of foreign-born workers in the experienced labor force with a reported occupation
NBi = the number of native-born workers in occupation i
NBt = the total number of native-born workers in the experienced labor force with a
reported occupation.
TABLE 6-6 Index of Relative Occupational Concentration of Foreign-Born Workers, Ages 25-64, of Experienced Labor Force, United States, 1950 to 2010
| IPUMS Codes | Total Experienced Labor Force with Reported Occupation | |
|---|---|---|
| 003-200 | MANAGERIAL AND PROFESSIONAL SPECIALTY OCCUPATIONS | |
| 003-037 | 1 | Exec., Admin., and Managerial and Related |
| 043-059 | 2 | Engineers, Architects, and Surveyors |
| 064-068 | 3 | Mathematical and Computer Scientists |
| 069-083 | 4 | Natural Scientists |
| 084-089 | 5 | Physicians and Other Health Diagnosing |
| 183-200 | 6 | Writers, Artists, Entertainers, and Athletes |
| 095-179, 200 | 7 | Health, Teachers, Lawyers, Religious and Other Related Professionals |
| 201-400 | TECHNICAL, SALES, AND ADMINISTRATIVE SUPPORT OCCUPATIONS | |
| 203-235 | 8 | Technicians and Related Support Occupations |
| 243-283 | 9 | Sales Occupations |
| 303-389 | 10 | Administrative Support Occupations, Clerical |
| 401-470 | SERVICE OCCUPATIONS | |
| 405-407 | 11 | Private Household Occupations |
| 415-427 | 12 | Protective Service Occupations |
| 434-444 | 13 | Food Preparation and Service Occupations |
| 445-447 | 14 | Health Service Occupations |
| 448-455 | 15 | Cleaning and Building Service, Except Households |
| 456-469 | 16 | Personal Service Occupations |
| 471-500 | FARMING, FORESTRY, AND FISHING OCCUPATIONS | |
| 473-476 | 17 | Farm Operators and Managers |
| 479-498 | 18 | Other Agricultural and Related Occupations |
| Index of Relative Occupational Concentration | ||||||
|---|---|---|---|---|---|---|
| 1950 | 1960 | 1970 | 1980 | 1990 | 2000 | 2010 |
| 1.23 | 1.04 | 1.02 | 0.96 | 0.87 | 0.82 | 0.86 |
| 1.54 | 1.16 | 0.94 | 0.89 | 0.84 | 0.80 | 0.84 |
| 0.86 | 1.12 | 1.52 | 1.53 | 1.43 | 1.32 | 1.42 |
| 0.98 | 0.87 | 0.85 | 1.14 | 1.23 | 1.06 | 1.17 |
| 0.73 | 1.23 | 1.84 | 1.50 | 1.52 | 2.22 | 2.38 |
| 1.36 | 2.21 | 2.93 | 2.74 | 2.00 | 1.88 | 1.83 |
| 1.12 | 1.24 | 1.40 | 1.18 | 0.99 | 0.86 | 0.88 |
| 0.66 | 0.72 | 0.86 | 0.79 | 0.68 | 0.64 | 0.69 |
| 0.63 | 0.76 | 0.86 | 0.82 | 0.82 | 0.79 | 0.79 |
| 0.83 | 0.92 | 1.10 | 1.06 | 1.02 | 1.09 | 1.13 |
| 0.83 | 0.91 | 0.88 | 0.80 | 0.86 | 0.85 | 0.82 |
| 0.52 | 0.66 | 0.83 | 0.79 | 0.76 | 0.70 | 0.68 |
| 1.38 | 1.23 | 1.15 | 1.20 | 1.33 | 1.31 | 1.36 |
| 2.12 | 1.93 | 1.41 | 1.97 | 2.66 | 3.10 | 4.09 |
| 0.95 | 0.58 | 0.40 | 0.47 | 0.50 | 0.47 | 0.45 |
| 1.50 | 1.30 | 1.36 | 1.36 | 1.54 | 1.49 | 1.42 |
| 0.60 | 0.73 | 0.87 | 1.02 | 1.03 | 1.12 | 1.28 |
| 1.97 | 1.71 | 1.36 | 1.19 | 1.46 | 1.56 | 1.58 |
| 1.23 | 1.15 | 0.96 | 1.17 | 1.19 | 1.12 | 1.24 |
| 0.54 | 0.82 | 0.88 | 1.18 | 1.60 | 1.98 | 1.85 |
| 0.40 | 0.43 | 0.33 | 0.30 | 0.39 | 0.36 | 0.27 |
| 0.72 | 1.23 | 1.32 | 1.83 | 2.36 | 2.74 | 2.41 |
| IPUMS Codes | Total Experienced Labor Force with Reported Occupation | |
|---|---|---|
| 501-700 | PRECISION PRODUCTION, CRAFT, AND REPAIR OCCUPATIONS | |
| 503-549 | 19 | Mechanics and Repairers |
| 558-599 | 20 | Construction Trades |
| 666-674 | 21 | Precision Textile, Apparel, and Furnishings |
| 686-688 | 22 | Precision Food Production Occupations |
| 657-659, 614 - 684, 693-699 | 23 | All Other Precision and and Craft Occupations |
| 701-900 | 24 | OPERATORS, FABRICATORS, AND LABORERS |
| 095 | 25 | MILITARY OCCUPATIONS |
NOTES:
Unemployed and other workers without a reported occupation are excluded:
Index of immigrant concentration = [(FBI/FBt) / (NBI/NBt)]
Where FBI = the number of foreign-born workers in occupation i
FBt = the total number of foreign-born workers in the experienced labor force with a reported occupation
NBI = the number of native-born workers in occupation i
NBt = the total number of native-born workers in the experienced labor force with a reported occupation
SOURCE: Ruggles et al. (2010).
cent more likely than native-born workers to be working in a managerial or professional occupation in 1950. In 2010 the number was 0.86, meaning immigrant workers were 14 percent less likely than the native-born to be working in these occupations, although there is great variability across sub-categories.
The trends across rows in Table 6-6 can be used to divide the displayed occupations into three categories: (1) consistent immigrant occupations, or occupations in which immigrants have been overrepresented for the entire period (all index values in that row in Table 6-6 are greater than 1); (2) consistent non-immigrant occupations, in which immigrants have always been underrepresented during this period, relative to natives (all index values in the row are less than 1); and (3) occupations in transition, or occupations that have shifted from underrepresentation (a value less than
| Index of Relative Occupational Concentration | ||||||
|---|---|---|---|---|---|---|
| 1950 | 1960 | 1970 | 1980 | 1990 | 2000 | 2010 |
| 1.27 | 1.40 | 1.07 | 0.97 | 0.99 | 1.02 | 1.04 |
| 0.86 | 0.91 | 0.77 | 0.82 | 0.86 | 0.85 | 0.80 |
| 1.25 | 1.16 | 1.04 | 0.84 | 0.95 | 1.09 | 1.26 |
| 4.03 | 3.81 | 4.95 | 4.43 | 4.56 | 3.69 | 3.98 |
| 2.64 | 2.73 | 2.31 | 1.95 | 1.76 | 2.31 | 2.27 |
| 1.28 | 1.18 | 1.03 | 0.99 | 0.89 | 0.82 | 0.75 |
| 1.13 | 1.03 | 1.10 | 1.21 | 1.22 | 1.33 | 1.30 |
| 0.44 | 0.37 | 0.60 | 0.75 | 0.60 | 0.59 | 0.46 |
1) to overrepresentation (a value greater than 1), or the opposite, between 1950 and 2010.
As Table 6-6 indicates, in general immigrants are overrepresented in the lower ranks of blue collar jobs, including Operators (of machines) and Laborers, Farm Laborers (except in 1950), and Service Workers (Table 6-6, Rows 18 and 24). Consistent immigrant occupations include service workers in private households, food preparation, and in cleaning and building services. Immigrants are also overrepresented in some skilled trades including textiles and apparel (e.g., garment workers and tailors) and food production (e.g., meatpacking) (Table 6-6, Rows 21 and 22). Foreign-born workers are often recruited for work in these industries, and lack of English proficiency is less of a barrier to employment in these occupations (Rodriguez, 2004). The one high status occupation that has always had a consistent overrepresentation of immigrants is physicians (which include
other highly trained health-diagnosing occupations) (Table 6-6, Row 5). In contrast, immigrants are typically underrepresented in most other higher and medium status occupations such as teachers, lawyers, clerical and administrative support workers, sales workers, protective service workers, farm operators and managers, and mechanics (Table 6-6, Rows 7, 17, 19).
As shown in Table 6-6, the concentration of immigrants in all managerial and professional occupations declined, albeit unevenly, from overrepresentation (index of 1.23) in 1950 to underrepresentation (0.86) in 2010. The overall decline is primarily due to the sharp drop in managers. The foreign-born are also underrepresented for teachers, health (not physicians), lawyers, religious and other related professionals, the second largest group in managerial and professional occupations (Table 6-6, Row 7). There are, however, interesting trends in some of the specialized professional occupations. The foreign-born were overrepresented in “‘Writers, Artists, Entertainers, and Athletes” (panel category 6 in Table 6-6) in the early post–World War II era, but were underrepresented in recent decades.
Instead, the overrepresentation of immigrants in areas of exceptional contribution to American society has shifted over time from cultural and artistic fields (Writers, Artists, Entertainers, and Athletes) in the period 1950-1980 to engineering, computing, and scientific professions since 1980.14 As shown in Table 6-6, immigrants are a growing presence in highly skilled scientific and technical professions, including Engineers and Architects (row 2), Mathematical and Computer Scientists (row 3), and Natural Scientists (row 4). Somewhat related, there has also been increasing representation of immigrants in Technicians and Related Support Occupations (row 8) and in Health Service Occupations (row 14). Immigrants were overrepresented in Construction Trades (row 20) during the early years of this period (1950s and 1960s) and recently in 2000 and 2010.
___________________
14 Two additional qualifications to the findings in Table 6-6 should be noted. The concentration of immigrants in specific occupational niches (including highly skilled professions) is not related to the size or growth of specific occupations. Each of the highly skilled professions are very small (about 1 to 2% or less of the experienced labor force), some have grown rapidly, such as computer scientists, while others have only grown modestly, such as engineers, natural scientists, and physicians. Many rapidly growing occupations, including sales, highly skilled executives and managers, teachers, and protective service, have a below-average representation of immigrants. But a few rapidly growing occupations, including technicians and health service workers, have attracted immigrants. Immigrants have also become more concentrated in many declining occupations (in relative size), such as private household workers and operators and laborers. Other occupations, which have no clear trend of growth or decline, have also become immigrant niches, such as farm laborers and the construction trades. The forces that shape immigrant participation appear to be largely independent of those affecting occupational growth and decline.
Intergenerational Change in Occupations
The occupational distributions of the first and second generations reveal a picture of intergenerational change and stability similar to the ones presented above for education and earnings. The ethnoracial and regional origin groups in the immigrant generation that are concentrated in low-status occupations improve their occupational position substantially in the second generation but still fall short of parity with third and later generation Americans (see Table 6-7). The groups whose immigrants are unusually clustered in high-level occupations, mostly professional and technical, maintain their above-average position in the second generation. These groups increase their representation in jobs in “management, business, and financial” occupations that typically require more proficiency in the English language and in the mainstream culture than most immigrants can manage.
Some of the major Latin American groups, such as Mexicans and Central Americans, illustrate the first pattern. The immigrants from Mexico and Central America are more likely to take jobs in the lower tiers of the occupational hierarchy (Brick et al., 2011). They are most overrepresented in the service, construction, and agricultural categories. They are also more likely than other workers to have nonstandard, and more precarious, forms of employment, taking for example short-term jobs or working for contractors (Luthra and Waldinger 2010). Few are in management or other business and financial occupations or in “professional” positions (a category that includes numerous scientific, teaching, health and arts-related occupations as well). For instance, as shown in Table 6-7, approximately 7 percent of Mexican-born men and 9 percent of men born in Central America work at jobs in these categories; by comparison, 36 percent of all third and higher generation men work at such jobs.
As the table shows, the Mexican and Central American second generations make a large leap in occupational terms, relative to the first generation in this dataset. Twenty-two percent of second generation Mexican men and 31 percent of second generation Central American men were in professional or managerial positions; the latter figure is intermediate between that for third generation Hispanic men and third generation Anglo men. The panel’s analysis of the CPS data indicates that second generation men are, like their immigrant fathers, overrepresented in service jobs (but have largely left agricultural ones). The leap for second generation women is even greater than for men of that generation, and the gap separating them from third and later generation women narrows greatly (even closing in the case of second generation Central American women). Moreover, the job situations of the second generation are improved, relative to the immigrant generation, in other ways: second generation Mexican men are less likely than their immigrant parents to take informal jobs (Waldinger et al., 2007),
TABLE 6-7 Representation of Groups in Professional and Managerial Occupations, by Generation
| 1st Generation | 2nd Generation | 3rd Generation | |||||||
| Prof. | Manag. | Both | Prof. | Manag. | Both | Prof. | Manag. | Both | |
| Men | |||||||||
|
Hispanics |
4.9 | 5.8 | 10.7 | 12.9 | 12.6 | 25.5 | 12.5 | 11.9 | 24.4 |
|
Mexicans |
2.7 | 4.1 | 6.8 | 11.5 | 10.4 | 21.9 | |||
|
Central Americans |
4.2 | 5.1 | 9.3 | 15.6 | 15.6 | 31.2 | |||
|
Cubans |
11.3 | 13.4 | 24.7 | 21.5 | 23.0 | 44.5 | |||
|
Asians |
34.3 | 17.0 | 51.3 | 35.1 | 20.8 | 55.9 | 27.6 | 18.8 | 46.4 |
|
Chinese, incl HK and Tn |
41.7 | 18.4 | 60.1 | 39.7 | 24.8 | 64.5 | |||
|
Filipino |
27.3 | 11.2 | 38.5 | 28.1 | 15.8 | 43.9 | |||
|
Indians |
52.6 | 21.9 | 74.5 | 47.3 | 24.3 | 71.6 | |||
|
Black |
17.5 | 10.1 | 27.6 | 26.5 | 12.0 | 38.5 | 13.0 | 9.6 | 22.6 |
|
White |
24.4 | 20.4 | 44.8 | 23.9 | 23.2 | 47.1 | 19.0 | 19.8 | 38.8 |
| Women | |||||||||
|
Hispanics |
10.4 | 6.3 | 16.7 | 23.7 | 13.5 | 37.2 | 21.2 | 12.5 | 33.7 |
|
Mexicans |
6.8 | 4.5 | 11.3 | 21.9 | 12.4 | 34.3 | |||
|
Central Americans |
8.4 | 5.6 | 14.0 | 28.7 | 16.0 | 44.7 | |||
|
Cubans |
18.9 | 13.0 | 31.9 | 36.1 | 19.7 | 55.8 | |||
|
Asians |
30.9 | 15.2 | 46.1 | 38.0 | 20.3 | 58.3 | 32.5 | 19.1 | 51.6 |
|
Chinese, incl HK and Tn |
33.4 | 19.5 | 52.9 | 45.5 | 19.7 | 65.2 | |||
|
Filipino |
36.4 | 12.8 | 49.2 | 30.6 | 19.6 | 50.2 | |||
|
Indians |
49.3 | 17.8 | 67.1 | 50.5 | 24.7 | 75.2 | |||
|
Black |
25.9 | 9.0 | 34.9 | 34.1 | 13.3 | 47.4 | 22.1 | 11.8 | 33.9 |
|
White |
29.2 | 16.1 | 45.3 | 33.2 | 19.7 | 52.9 | 30.0 | 16.7 | 46.7 |
NOTE: The table is limited to individuals between the ages of 25 and 59 who are in the labor force. Generational definitions are the same as in prior tables. In the first and second generations, national-origin groups are identified by the birthplaces of respondents and their parents; in the third+ generation, ethnoracial categories are self-identifications (see discussion in “Assessing Education Patterns in the Third+ Generation”). For further details on methodology, see Farley and Alba (2002).
SOURCE: Data from 2003-2013 Current Population Survey outgoing rotation group data.
and they are much more likely to receive health and retirement benefits through their employment, although not as likely as other third and later generation men (Luthra and Waldinger, 2010). However, one issue that has been inadequately addressed is the extent to which the second generation moves ahead through bilingualism, which gives the U.S.-raised children of immigrants advantages in dealing with Spanish-speaking customers and workers (Hernández-León and Lakhani, 2013).
Some Asian groups enter the U.S. labor market at very high occupational levels (Table 6-7), so the question pertinent to their second generations is whether this favorable occupational placement can be maintained. For example, Table 6-7 shows that half of Indian immigrant men and women in the dataset held professional jobs. Chinese immigrant men and women were also overrepresented in the professional category in comparison to other groups, despite the substantial proportion of Chinese immigrants who hold low-wage jobs in such workplaces as restaurants and garment factories (Zhou, 2009). The second generations of these groups generally maintain a high level of concentration in professional positions and often attain above-average representation in managerial and other business-related jobs (Table 6-7). Among Asian women overall, almost one-third of the immigrants hold professional occupations, but the figure rises to almost 40 percent in the second generation, and twenty percent of the second generation has managerial jobs.
The robust representation of the first and second generations throughout the occupational spectrum implies that the U.S. workforce increasingly relies on immigrants and their children to staff higher-level jobs. This dependence on immigration is likely to grow as the baby boom cohorts complete their retirement over the next two decades (Alba 2009). At the beginning of the second decade of the century, the first and second generations made up a quarter of workers ages 25-54, and 28 percent of those under 45 years of age.
The presence of the foreign-born and their children among younger workers in professional and managerial occupations is impressive. The role of immigration with respect to professional positions, particularly in science, technology, engineering, and mathematics (STEM) jobs, is by now a well-known story (Ruiz et al., 2012; Stine and Matthews, 2009), but its contribution to management and business occupations, where familiarity with U.S. culture and native English proficiency are presumed to be assets, is equally important. In 2010-2013, the first and second generations constituted 23 percent of workers under the age of 45 in managerial positions, compared to 17 percent of older workers in such positions. The diversity of origins of the younger first and second generation managerial workers is also impressive. According to the panel’s analysis, the two largest aggregate groups among them, at about 7.5 percent, come from Canada and Europe,
on the one hand, and from Latin America, on the other. Asian origins account for 6.5 percent.
POVERTY
Public concerns about immigration often center on questions of poverty and economic dependency, namely, whether immigrants are disproportionately poor and dependent on public assistance. The Office of Management and Budget (OMB) uses a set of dollar values that define poverty income thresholds that vary by family size and composition (DeNavas-Walt and Proctor, 2014). For example, a four-person family (with two adults and two children) required an annual income of at least $23,624 in 2013 to meet the income poverty threshold. The income threshold for a single mother and two children was $18,769. In 2013, 45.3 million people, or 14.5 percent of the U.S. population, lived in families with incomes below poverty.15
Immigrant-Native Differentials in Poverty
The data shown in Table 6-8 are baseline poverty estimates for the native-born and foreign-born populations in 2013 (based on family income reported in 2014).16 They indicate that the poverty rate among foreign-born persons was 18.4 percent in 2013, or roughly 30 percent higher than the native-born poverty rate of 13.8 percent. The differences in poverty rate for foreign-born groups compared with their native-born counterparts vary widely across racial and ethnic groups. Poverty was overrepresented among Hispanic Americans (23.5%), but the difference between immigrant and native-born Hispanic Americans was negligible. Among blacks, the poverty rate for immigrants was lower than for the native-born (22 vs. 27.7%). For these two historically disadvantaged ethnic and racial groups, these 2013 data show that immigrants suffer disproportionately from poverty compared with the general population, albeit at somewhat lower rates than their native-born counterparts.
Among non-Hispanic white and Asian immigrant populations, the poverty rates among the foreign-born were higher than for their native-born counterparts (see Table 6-8). For example, among foreign-born non-Hispanic whites, the poverty rate was 14.8 percent in 2013, or more than
___________________
15 These estimates and the data presented in Tables 6-8 through 6-10 are drawn for the 2014 Current Population Survey’s Annual Social and Economic Supplement (ASEC), a nationally representative survey of nearly 68,000 households that define the resident, noninstitutionalized population of the United States. See https://www.census.gov/hhes/www/poverty/publications/pubs-cps.html [September 2015].
16 The panel thanks Youngmin Yi, a doctoral student in Sociology at Cornell University, for conducting the analyses on poverty reported in this section.
TABLE 6-8 Percentage in Poverty (using federal poverty level), 2013, by Immigrant Generation, Race, and Hispanic Origin
| Poverty Status | Total | Native-Born | Foreign-Born | |
|---|---|---|---|---|
| Total | Poverty | 14.5 | 13.8 | 18.4 |
| Deep poverty | 6.3 | 6.2 | 7.2 | |
| Hispanic | Poverty | 23.5 | 23.5 | 23.5 |
| Deep poverty | 9.4 | 9.9 | 8.6 | |
| Non-Hispanic | Poverty | 14.5 | 12.6 | 23.5 |
| Deep poverty | 12.6 | 12.4 | 14.1 | |
|
White |
Poverty | 9.6 | 9.4 | 14.8 |
| Deep poverty | 4.3 | 4.2 | 6.6 | |
|
Black |
poverty | 27.2 | 27.7 | 22.0 |
| Deep poverty | 12.3 | 12.9 | 7.4 | |
|
Asian |
Poverty | 10.4 | 9.5 | 10.9 |
| Deep poverty | 5.2 | 4.9 | 5.3 | |
|
Other, Two or More |
Poverty | 19.2 | 19.6 | 10.4 |
| Deep poverty | 9.2 | 9.5 | 4.1 |
SOURCE: Data from 2014 March Current Population Survey. Table was created courtesy of Youngmin Yi, Department of Sociology, Cornell University.
55 percent greater than the 9.4 percent poverty rate among native-born non-Hispanic whites. Still, poverty among non-Hispanic white immigrants was roughly the same as the overall U.S. poverty rate of 14.5 percent. Among the foreign-born, Asians had the lowest poverty rates of the racial and ethnic groups considered in Table 6-8. Their poverty rate was 10.9 percent, well below the U.S. poverty rate but slightly higher than the 9.5 prcent rate observed among their native-born Asian counterparts. Based on these data, racial and ethnic background is a much larger source of variation in poverty than nativity (foreign-born versus native-born).
Of course, the usual emphasis on poverty rates as a summary measure of economic deprivation hides extremes at the bottom of the income distribution. In an additional analysis for the panel, a common measure of “deep poverty” was calculated, defined as the share of the population below one-half of the poverty income threshold. These deep poverty rates are included in Table 6-8. In 2013, 6.3 percent of the U.S. population was living in households that were in deep poverty by this defintion. This percentage represents over 40 percent of the U.S population living under the
poverty threshold. Interestingly enough, there is little if any evidence that native-born and foreign-born poor populations vary widely in the shares of the poor who are deeply impoverished. For example, about 44 percent of the native-born poor can be counted among those in deep poverty. The corresponding figure for the foreign-born population is 39.4 percent. Table 6-8 shows similar patterns of deep poverty across the racial and ethnic groups in the table.17
Generational Differences in Poverty
The above differences in poverty rates for the foreign-born compared with native-born counterparts suggest there may be potentially large generation-to-generation differences as well. Tables 6-9 and 6-10 provide 2013 poverty rates by generation (i.e., foreign-born or first generation, second generation, and third generation and higher for adults and children, respectively. The analysis separated adults from children because families often have members from multiple generations. Indeed, second generation children are economically dependent on their foreign-born parents, with whom they share the same income status. This means that poverty rates for second generation children are determined by the economic circumstances of their immigrant parents. To avoid these interpretative problems, the analysis separates children from adults.
Poverty Among Adults
Overall, poverty rates among adults in the United States in 2013 were highest among immigrants (18.8%) but dropped to 13.6 percent in the second generation and to 11.5 percent in the third and higher generations (see Table 6-9). These declines in poverty for different cross-sectional generations18 are clearly consistent with canonical models of immigrant economic incorporation. Similar generational patterns were observed among Hispanic adults. That is, poverty rates were highest for first generation Hispanic
___________________
17 At the other end of the income distribution, native-born versus foreign-born disparities are much larger than at the bottom of the income distribution. In some additional analyses (not shown in the tables), 36.1 percent of all persons in the United States in 2013 lived in families with incomes at 400 percent or more of the income poverty threshold. Only 28.1 percent of all foreign-born persons were also this far above the poverty threshold, and only 14.3 percent were among the Hispanic foreign-born population. In contrast, among the foreign-born non-Hispanic whites and Asians, 43.1 and 40.7 percent, respectively, were living in families at this range in the income distribution. Indeed, these percentages exceed that for the U.S. population overall, as well as for the native-born population (37.3%).
18 The generation-to-generation changes in poverty rate in Table 6-9 should not be interpreted as indicating the experience of particular families over time. These are cross-sectional generations as of the time of the 2013 survey, not longitudinally linked generations.
TABLE 6-9 Percentage of Adults in Poverty, 2013, by Immigrant Generation, Race, and Hispanic Origin
| Poverty Status | Total | Foreign-Born | Native | |||
|---|---|---|---|---|---|---|
| 2nd Generation | 3rd+ Generation | Total Native | ||||
| Total | Poverty | 12.8 | 18.8 | 13.6 | 11.5 | 11.7 |
| Deep poverty | 5.6 | 7.6 | 5.8 | 5.1 | 5.2 | |
| Hispanic | Poverty | 21.6 | 25.0 | 18.1 | 17.4 | 17.6 |
| Deep poverty | 8.3 | 9.1 | 7.3 | 7.6 | 7.5 | |
| Non-Hispanic | Poverty | 11.3 | 13.1 | 9.0 | 11.2 | 11.1 |
| Deep poverty | 5.1 | 6.3 | 4.4 | 5.0 | 5.0 | |
|
White |
Poverty | 9.0 | 12.9 | 8.8 | 8.9 | 8.8 |
| Deep poverty | 4.0 | 6.2 | 3.1 | 4.0 | 4.0 | |
|
Black |
Poverty | 22.8 | 18.8 | ---a | 23.6 | 23.3 |
| Deep poverty | 10.1 | 8.8 | ---a | 10.4 | 10.3 | |
|
Asian |
Poverty | 11.0 | 11.5 | 9.1 | 9.1 | 9.1 |
| Deep poverty | 5.7 | 5.6 | 6.0 | 5.8 | 6.0 | |
NOTE: a denotes cell with 30 or fewer cases.
SOURCE: Data from 2014 March Current Population Survey. Table was created courtesy of Youngmin Yi, Department of Sociology, Cornell University.
TABLE 6-10 Percentage of Children in Poverty, 2013, by Immigrant Generation, Race, and Hispanic Origin
| Poverty Status | Total | Foreign Born | Native | |||
|---|---|---|---|---|---|---|
| 2nd Generation | 3rd+ Generation | Total Native | ||||
| Total | Poverty | 19.8 | 30.2 | 29.1 | 17.6 | 19.8 |
| Deep poverty | 8.8 | 13.1 | 10.5 | 8.2 | 8.8 | |
| Hispanic | Poverty | 30.2 | 37.0 | 38.3 | 23.8 | 30.2 |
| Deep poverty | 12.7 | 14.1 | 14.2 | 11.6 | 12.7 | |
| Non-Hispanic | Poverty | 16.5 | 25.0 | 14.6 | 16.4 | 16.5 |
| Deep poverty | 7.5 | 12.3 | 4.6 | 7.6 | 7.5 | |
|
White |
Poverty | 10.6 | 28.6 | 13.4 | 10.2 | 10.6 |
| Deep poverty | 4.5 | 17.9 | 5.3 | 4.3 | 4.5 | |
|
Black |
Poverty | 38.9 | 39.7 | 30.3 | 39.8 | 38.9 |
| Deep poverty | 19.0 | 13.8 | 9.5 | 20.3 | 19.0 | |
|
Asian |
Poverty | 10.2 | 16.8 | 7.9 | 10.5 | 10.2 |
| Deep poverty | 4.1 | 8.3 | 2.0 | 6.1 | 4.1 | |
SOURCE: Data from 2014 March Current Population Survey. Table was created courtesy of Youngmin Yi, Department of Sociology, Cornell University.
Americans and lowest for third and higher generation Hispanic Americans. The decline in the poverty rate was largest between the first and second generation, while the further decline for the third and higher generation was comparatively small, less than 1 percentage point.
For non-Hispanic white and Asian adults, generational differences in poverty rates in 2013 were small compared with the differences between Hispanic adult generations (see Table 6-8). Declines in poverty rate were observed only between the first and second generations. For example, both the second generation and third and higher generation Asians had poverty rates of 9.1 percent. This is about 20 percent less than the poverty rate for Asian adult immigrants. Among blacks, most adults in the survey were either foreign born or third and higher generation native born. For black adults, the immigrant generation had a lower poverty rate than did the third and higher generation blacks (18.8 versus 23.3%). With respect to models of integration, these two generations are not relevant. Most third and higher generation native-born black Americans have ancestral roots in American slavery dating back more than two centuries and in racial and economic oppression over much of the pre-Civil Rights era after the emancipation. An obvious but unanswered question is whether the offspring of today’s first generation black immigrants will experience patterns of poverty similar to today’s third and higher generation black Americans.
Poverty Among Children
Because the majority of infants born in the United States today are children of racial or ethnic “minorities,” the poverty rates among these children are especially germane (Lichter et al., 2005; Thomas, 2011; Van Hook et al., 2004). Their economic circumstances, as measured by poverty rates, provide a window to the future (Lichter et al., 2015), especially during a period of growing income inequality, crystallizing class boundaries, and declining intergenerational mobility. The data in Table 6-9 reveal substantially higher rates of poverty among America’s children (ages 0-17) than for the general population (compare Table 6-7). In 2013, 19.8 percent of America’s children lived in households whose income met the official definition of living in poverty. Foreign-born children as a group experienced an exceptionally high poverty rate—30.2 percent, a figure nearly 60 percent higher than the poverty rate for all foreign-born (18.4%) in Table 6-7. In a recent study, Lichter et al. (2015) noted that the poverty rate for families with newborn infants was particularly high among Mexican-origin populations in new destinations, especially in rural areas.
As shown in Table 6-10, in 2013, poverty rate gaps between foreign- and native-born children varied considerably by race. Among Asians, household poverty rates were ony slightly higher for foreign-born children
(11.5%) than for native-born children (10.2%). Among Hispanics, the gap was larger: 37.0 percent of foreign-born Hispanic children were poor, compared to 30.2 percent of their native born counterparts. The poverty rate gap between foreign-born and native-born children was especially large among whites: 28.6 percent of white foreign-born children lived in households below the poverty line, compared with only 10.6 percent of native-born white children.
It is also instructive to compare the circumstances of first, second, and third and higher generation children in the CPS data for 2013. Nationally, a large decline in child poverty appears to occur between the second and third generations. This overall pattern of large declines in poverty was particularly observed among households with second generation to third generation Hispanic children. As with adults living in households in poverty, the exception to this general rule of poverty declines is found among black children. For the native-born children of black native-born parents, the poverty rate was nearly 40 percent (39.8%). For second generation black children, the poverty rate was nearly 25 percent lower at 30.3 percent. These poverty rates are very high, but are nevertheless lower than rates among second generation Hispanic children (38.3%). However, as noted above, there are limitations to generational comparisons among blacks. Finally, second generation Asian children fare better than their native-born counterparts with native-born Asian parents. This reflects the relatively low rates of poverty among today’s Asian immigrant families (and the parents of these children). Yet despite these ethnoracial differences, large numbers of immigrant children start life’s race well behind the starting line, which raises important questions about prospects for upward socioeconomic mobility and social integration as these children make their way to adulthood and productive roles.
Supplemental Poverty Measure, 2012
The debate about how best to measure poverty—how to establish appropriate poverty income thresholds—has been ongoing and often contentious over the past several decades (National Research Council, 1995). The official poverty measure has been appropriately criticized for its limitations. Among these criticisms are that the official measure does not take into account income-in-kind (e.g., food stamps or housing vouchers), it fails to accurately reflect economies of scale from one family to the next, it does not adjust for geographic differentials in the cost-of-living or in consumption patterns, and it is based on the family as the unit of income generation and consumption (National Research Council, 1995). In 2009, an Interagency Technical Working Group on Developing a Supplemental Poverty Measure (SPM) was charged with developing an experimental poverty measure that
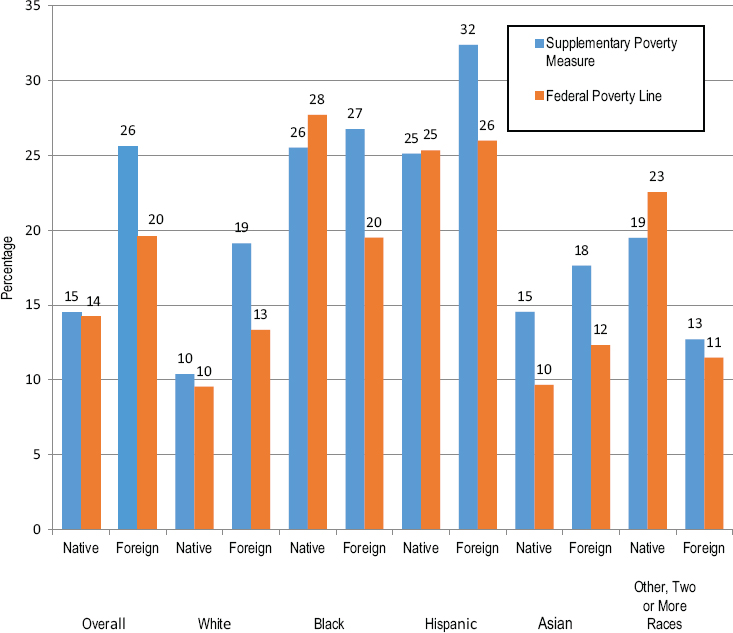
SOURCE: Data from Supplementary Poverty Measure and Current Population Survey.
defines income thresholds and resources based on recommendations made by a 1995 National Research Council Panel on Poverty and Family Assistance that addressed the shortcomings listed above (National Research Council, 1995).
Figure 6-7 shows differences in the percentages of foreign-born and native-born households with incomes at or below the poverty level based on the SPM for 2012 data from the 2013 CPS (hereafter, “SPM in 2012”) and the percentaged when the 2013 official poverty measures are used.19 The SPM in 2012 yielded lower overall (i.e, not broken down by ethnoracial group) poverty rates than the official rate (14.9% versus 16.0%, not shown
___________________
19 At this writing, the 2013 SPM is not available. The panel compare alternative poverty estimates for 2012, based on the 2013 CPS.
in Figure 6-7). But for the foreign-born overall, the SPM-based figure was 26 percent compared with 20 percent using the official rates. Although the differences between the SPM and the official poverty rate for foreign-born versus native-born are a matter of degree rather than kind, they are hardly negligible. Indeed, they tended to indicate much larger poverty gaps among immigrants when using the SPM (which presumably reflects differences in access to resources). For example, the official poverty rate revealed a native-immigrant disparity of 6 percentage points in 2012 (20 vs. 14%). The SPM, however, indicated a gap of 11 percentage points (26 vs. 15%).
Whereas the gap between native- and foreign-born Hispanics was only 0.7 percentage points (favoring natives) using the official poverty level, the gap using the SPM levels was much larger at 7.3 percentage points. For non-Hispanic whites, the gap between immigrants and native-born was only 3.8 percentage points using the official poverty measure, but the gap was 8.7 percentage points using the SPM measures. For foreign-born blacks, the SPM levels show 26.8 percent in poverty in 2013, compared with 19.5 percent using the official poverty measure.
The key point of these comparisons is that the official poverty level arguably underestimates the extent of poverty and economic hardship for certain groups, even as it tends to overstate the poverty rate for the nation as a whole. The implication is that the official poverty rates may misrepresent the degree of family hardship among immigrant populations, especially if immigrant groups do not have access to government resources (e.g., SNAP or TANF) or if the economies of family size implied by current poverty income thresholds do not accurately gauge the economic implications of characteristic features of immigrant families (e.g., large size and household extension in multi-generation households). In a recent study by Lichter and colleagues (2015), for example, only 11.9 percent of poor Hispanic children lived in family households receiving cash assistance from the government (TANF). For immigrant populations, questions of eligibility for government assistance may distort comparisons of welfare based on the official poverty measure.
SUMMARY AND CONCLUSIONS
The evidence summarized in this chapter indicates that substantial socioeconomic integration is occurring for immigrants to the United States and especially for their U.S.-born descendants. Compared to the general population of third and higher generation native-born, the foreign-born are much more varied in their skill levels, including not only a large segment with little formal schooling and without the ability to speak English but also a disproportionate share of highly educated workers concentrated in science, technology, engineering, and health fields. The robust representa-
tion of the first and second generations across the occupational spectrum in these analyses implies that the U.S. workforce has been welcoming immigrants and their children into higher-level jobs in recent decades. This pattern of workforce integration appears likely to continue as the baby boom cohorts complete their retirement over the next two decades.
Notwithstanding this heterogeneity within the first generation, socioeconomic integration is remarkably high in general for the second generation (i.e., the U.S.-born children of immigrants).
Conclusion 6-1 Despite large differences in starting points among the first generation, there has been strong intergenerational progress in educational attainment. Second generation members of most contemporary ethnoracial immigrant groups meet or exceed the schooling level of the general population of third and higher generation native-born Americans. This is true for both men and women. However, there are important variations between and within these ethnoracial groups that reflect the different levels of human capital their immigrant parents bring to the United States. The children of Mexican and Central American immigrants, in particular, progress a great deal relative to their parents, but they do not reach parity with the general population of native-born.
Conclusion 6-2 Immigrant men have an employment advantage compared to men in the second generation and the third+ generations. This employment advantage is especially dramatic among the least-educated immigrants, who are much more likely to be employed than comparable native-born men, indicating that they are filling an important niche in our economy. For second and later generation men, employment varies by ethnicity and race: Hispanic men still have high employment rates when their lower education is taken into account, and Asian men are integrating into the non-Hispanic white population by this measure, but the employment rates for second generation blacks appear to be moving toward those for the general black native-born population, for whom higher education does not translate into higher employment rates. Among women the above pattern is reversed, with a substantially lower employment rate for immigrants than for the native-born in general. But employment rates for second and higher generation women, regardless of ethnoracial group, approach parity with the general native-born population of women.
Conclusion 6-3 Foreign-born workers’ earnings improve relative to the native-born the longer they reside in the United States. These overall patterns, however, are still shaped by racial and ethnic stratification. Immigrants experience a substantial earnings penalty as skin color
darkens. Earnings assimilation is also considerably slower for Hispanic (predominantly Mexican) immigrants than for other immigrants. And although Asian immigrants and their descendants appear to do just as well as native-born whites, these comparisons become less favorable after controlling for education.
Conclusion 6-4 The occupational distributions of the first and second generations reveal a picture of intergenerational improvement similar to that for education and earnings. The groups concentrated in low-status occupations in the first generation improve their occupational position substantially in the second generation, although they do not reach parity with third and later generation Americans. Second generation men are overrepresented in service jobs, but they have largely left agricultural ones. The occupational gains for second generation women relative to the first generation are even greater than for second generation men, and the gap separating them from the general population of third and higher generation women narrows greatly. Second generation men are also less likely than their immigrant parents to take jobs in the informal sector, and they are more likely to receive health and retirement benefits through their employment. The robust representation of the first and second generations across the occupational spectrum implies that the U.S. workforce has increasingly welcomed immigrants and their children into higher-level jobs in recent decades. This pattern of workforce integration is likely to continue to increase as the baby boom cohorts complete their retirement over the next two decades.
Conclusions about the socioeconomic integration of the third generation and beyond are harder to draw. Available nationally representative datasets are problematic for assessing progress after the second generation because such data almost always rely on subjective ethnic identification and also typically cannot distinguish the “true” third generation from later generations. Some evidence suggests that samples of later-generation Hispanics identified from subjective ethnic responses will understate the attainment of the descendants of Hispanic immigrants (Alba and Islam, 2009; Duncan and Trejo, 2011a, 2012). Pooling together individuals from the third and later generations might hide progress for Mexican Americans because many of those in generations beyond the third have ancestors who grew up in places and times (e.g., Texas in the 19th and early 20th centuries) in which discrimination against Mexican ethnics was widespread and often institutionalized (Foley, 1997; Montejano, 1987)—a factor likely to impede socioeconomic mobility in such families. Ambitious data collection efforts and detailed analyses of Mexican American families in particular locations have attempted to overcome these and other problems in tracking intergen-
erational progress, with mixed findings (e.g., Telles and Ortiz, 2008; Bean et al., 2015).20 Although we have learned a great deal from recent research, the amount of socioeconomic mobility experienced by the descendants of Mexican immigrants beyond the second generation remains an important open question.21
Black immigrants and their descendants also face additional barriers to socioeconomic integration. Black immigrants from the Caribbean and Africa arrive with relatively high levels of schooling, and second generation members of these groups meet or exceed, on average, the educational attainment of third and higher generation Americans in general, but other things being equal, black immigrants experience a substantial earnings penalty in excess of 16 percent as skin color darkens. Second generation black men have substantial employment and earnings deficits similar to those of third and higher generation African American men, and these deficits are much larger for U.S.-born blacks than they are for U.S.-born Hispanics, especially after controlling for education. Although the U.S.-born descendants of black immigrants do achieve labor market integration, it is into the racialized space occupied by African Americans in U.S. society rather than into the non-Hispanic white mainstream (Waters, 1999). In the same way, the evidence discussed earlier suggesting the possibility of socioeconomic stagnation for Mexicans after the second generation could be interpreted as assimilation into the disadvantaged minority position of U.S. Hispanics. Given the composition of contemporary immigrant flows, the collection of data that would allow generational change to be identified within racial and ethnic categories would go a long way toward answering these questions (see Chapter 10).
The variation in the rate of socioeconomic integration among different groups is not unprecendented. As the panel noted at the beginning of this chapter, Italians, for instance, took several generations to achieve parity with other immigrant-origin and native-born groups. But although there are parallels between the economic conditions the second generation faced in the past and what today’s second generation faces, ongoing economic stagnation, rising income inequality, failing public schools, ongoing racial and ethnic discrimination; and a much more complicated and restrictive legal structure create higher barriers to integration for today’s immigrants, particularly for those who arrive with fewer skills and resources (see Chap
___________________
20 An important issue with subnational studies of socioeconomic mobility is the potential selectivity of who chooses to locate initially in a particular region and who chooses to remain there. Such selectivity can color interpretation of the results of these studies (Alba et al., 2014).
21 Two other influential studies of particular locations focus instead on the second generations from a wide range of national origin groups. Portes and Rumbaut (2001) collect and analyze data on the children of immigrants living in Miami and San Diego, and Kasinitz et al. (2008) do the same for New York City.
ters 2, 3, and 5). Researchers and policymakers need to take this context of reception into account when analyzing immigrant integration, and they need to understand the complicated nature of comparisons to immigrant groups from the past.
REFERENCES
Alba, R.D. (1985). Italian Americans: Into the Twilight of Ethnicity. Columbus, OH: Prentice-Hall.
Alba, R.D. (2009). Blurring the Color Line: The New Chance for a More Integrated America. Cambridge, MA: Harvard University Press.
Alba, R.D., and Islam, T. (2009). The case of the disappearing Mexican Americans: An ethnic-identity mystery. Population Research and Policy Review, 28(2), 109-121.
Alba, R.D., Abdel-Hady, D., Islam, T., and Marotz, K. (2011a). Downward assimilation and Mexican Americans: An examination of intergenerational advance and stagnation in educational attainment. In R.D. Alba and M.C. Waters (Eds.), The Next Generation: Immigrant Youth in a Comparative Perspective (Part II, Chapter 5). New York: New York University Press.
Alba, R.D., Kasinitz, P., and Waters, M.C. (2011b). The kids are (mostly) alright: Second generation assimilation. Comments on Haller, Portes, and Lynch. Social Forces, 89(3), 733-762.
Alba, R.D., Jimenez, T.R., and Marrow, H.B. (2014). Mexican Americans as a paradigm for contemporary intra-group heterogeneity. Ethnic and Racial Studies, 37(3), 446-466.
Antecol, H. (2000). An examination of cross-country differences in the gender gap in labor force participation rates. Labour Economics, 7(4), 409-426.
Antecol, H., Kuhn, P., and Trejo, S.J. (2006). Assimilation via price or quantities? Sources of immigrant earnings growth in Australia, Canada, and the United States. Journal of Human Resources, 8(4), 821-840.
Autor, D. (2014). Polanyi’s Paradox and the Shape of Employment Growth. Cambridge, MA: National Bureau of Economic Research.
Bean, F.D., Leach, M., Brown, S.K., Bachmeier, J., and Hipp, J. (2011). The educational legacy of unauthorized migration: Comparisons across U.S.-immigrant groups in how parents’ status affects their offspring. International Migration Review, 45(2), 348-385.
Bean, F.D., Brown, S.K., and Bachmeier, J.D. (2015). Parents Without Papers: The Progress and Pitfalls of Mexican-American Integration. New York: Russell Sage Foundation.
Blau, F.D., and Kahn, L.M. (2007). Gender and assimilation among Mexican Americans. In G.J. Borjas (Ed.), Mexican Immigration to the United States (pp. 57-106). Chicago: University of Chicago Press.
Blau, F.D., and Kahn, L.M. (2011). Substitution Between Individual and Cultural Capital: Pre-Migration Labor Supply, Culture and U.S. Labor Market Outcomes Among Immigrant Woman. NBER Working Paper 17275. Cambridge, MA: National Bureau of Economic Research.
Blau, F.D., Kahn, L.M., and Papps, K.L. (2011). Gender, source country characteristics, and labor market assimilation among immigrants. Review of Economics and Statistics, 93(1), 43-58.
Bohon, S.A., Macpherson, H., and Atiles, J.H. (2005). Educational barriers for new Latinos in Georgia. Journal of Latinos and Education, 4(1), 43-58.
Borjas, G.J. (1985). Assimilation, changes in cohort quality, and the earnings of immigrants. Journal of Labor Economics, 3(4), 463-489.
Borjas, G.J. (1993). The intergenerational mobility of immigrants. Journal of Labor Economics, 11(1), 113-135.
Borjas, G.J. (1995). Assimilation and changes in cohort quality revisited: What happened to immigrant earnings in the 1980s? Journal of Labor Economics, 13(2), 201-245.
Borjas, G.J. (2006). Making it in America: Social mobility in the immigrant population. The Future of Children, 16(2), 55-71.
Borjas, G.J., and Katz, L.F. (2007). The evolution of the Mexican-born workforce in the United States. In G.J. Borjas (Ed.), Mexican Immigration to the United States (pp. 13-55). Chicago: University of Chicago Press.
Boyd, M. (1984). At a disadvantage: The occupational attainments of foreign-born women in Canada. International Migration Review, 18(4), 1091-1119.
Brenner, A.D., and Graham, S. (2011). Latino adolescents’ experiences of discrimination across the first 2 years of high school: Correlates and influences on educational outcomes. Child Development, 82(2), 508-519.
Brick, K., Challinor, A.E., and Rosenblum, M.E. (2011). Mexican and Central American Immigrants in the United States. Washington, DC: Migration Policy Institute and European University Institute.
Cabrera, N.J., Shannon, J.D., West, J., and Brooks-Gunn, J. (2006). Parental interactions with Latino infants: Variation by country of origin and English proficiency. Child Development, 77(5), 1190-1207.
Caplan, N.S., Choy, M.H., and Whitmore, J.K. (1991). Children of the Boat People: A Study of Educational Success. Ann Arbor: University of Michigan Press.
Caponi, V., and Plesca, M. (2014). Empirical characteristics of legal and illegal immigrants in the USA. Journal of Population Economics, 27(4), 923-960.
Card, D., and S. Raphael. (2013). Immigration, Poverty, and Socioeconomic Inequality. New York: Russell Sage Foundation.
Chao, R.K. (1994). Beyond parental control and authoritarian parenting style: Understanding Chinese parenting through the cultural notion of training. Child Development, 65(4), 1111-1119.
Chiswick, B.R. (1978). The effect of Americanization on the earnings of foreign-born men. Journal of Political Economy, 86(5), 897-921.
Chiswick, B.R., Cohen, Y., and Tzippi, Z. (1997). The labor market status of immigrants: Effects of the unemployment rate at arrival and duration of residence. Industrial and Labor Relations Review, 50(2), 289-303.
Crosnoe, R. (2005). Double disadvantage or signs of resilience? The elementary school contexts of children from Mexican immigrant families. American Educational Research Journal, 42(2), 269-303.
Crosnoe, R. (2007). Early child care and the school readiness of children from Mexican immigrant families. International Migration Review, 41(1), 152-181.
Crosnoe, R., and Kalil, A. (2010). Educational progress and parenting among Mexican immigrant mothers of young children. Journal of Marriage and Family, 72(4), 976-990.
Crosnoe, R., and Turley, R.N.L. (2011). K-12 educational outcomes of immigrant youth. The Future of Children, 21(1), 129-152.
DeNavas-Walt, C., and Proctor, B.D. (2014). Income and Poverty in the United States: 2013. Current Population Reports P-60 249. Washington, DC: U.S. Census Bureau.
Donato, K. M., and Massey, D.S. (1993). Effect of the Immigration Reform and Control Act on the wages of Mexican migrants. Social Science Quarterly, 74(3), 523-541.
Donato, K.M., Wakabayashi, C., Hakimzadeh, S., and Armenta, A. (2008). Shifts in the employment conditions of Mexican migrant men and women: The effect of U.S. immigration policy. Work and Occupations, 35(4), 462-495.
Donato, K.M., Piya, B., and Jacobs, A. (2014). The double disadvantage reconsidered: Gender, immigration, marital status, and global labor force participation in the 21st century. International Migration Review, S1(Fall), S335-S376.
Donato, K.M., Jacobs, A., and Hearne, B. (2015). The Immigrant Double Disadvantage among Blacks in the United States. Paper prepared for the Population Association of America 2015 Annual Meeting, San Diego, CA, April 30-May 2. Available: http://paa2015.princeton.edu/uploads/153392 [July 2015].
Duncan, B., and Trejo, S.J. (2007). Ethnic identification, intermarriage, and unmeasured progress by Mexican Americans. In G.J. Boras (Ed.), Mexican Immigration to the United States (Chapter 7). National Bureau of Economic Research Conference Report. Chicago: University of Chicago Press.
Duncan, B., and Trejo, S.J. (2009). Ancestry versus ethnicity: The complexity and selectivity of Mexican identification in the United States. Research in Labor Economics, 29, 31-66.
Duncan, B., and Trejo, S.J. (2011a). Intermarriage and the intergenerational transmission of ethnic identity and human capital for Mexican Americans. Journal of Labor Economics, 29(2), 195-227.
Duncan, B., and Trejo, S.J. (2011b). Tracking intergenerational progress for immigrant groups: The problem of ethnic attrition. American Economic Review: Papers and Proceedings, 101(3), 603-608.
Duncan, B., and Trejo, S.J. (2011c). Selectivity and Immigrant Employment. Available: http://paa2013.princeton.edu/papers/130581 [September 2015].
Duncan, B., and Trejo, S.J. (2012). The Complexity of Immigrant Generations: Implications for Assessing the Socioeconomic Integration of Hispanics and Asians. Available: http://www.rand.org/content/dam/rand/www/external/labor/seminars/adp/pdfs/2013/trejo.pdf [September 2015].
Duncan, B., and Trejo, S.J. (2015). Assessing the socioeconomic mobility and integration of U.S. immigrants and their descendants. The ANNALS of the American Academy of Political and Social Science, 657(1), 108-135.
Duncan, B., Hotz, V.J, and Trejo, S.J. (2006). Hispanics in the U.S. labor market. In National Research Council, Hispanics and the Future of America (pp. 228-290). M. Tienda and F. Mitchell, Eds., Panel on Hispanics in the United States. Committee on Population, Division of Behavioral and Social Sciences and Education. Washington, DC: The National Academies Press.
Foley, N. (1997). The White Scourge: Mexicans, Blacks, and Poor Whites in Texas Cotton Culture. Berkeley: University of California Press.
Foner, N. (2000). From Ellis Island to JFK. New York’s Two Great Waves of Immigration. New Haven, CT: Yale University Press.
Fox, C. (2012). Three Worlds of Relief: Race, Immigration, and the American Welfare State from the Progressive Era to the New Deal. Princeton, NJ: Princeton University Press.
Fry, R., and Lopez, M.H. (2012). IV. College graduation and Hispanics. Pew Research Center Hispanic Trends. Available: http://www.pewhispanic.org/2012/08/20/iv-collegegraduation-and-hispanics/ [July 2015].
Funkhouser, E. (2000). Convergence in employment rates of immigrants. In G.J. Borjas (Ed.), Issues in the Economics of Immigration (Chapter 4). Chicago: University of Chicago Press.
Funkhouser, E., and Trejo, S.J. (1998). Labor market outcomes of female immigrants in the United States. In National Research Council, The Immigration Debate: Studies on the Economic, Demographic, and Fiscal Effects of Immigration (pp. 239-288). J.P. Smith and B. Edmonston (Eds.), Panel on the Demographic and Economic Impacts of Immigration. Committee on Population and Committee on National Statistics, Commission on Behavioral and Social Sciences and Education. Washington, DC: National Academy Press.
Gautié, J., and Schmitt, J. (2009). Low-Wage Work in Wealthy Countries. New York: Russell Sage Foundation.
Gentsch, K., and Massey, D.S. (2011). Labor market outcomes for legal Mexican immigrants under the new regime of immigration enforcement. Social Science Quarterly, 92(3), 875-893.
Goldin, C., and Katz, L.F. (2008). Transitions: Career and family life cycles of the educational elite. The American Economic Review, 363-369.
Goldin, C., and Margo, R.A. (1992). Wages, prices, and labor markets before the Civil War. In C. Goldin and H. Rockoff (Eds.), Strategic Factors in Nineteenth Century American Economic History: A Volume to Honor Robert W. Fogel (pp. 67-104). Chicago: University of Chicago Press.
González, N., Moll, L.C., and Amanti, C. (Eds.). (2013). Funds of Knowledge: Theorizing Practices in Households, Communities, and Classrooms. New York: Routledge.
Greeley, A. (1976).The ethnic miracle. Public Interest, Fall, 20-36.
Green, P.E. (2003). The undocumented: Educating the children of migrant workers in America. Bilingual Research Journal: The Journal of the National Association for Bilingual Education, 27(1), 51-71.
Grogger, J., and Trejo, S.J. (2002). Falling Behind or Moving Up? The Intergenerational Progress of Mexican Americans. San Francisco: Public Policy Institute of California.
Guryan, J., Hurst, E., and Kearney, M.S. (2008). Parental Education and Parental Time with Children. Working Paper No. w13993. Cambridge, MA: National Bureau of Economic Research.
Hall, M., Greenman, E., and Farkas, G. (2010). Legal status and wage disparities for Mexican immigrants. Social Forces, 89(2), 491-513.
Haller, W., Portes, A., and Lynch, S.M. (2011a). Dreams fulfilled, dreams shattered: Determinants of segmented assimilation in the second generation. Social Forces, 89(3), 733-762.
Haller, W., Portes, A., and Lynch, S.M. (2011b). On the dangers of rosy lenses; Reply to Alba, Kasinitz, and Waters. Social Forces, 89(3), 775-782.
Haveman, R., and Wolfe, B. (1994). Succeeding Generations: On the Effects of Investments in Children. New York: Russell Sage Foundation.
Hernández-León, R., and Morando Lakhani, S. (2013). Gender, bilingualism, and early occupational careers of second-generation Mexicans in the South. Social Forces, 92, 59-80.
Hersch, J. (2008). Profiling the new immigrant worker: The effects of skin color and height. Journal of Labor Economics, 26, 345-386.
Hersch, J. (2011). The persistence of skin color discrimination for immigrants. Social Science Research, 40, 1337-1349.
Hill, N.E., and Torres, K. (2010). Negotiating the American dream: The paradox of aspirations and achievement among Latino students and engagement between their families and schools. Journal of Social Issues, 66(1), 95-112.
Kalil, A., and Crosnoe, R. (2009). Two generations of educational progress in Latin American immigrant families in the U.S. In E. Grigorenko and R. Takanishi (Eds.), Immigration, Diversity, and Education (pp.188-204). New York: Routledge.
Kasinitz, P., Mollenkopf, J.H., Waters, M.C., and Holdaway, J. (2008). Inheriting the City: The Children of Immigrants Come of Age. New York: Russell Sage Foundation.
Kornrich, S., and Furstenberg, F. (2013). Investing in children: Changes in parental spending on children, 1972-2007. Demography, 50(1), 1-23.
Lareau, A. (2011). Unequal Childhoods: Class, Race, and Family Life. Oakland: University of California Press.
Lee, J., and Zhou, M. (2014). The success frame and achievement paradox: The costs and consequences for Asian Americans. Race and Social Problems, 6(1), 38-55.
Lichter, D.T., Qian, Z., and Crowley, M.L. (2005). Child poverty among racial minorities and immigrants: Explaining trends and differentials. Social Science Quarterly, 86(S1,) 1037-1059.
Lichter, D.T., Sanders, S.R., and Johnson, K.M. (2015). Hispanics at the starting line: Poverty among newborn infants in established gateways and new destinations. Social Forces, 94(1), 209-235.
Lieberson, S. (1980). A Piece of the Pie: Blacks and White Immigrants Since 1880. Berkeley: University of California Press.
Lieberson, S., and Waters, M.C. (1988). From Many Strands: Ethnic and Racial Groups in Contemporary America. New York: Russell Sage Foundation.
Lockard, C.B., and Wolf, M. (2012). Occupational Employment Projections to 2020. U.S. Bureau of Labor Statistics. Available: http://www.bls.gov/opub/mlr/2012/01/art5full.pdf [September 2015].
Lopez, M.H., and Fry, R. (2013). Among Recent High School Grads, Hispanic College Enrollment Rate Surpasses that of Whites. Washington, DC: Pew Research Center. Available: http://www.pewresearch.org/fact-tank/2013/09/04/hispanic-college-enrollment-ratesurpasses-whites-for-the-first-time/ [August 2015].
Lubotsky, D. (2007). Chutes or ladders? A longitudinal analysis of immigrant earnings. Journal of Political Economy, 115(5), 820-867.
Luthra, R. Reichl, and Waldinger, R. (2010). Into the mainstream? Labor market outcomes of Mexican-origin workers. International Migration Review, 44, 830-868.
Mare, R. (1981). Change and stability in educational stratification. American Sociological Review, 46(1), 72-87.
Massey, D.S., and Gelatt, J. (2010). What happened to the wages of Mexican immigrants? Trends and interpretations. Latino Studies, 8(3), 328-354.
Massey, D.S., and Gentsch, K. (2014). Undocumented migration to the United States and the wages of Mexican immigrants. International Migration Review, 48(2), 482-499.
Montejano, D. (1987). Anglos and Mexicans in the Making of Texas: 1836-1986. Austin: University of Texas Press.
Mulligan, C.B. (1997). Parental Priorities and Economic Inequality. Chicago: University of Chicago Press.
Murnane, R.J. (2013). U.S. high school graduation rates: Patterns and explanations. Journal of Economic Literature, 51(2), 370-422.
National Research Council. (1995). Measuring Poverty: A New Approach. C.F. Citro and R.T. Michael, Eds., Panel on Poverty and Family Assistance: Concepts, Information Needs, and Measurement Methods. Committee on National Statistics, Commission on Behavioral and Social Sciences and Education. Washington, DC: National Academy Press.
Obregon Pagan, E. (2006). Murder at the Sleepy Lagoon: Zoot Suits, Race, and Riot in Wartime L.A. Chapel Hill: University of North Carolina Press.
Palerm, J. (2006). Immigrant and Migrant Farm Workers in the Santa Maria Valley, California. Working paper. Santa Barbara: University of California, Center for Chicano Studies.
Pane, N.E. (2014). Math Scores Add Up for Hispanic Students: States and School Districts Notable for Recent Gains by Hispanic Students in Mathematics. Publication #2014-59. Bethesda, MD: Child Trends Hispanic Institute.
Park, J., Myers, D., and Jimenez, T.R. (2014). Intergenerational mobility of the Mexican-origin population in California and Texas relative to a changing regional mainstream. International Migration Review, 48(2), 442-481.
Passel, J.S., and Cohn, D. (2009). A portrait of unauthorized immigrants in the United States. Pew Research Center Hispanic Trends. Available: http://www.pewhispanic.org/2009/04/14/a-portrait-of-unauthorized-immigrants-in-the-united-states/ [September 2015].
Perlmann, J. (2005). Italians Then, Mexicans Now: Immigrant Origins and Second-Generation Progress, 1890-2000. New York: Russell Sage Foundation.
Perlmann, J. (2011). The Mexican American second generation in Census 2000: Education and earnings. In R. Alba and M.C. Waters (Eds.), The Next Generation: Immigrant Youth in a Comparative Perspective (Chapter 4). New York: New York University Press.
Phillips, J.A., and Massey, D.S. (1999). The new labor market: Immigrants and wages after IRCA. Demography, 36(2), 233-246.
Portes, A. (2006). Review essay: Paths of assimilation in the second generation. Sociological Forum, 21(3), 499-504.
Portes, A., and Rumbaut, R.G. (2001). Legacies: The Story of the Immigrant Second Generation. Berkeley: University of California Press.
Rodriguez, N. (2004). Workers wanted: Employer recruitment of immigrant labor. Work and Occupations, 31(4), 453-473.
Ruggles, S.J., Trent, A., Genadek, K., Goeken, R., Schroeder, M.B., and Sobek, M. (2010). Integrated Public Use Microdata Series: Version 5.0 [machine-readable database]. Minneapolis: University of Minnesota.
Ruiz, N.G., Wilson, J.H., and Choudhury, S. (2012). The Search for Skills: Demands for H-1B Immigrant Workers in the U.S. Metropolitan Areas. Washington, DC: Brookings Institution Press. Available: http://www.brookings.edu/~/media/research/files/reports/2012/7/18-h1b-visas-labor-immigration/18-h1b-visas-labor-immigration.pdf [September 2015]
Sakamoto, A., Goyette, K.A., and Chang Hwan K. (2009). Socioeconomic attainments of Asian Americans. Annual Review of Sociology, 35, 255-276.
Samson, J., and Lesaux, N. (2015). Disadvantaged language-minority students and their teachers: A national picture. Teachers College Record, 117(2), 1-26.
Schoeni, R.F. (1998a). Labor market assimilation of immigrant women. Industrial and Labor Relations Review, 51(3), 483-504.
Schoeni, R.F. (1998b). Labor market outcomes of immigrant women in the United States: 1970 to 1990. International Migration Review, 32(1), 57-77.
Schiller, K.S., Khmelkov, V.T., and Wang, X.Q. (2002). Economic development and the effects of family characteristics on mathematics achievement. Journal of Marriage and the Family, 64(3), 730-742.
Sewell, W., and Hauser, R. (1975). Education, Occupation, and Earnings: Achievement in the Early Career. New York: Academic Press.
Singer, A. (2012). Immigrant Workers in the U.S. Labor Force. Washington, DC: Brookings Institution Press.
Smith, J.P. (2003). Assimilation across the Latino generations. American Economic Review, 93(2), 315-319.
Smith, J.P. (2006). Immigrants and the labor market. Journal of Labor Economics, 24(2), 203-233.
Smith, J.P. (2012). The human capital (schooling) of immigrants in America. In B.R. Chiswick and P.W. Miller (Eds.), Handbook in Economics: Economics of International Migration (pp. 183-210). Oxford, UK: Elseivier.
Smith, J., Stern, K., and Shatrova, Z. (2008). Factors inhibiting Hispanic parents’ school involvement. The Rural Educator, 29(2), 8-13.
Sohn, S., and Wang, X.C. (2006). Immigrant parents’ involvement in American schools: Perspectives from Korean mothers. Early Childhood Education Journal, 34(2), 125-133.
Stine, D.D., and Matthews, C.M. (2009). The U.S. Science and Technology Workforce. Congressional Research Service, paper 57. Available: http://digitalcommons.unl.edu/cgi/viewcontent.cgi?article=1056&context=crsdocs [September 2015].
Suárez-Orozco, C., and Suárez-Orozco, M.M. (2002). Children of Immigration. Cambridge, MA: Harvard University Press.
Suárez-Orozco, C., Yoshikawa, H., and Tseng, V. (2015). Intersecting Inequalities: Research to Reduce Inequality for Immigrant-Origin Children and Youth. New York: William T. Grant Foundation.
Telles, E.E., and Ortiz, V. (2008). Generations of Exclusion: Mexican Americans, Assimilation, and Race. New York: Russell Sage Foundation.
Tenenbaum, H.R., and Ruck, M.D. (2007). Are teachers’ expectations different for racial minority than for European American students? A meta-analysis. Journal of Educational Psychology, 99, 253-273.
Terriquez, V. (2012). Civic inequalities? Immigrant incorporation and Latina mothers’ participation in their children’s schools. Sociological Perspectives, 55(4), 663-682.
Thomas, K.J.A. (2011). Familial influences on poverty among young children in black immigrant, U.S.-born black, and nonblack immigrant families. Demography, 48(2), 437-460.
Trejo, S.J. (1997). Why do Mexican Americans earn low wages? Journal of Political Economy, 105(6), 1235-1268.
Trejo, S.J. (2003). Intergenerational progress of Mexican-origin workers in the U.S. labor market. Journal of Human Resources, 38(3), 467-489.
Valenzuela, A. (2000). The significance of the TAAS test for Mexican immigrant and Mexican American adolescents: A case study. Hispanic Journal of Behavioral Sciences, 22(4), 524-539.
Van Hook, J., Brown, S.I., and Ndigume Kwenda, M. (2004). A decomposition of trends in poverty among children of immigrants. Demography, 41(4), 649-670.
Waldinger, R., Lim, N., and Cort, D. (2007). Bad jobs, good jobs, no jobs? The employment experience of the Mexican American second generation. Journal of Ethnic and Migration Studies, 33(1), 1-35.
Warren, R., and Warren, J.R. (2013). Unauthorized immigration to the United States: Annual estimates and components of change, by state, 1990 to 2010. International Migration Review, 47(2), 296-329.
Waters, M.C. (1999). Black Identities: West Indian Immigrant Dreams and American Realities. New York: Russell Sage Foundation.
Xiong, Y.S. (2012). Hmong Americans’ educational attainment: Recent changes and remaining challenges. Hmong Studies Journal, 13(2), 1.
Yoshikawa, H., Weiland, C., Brooks-Gunn, J., Burchinal, M., Espinosa, L., Gormley, W., Ludwig, J.O., Magnuson, K.A., Phillips, D.A., and Zaslow, M.J. (2013). Investing in Our Future: The Evidence Base on Preschool Education. New York: Foundation for Child Development and Ann Arbor, MI: Society for Research in Child Development.
Zhou, M. (2009). Contemporary Chinese America: Immigration, Ethnicity, and Community Transformation. Philadelphia, PA: Temple University Press.


