


Below is the uncorrected machine-read text of this chapter, intended to provide our own search engines and external engines with highly rich, chapter-representative searchable text of each book. Because it is UNCORRECTED material, please consider the following text as a useful but insufficient proxy for the authoritative book pages.
77 TOPIC 3 Test Methods to Predict Moisture Sensitivity of Hot-Mix Asphalt Pavements MANSOUR SOLAIMANIAN Pennsylvania State University JOHN HARVEY University of California, Davis MAGHSOUD TAHMORESSI PaveTex Engineering and Testing VIVEK TANDON University of Texas at El Paso The work conducted through the years toward development of moisture damage tests is summarized in this paper. Moisture damage has been a major concern to asphalt technologists for many years. Attempts to develop laboratory tests to distinguish between good- and poor- performing mixes in regard to stripping date back to the 1920s. The tests for identifying the moisture damage potential of an asphaltâaggregate mixture can be classified into two major categories: those on loose mixtures and those on compacted mixtures. The static immersion and the boil test, both conducted on loose mixtures, were among the first tests introduced to the paving industry. This was followed by introduction of the immersionâcompression test in the late 1940s. This test was conducted on compacted specimens and was the first test to become an ASTM standard in the mid-1950s. Research in the 1960s brought considerable awareness to asphalt pavement technologists of the significant effects of climate and traffic on moisture damage. The significance of these factors was emphasized through the work of researchers such as Johnson (1969), Schmidt and Graf (1972), Jiminez (1974), and Lottman (1978). The work by Jiminez resulted in a laboratory test simulating the effect of repeated water pressure on the behavior of saturated hot-mix asphalt. Extensive work by Lottman resulted in the laboratory test that currently has the widest acceptance in the paving industry. This test was further modified through the work of Tunnicliff and Root (1982). Wheel tracking of asphalt mixes submerged under water gained popularity for determination of moisture damage in the 1990s. The Hamburg wheel-tracking device and the asphalt pavement analyzer are among the tests of this type. It was also during this period that the environmental conditioning system was introduced to the industry at the completion of the Strategic Highway Research Program (SHRP) in 1993. The Superpave system, the product of SHRP, adopted the standard test method AASHTO T283 as the required test for determination of the risk of moisture damage. This test procedure is similar to the Lottman test procedure with some modification. With the Superpave system being adopted by most state highway agencies, AASHTO T283 became the most widely used test
78 Moisture Sensitivity of Asphalt Pavements: A National Seminar procedure within the industry. Some agencies have reported problems with this test in terms of correlation between the laboratory results and field observations. Today, it remains a challenge to asphalt pavement technologists to develop a highly reliable and practical test procedure for determination of moisture damage. An important consideration in development and acceptance of a test procedure for moisture damage should be calibration of the test to the conditions for which it will be applied. Some tests have been calibrated and implemented on a local basis (a region within a state). No test has been successfully calibrated and implemented across a wide spectrum of conditions. Reasons for this have been lack of correlation with field performance, a lack of good field performance databases, and problems with the tests such as variability and difficulty of operation. INTRODUCTION Historical Development The performance of hot-mix asphalt (HMA) in the presence of water is a complex issue and has been the subject of numerous research studies during the past six decades. During this period, asphalt technologists and state highway agencies have been in pursuit of a reliable laboratory test protocol to predict the asphalt pavement behavior in the field with regard to moisture sensitivity. The facts that the adhesion between asphalt and aggregate is reduced in the presence of water (stripping) and that the cohesion within the asphalt binder itself deteriorates have been known to practitioners for a long time and date back to at least the 1920s. Early work on this problem was performed by Nicholson (1932), Riedel and Weber (1934), McLeod (1937), Hubbard (1938), Powers (1938), Winterkorn et al. (1937), Saville and Axon (1937), Winterkorn (1937; 1938; 1939), Krchma and Nevitt (1942), Krchma and Loomis (1943), and Hveem (1943), among others. An extensive bibliography covering work performed prior to 1959 is given by Rice (1958). Examination of the 1937 Proceedings of the Association of Asphalt Paving Technologists (AAPT) shows two papers on asphaltâaggregate adhesion and problems with moisture sensitivity and references to previous work. For example, a paper by Saville and Axon discusses the search for a usable laboratory test and presents results from boiling tests and soaking tests and compares them with the field stripping performance of mixes with different types of aggregate. That paper also contains photographs of stripped mixes that would all be recognized from pavements today (as a note, this indicates that stripping problems did not begin because of changes in asphalt composition in the early 1980s). In an update on asphalt test development in the 1943 AAPT Proceedings, Hveem commented on the problem and stated: A complete solution to this entire problem may readily appear from another source. That is to say, that there are now many methods of treatment being advocated or in process of development which should improve the capacity of any asphalt to stick to virtually all aggregates under the most adverse conditions. When an agent is commercially available that can be added to the asphalt at the refinery, this entire problem may largely disappear, although it is likely that accurate test methods will always be needed in order to compare the effectiveness of competing forms of treatment.
Solaimanian, Harvey, Tahmoressi, and Tandon 79 The immersionâcompression test was introduced in 1950s as the first moisture damage test on compacted specimens under ASTM standard. In that decade, some work was also conducted on the surface energy of asphalt and aggregate and its relationship to bonding properties (Thelen 1958). Andersland and Goetz (1956) also introduced the sonic test for evaluation of stripping resistance in compacted bituminous mixtures. More recent attempts toward development of tests to predict asphalt mixture moisture sensitivity started in the 1960s and 1970s with the work of Johnson (1969), Schmidt and Graf (1972), Jimenez (1974), and Lottman (1978). All recognized the importance of simulating field conditions through accelerating test conditioning in the laboratory. Jimenez used vacuum saturation followed by cyclic pore pressure application to achieve this purpose, while Lottman used vacuum saturation followed by freezing and hot water bath conditioning. Lottmanâs laboratory test protocol, presented to the industry in 1978, was a breakthrough in regard to a coherent test procedure for predicting moisture-induced damage to asphalt concrete. The protocol introduced by Lottman was later modified and standardized as AASHTO Test Procedure T283. Root and Tunnicliff presented their version of the Lottman procedure in the early 1980s during an extensive evaluation of antistripping additives. At the same time, Kennedy, Roberts, Anagnos, and Lee at the University of Texas at Austin introduced two test procedures to the industry: Texas freezeâthaw pedestal test (1982) and Texas boiling test (1984). The boiling test was developed on the basis of work that had been conducted in departments of transportation in Louisiana, Texas, and Virginia between 1975 and 1980 and is very similar to the test used by Saville and Axon in 1937. The freezeâthaw pedestal test was a modification of the procedure introduced earlier by Plancher et al. (1980) at the Western Research Institute. Ensley et al. (1984) worked toward development of techniques for measuring the bonding energy of the asphaltâaggregate system. This was also a time for some researchers to evaluate the test methods available for moisture damage. As example is the work by Gharaybeh (1987). Afterwards, there was no significant development in moisture damage test procedures until the Strategic Highway Research Program (SHRP) sponsored research toward development of new moisture sensitivity tests. The result of this research was the environmental conditioning system (ECS) (Al-Swailmi and Terrel 1992). At the same time, the Hamburg wheel-tracking device (HWTD) was introduced into the United States (Aschenbrener and Currier 1993). Colorado, Texas, and Utah were among the first states to explore the HWTD (Aschenbrener 1995). The search for new reliable test procedures for determination of moisture sensitivity continues. Western Research Institute (WRI) has undertaken in-depth research on asphalt chemistry and its relationship to moisture damage. WRI has determined that displacement of asphalt polars from aggregate by water varies by asphalt source. Currently, WRI is developing a rapid centrifugation method to simulate displacement of polars by water. The hypothesis being tested is the following: asphaltâaggregate mixtures that form insoluble calcium salts of asphalt components are the least prone to moisture damage. On another front, the concept of surface energy has reemerged as a potential tool for determining the adhesion of asphaltâaggregate systems. While these recent research developments can contribute significantly toward determination of compatible and moisture-resistant asphaltâaggregate mixtures, they do not address the effect of the interaction between traffic and water on moisture damage in pavements. Hence, a new test procedure on compacted samples is being investigated under National
80 Moisture Sensitivity of Asphalt Pavements: A National Seminar Cooperative Highway Research Program (NCHRP) Project 9-34 aimed at proper simulation of environment/traffic factors in regard to moisture damage. Types of Moisture Sensitivity Tests In general, the tests that have been developed can be divided into two main categories: qualitative and quantitative. Qualitative tests provide a subjective evaluation of the stripping potential and include ⢠Boiling water test, ⢠Freezeâthaw pedestal test, ⢠Quick bottle test, ⢠Rolling bottle method, and ⢠Many others. The quantitative tests provide a value for a specific parameter such as strength before and after conditioning. These tests include ⢠Immersionâcompression test, ⢠Indirect tensile test, ⢠Marshall immersion test, ⢠Double punch method, ⢠Resilient modulus tests, and ⢠Many others. Alternatively, the tests can be categorized into those aimed at checking the compatibility between aggregate and asphalt on the basis of conditioning of the loose mix and those used to determine moisture sensitivity of the compacted mix structure. The latter can be divided into those that look at water conditioning and those that include the interaction of traffic and water. The first type of test helps to determine whether an asphaltâaggregate system is compatible and whether it is resistant enough against debonding in the presence of water without any attempt to evaluate the mechanical behavior of the mixture under applied loads and water. In the second group of tests, attempts are made to take the effect of the compacted mix structure as well as traffic and environment into consideration when the mix behavior is evaluated in the presence of water. These tests typically give a result that is interpreted as pass or does not pass. At this time, none of these tests provide information that can be used in a mechanistic-empirical design framework by providing information on the effect of water on stiffness, and fatigue and rutting transfer functions. The complexity of developing test methods to predict moisture damage in the field is evident from the variables that interact in this phenomenon, including the following: ⢠The great number of aggregate sources and their highly varied mineralogies, crystal structures, and surface textures; ⢠The numerous types of unmodified and modified asphalt binders used across the United States; and ⢠The varied environmental conditions, traffic, and construction practices.
Solaimanian, Harvey, Tahmoressi, and Tandon 81 It has remained a challenge to the pavement industry to improve the current moisture damage tests to provide a more reliable distinction between poor and good performers and to relate the numbers from any test to performance on a given project with its unique combination of variables. For a moisture susceptibility test procedure to be successful for mix design and field quality control, certain criteria must be satisfied: 1. It must be representative of the mechanisms that cause moisture damage in the field and produce results that match those occurring in the field under similar conditions, or it must measure some property that determines the performance of the mix in the field without actually simulating field conditions in the laboratory. 2. It must be capable of discriminating between poor and good performers in regard to stripping. If the first criterion (above) cannot be satisfied, then some discriminator of this type is useful; however, the results must still be tied to field performance. 3. It must be repeatable and reproducible, with the allowable variance depending on the constraint of the fourth criterion. 4. It must be feasible, practical, and economical enough that it can be included in routine mix design practice. These four criteria are the key items to the success of any test procedure selected for identification of asphalt concrete moisture susceptibility. SIGNIFICANCE OF MOISTURE-SENSITIVITY TESTS Implementation of any laboratory test for moisture sensitivity or stripping will always require calibration of the results that the test generates with observed field performance. If the test results are not calibrated with field performance, the test runs a larger risk of eliminating mixes that would perform well in the field or permitting mixes that have a high probability of having a shortened life due to moisture damage. Review of the literature, including laboratory experiments and field studies, indicates that while moisture damage susceptibility is highly correlated with aggregate source, other variables can significantly increase or decrease the risk of moisture susceptibility for a given mix used on a given project. These variables include (Harvey et al. 2002) ⢠Drainage and the condition of the drainage system; ⢠Pavement structure, including lack of bonding between asphalt concrete layers, which can permit lateral movement of water; the presence of cracks, which permit water to enter; the presence of open-graded or seal coat materials below the surface, which can trap water below the surface; and the presence of fabrics or interlayers that can trap water below the surface; ⢠Mix design, including binder content, gradation, and dust-to-asphalt ratio, which can determine the film thickness on the aggregates and the permeability of the mix; binder selection, which determines the stiffness of the binder and the susceptibility to penetration of the asphalt film by water; and the use of additives, which can reduce the overall susceptibility of the mix; ⢠Construction variability, including segregation, which can create areas with high air void contents and low binder contents, which permit water to enter and are more susceptible to moisture damage; variance from the job mix formula, which can create susceptible areas with
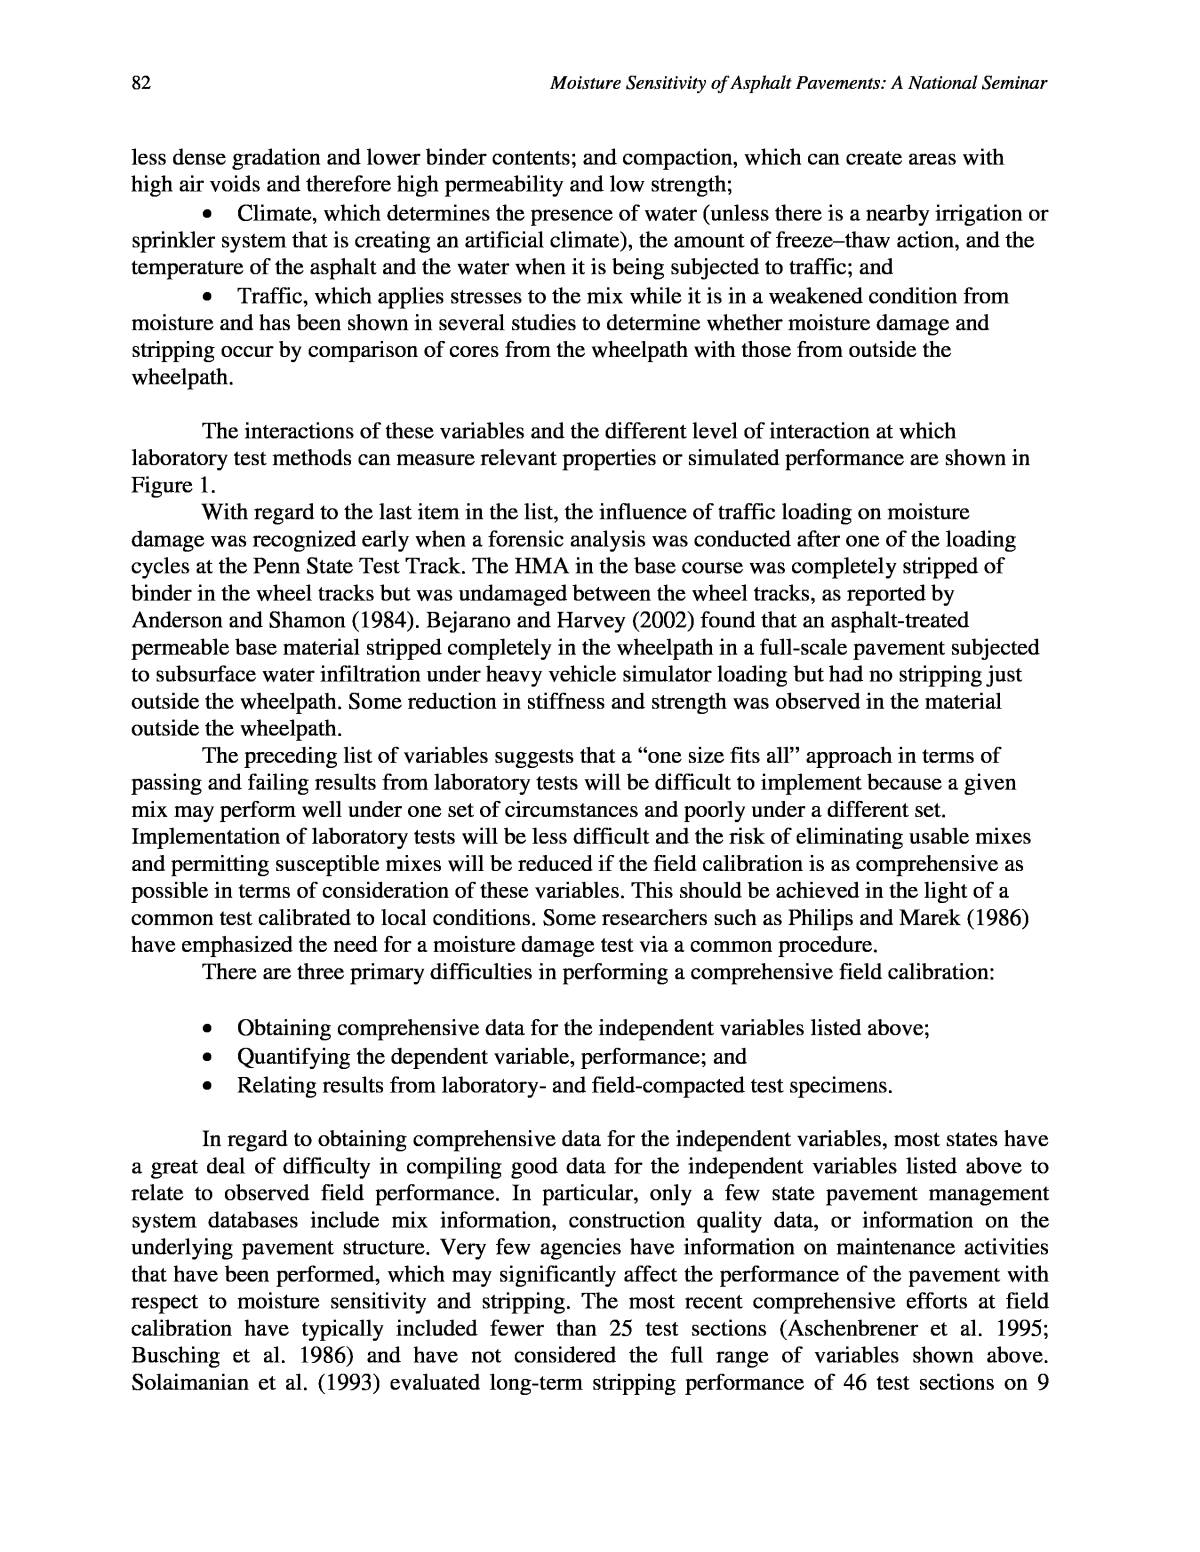
82 Moisture Sensitivity of Asphalt Pavements: A National Seminar less dense gradation and lower binder contents; and compaction, which can create areas with high air voids and therefore high permeability and low strength; ⢠Climate, which determines the presence of water (unless there is a nearby irrigation or sprinkler system that is creating an artificial climate), the amount of freezeâthaw action, and the temperature of the asphalt and the water when it is being subjected to traffic; and ⢠Traffic, which applies stresses to the mix while it is in a weakened condition from moisture and has been shown in several studies to determine whether moisture damage and stripping occur by comparison of cores from the wheelpath with those from outside the wheelpath. The interactions of these variables and the different level of interaction at which laboratory test methods can measure relevant properties or simulated performance are shown in Figure 1. With regard to the last item in the list, the influence of traffic loading on moisture damage was recognized early when a forensic analysis was conducted after one of the loading cycles at the Penn State Test Track. The HMA in the base course was completely stripped of binder in the wheel tracks but was undamaged between the wheel tracks, as reported by Anderson and Shamon (1984). Bejarano and Harvey (2002) found that an asphalt-treated permeable base material stripped completely in the wheelpath in a full-scale pavement subjected to subsurface water infiltration under heavy vehicle simulator loading but had no stripping just outside the wheelpath. Some reduction in stiffness and strength was observed in the material outside the wheelpath. The preceding list of variables suggests that a âone size fits allâ approach in terms of passing and failing results from laboratory tests will be difficult to implement because a given mix may perform well under one set of circumstances and poorly under a different set. Implementation of laboratory tests will be less difficult and the risk of eliminating usable mixes and permitting susceptible mixes will be reduced if the field calibration is as comprehensive as possible in terms of consideration of these variables. This should be achieved in the light of a common test calibrated to local conditions. Some researchers such as Philips and Marek (1986) have emphasized the need for a moisture damage test via a common procedure. There are three primary difficulties in performing a comprehensive field calibration: ⢠Obtaining comprehensive data for the independent variables listed above; ⢠Quantifying the dependent variable, performance; and ⢠Relating results from laboratory- and field-compacted test specimens. In regard to obtaining comprehensive data for the independent variables, most states have a great deal of difficulty in compiling good data for the independent variables listed above to relate to observed field performance. In particular, only a few state pavement management system databases include mix information, construction quality data, or information on the underlying pavement structure. Very few agencies have information on maintenance activities that have been performed, which may significantly affect the performance of the pavement with respect to moisture sensitivity and stripping. The most recent comprehensive efforts at field calibration have typically included fewer than 25 test sections (Aschenbrener et al. 1995; Busching et al. 1986) and have not considered the full range of variables shown above. Solaimanian et al. (1993) evaluated long-term stripping performance of 46 test sections on 9
Solaimanian, Harvey, Tahmoressi, and Tandon 83 FIGURE 1 Factors influencing moisture damage of asphalt pavements (after Lu 2003). roads for a period of 6 years and found no clear relationship between laboratory results and field performance. In addition, the conditions under which moisture damage and stripping occur may not be the same in different locations. This indicates that calibration data sets must include the climate regions and traffic conditions in which the test results will be used. For example, Aschenbrener identified that all of the test sections compared with test results in Colorado had most of their precipitation during the hottest months of the year. The pass/fail values developed in Colorado may not be applicable to northeastern California, where the hottest months have little or no rainfall. The Long-Term Pavement Performance database has not been mined for moisture sensitivity/stripping information, but it has had difficulty in providing comprehensive data for many of its test sections. A recent database of hot-mix asphalt concrete data developed by White et al. (2002) that is comprehensive in terms of the variables listed above may provide a valuable Field performance of asphalt pavement Construction Quality Pavement Structure Traffic (load, repetition) Climate (rainfall, temperature, FTC) Resistance of asphalt mixture to moisture damage under a specific laboratory testing condition Asphalt-aggregate bonding strength under a specific laboratory testing condition Air void structure Asphalt content Aggregate gradation, fine content Asphalt-aggregate interaction through models of bonding between asphalt and aggregate Asphalt physicochemical properties Aggregate physicochemical properties Adsorption / desorption of functionalities Additives content Impurities Mineralogical composition, surface energy Surface texture Level 3 Level 2 Level 1-2 Level 1 Compacted mix in field under traffic Compacted mix conditioned with water and/or traffic in the laboratory Loose mix con- ditioned with water Mix components
84 Moisture Sensitivity of Asphalt Pavements: A National Seminar source of information for calibration in the future. Development of better databases for calibration of laboratory results with field data is vital for development of better laboratory tests for moisture sensitivity/stripping and other distress mechanisms. With regard to quantifying performance, identification of stripping can be difficult without coring if it occurs below the surface, and moisture damage that does not proceed to stripping is very difficult to identify without information about mix performance in the absence of water. For example, Aschenbrener et al. (1995) identified pavements as being âgood,â âhigh maintenance,â âcomplete rehabilitation,â or âdisintegrators.â Pavements were placed in these categories on the basis of years to failure versus design life and coring to find stripping. Other researchers use different criteria for all but the âgoodâ pavements. Stripping is seldom formally identified and entered into a database on field projects when they fail, and the stripping itself is visually identified and therefore somewhat subjective unless most of the asphalt has disappeared from the aggregate. This is also the case for laboratory tests that rely on visual identification. Pavements that do not exhibit significant visible stripping may have their performance significantly reduced and fail by fatigue cracking, raveling, or rutting, without being identified in the field as having moisture damage. This makes it difficult to set thresholds for laboratory test results to minimize moisture damage for mixes that exhibit little observable stripping. Some laboratory tests also submit the mix to conditions that will not result in stripping but that do cause significant moisture damage, measured as reduction in strength or stiffness. These tests are particularly difficult to calibrate with field results because field measurements of stiffness and strength are difficult to obtain. Mixes lose strength and stiffness when wet but regain these properties when dried (Figure 2). A faster damage rate occurs under loading when the mix is wet, but if properties are measured when dry the effects of water may not be apparent. With regard to the difficulty in relating field and laboratory results, the primary problems are differences between field and laboratory test specimen air void contents, size of voids, permeability, and aging. Many of the test methods summarized in this document require that specimens be prepared to a predetermined air void content. Laboratory studies have shown that air void content has a significant effect on test results, and difficulty should be expected in FIGURE 2 Effect of moisture on resilient modulus may be reversible (after Schmidt and Graf 1972).
Solaimanian, Harvey, Tahmoressi, and Tandon 85 correlating laboratory test results with field performance if laboratory specimens are not compacted to the same air void contents as occurred or are expected to occur in the field for a given project. Even when air void contents are matched between the laboratory and field, the results may vary between the two for the reasons described above, as was identified by Aschenbrener (1995). These differences will largely depend on the laboratory compaction device used, because different compaction methods can create very different aggregate and void structures in the specimen even though the total air void content is the same. The results also depend on the laboratory aging procedures used. If a method can be calibrated with field results, the next criteria it must pass to be implementable concern repeatability and reproducibility and cost in terms of staff, time, materials, and equipment. To some degree, inherent higher variance can be overcome with additional replicate specimens. However, bias and variance caused by differences among operators and laboratories are difficult to overcome with more replicates because the ability to âtweakâ the results is placed in doubt, whether intentionally or unintentionally. These factors must be considered and be acceptable for a test to be implementable. However, it can be argued that having a test that is easy and inexpensive to perform but that cannot be calibrated with field results is of no use. In addition to an ability to correlate with field performance, laboratory tests are often required to be able to measure the effects of moisture sensitivity mitigation measures, particularly additives and modified binders. The effects of mitigation must be correlated with field performance. Again, the mechanism used in the laboratory to evaluate a mix and its relation to the mechanism that causes moisture susceptibility/stripping in the field may not be the same, and as noted previously the field mechanism may vary between different projects. MOISTURE SENSITIVITY TESTS Tests used to estimate moisture sensitivity of HMA can be classified into two general types: tests on loose mixtures and tests on compacted mixtures. Tables 1 and 2 summarize the tests for moisture sensitivity on loose and compacted mixtures, respectively. TABLE 1 Moisture Sensitivity Tests on Loose Samples Test ASTM AASHTO Other Methylene blue Technical Bulletin 145, International Slurry Seal Association Film stripping (California Test 302) Static immersion D1664* T182 Dynamic immersion Chemical immersion Standard Method TMH1 (Road Research Laboratory 1986, England) Surface reaction Ford et al. (1974) Quick bottle Virginia Highway and Transportation Research Council (Maupin 1980) Boiling D3625 Tex 530-C Kennedy et al. 1984 Rolling bottle Isacsson and Jorgensen, Sweden, 1987 Net adsorption SHRP A-341 (Curtis et al. 1993) Surface energy Thelen 1958, HRB Bulletin 192 Cheng et al., AAPT 2002 Pneumatic pull-off Youtcheff and Aurilio (1997) * No longer available as ASTM standard.
86 Moisture Sensitivity of Asphalt Pavements: A National Seminar TABLE 2 Moisture Sensitivity Tests on Compacted Specimens Test ASTM AASHTO Other Moisture vapor susceptibility California Test 307 Developed in late 1940s Immersionâcompression D1075 T165 ASTM STP 252 (Goode 1959) Marshal immersion Stuart 1986 Freezeâthaw pedestal test Kennedy et al. 1982 Original Lottman indirect tension NCHRP Report 246 (Lottman 1982); Transportation Research Record 515 (1974) Modified Lottman indirect tension T 283 NCHRP Report 274 (Tunnicliff and Root 1984), Tex 531-C TunnicliffâRoot D 4867 NCHRP Report 274 (Tunnicliff and Root 1984) ECS with resilient modulus SHRP-A-403 (Al-Swailmi and Terrel 1994) Hamburg wheel tracking 1993 Tex-242-F Asphalt pavement analyzer ECS/SPT NCHRP 9-34 2002-03 Multiple freezeâthaw The third category is tests for surface treatments and chip seals. The following sections provide detail on these tests and their limitations. Tests on Loose Mixtures These are the tests conducted on asphalt-coated aggregates in the presence of water. Examples include boil, film strip, and static/dynamic immersion tests. One advantage of these tests is that they are simpler and less costly to run than tests conducted on compacted specimens. Another advantage is that they require simpler equipment and procedures. The major disadvantage is that the tests are not capable of taking the pore pressure, traffic action, and mix mechanical properties into account. The results are mostly qualitative, and interpretation of the results becomes a subjective matter depending on the evaluatorâs experience and judgment. There is also not much evidence correlating results from these tests to field performance of hot-mix asphalt concrete. Loose mixture tests are best used for comparison between different aggregateâasphalt mixtures in terms of compatibility, strength of adhesion, and stripping. Mixtures failing in these tests, on the basis of some established criterion, have the potential to strip and should be avoided. However, good results should not mean that a mix can be used, since the effects of the other contributing factors are not considered in these tests. Defining a pass/fail criterion is not an easy task for most of these tests. For example, visual evaluation is used in the static immersion test to determine the degree of stripping below or above 95 percent, a criterion that is not very repeatable between different operators and different laboratories. Methylene Blue Test The methylene blue test attempts to identify the harmful clays and dust available in the fine aggregate. This test does not directly provide a measure of stripping since no asphalt is used.
Solaimanian, Harvey, Tahmoressi, and Tandon 87 However, the results can be used to decide whether potential for stripping exists because if aggregates are coated with montmorillonite-type clay, proper coating will not take place between the aggregate and asphalt. The methylene blue test was developed in France and was recommended by the International Slurry Seal Association (ISSA) to quantify the amount of harmful clays of the smectite (montmorillonite) group, organic matter and iron hydroxides present in fine aggregates. The test method titled âDetermination of Methylene Blue Adsorption Value (MBV) of Mineral Aggregate Fillers and Finesâ was contained in Technical Bulletin 145 of ISSA (1989). In the test, methylene blue (MB) is dissolved in distilled water with a known concentration. A known weight of the filler finer than 75 microns is also uniformly stirred and dispersed in a separate beaker. Drops of MB solution, 0.5 mL each, are added to the solution with a burette one at a time while stirring. After each drop of MB, one drop of the solution is removed using a stirring rod and placed on filter paper. The test is continued until a light blue halo is formed around the drop. The absorption of MB by clay is used to determine the amount of harmful clay, with greater absorption indicating larger amounts of harmful clays. Research by Kandhal et al. (1998) has indicated that larger MB values correspond to lower tensile strength ratios from AASHTO T283. Film Stripping Test (California Test 302) This is a modified version of test procedure AASHTO T182 (Coating and Stripping of Bitumenâ Aggregate Mixtures). In California Test 302, a 60-g mass of aggregate coated with asphalt is placed in a 60°C oven for 15 to 18 h. The sample is then cooled to room temperature and placed in a jar with about 175 mL of distilled water. The jar is securely capped and placed in the testing apparatus, which rotates at a rate of about 35 rpm for 15 min (Figure 3). The sample is removed and the percentage of stripping is estimated when the jar is viewed under fluorescent light. The results are reported in terms of the percent total aggregate surface stripped. Static Immersion Test (AASHTO T182) Although this test is still continued as a standard method under AASHTO, it is no longer available as an ASTM standard (originally ASTM Standard Practice D1664). The asphaltâ aggregate mixture is cured for 2 h at 60°C and cooled to room temperature. It is then placed in a glass jar and covered with 600 mL of distilled water. The jar is capped and placed in a 25°C water bath and left undisturbed for 16 to 18 h. The amount of stripping is visually estimated on Asphalt Coated Aggregate and Water Capped Jar FIGURE 3 Rotating asphaltâaggregate mixture in a sealed jar for film stripping test.
88 Moisture Sensitivity of Asphalt Pavements: A National Seminar the basis of the established criteria. The total visible area of the aggregate is estimated as either less than or greater than 95%. This is a major limitation of the test because the results are decided purely on the basis of a subjective estimate of less than or greater than 95%. Test results have indicated that placing samples at 60° C bath rather than 25° C for 18 h increases the amount of stripping. Dynamic Immersion Test The dynamic immersion test is used to accelerate the stripping effect compared with the static immersion test. The test has not been standardized and is not widely used. Samples of asphaltâ aggregate mixtures are prepared the same way as for the static immersion test but are subjected to 4 h of agitation. As the period of agitation increases, the degree of stripping increases. Both static and dynamic immersion tests, however, fail to take into account the pore pressure effect and traffic action, as is the case for all tests on loose mixtures. Chemical Immersion Test The chemical immersion test method covers the determination of the adhesion of bitumen to stone aggregate by means of boiling asphalt-coated aggregate successively in distilled water. Increasing concentrations of sodium carbonate (Na2CO3) are used, numbered 0 to 9 and referred to as the Riedel and Weber (R&W) number. Zero refers to distilled water, 1 implies 0.41 g of sodium carbonate in 1 L of water, and 9 refers to the highest concentration, which is 106 g of Na2CO3 in 1 L of water. Between 1 and 9, for every doubling of concentration the R&W number is increased by one. The number of the concentration at which the bitumen strips to such an extent that it is no longer a film but only specks or droplets is called the stripping value. An asphaltâaggregate test sample of 100 g is dried in an oven at 110°C. The aggregate is mixed with binder at high temperature and left to cool to room temperature. Solutions of sodium carbonate in distilled water are prepared at different concentrations. About 50 mL of distilled water is brought to boiling in a 200-mL glass beaker. Afterwards, 10 g of the prepared aggregateâbinder mix is placed into the boiling water. After 1 min of boiling, the water is drained and the sample is placed on filter paper. The sample is examined for stripping after it is dry. The stripping value of the aggregate is the R&W number of the lowest concentration at which stripping occurs. If the sample does not strip at number 9, a stripping value of 10 is given to the aggregate. If no stripping is observed, the procedure is repeated, starting with the weakest concentration of sodium carbonate. Surface Reaction Test Test procedures have been developed at different times to quantify the level of stripping for loose asphaltâaggregate mixtures. Quantifying the degree of stripping eliminates problems encountered with visual rating. One of these procedures, developed by Ford et al. (1974), is called the surface reaction test. This test is based on the principle that calcareous or siliceous minerals will react with a suitable reagent and create a gas as part of the chemical reaction products. This generated gas, in a sealed container, will create a certain pressure that can be considered proportional to the mineral surface area exposed to the reagent. The reagent is typically an acid. The test is conducted on the asphaltâaggregate mixture after it has been subjected to the stripping effects of water. Different levels of stripping result in different exposed surface areas of aggregate particles. A larger exposed surface area will generate higher gas
Solaimanian, Harvey, Tahmoressi, and Tandon 89 pressure. The advantages of the test are that it is simple and reproducible and takes less than 10 min to perform. A disadvantage is that the test requires use of highly corrosive and toxic acids. Texas Boiling Test The Texas boiling test procedure was developed by Kennedy et al. (1982; 1984) on the basis of the earlier work. The procedure requires adding asphaltâaggregate mixture to boiling water and bringing the water back to boiling after this addition. After 10 min, the mixture is allowed to cool while the stripped asphalt is skimmed away. The water is drained, and the wet mixture is placed on a paper towel and allowed to dry. Visual rating is conducted to assess the level of stripping. This test procedure is a quick method for evaluating the moisture sensitivity of an asphaltâ aggregate mixture. However, it does not account for mechanical properties of the mix, and it does not include the effects of traffic action. The test is also subjective and qualitative, and results are judged on the basis of a visual rating. A useful application of the test could be for quick evaluation of various asphaltâaggregate combinations as a relative measure of the bond quality and stripping resistance. The procedure has been standardized as ASTM D3625 (Effect of Water on Bituminous-Coated Aggregate Using Boiling Water). Rolling Bottle Test The test was developed by Isacsson and Jorgensen of Sweden (1987). Aggregate chips are coated with binder and covered with water in glass jars. The jars are rotated so that the contents are agitated. Periodically, the coating of the stones is estimated visually. Net Adsorption Test The net adsorption test (NAT) was developed under SHRP in the early 1990s and is documented in SHRP Report A-341 (Curtis et al. 1993). The test is used to determine the affinity and compatibility of an asphaltâaggregate pair and the sensitivity of the system to water. Therefore, it can be considered a screening test. The test comprises two steps. First, asphalt is adsorbed onto aggregate from a toluene solution, the amount of asphalt remaining in solution is measured, and the amount of asphalt adsorbed to the aggregate is determined. Second, water is introduced into the system, asphalt is desorbed from the aggregate surface, the asphalt present in the solution is measured, and the amount remaining on the aggregate surface is calculated. The amount of asphalt remaining on the surface after desorption is termed net adsorption. The net adsorption test offers a direct means of comparing the affinity of different asphaltâaggregate pairs. The test is relatively fast and easily performed. However, SHRP Report A-341 provides mixed conclusions in terms of correlation between NAT results and moisture sensitivity results from indirect tension tests on compacted specimens. The NAT procedure was modified by researchers at the University of Nevada at Reno, and the test results were correlated with the ECS (Scholz et al. 1994). The study by Scholz et al. (SHRP-A-402, 1994) indicates that predictions of the water sensitivity of the binder as proposed by NAT show little or no correlation to wheel-tracking tests on the mixes. Wilhelmy Plate Test and Universal Sorption Device for Surface Free Energy In recent years, asphalt technologists have performed research into the relationship between surface free energy and moisture damage potential. Most of the surface energy research for
90 Moisture Sensitivity of Asphalt Pavements: A National Seminar asphaltâaggregate mixture combinations has been conducted at Texas A&M University (Elphingstone 1997; Cheng et al. 2001; Cheng et al. 2002). The principle behind using the concept of surface free energy is that the cohesive bonding within asphalt and the adhesive bonding between asphalt and aggregate are related to the surface free energy of the asphalt and aggregate. Researchers at Texas A&M University demonstrated the effectiveness of this concept by using three different aggregates (one granite and two limestone aggregates) and two of the SHRP asphalts (AAM and AAD). The permanent deformation on compacted specimens using compressive testing correlated well with measured values of surface free energy of the asphalts and aggregates used in the research when tested in dry and wet conditions. The asphalt surface free energy is determined by using a Wilhelmy plate test, where the dynamic contact angle between asphalt and a liquid solvent is measured. The surface free energy of aggregate is measured by using a universal sorption device developed at Texas A&M University. Pneumatic Pull-Off Test The pneumatic pull-off test provides a rapid and reproducible means of evaluating moisture susceptibility of asphalt binders. The experimental procedure measures the tensile and bonding strength of asphalt binder applied to a glass plate as a function of time while exposed to water. Asphalt binder, containing 1.0% by weight of glass beads, is applied to a porous disk, which is then pressed onto a glass plate. The glass beads are used to control the thickness of the asphalt film and do not appear to have any effect on the results. The pressure necessary to debond the conditioned specimen at 25° C is measured with a pneumatic adhesion tester. The typical pulling rate is about 66 kPa/s, and asphalt film thickness is around 200 microns. The test has indicated that, as expected, soak time is an important factor. This means that longer exposure to water increases stripping damage if the mixture is susceptible to debonding. A study by Youtcheff and Aurilio (1997) has indicated that the viscosity building structure provided by asphaltenes is disrupted by the presence of water, and the resistance to moisture damage of the binder appears to depend on the properties of the maltenes. Tests on Compacted Mixtures These tests are conducted on laboratory-compacted specimens or field cores or slabs. Examples include indirect tensile freezeâthaw cyclic with modulus and strength measurement, immersionâ compression, abrasion weight loss, and sonic vibration tests. This last test is also conducted on loose mixtures and is currently under investigation by the Western Research Institute. The major advantage of these tests is that the mix physical and mechanical properties, water/traffic action, and pore pressure effects can be taken into account. The results can be measured quantitatively, which minimizes subjective evaluation of test results. The drawback of these tests is that more elaborate testing equipment, longer testing times, and more laborious test procedures are needed. ImmersionâCompression Test ASTM D1075 (1949 and 1954) and AASHTO T165-55 (Effect of Water on Compressive Strength of Compacted Bituminous Mixtures) The immersionâcompression procedure was originally published as ASTM D1075-49. Therefore, the test is among the first to be used for evaluation of moisture sensitivity. Revisions were made to the procedure in 1996. Goode (1959) explains the test in detail in ASTM Special Technical Publication 252.
Solaimanian, Harvey, Tahmoressi, and Tandon 91 Two groups of compacted specimens are used in this test method. One group is submerged in a 120° F water bath for 4 days for conditioning, and the other group is maintained dry. An alternative approach to conditioning is to immerse the test specimens in water for 24 h at 140° F. Compressive strength is measured on specimens of both groups at 77° F at a deformation rate of 0.05 in./min per inch of height. For a 4-in.-tall specimen, the rate would be 0.2 in./min. The average strength of conditioned specimens over that of dry specimens is used as a measure of moisture sensitivity of the mix. Most agencies have used a 70% ratio as a passing limit. Marshall Immersion Test The conditioning phase of this test is identical to the one used for the immersionâcompression test. However, Marshall stability is used as a strength parameter rather than compressive strength. Moisture Vapor Susceptibility The moisture vapor susceptibility procedure was developed and has been used by the California Department of Transportation (California Test Method 307). Two specimens are prepared and compacted using the kneading compactor, as for mix design testing, except that they are prepared in stainless steel molds. The compacted surface of each specimen is covered with an aluminum seal cap, and a silicone sealant is applied around the edges to prevent the escape of moisture vapor. An assembly with a felt pad, seal cap, and strip wick is prepared to make water vapor available to the specimen by placing the free ends of the strip wick in water. After the assembly is left in an oven at 60° C with the assembly suspended over water for 75 h, the specimen is removed and tested immediately in the Hveem stabilometer. A minimum Hveem stabilometer value is required, which is less than that required for the dry specimens used for mix design. Repeated Pore Water Pressure Stressing and Double-Punch Method This test procedure was developed by Jimenez at the University of Arizona (1974). The test falls in the category of those that include measurement of mix mechanical properties and those that take traffic dynamic loading into account. To capture the water pore pressure effect, compacted specimens undergo a cyclic stressing under water. The load is not directly in contact with the specimen. This stressing is accomplished through generating cyclic pressure within water at a rate of 580 rpm. The generated water pressure is between 35 and 217 kPa, which, according to Jimenez, is within a range comparable with pressure expected in saturated pavements under traffic. Once cyclic water pressure inducement is complete, the tensile strength of the specimens is determined by using the double-punch equipment. Compacted specimens are tested through steel rods placed at either end of the specimen in a punching configuration. Jimenez demonstrated the severity of this test by comparing predictions on similar mixtures using the immersionâcompression test. Original Lottman Indirect Tension Test The original Lottman procedure was developed by Lottman at the University of Idaho in the late 1970s (Lottman 1978). The procedure requires one group of dry specimens and one group of conditioned specimens. The specimens are 4 in. in diameter and about 2.5 in. thick. Conditioning includes vacuum saturation of specimens under 26 in. of mercury vacuum for 30 min followed by 30 min at atmospheric pressure. The partially saturated specimens are frozen at 0° F for 15 h followed by 24 h in a 140° F water bath. This is considered accelerated freezeâthaw conditioning.
92 Moisture Sensitivity of Asphalt Pavements: A National Seminar Lottman proposed thermal cyclic conditioning as an alternative. For each cycle, after 4 h of freeze at 0° F, the temperature is changed to 120° F and maintained for 4 h before being changed back to 0° F. Therefore, a complete thermal cycle lasts 8 h. The specimens go through 18 thermal cycles of this type. Lottman concluded that thermal cycling was somewhat more severe than the accelerated freezeâthaw conditioning with water bath. Conditioned and dry specimens are both tested for tensile resilient modulus and tensile strength using indirect tensile equipment. The loading rate is 0.065 in./min for testing at 55° F or 0.150 in./min for testing at 73° F. The severity of moisture sensitivity is judged on the basis of the ratio of test values for conditioned and dry specimens. AASHTO T283 (Modified Lottman Indirect Tension Test Procedure) The AASHTO Standard Method of Test T283, âResistance of Compacted Bituminous Mixture to Moisture Induced Damage,â is one of the most commonly used procedures for determining HMA moisture susceptibility. The test is similar to the original Lottman with a few exceptions. One of the modifications is that the vacuum saturation is continued until a saturation level between 70% and 80% is achieved, compared with the original Lottman procedure that required a set time of 30 min. Another change is in the test temperature and loading rate for the strength test. The modified procedure requires a rate of 2 in./min at 77° F rather than 0.065 in./min at 55° F. A higher rate of loading and a higher temperature were selected to allow testing of specimens with a Marshall stability tester, available in most asphalt laboratories. The higher temperature also eliminates the need for a cooling system. Briefly, the test includes curing loose mixtures for 16 h at 60° C, followed by a 2-h aging period at 135° C. At least six specimens are prepared and compacted. The compacted specimens should have air void contents between 6.5% and 7.5%. Half of the compacted specimens are conditioned through a freeze (optional) cycle followed by a water bath. First, vacuum is applied to partially saturate specimens to a level between 55% and 80%. Vacuum-saturated samples are kept in a â18° C freezer for 16 h and then placed in a 60° C water bath for 24 h. After this period the specimens are considered conditioned. The other three samples remain unconditioned. All of the samples are brought to a constant temperature, and the indirect tensile strength is measured on both dry (unconditioned) and conditioned specimens (Figure 4). Tensile Strength Ratio 80 % minimum Conditioned Specimens Dry Specimens FIGURE 4 Indirect tensile test used for dry and conditioned specimens for AASHTO T283.
Solaimanian, Harvey, Tahmoressi, and Tandon 93 State highway agencies report mixed success with this method. Several research projects have dealt with the methodâs shortcomings, resulting in suggested âfixes,â but the test remains empirical and liable to give either false positives or false negatives in the prediction of moisture susceptibility. Major concerns with this test are its reproducibility and its ability to predict moisture susceptibility with reasonable confidence (Solaimanian and Kennedy 2000a). AASHTO T283 was adopted by the Superpave system as the required test for determination of moisture damage. Following this adoption, state highway agencies made this test the most widely used procedure for determination of moisture damage potential. Later, Epps et al. (2000) investigated this test extensively under NCHRP Project 9-13. The project, âEvaluation of Water Sensitivity Tests,â was completed in 1999 and provided recommended changes to AASHTO T283 to better accommodate its use in the Superpave system. The researchers investigated the effect of a number of factors on the test results, including different compaction types, diameter of the specimen, degree of saturation, and the freezeâthaw cycle. They used five aggregates, two considered good performers in terms of moisture resistance and the other three considered to have low to moderate resistance to moisture damage. Binders were specific to each mix and included PG 58-28, 64-22, 64-28, and 70-22. In summary, the following conclusions were drawn from that study, as reported by Epps et al. (2000): ⢠In general, resilient modulus had no effect on tensile strength of dry specimens, conditioned specimens with no freezeâthaw, or conditioned specimens with freezeâthaw. ⢠Dry strength of 100-mm-diameter Superpave gyratory compactor (SGC) specimens and 100-mm Hveem specimens was larger than that of 150-mm SGC specimens. ⢠Dry strength of 100-mm Marshall specimens was the same as that of the 150-mm SGC specimens. ⢠Dry strength of 100-mm-diameter SGC specimens was similar to the dry strength of 100-mm Hveem specimens. ⢠Dry strength increased as the aging time for the loose mix increased. ⢠The freezeâthaw tensile strength was the same as the no freezeâthaw tensile strength. ⢠The level of saturation had little effect on the no freezeâthaw and freezeâthaw tensile strengths. The levels of saturation used in the study were 50%, 75%, and 95%. ⢠The tensile strength ratio of 150-mm SGC specimens was larger than the tensile strength ratio of 100-mm-diameter SGC specimens or 100-mm Hveem specimens. ⢠The tensile strength ratio of 150-mm SGC specimens was similar to the tensile strength ratio of 100-mm Marshall specimens. The results obtained in this study indicated that the water sensitivities of the mixtures as described by the state departments of transportation did not satisfactorily match the observed behavior of the mixtures for a number of data groups. ASTM D4867 (TunnicliffâRoot Test Procedure) ASTM D4867, âStandard Test Method for Effect of Moisture on Asphalt Concrete Paving Mixtures,â is comparable with AASHTO T283. In both methods, the freeze cycle is optional. However, curing of the loose mixture in a 60°C oven for 16 h is eliminated in the ASTM D4867 procedure.
94 Moisture Sensitivity of Asphalt Pavements: A National Seminar Texas FreezeâThaw Pedestal Test The Texas freezeâthaw pedestal test was proposed by Kennedy et al. (1982) as a modification of the water susceptibility test procedure proposed by Plancher et al. (1980) at the Western Research Institute. The test is in the category of those evaluating the compatibility between asphalt binder and aggregate and the corresponding adhesiveness. The test is designed to minimize the effect of mechanical properties of the mix by using a uniform-sized aggregate. It prescribes the preparation of hot mix using a fine fraction of aggregate [passing the No. 20 (0.85-mm) and retained on the No. 35 (0.50-mm) sieve] and asphalt at a temperature of 150° C. The hot mix so prepared is kept in the oven at 150° C for 2 h and stirred for uniformity of temperature every hour. At the end of 2 h, the mix is removed from the oven and cooled to room temperature, reheated to 150° C, and compacted with a load of about 28 kN for 15 min to form a briquette 41 mm in diameter by 19 mm in height (the procedure does not prescribe any tolerance for the dimensions). The briquette is cured for 3 days at room temperature and placed on a pedestal in a covered jar of distilled water (Figure 5). It is then subjected to thermal cycling of 15 h at â12° C, followed by 9 h at 49° C. After each cycle, the briquette surface is checked for cracks. The number of cycles required to induce cracking is a measure of water susceptibility (typically 10 freezeâthaw cycles). Pedestal test specimens are prepared from a narrow range of uniformly sized aggregate particles coated with 5% asphalt. This formulation reduces aggregate particle interactions in the mixture matrix, and the thin asphalt coating between aggregate particles produces a test specimen that is highly permeable and thus allows easy penetration of water into the interstices found between aggregate particles. Therefore, moisture-induced damage in the specimen can easily arise either from bond failure at the asphaltâaggregate interface region (stripping) or from the fracture of the thin asphaltâcement films bonding aggregate particles (cohesive failure) by formation of ice crystals. FIGURE 5 Freezeâthaw pedestal test: compacted specimen in a water jar ready for thermal cycling. Specimen (Briquette) Stress Pedestal Jar Cap Water
Solaimanian, Harvey, Tahmoressi, and Tandon 95 Hamburg Wheel-Tracking Device The HWTD was developed by Esso A.G. in the 1970s in Hamburg, Germany (Romero and Stuart 1998). This device measures the combined effects of rutting and moisture damage by rolling a steel wheel across the surface of an asphalt concrete specimen that is immersed in hot water. The wheel rolls back and forth on the submerged specimen. Originally, a pair of cubical or beam test specimens were used. However, with the increasing use of the SGC, the Texas Department of Transportation (TxDOT) and others have adopted a testing protocol using cylindrical specimens compacted in the SGC (Figure 6). Typically, gyratory-compacted specimens are arranged in a series to provide the required path length for the wheels. Each steel wheel passes 20,000 times or until 20 mm of deformation is reached. The measurements are customarily reported versus wheel passes. The results from the HWTD are the postcompaction consolidation, creep slope, stripping slope, and stripping inflection point (Figure 7). The postcompaction consolidation is the deformation measured at 1,000 passes, assuming that the wheel is densifying the mixture within the first 1,000 wheel passes. The creep slope is the number of repetitions or wheel passes to create a 1-mm rut depth due to viscous flow. The stripping slope is represented by the inverse of the rate of deformation in the linear region of the deformation curve, after stripping begins and until the end of the test. The stripping slope can be quantified as the number of passes required to create a 1-mm impression from stripping. The stripping inflection point is the number of passes at the intersection of the creep slope and the stripping slope. It represents the moisture damage resistance of the HMA and is assumed to be the initiation of stripping (Aschenbrener and Currier 1993). FIGURE 6 HWTD with cylindrical specimens.
96 Moisture Sensitivity of Asphalt Pavements: A National Seminar -25 -20 -15 -10 -5 0 0 0.5 1 1.5 2 2.5 3 3.5 4 Cycles (x1000) P er m an en t D ef or m at io n (m m ) Note: Postcompaction Creep Slope Stripping Slope Stripping Inflection Point FIGURE 7 Results from testing with the HWTD. This device has been researched extensively through a series of projects (Aschenbrener and Currier 1993; Aschenbrener 1995; Stuart and Izzo 1995; Stuart and Mogawer 1995; Aschenbrener et al. 1995; Stuart and Mogawer 1997). The Federal Highway Administration (FHWA) has been involved in several research projects using the HWTD. Stuart and Izzo (1995) worked on finding a correlation between binder stiffness and rutting susceptibility using the HWTD. They found that a stiffer binder would provide a mixture with lower rutting susceptibility. Stuart and Mogawer (1995), using different binders, concluded that the creep slopes should be used for evaluating rutting susceptibility. The researchers also demonstrated that decreasing the coarse aggregate content from 80% to 60% had no significant effect on the rutting performance of the mixtures. Stuart and Mogawer (1997) also performed a study to evaluate the validity of laboratory wheel-tracking devices on the basis of pavement performance results. They concluded that the increase in nominal maximum size from 19 mm to 37.5 mm, and an associated 0.85% decrease in optimum binder content, decreased rutting susceptibility on actual pavements. However, none of the wheel-tracking devices tested, including the HWTD, adequately predicted a decrease in rutting susceptibility with increased nominal maximum aggregate size. The Colorado Department of Transportation (CDOT) has performed extensive research evaluating HMA with the HWTD. Aschenbrener (1995) evaluated factors that influence the results from the HWTD. He found that there was an excellent correlation between stripping observed in laboratory tests and the moisture damage of pavements with known field performance. There was also an excellent correlation between stripping inflection point and known stripping performance. It was found that for good pavements, the stripping inflection point was higher than 10,000 passes, and for pavements that lasted 1 year, the stripping inflection point was less than 3,000 passes. It was also found that the results from the HWTD were sensitive to aggregate properties such as dust coating on the aggregates, clay content, and high dust-to-asphalt ratios. One other finding was that as the short-term aging time increases, samples become more resistant to moisture damage. This is in agreement with other research that shows that higher mix stiffness for conventional binders generally gives better stripping results (because water
Solaimanian, Harvey, Tahmoressi, and Tandon 97 penetration will be more difficult). Aschenbrener recommended that testing temperatures for the HWTD be selected on the basis of the high temperature environment the pavement will experience. Although it is used in the asphalt industry primarily as a screening test for moisture sensitivity, the HWTD test has also shown promise in providing information on aggregate properties (Solaimanian and Kennedy 2000b). In spite of its utility as a screening test, a disadvantage is that this test does not provide a fundamental property that can be used for modeling purposes. Recommended values for specific climates and traffic levels are also not available. The test also simulates the stripping mechanism that takes place when rainfall occurs during the hot time of the year, hence Aschenbrenerâs recommendation that test temperatures should be selected from the hottest time of the year. This recommendation may not be applicable to locations where water primarily enters the asphalt concrete during the cooler time of the year. Environmental Conditioning System As part of the SHRP Asphalt Research Program, the mechanisms responsible for moisture damage were extensively investigated, and a new system for predicting the moisture susceptibility of HMA was developed (Al-Swailmi and Terrel 1992). The ECS test procedure was developed at Oregon State University (OSU) as a part of the Asphalt Research Program. The procedure (originally designated as AASHTO TP34, âDetermining Moisture Sensitivity of Compacted Bituminous Mixtures Subjected to Hot and Cold Climate Conditionsâ) was designed to determine the moisture susceptibility of compacted HMA specimens under conditions of temperature, moisture saturation, and dynamic loading similar to those found in pavements. A schematic diagram of the ECS is shown in Figure 8. In this procedure, a membrane-encapsulated specimen is subjected to cycles of temperature, repeated loading, and moisture conditioning. The specimens used in the ECS procedure are 102 ± 4 mm in diameter and 102 ± 4 mm in height. The air void content of the test specimens must be in the range of 7.5% ± 0.5% (note that AASHTO T283 requires 7.0% ± 0.5%). The loose asphalt concrete mixtures are prepared following AASHTO TP4-93, Edition 1B, and are short-term aged in accordance with AASHTO PP2-94, first edition. The short-term FIGURE 8 Schematic diagram of the ECS test.
98 Moisture Sensitivity of Asphalt Pavements: A National Seminar aged mixtures are compacted using an SGC per AASHTO TP4-93. The compacted specimens are left at room temperature overnight to cool to room temperature. Afterwards, a latex membrane is placed around the specimen and sealed with a silicone sealant. The specimens are then set aside for a minimum of 15 h to dry. The air permeability and dry resilient modulus (MR) of the specimen are determined after it is placed inside the ECS load frame. The air permeability is determined by flowing air through the specimen at a vacuum level of 68 kPa. The resilient modulus is determined by applying a load in the form of a haversine wave with a loading period of 0.1 s and a rest period of 0.9 s. Pulling deaired distilled water through it at a vacuum level of 68 kPa then saturates the specimen. In the next step, the water permeability of the specimen is determined. The saturated specimen is subjected to a âhot cycle,â that is, the temperature of the specimen is elevated to 60° C for 6 h while it is subjected to the haversine loading. The specimen is cooled to a temperature of 25° C for at least 2 h. At the end of the 8 h, the conditioned MR and the water permeability are determined. The process is repeated for two more cycles (i.e., 6 h of loading and heating at 60°C followed by 2 h of cooling). If the ratio of the conditioned MR to the unconditioned MR falls below 0.7, the mixture is considered as moisture susceptible; if the ratio is greater than 0.70 the mixture is considered acceptable. Needless to say, this procedure is too long and complicated and must be shortened and simplified before it can be adopted for routine mixture design or quality control testing. One advantage of the ECS is that it includes the influence of traffic loading and the resulting effect of pore water pressure, a significant consideration if the mechanism that causes moisture damage in the pavement is to be simulated. The ECS showed promise when it was introduced to the industry. One of the main advantages of the system was its capability of simulating field conditions within the laboratory to some extent. The test setup had the capability of applying load while the specimen was at elevated temperature and saturated. Lottman (1971), Majidzadeh and Brovold (1966), Anderson and Shamon (1984), Hallberg (1950), and Jimenez (1974) have suggested that one of the mechanisms of stripping is the inducement of pore pressure within the air voids of HMA due to traffic and temperature loads. They proposed that pore water pressure could exceed the adhesive strength of the binder aggregate surface and break the adhesive bonds. The researchers at OSU tried to simulate this mechanism by applying a repeated load on the specimen while the saturated specimen was heated. However, the visual stripping, permeability, and modulus measurements from AASHTO TP34 did not provide a better relationship with field observations than what was obtained from AASHTO T283. In addition, the test was more complex and expensive than the other tests existing at the time. One of the first studies in which the ECS and the HWTD were evaluated includes the work conducted by Aschenbrener et al. (1994). The researchers compared the results from the ECS and the HWTD for 20 pavement sites with known histories of performance with respect to moisture damage. Performance of the sites was categorized as good, high maintenance, complete rehabilitation, or disintegrator. Their conclusion was that the HWTD is a very severe test, especially for the sites with good field performance. The researchers concluded that, with some modification, the HWTD results correlated well with field performance of the pavements for which the tests were conducted. With regard to the ECS, the conclusion was that the samples were only mildly conditioned. Only 3 of the 13 sites with poor field performance failed in the laboratory.
Solaimanian, Harvey, Tahmoressi, and Tandon 99 Tandon et al. (1997), in a study sponsored by TxDOT, performed a comprehensive evaluation of the ECS in which special emphasis was placed on the accuracy and precision of the system. Researchers identified numerous problems with the resilient modulus measurement systems and conditioning procedures. The original ECS system as proposed by the SHRP researchers consisted of a pneumatic loading system placed inside a conditioning chamber. The chamber had the capability of maintaining temperature at 60° C. However, water at room temperature was supplied to the specimen (for maintaining saturation). This reduced the temperature of the specimen to 40° C. This cooling of the specimen might affect the proper conditioning of the specimen. Diverting the flow of water through a heating system before it reaches the specimen could eliminate this problem. To maintain saturation, water is continuously pulled through the specimen by using a vacuum. The vacuum also induces confinement to the specimen and reduces the possibility of specimen bulging during the conditioning phase. A coefficient of variation of more than 30% was observed during the preliminary evaluation of the original ECS using 15 HMA specimens (3 types of mixes with 5 specimens of each mix). To identify causes of variability, the resilient modulus of a synthetic specimen was measured nine times by dismantling and reassembling the specimen in the test setup. The observed coefficient of variation was similar to that of the HMA mix, indicating that the problem was with the test setup. The rigidity of the test setup, vibrations in the measurement system, and the precision of the strain measurement device were evaluated. Researchers noted that the system lacked rigidity and had to be replaced with a rigid loading system. The loading system was placed inside the chamber on a flexible support, contributing to excessive system compliance and allowing vibrations (due to loading) to be transferred to the strain measurement system. This resulted in reduction of the precision of the strain measurement system. In addition, the strain measurement system consisted of yoke assembly and linear variable differential transformer (LVDT). Researchers ascertained that the yoke assembly significantly affected the repeatability of the system and needed to be replaced by a more robust strain measurement system. On the basis of the evaluation and recommendations of the researchers, Alam (1997) modified the system and proposed the following procedure: The ECS system consists of a fluid conditioning subsystem, an environmental conditioning subsystem and a loading subsystem. The fluid conditioning subsystem maintains a constant flow of water and supply of vacuum to the specimen. The environmental conditioning subsystem, which houses the loading subsystem, can maintain a desired temperature and humidity. The loading subsystem can simulate traffic conditions by applying a repeated half-sine loading on the specimen throughout the conditioning phase. The same subsystem is also used for measuring the resilient modulus of the specimen. The specimen to be tested is prepared at an air void content of between 7% and 8% with a height of 4 ± 0.15 in. (102 ± 4 mm). The prepared specimen is removed from the mold and cooled at room temperature for one hour. The specimen is then subjected to static immersion saturation for five minutes, enclosed within a membrane, and placed between the top and bottom end platens of the resilient modulus (MR) test setup. After this step, water at room temperature is circulated through the specimen for one hour. After one hour of waiting, the water flow is stopped, the vacuum is released, and the reference resilient modulus is measured.
100 Moisture Sensitivity of Asphalt Pavements: A National Seminar The specimen is then conditioned either for six or eighteen hours. During the conditioning, a flow of water at 140° F (60° C) is maintained while a cyclic load is applied to the specimen. After six hours of conditioning, the chamber door is opened, conditioning is stopped and the circumference of the specimen is measured. If the circumference of the specimen increases by more than 2%, the material will be considered as moisture-susceptible. At this point, the conditioning process is stopped, and the specimen is removed from the setup. Otherwise, the specimen is conditioned for twelve additional hours. After the specimen is cooled, the resilient modulus of the specimen is measured again and is considered as the conditioned resilient modulus. If the MR ratio (ratio of the conditioned and unconditioned resilient moduli) falls below 0.8, the mixture will be considered as marginal. If the MR ratio is equal to or above 0.8, the mixture will be considered as a well-performing mix. Tandon and Nazarian (2001) tested three different types of mixes with the ECS: well performing, poor performing, and marginal performing. The new test setup and protocol were evaluated by using blind mixes (Tandon and Nazarian 2001). The predicted behavior from the modified ECS procedure matched field performance in some cases, and in other cases it did not. A postmortem study indicated that the gradation used in specimen production did not consistently match the job mix formula. New specimens were prepared as per job mix formula, and the results matched the anticipated field performance. This validation study indicates one of the limitations of any moisture susceptibility laboratory test that relies on mechanical properties. Since the modulus or strength of a material is dependent on parameters such as the gradation, asphalt concrete content, and air void content, any deviation from the job mix formula during construction or laboratory testing may favorably or unfavorably affect the moisture susceptibility of the mixture. Flexural Fatigue Beams Test with Moisture Conditioning To evaluate the effects of moisture damage on the fatigue cracking performance of asphalt concrete mixes, experimentation on moisture conditioning of flexural fatigue beams was done by Shatnawi et al. (1995). Fatigue beams were cut from field sections that had exhibited different levels of moisture-related damage. Raw materials from these projects were also used to create laboratory-compacted fatigue beams, including some with lime treatment added. The conditioned beams were partially saturated to 60% to 80% by using a vacuum and then subjected to three repeated 5-h cycles of 60° C followed by 4 h at 25° C while remaining submerged, and one 5-h cycle at â18° C. They were then removed from the water bath and tested for fatigue following AASHTO TP-8. The results showed that the conditioning had a significant effect on the initial stiffness and on the fatigue performance in the laboratory. For the laboratory- compacted specimens asphalt content and air void content were not independently controlled, and the results showed that binder contents reduced by 0.5% produced higher air void contents under standard compaction, which together increased the moisture susceptibility of both initial stiffness and fatigue life. Some of the specimens obtained from the field had air void contents greater than 12%, which indicated that their moisture susceptibility in the field was highly related to construction compaction control. The results also showed that lime marination treatment improved the performance of the fatigue beams. Two potential reasons for the benefits of the lime treatment
Solaimanian, Harvey, Tahmoressi, and Tandon 101 could not be separated in the experiment design: the lime increased the fines content of the mixes, which resulted in lower air void contents under a standard laboratory compaction effort, and it was assumed that there was a chemically induced benefit as well. ECS/Simple Performance Tests Procedure New test procedures such as simple performance tests (SPTs) are emerging as a result of NCHRP Projects 9-19, 9-29, and 1-37. These tests will fill the gap for the Superpave design system, which currently lacks mechanical tests as part of the design procedure. The proposed tests are dynamic modulus, repeated axial load, and static axial creep tests. NCHRP Project 9-34, currently in progress, is using these tests with the ECS to develop new test procedures for evaluation of moisture sensitivity (Figures 9 and 10). It is anticipated that modifications to the current conditioning are required to obtain the most reliable procedure. Below is a brief description of the three SPTs under evaluation for moisture sensitivity. Dynamic Modulus To measure dynamic modulus, sinusoidal loads are applied to the specimen at different test temperatures and test frequencies. A sinusoidal (haversine) axial compressive stress is applied to a specimen of asphalt concrete at a given temperature and loading frequency. The applied stress and the resulting recoverable axial strain response of the specimen are measured and used to calculate the dynamic modulus and phase angle. In this procedure, a 150- by 150-mm specimen is prepared using an SGC and is cored in the center to obtain a 100-mm (diameter) by 150-mm (height) specimen. The cored specimen is sawed at the ends to make leveled specimens. The gauge length for measuring axial deformations is 101.6 mm ± 1 mm. The specimen is placed in the environmental chamber and allowed to equilibrate to the specified testing temperature ±1°C. A contact load (Pmin) equal to 5% of the dynamic load is applied to the specimen. Sinusoidal loading (Pdynamic) is applied to the specimen in a cyclic manner. The dynamic load is adjusted to obtain axial strains between 50 and 150 microstrain. The recommended test series for the development of master curves for use in pavement response and performance analysis consists of testing at â10° C, 4.4° C, 21.1° C, 37.8° C, and 54.4° C at loading frequencies of 0.1, 0.5, 1.0, 5, 10, and 25 Hz at each temperature. Testing at a given temperature begins with the highest frequency of loading and proceeds to the lowest. At the beginning of testing, the specimen is preconditioned with 200 cycles at 25 Hz. A typical rest time period between each frequency run is 2 min. This rest period shall not exceed 30 min for any two-frequency runs. The suggested procedure includes conditioning requirements modified from those of the NCHRP Project 9-34 study. Since it is difficult to perform dynamic modulus testing at every single temperature, one test temperature is selected for the tests conducted at all frequencies. Flow Number In this test, a cylindrical sample of asphalt concrete mixture is subjected to a haversine axial load. The load is applied for a duration of 0.1 s with a rest period of 0.9 s. The rest period has a load equivalent to the seating load. The test can be performed without confinement, or else a confining pressure is applied to better simulate in situ stress conditions. Cumulative permanent axial and radial strains are recorded throughout the test. In addition, the number of repetitions at which shear deformation, under constant volume, starts is defined as the flow number.
102 Moisture Sensitivity of Asphalt Pavements: A National Seminar (a) (b) FIGURE 9 Specimen setup for (a) conditioning and (b) testing. (a) (b) FIGURE 10 (a) Testing chamber and (b) environmental conditioning subsystem for ECS/SPT setup.
Solaimanian, Harvey, Tahmoressi, and Tandon 103 The specimen preparation, size requirements, and placement in the machine are similar to those of the dynamic modulus test. The only difference is that radial LVDTs are also attached to the specimen. The recommended test protocol for the SPT for use in the Superpave volumetric mix design consists of testing the asphalt mix at one effective pavement temperature Teff and one design stress level selected by the design engineer. The effective pavement temperature Teff covers approximately the temperature range of 25° C to 60° C. The design stress levels cover the range from 69 to 207 kPa for the unconfined tests and from 483 to 966 kPa for the confined tests. Typical confinement levels range between 35 and 207 kPa. For the NCHRP Project 9-34 research, the test temperature and required stress level are selected within the range specified by the test procedure. Flow Time In this test, a cylindrical sample of asphalt concrete mixture is subjected to a static axial load. The test can be performed without confinement, or a confining pressure may be applied to better simulate in situ stress conditions. The flow time is defined as the postulated time when shear deformation, under constant volume, starts. The applied stress and the resulting permanent or axial strain response of the specimen are measured and used to calculate the flow time. Tests Methods to Evaluate AsphaltâAggregate Adhesion for Surface Treatments and Chip Seals Several tests are used particularly to evaluate the adhesion between aggregates and binder in a chip seal or surface treatment application. The immersion tray, plate, and sand mix tests are examples. Immersion Tray Test In the immersion tray test, a film of binder is placed in a shallow tray and covered with water. Afterwards, aggregate chips are pressed into the surface of the binder. The chips are removed after a specified time, and the coverage of the face in contact with binder is estimated visually. The test provides a general and rough estimate of adhesion strength between asphalt and aggregate. The rate and magnitude of pressing and pulling force can affect the results. Plate Methods In the plate method test, a film of binder is placed on a metal plate. Wet or dry aggregate chips are pressed or rolled into the surface. The plate may be immersed in water. The adhesion of the chips is determined by blows to the back of the plate. Chips that fall off are weighed or counted, or the chips are removed by pliers and the coating determined. The use of wet chips gives a measure of active adhesion. Sand Mix Method Wet sand is mixed or shaken with a solution of binder in solvent. The color and cohesion of the sand are determined. A black agglomerated sand is a positive result.
104 Moisture Sensitivity of Asphalt Pavements: A National Seminar Extent of Use of Various Moisture Sensitivity Tests by State Departments of Transportation Various versions of AASHTO T283 and ASTM D4867 tests are the most commonly used procedures within various agencies. A survey by Hicks (1991) showed that almost half of the 44 agencies surveyed were using these procedures before developments made by SHRP (Table 3). The rating in the table is based on a 0 to 9 scaling, with 9 referring to 100% effectiveness of the method. A recent survey of 55 agencies (including 50 states) compiled by Aschenbrener indicates that more agencies have moved toward using these two procedures or their modified versions after SHRP. Table 4 shows that more than 80% of the agencies that use a moisture sensitivity test procedure favor AASHTO T283 and ASTM D4867 or a similar procedure. Seven agencies have reported that they do not use any moisture sensitivity test for design. In 1988, Kiggundu and Roberts quantified the effectiveness of several tests, on the basis of test data from various researches, as shown in Table 5. The success/failure ratings, as established by Kiggundu and Roberts and presented in Table 5, are based on comparing the laboratory predictions with the field performance ratings. A higher percent success implies a larger number of âcorrectâ predictions. TABLE 3 Agencies Using Different Moisture Sensitivity Tests Before SHRP (Hicks 1991) Average Rating Test Method No. of Agencies Using Number Description of Effectiveness Boiling water (ASTM D3625) 9 5 Slight to moderate Static immersion (AASHTO T182) 3 4 Slight Lottman (NCHRP 246) 3 7.5 High Tunnicliff and Root (ASTM D4867) 9 5 Slight to moderate Modified Lottman (AASHTO T283) 9 7.5 High Immersionâcompression (AASHTO T165) 11 5 Slight to moderate TABLE 4 Agencies Using Different Moisture Sensitivity Tests After SHRP Test Method No. of Agencies Using Boiling water (ASTM D3625) 0 Static immersion (AASHTO T182) 0 Lottman (NCHRP 246) 3 Tunnicliff and Root (ASTM D4867) 6 Modified Lottman (AASHTO T283) 30 Immersionâcompression (AASHTO T165) 5 Wheel tracking 2 SOURCE: R. G. Hicks, L. Santucci, and T. Aschenbrener, âIntroduction and Seminar Objectivesâ (Topic 1 of this seminar).
Solaimanian, Harvey, Tahmoressi, and Tandon 105 TABLE 5 Success Rates of Test Methods (Kiggundu and Roberts 1988) Test Method Minimum Test Criteria % Success Modified Lottman (AASHTO T283) TSR = 70% TSR = 80% 67 76 TunnicliffâRoot (ASTM D4867) TSR = 70% TSR = 80% TSR = 70%â80% 60 67 67 10-minute boil test Retained coating 85%â90% 58 Immersionâcompression (AASHTO T165) Retained strength 75% 47 NOTE: TSR = tensile strength ratio. SUMMARY Moisture damage has been a topic of great interest to asphalt pavement technologists and state highway agencies for many years. Over the past 70 years, the industry has witnessed development of a considerable number of tests by many researchers and agencies. The tests developed fall into general categories: those that are conducted on loose asphaltâaggregate mixtures and those that are conducted on compacted mixes. Most of the tests of the first group provide an estimate of the asphaltâaggregate compatibility and stripping potential. Most of the tests in the second group attempt to take the mix properties, water action, and traffic into account in different ways. Some of the tests of the second group provide moisture sensitivity of the mix on the basis of a mix parameter such as strength or modulus before and after conditioning. Others provide some measure of damage such as permanent deformation to the mix while being conditioned under combined load and water actions. Some tests have been calibrated and implemented on a local basis (a region within a state). No test has been successfully calibrated and implemented across a wide spectrum of conditions. Reasons for the lack of widespread calibration with field performance include the limitations of the tests in including all of the effects causing moisture damage, lack of accessible field performance data, and difficulties with the tests such as variability and difficulty of operation. Many variables in the field make field correlation difficult, but development of such a correlation remains absolutely necessary. This has been a major shortcoming in the development of effective laboratory tests that can provide quantitative results used in specifications and design across a wide range of conditions. Mechanisms of moisture susceptibility/stripping may be different because of the different variables, but tests and their calibration must take into account materials, construction, traffic, and climate. The result will be that a given mix will have different risks depending on where and how it will be used, and these factors must be accounted for in test development, test evaluation and calibration, and test implementation. Databases that include the required variables and sufficient numbers of projects do not exist at this time and are very difficult to develop. However, databases of this type are necessary for effective calibration of laboratory tests for moisture susceptibility and stripping. RESOURCES Alam, M. M. 1997. A Test Method for Identifying Moisture Susceptible Asphalt Concrete Mixes. M.S. thesis. Department of Civil Engineering, University of Texas at El Paso.
106 Moisture Sensitivity of Asphalt Pavements: A National Seminar Al-Swailmi, S., and R. L. Terrel. 1992. Evaluation of Water Damage of Asphalt Concrete Mixtures Using the Environmental Conditioning System (ECS). Journal of the Association of Asphalt Paving Technologists, Vol. 61. Al-Swailmi, S., and R. L. Terrel. 1994. Water Sensitivity of AsphaltâAggregate Mixtures: Test Selection. SHRP-A-403. Strategic Highway Research Program, National Research Council, Washington, D.C. Al-Swailmi, S., T. V. Scholz, and R. L. Terrel. 1992. Development and Evaluation of Test System to Induce and Monitor Moisture Damage to Asphalt Concrete Mixtures. In Transportation Research Record 1353, TRB, National Research Council, Washington, D.C., pp. 39â45. Andersland, O. B., and W. L. Goetz. 1956. Sonic Test for Evaluation of Stripping Resistance in Compacted Bituminous Mixtures. Proc., Association of Asphalt Paving Technologists, Vol. 25. Anderson, D. A., and M. E. Shamon. 1984. Fourth Cycle of Pavement Research at the Pennsylvania Transportation Research Facility, Volume 5: Open-Graded Permeable Subbases at the Pavement Durability Research Facility. Report FHWA/PA 84-027. Pennsylvania Transportation Institute, Pennsylvania State University, Dec. Aschenbrener, T. 1995. Evaluation of Hamburg Wheel-Tracking Device to Predict Moisture Damage in Hot Mix Asphalt. In Transportation Research Record 1492, TRB, National Research Council, Washington D.C., pp. 193â201. Aschenbrener, T., and G. Currier. 1993. Influence of Testing Variables on the Results from the Hamburg Wheel-Tracking Device. CDOT-DTD-R-93-22. Colorado Department of Transportation, Denver. Aschenbrener, T., R. Terrel, and R. Zamora. 1994. Comparison of the Hamburg Wheel Tracking Device and the Environmental Conditioning System to Pavements of Known Stripping Performance. Final Report. Colorado Department of Transportation, Denver. Aschenbrener, T., R. B. McGennis, and R. L. Terrel. 1995. Comparison of Several Moisture Susceptibility Tests to Pavements of Known Field Performane. Journal of the Association of Asphalt Paving Technologists, Vol. 64, pp. 163â208. Bejarano, M. O., and J. T. Harvey. 2002. Accelerated Pavement Testing of Drained and Undrained Pavements Under Wet Base Conditions. In Transportation Research Record: Journal of the Transportation Research Board, No. 1816, TRB, National Research Council, Washington, D.C., pp. 137â147. Busching, H. W., J. L. Burati, Jr., and S. N. Amirkhanian. 1986. An Investigation of Stripping in Asphalt Concrete in South Carolina. Department of Civil Engineering, Clemson University, Clemson, S.C., July. Cheng, D., D. N. Little, R. L. Lytton, and J. C. Holtse. 2001. Surface Free Energy Measurement of Aggregates and Its Application on Adhesion and Moisture Damage of Asphaltâ Aggregate System. Proc., 9th International Center for Aggregate Research Symposium, Austin, Tex. Cheng, D., D. N. Little, R. L. Lytton, and J. C. Holtse. 2002. Use of Surface Free Energy Properties of AsphaltâAggregate System to Predict Damage Potential. Presented at Annual Meeting of the Association of Asphalt Paving Technologists, March. Curtis, C. W., K. Ensley, and J. Epps. 1993. Fundamental Properties of AsphaltâAggregate Interactions Including Adhesion and Absorption. SHRP-A-341. Strategic Highway Research Program, National Research Council, Washington, D.C.
Solaimanian, Harvey, Tahmoressi, and Tandon 107 Elphingstone, G. M. 1997. Adhesion and Cohesion in AsphaltâAggregate Systems. Ph.D. dissertation. Texas A&M University. Ensley, E. K., J. C. Petersen, and R. E. Robertson. 1984. AsphaltâAggregate Bonding Energy Measurements by Microcalorimetric Methods. Thermochimica Acta, Vol. 77, p. 95. Epps, J. A., P. E. Sebaaly, J. Penaranda, M. R. Maher, M. B. McCann, and A. J. Hand. 2000. NCHRP Report 444: Compatibility of a Test for Moisture-Induced Damage with Superpave Volumetric Mix Design. TRB, National Research Council, Washington, D.C. Ford, M. C., Jr., P. G. Manke, and C. E. OâBannon. 1974. Quantitative Evaluation of Stripping by the Surface Reaction Test. In Transportation Research Record 515, TRB, National Research Council, Washington, D.C., pp. 40â54. Gharaybeh, F. A. 1987. Evaluation of Tests to Assess Stripping Potential for Asphalt Concrete Mixtures. Dissertation. Department of Civil Engineering, Auburn University, Ala., Aug. Goode, F. F. 1959. Use of Immersion Compression Test in Evaluating and Designing Bituminous Paving Mixtures. In ASTM STP 252, pp. 113â126. Hallberg, S. 1950. The Adhesion of Bituminous Binders and Aggregates in the Presence of Water. Statens Vaginstitut, Stockholm, Sweden. Harvey, J., C. Monismith, and Q. Lu. 2002. Moisture Sensitivity (MS) Identification Flowchart. Draft memorandum. Prepared for Caltrans/Industry subcommittee, March. Hicks, R. G. 1991. NCHRP Synthesis of Highway Practice 175: Moisture Damage in Asphalt Concrete. TRB, National Research Council, Washington, D.C. Hubbard, P. 1938. Adhesion of Asphalt to Aggregate in Presence of Water. Highway Research Board Proceedings, Vol. 18, Part 1, pp. 238â249. Hveem, F. 1943. Quality Tests for Asphalt: A Progress Report. Proc., Association of Asphalt Paving Technologists, Vol. 15, pp. 111â152. International Slurry Seal Association. 1989. A Test Method for Determination of Methylene Blue Absorption Value (MBV) of Mineral Aggregate Fillers and Fines. ISSA Bulletin 145. Isacsson, W., and T. Jorgensen. 1987. Laboratory Methods for Determination of the Water Susceptibility of Bituminous Pavements. VIT report, Swedish Road and Traffic Research Institute, No. 324A. Jimenez, R. A. 1974. Testing for Debonding of Asphalt from Aggregates. In Transportation Research Record 515, TRB, National Research Council, Washington, D.C., pp. 1â17. Johnson, D. L. 1969. Debonding of Water-Saturated Asphaltic Concrete Caused by Thermally Induced Pore Pressure. MSCE thesis. University of Idaho, Moscow. Kandhal, P. S., C. Y. Lynn, and F. Parker. 1998. Tests for Plastic Fines in Aggregates Related to Stripping in Asphalt Paving Mixtures. Journal of the Association of Asphalt Paving Technologists, Vol. 67. Kennedy, T. W., F. L. Roberts, and K. W. Lee. 1982. Evaluation of Moisture Susceptibility of Asphalt Mixtures Using the Texas FreezeâThaw Pedestal Test. Proc., Association of Asphalt Paving Technologists, Vol. 51, pp. 327â341. Kennedy, T. W., F. L. Roberts, K. W. Lee, and J. N. Anagnos. 1982. Texas FreezeâThaw Pedestal Test for Evaluating Moisture Susceptibility for Asphalt Mixtures. Research Report 253-3. Center for Transportation Research, University of Texas at Austin, Feb. Kennedy, T. W., F. L. Roberts, and J. N. Anagnos. 1984. Texas Boiling Test for Evaluating Moisture Susceptibility of Asphalt Mixtures. Research Report 253-5. Center for Transportation Research, University of Texas at Austin, Jan.
108 Moisture Sensitivity of Asphalt Pavements: A National Seminar Kennedy, T. W., F. L. Roberts, and K. W. Lee. 1984. Evaluating Moisture Susceptibility of Asphalt Mixtures Using the Texas Boiling Test. In Transportation Research Record 968, TRB, National Research Council, Washington, D.C., pp. 45â54. Kennedy, T. W., and J. N. Anagnos. 1984. Modified Test Procedure for Texas FreezeâThaw Pedestal Test. CTR 3-O-79-253-7. University of Texas at Austin, Nov. Kennedy, T. W., and J. N. Anagnos. 1984. WetâDry Indirect Tensile Test for Evaluating Moisture Susceptibility of Asphalt Mixtures. Research Report 253-8. Center for Transportation Research, University of Texas at Austin, Nov. Kiggundu, B. M., and F. L. Roberts. 1988. Stripping in HMA Mixtures: State-of-the-Art and Critical Review of Test Methods. NCAT Report 88-2. National Center for Asphalt Technology. Kiggundu, B. M., and F. L. Roberts. 1988. The Success/Failure of Methods Used to Predict the Stripping Potential in the Performance of Bituminous Pavement Mixtures. Submitted to TRB. Krchma, L. C., and R. J. Loomis. 1943. BituminousâAggregate Water Resistance Studies. Proc., Association of Asphalt Paving Technologists, Vol. 15, pp. 153â187. Krchma, L. C., and H. G. Nevitt. 1942. Absorption of Liquid Bituminous Cement by Aggregates. Proc., Association of Asphalt Paving Technologists, Vol. 13. Lottman, R. P. 1971. The Moisture Mechanism That Causes Asphalt Stripping in Asphaltic Pavement Mixtures. Final Report R-47. Engineering Experimental Station, Department of Civil Engineering, University of Idaho, Moscow, Feb. Lottman, R. P. 1978. NCHRP Report 192: Predicting Moisture-Induced Damage to Asphaltic Concrete. TRB, National Research Council, Washington, D.C. Lottman, R. P. 1982. NCHRP Report 246: Predicting Moisture-Induced Damage to Asphaltic Concrete: Field Evaluation. TRB, National Research Council, Washington, D.C. Lu, Q. 2003. Investigation of Conditions for Moisture Damage in Asphalt Concrete and Appropriate Laboratory Test Methods. Proposal for doctoral thesis. Department of Civil and Environmental Engineering, University of California, Berkeley. Majidzadeh, K., and F. N. Brovold. 1966. Effect of Water on BitumenâAggregate Mixtures. Report CE-1. University of Florida. Maupin, G. W., Jr. 1980. Detection of Antistripping Additives with Quick Bottle Test. Final Report. Virginia Highway and Transportation Research Council, Charlottesville, Oct. McLeod, N. 1937. Applications of Surface Chemistry and Physics to Bituminous Mixtures. Proc., Association of Asphalt Paving Technologists, pp. 1â62. Nicholson, V. 1932. Proc., Association of Asphalt Paving Technologists, pp. 30â31. Philips, P. S., and C. R. Marek. 1986. HMA Moisture Susceptibility Problems: The Need to Test and Specify via a Common Procedure. Symposium presentation, ASTM, New Orleans, La., Dec. Plancher, H., G. Miyake, R. L. Venable, and J. C. Petersen. 1980. A Simple Laboratory Test to Indicate Moisture Susceptibility of AsphaltâAggregate Mixtures to Moisture Damage During Repeated FreezeâThaw Cycling. Canadian Technical Asphalt Association Proceedings, Vol. 25, pp. 247â262. Powers. 1938. Proc., Montana National Bituminous Conference, pp. 321â338. Rice, J. M. 1958. Relationship of Aggregate Characteristics to the Effect of Water on Bituminous Paving Mixtures. Symposium on Effect of Water on Bituminous Paving Mixtures. In ASTM STP 240, pp. 17â34.
Solaimanian, Harvey, Tahmoressi, and Tandon 109 Riedel, W., and H. Weber. 1934. Asphalt und Teer. Road Research Laboratory. 1986. TMH1: Standard Methods of Testing Road Construction Materials. Method B11: The Determination of the Adhesion of Bituminous Binder to Stone Aggregate by Means of the Chemical Immersion Test (Riedel Weber). England. Romero, F. L., and K. D. Stuart. 1998. Evaluating Accelerated Rut Testers. Public Roads, Vol. 62, No. 1, JulyâAug., pp. 50â54. Saville, V., and E. Axon. 1937. Adhesion of Asphaltic Binders to Mineral Aggregates. Association of Asphalt Paving Technologists, Proceedings of the Technical Sessions, Dec., pp. 87â101. Schmidt, R. J., and P. E. Graf. 1972. The Effect of Water on the Resilient Modulus of Asphalt Treated Mixes. Proc., Association of Asphalt Paving Technologists, Vol. 41, pp. 118â 162. Scholz, T. V., R. L. Terrel, A. Al-Joaib, and J. Bea. 1994. Water Sensitivity: Binder Validation. SHRP-A-402. Strategic Highway Research Program, National Research Council, Washington, D.C. Shatnawi, S., M. Nagarajaiah, and J. Harvey. 1995. Moisture Sensitivity Evaluation of Binderâ Aggregate Mixtures. In Transportation Research Record 1492, TRB, National Research Council, Washington, D.C., pp. 71â84. Solaimanian, M., and T. W. Kennedy. 2000a. Precision of the Moisture Susceptibility Test Method Tex 531-C. Research Report 4909-1F. Center for Transportation Research, University of Texas at Austin. Solaimanian, M., and T. W. Kennedy. 2000b. Relationship Between Aggregate Properties and Hamburg Wheel Tracking Results. Research Report 4977-1F. Center for Transportation Research, University of Texas at Austin. Solaimanian, M., T. W. Kennedy, and W. E. Elmore. 1993. Long-Term Evaluation of Stripping and Moisture Damage in Asphalt Pavements Treated with Lime and Antistripping Agents. Texas Department of Transportation Report CTR 0-1286-1F. Center for Transportation Research, University of Texas at Austin. Stuart, K. D. 1986. Evaluation of Procedures Used to Predict Moisture Damage in Asphalt Mixtures. FHWA/RD-86/091. Draft report, March. Stuart, K. D., and R. P. Izzo. 1995. Correlation of Superpave G*/sin δ with Rutting Susceptibility from Laboratory Mixture Tests. In Transportation Research Record 1492, TRB, National Research Council, Washington, D.C., pp. 176â183. Stuart, K. D., and W. S. Mogawer. 1995. Effect of Coarse Aggregate Content on Stone Matrix Asphalt Durability and Low-Temperature Cracking. In Transportation Research Record 1492, TRB, National Research Council, Washington, D.C., pp. 26â35. Stuart, K. D., and W. S. Mogawer. 1997. Validation of Asphalt Binder and Mixture Tests That Predict Rutting Susceptibility Using the Federal Highway Administrationâs Accelerated Loading Facility. Presented at 1997 Annual Meeting of the Association of Asphalt Paving Technologists, Salt Lake City, Utah. Tandon, V., N. Vemuri, S. Nazarian, and M. Tahmoressi. 1997. A Comprehensive Evaluation of Environmental Conditioning System. Journal of the Association of Asphalt Paving Technologists, Vol. 66. Tandon, V., and S. Nazarian. 2001. Modified Environmental Conditioning System: Validation and Optimization. Research Report TX-01/1826-1F. Center for Highway Materials Research, University of Texas at El Paso.
110 Moisture Sensitivity of Asphalt Pavements: A National Seminar Thelen, E. 1958. Surface Energy and Adhesion Properties in AsphaltâAggregate Systems. Bulletin 192, HRB, National Research Council, pp. 63â74. Tunnicliff, D. G., and R. Root. 1982. Antistripping Additives in Asphalt Concrete: State-of-the- Art. Proc., Association of Asphalt Paving Technologists, Vol. 51. Tunnicliff, D. G., and R. E. Root. 1984. NCHRP Report 274: Use of Antistripping Additives in Asphaltic Concrete Mixtures. Laboratory phase. TRB, National Research Council, Washington, D.C. White, G. C., J. P. Mahoney, G. M. Turkiyyah, K. A. Willoughby, and E. R. Brown. 2002. Online Tools for Hot-Mix Asphalt Monitoring. In Transportation Research Record: Journal of the Transportation Research Board, No. 1813, TRB, National Research Council, Washington, D.C., pp. 124â132. Winterkorn, H. 1937. Proc., Montana National Bituminous Conference, pp. 190â214. Winterkorn, H. 1938. Proc., Montana National Bituminous Conference, pp. 136â143. Winterkorn, H. 1939. Proc., Montana National Bituminous Conference, pp. 118â134. Winterkorn, H., G. Eckert, and E. Shipley. 1937. Testing the Adhesion Between Bitumen and Mineral Surfaces with Alkaline Solutions. Proc., Association of Asphalt Paving Technologists, pp. 63â85. Youtcheff, J., and V. Aurilio. 1997. Pneumatic Pull-Off Test. 42nd Canadian Technical Asphalt Association Proceedings.
