


Below is the uncorrected machine-read text of this chapter, intended to provide our own search engines and external engines with highly rich, chapter-representative searchable text of each book. Because it is UNCORRECTED material, please consider the following text as a useful but insufficient proxy for the authoritative book pages.
9 Part 1. Benchmarking Guidebook
10 Introduction to Benchmarking A practical overview of the basics of benchmarking in four parts
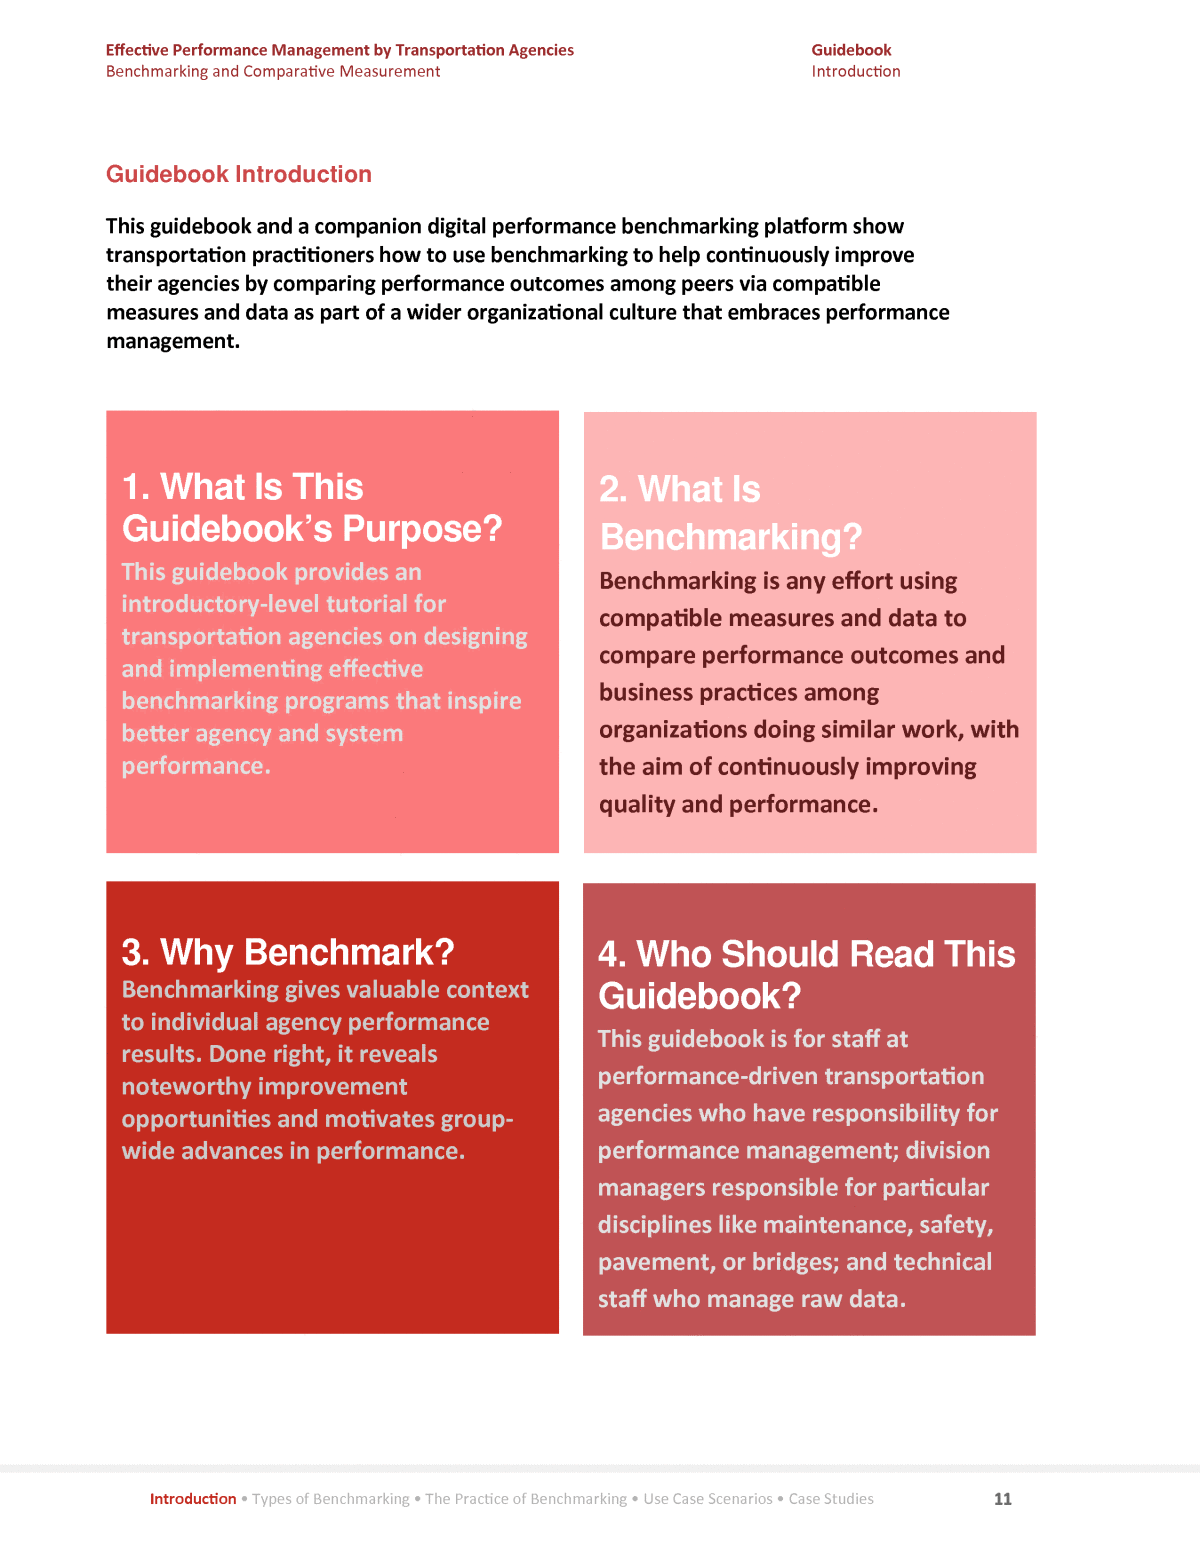
Effective Performance Management by Transportation Agencies Benchmarking and Comparative Measurement Introduction ⢠Types of Benchmarking ⢠The Practice of Benchmarking ⢠Use Case Scenarios ⢠Case Studies 11 Guidebook Introduction This guidebook and a companion digital performance benchmarking platform show transportation practitioners how to use benchmarking to help continuously improve their agencies by comparing performance outcomes among peers via compatible measures and data as part of a wider organizational culture that embraces performance management. 3. Why Benchmark? Benchmarking gives valuable context to individual agency performance results. Done right, it reveals noteworthy improvement opportunities and motivates group- wide advances in performance. 1. What Is This Guidebookâs Purpose? This guidebook provides an introductory-level tutorial for transportation agencies on designing and implementing effective benchmarking programs that inspire better agency and system performance. 2. What Is Benchmarking? Benchmarking is any effort using compatible measures and data to compare performance outcomes and business practices among organizations doing similar work, with the aim of continuously improving quality and performance. 4. Who Should Read This Guidebook? This guidebook is for staff at performance-driven transportation agencies who have responsibility for performance management; division managers responsible for particular disciplines like maintenance, safety, pavement, or bridges; and technical staff who manage raw data. Guidebook Introduction
Effective Performance Management by Transportation Agencies Guidebook Benchmarking and Comparative Measurement Introduction Introduction ⢠Types of Benchmarking ⢠The Practice of Benchmarking ⢠Use Case Scenarios ⢠Case Studies 12 1. What Is This Guidebookâs Purpose? An introductory-level tutorial on how to fuel stronger agency and system performance with benchmarking. This guidebook shows transportation professionals how to use benchmarking to help continuously improve their agencies. Benchmarking uses compatible measures and data to compare performance outcomes among peers as part of a wider organizational culture that embraces performance management. Although many transportation agencies have adopted performance management, few have accepted benchmarking as part of that culture, with the exception of occasional and informal reviews of performance relative to their peers. Agencies may avoid benchmarking because it is neither risk-free, simple, nor quick. Dissimilarities among some agencies means choice of peers is a critical success factor. Likewise, benchmarkers must select metrics carefully to ensure fair comparisons and access to reliable data. Lastly, using benchmarking to diagnose why some organizations perform better takes time and demands collaboration among peers. This guidebook provides insights on how peer organizations (agencies whose goals and characteristics are more similar than dissimilar) can work together to overcome the challenges of benchmarking with the right investments of time, effort, and resources to earn valuable insights and fuel stronger agency and system performance. The Transportation Comparative Benchmarking Platform is a web tool companion to this guidebook where agencies can find appropriate peers, compare performance across selected measures, and most importantly, connect with other practitioners to share what works for improvement (http://benchmarking.tpm-portal.com/).
Effective Performance Management by Transportation Agencies Guidebook Benchmarking and Comparative Measurement Introduction Introduction ⢠Types of Benchmarking ⢠The Practice of Benchmarking ⢠Use Case Scenarios ⢠Case Studies 13 2. What Is Benchmarking? A means to compare performance outcomes and business practices among peer organizations by using compatible measures and data with the intention of continuously improving agency and system performance. TCRP Report 141: A Methodology for Performance Measurement and Peer Comparison in the Public Transportation Industry defines benchmarking as âthe process of systematically seeking out [noteworthy] practices to emulate.â Benchmarking, the report continues, âis a tool used to provide insights, raise questions, and identify other organizations from which one may be able to learn and improve.â Thorough and fair benchmarking among organizations or across organizational units can yield opportunities to learn about the replicable practices, techniques, and approaches high-performing organizations use to contribute to their success. Benchmarking is used in both the public and private sectors. Benchmarking and Transportation Performance Management (TPM) This guidebook envisions benchmarking fitting within a wider culture of performance management embraced in many transportation agencies. The Federal Highway Administration (FHWA) defines TPM as âa strategic approach that uses system information to make investment and policy decisions to achieve national performance goals.â Many transportation agencies now have well-established performance management programs that use report cards, dashboards, key performance indicators, and similar techniques to gather, present, and analyze performance data as part of decision- making. Definition of Benchmarking from TCRP Report 141 âBenchmarking is the process of systematically seeking out [noteworthy] practices to emulate. A peer comparison provides an informative, but passive, starting point to a [benchmarking] analysis, [but ultimately, benchmarking involves] direct contact with other organizations, delves into the reasons for their success, and seeks to uncover transferable practices applicable to the organization performing the analysis.â
Effective Performance Management by Transportation Agencies Guidebook Benchmarking and Comparative Measurement Introduction Introduction ⢠Types of Benchmarking ⢠The Practice of Benchmarking ⢠Use Case Scenarios ⢠Case Studies Although the practice of performance management is not new to transportation agencies, recent federal rules that define national measures and regular performance target setting have increased attention on performance management. Standardization of measures at the national level also brings new opportunities for use of benchmarking as an integral part of TPM. An agency can implement performance management without benchmarking, but it offers a useful device in the toolbox to stimulate improvements and identify effective strategies for improving performance. Performance Data for Benchmarking Comparison of relevant and valid performance data is a prerequisite for successful benchmarking. In many instances, data gathered from states by entities like FHWA or the National Highway Traffic Safety Administration are publicly available and, with basic adaptation, can be used to support benchmarking (see sidebar). The Highway Performance Monitoring System (HPMS) is a national highway data set that includes information on the condition, use, and performance of highways across the United States. States submit HPMS data to FHWA annually. Because this data set is standardized, it provides a valuable source of comparable benchmarking data across states. The Fatality Analysis Reporting System (FARS) is a national census of traffic fatalities from across the United States administered by the National Highway Traffic Safety Administration. FARS data include information from police reports, death certificates, and medical reports. Data are reported annually. The National Bridge Inventory (NBI) is a database with information on the characteristics and condition of bridges over 20 feet in length on public roads across the country. The NBI is compiled from information submitted by state DOTs annually. The National Performance Management Research Data Set (NPMRDS) is a monthly archive of average travel times for 5-minute time slices throughout the day on highway sections making up the National Highway System and 25 Canadian and Mexican border crossings. Travel time data are broken into truck traffic, passenger traffic, and all traffic. NPMRDS is sourced from GPS probe data from a wide array of commercial vehicle fleets, connected cars, and mobile apps. Data from the U.S. Census can provide a wealth of demographic information for making benchmarking comparisons. Data include income levels, degree of urbanization, average age of population, household size, and automobile ownership. These data can be helpful in identifying benchmarking peer groups or providing context for comparing different entities. 14
Effective Performance Management by Transportation Agencies Benchmarking and Comparative Measurement Introduction ⢠Types of Benchmarking ⢠The Practice of Benchmarking ⢠Use Case Scenarios ⢠Case Studies 3. Why Benchmark? Benchmarking gives valuable context to individual agency performance results. Done right, it reveals noteworthy improvement opportunities and motivates group-wide advances in performance. Transportation agencies routinely use performance data to help solve management challenges. Many state DOT CEOs and their staff have a growing interest in learning from the performance of their peer agencies who have similar organizational goals and characteristics. Benchmarking offers a way for DOTs to broaden perspectives, inform their target setting process, and learn of noteworthy practices at high performing agencies to spur innovation. Gain Broader Perspectives Internal performance data provide useful insights on patterns and trends revealed by data on past performance, but benchmarking opens up new horizons for agencies that seek to gauge their performance in other ways, particularly by revealing areas of underperformance relative to other agencies. Benchmarking allows them to take advantage of lessons learned by others. Inform Performance Target Setting Transportation agencies routinely use target setting as part of performance management. Data about performance of peers provides a helpful frame of reference for agencies considering new target-setting techniques that can complement their other methods, such as use of expert judgment, analysis of past trends, or other data analytics techniques already in use. Uncover Noteworthy Practices The benchmarking process described in this guidebook uses data from peers to spotlight noteworthy practices found at agencies showing improved performance. In this way, benchmarking helps agencies improve their performance by riding on the shoulders of their peers, rather than being forced to âreinvent the wheelâ on their own. Focus on the Positive Benchmarking is not meant to penalize underperformers. When Virginia DOT began internal benchmarking (as described in Case Study 3), it instituted an award for districts that were on time, on budget, and meeting quality targets to focus on positive achievement. 15 Guidebook Introduction
Effective Performance Management by Transportation Agencies Guidebook Benchmarking and Comparative Measurement Introduction Introduction ⢠Types of Benchmarking ⢠The Practice of Benchmarking ⢠Use Case Scenarios ⢠Case Studies 16 Spur Innovation and Continuous Improvement The environment in which DOTs operate continuously changes in big and small ways, which demands agencies constantly seek out and implement innovative ideas that help sustain or improve their performance. Benchmarking is a practical methodology for helping deliver on the need for innovation. Support Transparency and Accountability Benchmarking can give agencies greater external transparency and accountability to elected officials, interested stakeholders, and the general public by providing factual evidence demonstrating how their performance compares to that of their peers. Value of Benchmarkingâ Imperial College, London Transit Benchmarking Center According to the Railway and Transport Strategy Centre at Imperial College, London, benchmarking is not simply a comparison of data or rankings. Benchmarking is useful because it compares key performance indicators in a structured fashion to accomplish the following: ⢠Stimulate productive âwhyâ questions; ⢠Identify lines of inquiry; ⢠Identify priority problems, strengths, or weaknesses; ⢠Identify and monitor trends and best practices; ⢠Motivate setting of challenging but achievable targets; and ⢠Support dialogue with stakeholders.
Effective Performance Management by Transportation Agencies Guidebook Benchmarking and Comparative Measurement Introduction Introduction ⢠Types of Benchmarking ⢠The Practice of Benchmarking ⢠Use Case Scenarios ⢠Case Studies 17 4. Who Should Read This Guidebook? The guidebook will benefit transportation agency staff with responsibility for performance management; division managers responsible for particular disciplines like maintenance, safety, pavement, or bridges; and technical staff who supply raw data. The guidebook can work as either a comprehensive tutorial or as a reference on particular aspects of benchmarking. Different users of the guidebook will find levels of detail most relevant to their needs. A user who wishes to learn about general aspects of benchmarking can read the opening sections of the document that discuss what benchmarking is and what types of benchmarking already exist. Users who wish to initiate a benchmarking process at their organization can read the section on the practice of benchmarking, which outlines a nine- step process, or the case studies, which discuss approaches to how existing organizations and networks have conducted benchmarking. Digital Benchmarking Platform The Transportation Comparative Benchmarking Platform (http://benchmarking.tpm-portal.com/) has been developed to complement this guide. This digital platform enables swift comparison of peer agency performance on predetermined measures. It provides an easy way to view performance for multiple transportation performance measures. It also supports comparing a given agencyâs performance against its peers, trend analysis of the same agencyâs performance over time, and peer trend analysis. Most importantly, it facilitates exchange of information among peers, because the intent of benchmarking is to learn and improve. To achieve this last objective, the platform features a space to share noteworthy practice narratives in which user agencies offer assessments of the factors contributing to their performance. The Noteworthy Practice Narratives feature is designed to provide a method for inquiry and sharing and to foster communication of practices and experiences among users.
Introduction ⢠Types of Benchmarking ⢠The Practice of Benchmarking ⢠Use Case Scenarios ⢠Case Studies 18 Types of Benchmarking Definitions of the benchmarking types covered in the guidebook
Effective Performance Management by Transportation Agencies Benchmarking and Comparative Measurement Introduction ⢠Types of Benchmarking ⢠The Practice of Benchmarking ⢠Use Case Scenarios ⢠Case Studies 19 Types of Benchmarking This guidebook focuses on two primary benchmarking approaches: independent benchmarking and network benchmarking. A brief overview of other forms of benchmarking is also provided. Readers can review this section to consider the type of benchmarking that will best suit their agencyâs needs. Whether conducting independent benchmarking or establishing a benchmarking network, a systematic and structured approach should be followed. Basic steps include selecting an area ripe for improvement, comparing data to identify a similar agency that performs better in the given performance area, discovering why it does better, and identifying possible ways to replicate the peer agencyâs performance. 1. Independent Benchmarking 2. Benchmarking Networks 3. Other Forms of Benchmarking Guidebook Types of Benchmarking
Effective Performance Management by Transportation Agencies Guidebook Benchmarking and Comparative Measurement Types of Benchmarking Introduction ⢠Types of Benchmarking ⢠The Practice of Benchmarking ⢠Use Case Scenarios ⢠Case Studies 20 1. Independent Benchmarking An individual agency undertakes independent benchmarking, typically by using readily available data on peer performance. An individual agency that undertakes independent benchmarking uses public data, contacts peer agencies to gather readily available information for comparisons, or undertakes both. The agency may also engage in follow-up discussions with one or more peers to identify noteworthy practices. Independent benchmarking can be set up quickly and cheaply because it uses readily available data. In general, independent benchmarking efforts occur on an ad hoc, one-time basis, as opposed to a sustained benchmarking process that continues over multiple years. Independent benchmarking offers several advantages: ⢠Low effort for agencies; ⢠Modest cost; ⢠Responsiveness to pressing management needs; ⢠Reliance on readily available data; and ⢠Flexible, ad hoc approach in addressing emerging concerns. Independent BenchmarkingâMassachusetts Port Authority The Massachusetts Port Authority (Massport) compares activity at Logan Airport in Boston to other airports in the New England region in its environmental data reports. Massport tracks comparative data from other commercial and general aviation airports in the region, such as the number of passengers who travel through each airport. These comparisons add context to Massportâs operations in terms of its environmental impact and its relative share of the regionâs air traffic. http://www.massport.com/logan-airport/about-logan/environmental-reports/
Effective Performance Management by Transportation Agencies Guidebook Benchmarking and Comparative Measurement Types of Benchmarking Introduction ⢠Types of Benchmarking ⢠The Practice of Benchmarking ⢠Use Case Scenarios ⢠Case Studies 21 2. Benchmarking Networks A benchmarking network is a group of organizations that benchmarks together. In a benchmarking network, members agree on a common set of measures, define how these measures will be calculated, and establish a reporting infrastructure so all members can access data for the common measures. A benchmarking network facilitates peer-to-peer discussions about how to achieve better performance. It builds tight connections within groups of peers, in part by using self-reported data from each participant and opening information-sharing channels for exchange of successful practices. Generally, a benchmarking network is more robustâbut much more resource-intensiveâthan an independent benchmarking effort. An external party often facilitates a benchmarking network. Facilitators promote formal benchmarking activities, but participants also benefit from the informal aspect of being part of a network. A benchmarking network provides a variety of advantages: ⢠Data and measures can be tailored to specific areas of concern; ⢠Information is confidential among participants, subject to Freedom of Information constraints of work performed in the public sector; ⢠Agencies may be motivated to remain engaged once in a network; ⢠Workload can be spread across multiple organizations; and ⢠Nuanced measures that go beyond public data can be developed. International BenchmarkingâFederal Aviation Administration Since 2009, the Federal Aviation Administration (FAA) has been collaborating on a benchmarking project with EUROCONTROL, the air traffic control authority of the European Union. This collaboration allows the two authorities to compare trends in aviation performance, including the effects of construction and increases in demand at key facilities. The FAA values international benchmarking because it allows the agency to compare the relative performance of its own air traffic control systems over time through changes in operating procedures, technology, and policy. Despite differences between the United States and Europe in traffic volume and operating conditions, the reports show convergence on common performance metrics can lead to data-driven comparisons between different regions of the world. https://www.faa.gov/about/office_org/headquarters_offices/ato/service_units/systemops/ato_intl/benchmarking/
Effective Performance Management by Transportation Agencies Guidebook Benchmarking and Comparative Measurement Types of Benchmarking Introduction ⢠Types of Benchmarking ⢠The Practice of Benchmarking ⢠Use Case Scenarios ⢠Case Studies 22 3. Other Forms of Benchmarking This guidebook focuses on independent benchmarking or using a benchmarking network; however, other forms of benchmarking may be useful to an agency. Internal Benchmarking Internal benchmarking takes place when an agency benchmarks against itself, either by comparing its own performance over time or by comparing the performance of individual work units such as divisions, districts, or regions. In either case, the purpose of the comparison is to identify improvement opportunities. Virginia DOT (VDOT), for example, uses an internal benchmarking process to assess relative progress toward performance goals among its nine geographic districts, as described in Case Study 3. The districts regularly compile data used to update a statewide performance dashboard. The dashboard reports to the public how VDOT is performing relative to its goals. Internally, VDOT uses the data from individual districts to set priorities, focus on problem areas, and facilitate the sharing of best practices among districts. The Virginia example illustrates use of internal benchmarking within a broader performance management framework. Cross-Industry Benchmarking Cross-industry benchmarking expands the comparison of performance and identification of noteworthy practices beyond peer agencies in the same sector to outside industries. This type of effort focuses on processes that are not specific to a particular industry, such as comparison of employee satisfaction levels, percentage of failed recruitments, turnover rates, personal computer replacement cycles, square footage of office space per employee, or the percentage of vehicle fleet out of service. Third-Party Benchmarking Third-party benchmarking involves a comparison of multiple organizations by a third- party organization without active participation from the subject organizations. Several third- party organizations produce annual or periodic reports with comparative performance metrics by state and/or urban area. In almost all cases, these organizations use publicly available federal data to compare agencies. Each organization has a different approach to data presentation consistent with the priorities of its members. Third-party benchmarking reports are widely quoted in the media and receive attention from transportation agency executives.
Effective Performance Management by Transportation Agencies Guidebook Benchmarking and Comparative Measurement Types of Benchmarking I ntroduction ⢠Types of Benchmarking ⢠The Practice of Benchmarking ⢠Use Case Scenarios ⢠Case Studies 23 Informal Benchmarking Nearly every organization benchmarks informally to some extent. When someone observes that peers may be obtaining results that appear to be superior to the results his or her group is achieving, it is natural to ask, âWhy is this so?â When an agencyâs director learns of another agencyâs performance gains, perhaps after introducing a new technology, it will naturally lead to questions such as âShould my agency implement that technology?â By observing successful groups or talking to individuals, practitioners can often gather information to help improve their groupâs performance. Informal benchmarking can be triggered by something as simple as reading an article highlighting the success of another agencyâs new endeavor. Technical conferences that feature expert panel discussion sessions and individual presentations often spark peer exchanges that lead to informal benchmarking opportunities. Third-party benchmarkingâTRIP: A National Transportation Research Group TRIP is a private, nonprofit organization that researches, evaluates, and distributes economic and technical data on surface transportation issues. TRIP is sponsored by insurance companies, equipment manufacturers, distributors and suppliers, businesses involved in highway and transit engineering and construction, labor unions, and other organizations. TRIP produces an annual National Rural Roads report with data from HPMS, FARS, and the NBI, on pavement condition, bridge condition, and fatality rates. http://www.tripnet.org/
Introduction ⢠Types of Benchmarking ⢠The Practice of Benchmarking ⢠Use Case Scenarios ⢠Case Studies 24 The Practice of Benchmarking A step-by-step guide to the practice of benchmarking
Effective Performance Management by Transportation Agencies Guidebook Benchmarking and Comparative Measurement The Practice of Benchmarking Introduction ⢠Types of Benchmarking ⢠The Practice of Benchmarking ⢠Use Case Scenarios ⢠Case Studies 25 The Practice of Benchmarking The benchmarking process starts by establishing a clear focus. It then mobilizes participants, defines measures and measurement approaches, and collects and analyzes data. The final step is learning from the results. Although this chapter depicts a formal step-by-step benchmarking process, it is flexible enough to be adjusted; the steps can be rearranged or scaled back as needed. In particular, Step 2 and Step 3 may be reversed. The two post-benchmarking steps will help agencies achieve a robust and long-term path to improvement. Step 1. Set the Stage Step 2. Select Peer Agencies Step 3. Define the Approach Step 4. Obtain Data Step 5. Analyze Data Step 6. Identify Noteworthy Step 7. Communicate Results Post-Benchmarking Step 8. Recommend Post-Benchmarking Step 9. Repeat the Practices Improvements Process
Effective Performance Management by Transportation Agencies Guidebook Benchmarking and Comparative Measurement The Practice of Benchmarking Introduction ⢠Types of Benchmarking ⢠The Practice of Benchmarking ⢠Use Case Scenarios ⢠Case Studies 26 Step 1 Set the Stage Mobilize for a benchmarking initiative by identifying a benchmarking performance area, assembling a team, and selecting a leader. Greater success can be achieved later in the process by clarifying objectives, establishing ground rules, and getting buy-in from around the agency. Identify Performance Benchmarking Area(s) Benchmarking should start with selecting the desired area(s) for improvement. In many cases this choice will be obvious, as a desire to improve in a particular area is often what prompts a benchmarking initiative. In other cases, the exact performance area may not be prescribed, and agency staff leading the effort must come to agreement. If this is an agencyâs first experience with benchmarking, look for an easy win where data are available and clear opportunities for improvement exist. Once an agency gains experience with benchmarking, the team will be prepared to pursue more challenging areas. Assemble a Benchmarking Team Although independent benchmarking can be undertaken by a single person interested in a topic, forming a team to guide benchmarking helps ensure appropriate expertise is available and maximizes the impacts of benchmarking results at the agency. Technical experts who understand the performance area to be addressed and the data to be compiled are helpful additions to a team, as these individuals can identify important nuances and foresee obstacles performance generalists may miss. Also valuable are individuals who can develop and implement the improvements learned from benchmarking. Every team member does not necessarily need to devote significant amounts of time to the benchmarking effort, but each should be sufficiently involved to share in the ownership of decisions, results, and recommendations.
Effective Performance Management by Transportation Agencies Guidebook Benchmarking and Comparative Measurement The Practice of Benchmarking Introduction ⢠Types of Benchmarking ⢠The Practice of Benchmarking ⢠Use Case Scenarios ⢠Case Studies 27 Select a Benchmarking Team Leader Successful benchmarking requires a leader who can commit time to organizing the initiative, building relationships (both with those providing data and those who will use the results), and leveraging practices from performance management and change management. Benchmarking networks often use an external paid facilitator who typically fills the following roles: ⢠Assists with data collection; ⢠Organizes meetings and conferences; ⢠Prepares and presents comparative performance data through a website, reports, or presentations; ⢠Collects and disseminates information about noteworthy practices; and ⢠Coordinates member-directed research activities and may directly support research, such as by administering surveys. It is not typically the benchmarking network facilitatorâs role to provide subject matter expertise. Rather, the facilitator supports a process of collaborative mutual improvement as a curator who helps sort through data and the extensive information available on successful practices. Clarify Objectives for Benchmarking Benchmarking should begin with a clear statement of purpose: ⢠What is the impetus for this initiative? ⢠Who will use the information and how? ⢠What do we hope to accomplish? ⢠What effort will be required, and what is the likely pay-off? Agency personnel already have full day-to-day job duties, so the benefits team members and their agency will gain by undertaking benchmarking must be communicated clearly. Establish Ground Rules Ground rules for benchmarking can help address concerns that arise when performance is being evaluated and compared. Ground rules should state that benchmarking seeks to drive improvement, not assign blame; sensitive data will be kept within the group; any data assembled will be subject to a review before release; and caveats will be made clear when findings are shared. The team leader plays an important role in negotiating the ground rules. Benchmarking may require staff to spend time away from other responsibilities, so the leader will play a key role in ensuring efficient use of team membersâ time by scheduling meetings in advance, defining clear objectives for each meeting, identifying the duration and frequency of meetings, and making sure priorities are agreed upon.
Effective Performance Management by Transportation Agencies Guidebook Benchmarking and Comparative Measurement The Practice of Benchmarking Introduction ⢠Types of Benchmarking ⢠The Practice of Benchmarking ⢠Use Case Scenarios ⢠Case Studies 28 Step 2 Select Peer Agencies Once an organization decides to benchmark, it must choose agencies to use as comparisons. Similarity criteria on relevant characteristics can aid in this process. Criteria for Peers Using public data is a convenient starting point for benchmarking, but potential peers to benchmark against will be limited to agencies for which this data is also already publicly available. Benchmarking that will entail acquisition of nonpublic data from participants opens up the universe of possible peers and will require identification of suitable peer agencies based on agency characteristics and similarity criteria. General criteria for suitable peers include ⢠Location and climate (e.g., census regions, AASHTO regions, HPMS climate zone data field); ⢠Agency characteristics (e.g., number of full-time employees, annual operating budget, annual capital budget); ⢠Service area socioeconomic characteristics (e.g., population, population density, jobs, gross domestic product, primary industries, growth rate); ⢠System and service characteristics (e.g., lane miles of urban and rural highway, number of bridges, fleet size, route miles); and ⢠Travel demand and usage characteristics (e.g., VMT, transit mode share). Other criteria may be considered based on the performance area of interest. For example, a safety benchmarking effort initiated by a DOT responsible for motor vehicle and motor carrier registration would want to focus its benchmarking effort on DOTs that have these responsibilities. In some cases, legislative or institutional factors may be important to consider: states with right to work laws might be grouped together, or states that have passed seat belt laws. A general rule is to cast a broad net when identifying peers for benchmarking. There will always be differences across agencies, and a larger pool provides more potential agencies from which to learn, as long as enough background information on agency characteristics is available to support interpretation of results. Selecting Peer AgenciesâTransit Benchmarking in Texas A 2011 report by the Texas Transportation Institute (TTI) examines performance benchmarks and strategies used by peer agencies to help transit agencies in rural and small urban areas maximize the efficiency and effectiveness of their services. Attributes for choosing peer agencies used by TTI included population density, percentage of disabled people, percentage of households without a car, percentage of seniors, income level, and proximity to a metropolitan area.
Effective Performance Management by Transportation Agencies Guidebook Benchmarking and Comparative Measurement The Practice of Benchmarking Introduction ⢠Types of Benchmarking ⢠The Practice of Benchmarking ⢠Use Case Scenarios ⢠Case Studies 29 Step 3 Define the Approach Choose one or more measures related to the selected performance area that are suited to comparing performance among agencies or groups and come to an agreement on relevant details and definitions. Choose and Define Measures Benchmarking requires selecting one or more measures to compare performance among agencies or groups in the chosen focus area. Measures must be meaningful to the benchmarking participants and influenced by factors under the agencyâs or groupâs control. Ideally they will be established measures, but other suggestions for crafting measures include the following: Multiple measuresâConsider using several measures to get a more complete picture of performance. For example, in benchmarking project delivery, both on-time and on-budget delivery measures might be useful. For benchmarking pavement management, measures of smoothness and structural condition might be helpful. Normalized measuresâNormalizing performance dataâadjusting data that start in different scales or units into comparable scales or unitsâhelps make meaningful comparisons among nonidentical agencies. Using the correct denominator to normalize data is important because identical performance data that are normalized with different denominators can indicate different relative performance outcomes among peers. The Tri-State Partnership between transportation agencies in Maine, New Hampshire, and Vermont described in Case Study 2 sought a common metric for benchmarking their safety performance. The states chose highway fatalities and incapacitating injuries as their common metric, but because the data track absolute values rather than rates, the states chose to normalize the data by using the industry standard comparing the number of deaths and incapacitating injuries per 100 million vehicle miles traveled (VMT). Normalizing the data in this way allowed the states to account for differences in VMT. Limited-scope measuresâConsider limiting the scope of measures or segmenting measures to account for variation. For example, separate measures could be calculated for urban and rural highway facilities (for safety and congestion-related measures) or for asphalt and concrete pavements (for pavement smoothness measures). In other cases, the measure may be limited to certain functional classes (e.g., Interstates only) or types of projects. Defined measuresâPrecise definitions reduce the risk of benchmarking apples against oranges. Definitions must establish consistency in ⢠What will be measured (e.g., projects, bridges, employees), ⢠Measurement methods,
Effective Performance Management by Transportation Agencies Guidebook Benchmarking and Comparative Measurement The Practice of Benchmarking Introduction ⢠Types of Benchmarking ⢠The Practice of Benchmarking ⢠Use Case Scenarios ⢠Case Studies 30 ⢠Measures calculation methods, and ⢠Scope of measurement. For example, if the measure is âpercentage of projects completed on time,â definitions might address the following: ⢠What is considered a project? ⢠What types of projects are included? ⢠When is a project considered complete? ⢠How is the baseline set for planned completion dates? ⢠What does âon timeâ mean? (For example, is a project completed 1 day after the planned completion date considered on time?) In a benchmarking network, members can discuss the details of each measure and seek agreement on definitions that minimize the need to recollect or reprocess data. Defining measures is not an easy task when membersâ characteristics vary substantially. Compromise and acceptance of a degree of inconsistency are acceptable, as long as everyone has a good understanding of all terms. Monitor Variables That Explain Performance Once performance measures are set, make a plan to monitor supplemental variables that may affect performance results. For example, if an âon-time project deliveryâ performance measure is chosen, explanatory variables could include project cost and type of project contract (e.g., designâbuild versus designâ bidâbuild). If a âpavement performanceâ measure is chosen, explanatory variables could include location (e.g., rural versus urban), truck traffic volume, pavement type, or pavement age. The benchmarking team can brainstorm a list of variables to monitor by asking, âWhat else would we want to know to understand performance results?â Identify Data Sources Identify performance data sources in conjunction with choosing performance measures and explanatory variables. For independent benchmarking, data sources may include publicly available data, data from established agency systems, or data requested from other agencies. Benchmarking network members may wish to pool their resources to collect and compile data through a single effort to provide consistency and maximize efficiency. Plan to collect data on both performance and explanatory variables for the most robust results. Normalizing DataâNineSquared When possible, avoid measures based on absolute numbers (e.g., number of fatalities). Use percentages or ratios instead to normalize these raw values (e.g., fatalities per million VMT). Another approach is to use measures that capture trends (e.g., percentage change in fatalities). NineSquared, an Australian consulting firm, compares transit fares from cities around the world. Because each city they study has different wage levels, currencies, and costs of living, NineSquared makes meaningful comparisons between cities by normalizing fare data in terms of the minutes of work required at that cityâs minimum wage to afford a return trip on the transit system.
Effective Performance Management by Transportation Agencies Guidebook Benchmarking and Comparative Measurement The Practice of Benchmarking Introduction ⢠Types of Benchmarking ⢠The Practice of Benchmarking ⢠Use Case Scenarios ⢠Case Studies 31 Step 4 Obtain Data Effective benchmarking depends on access to quality data. National Data Sources Depending on the metrics selected in previous steps, data may be easily obtainable from national data sources. FHWAâs Highway Statistics series, for example, includes an array of performance information on highway infrastructure conditions, funding, operations, and safety. Other national data sources suitable for benchmarking include the National Bridge Inventory (NBI), the Fatality Analysis Reporting System (FARS), and the National Transit Database. National data sources are used most frequently for independent benchmarking efforts, but they can supplement data from peers (described below) when a benchmarking network approach is used. Data from Peers Gathering data from peer agencies as part of a benchmarking network or an independent benchmarking effort can provide more targeted and relevant information than is available from national and public sources. However, participants must be willing to commit the time and effort this type of data gathering requires. New data-gathering efforts take time to establish, and the benchmarking team is liable to go through one or more learning cycles before they produce high-quality results. Strategies for collecting peer data include the following: ⢠Paying a facilitator to collect membersâ dataâThis approach is used by the National Water and Wastewater Benchmarking Initiative (NWWBI) described in Case Study 1. NWWBI staff are funded by the benchmarking collective to collect data for new member utilities for their first three years of participation. After this initial period, members may elect to have the facilitator continue to collect data for them for a fee. This practice ensures complete and consistent data for all members. ⢠Relying on members to submit data or complete a surveyâThis approach requires accepting that data may be incomplete and sometimes unreliable. It is most workable when someone takes responsibility for follow-up to make sure that data are complete and consistent. Data SourcesâFlorida Transit Information System The Florida Transit Information System (FTIS) relies primarily on the National Transit Database, which is a repository for financial and operational data for all transit operators receiving federal funds. Although this approach is easier than collecting raw data from participants, it is not a fully automated process. A significant amount of data cleaning can be needed to ensure the accuracy and compatibility of data from one year to the next. This process is estimated to take an experienced FTIS staff member familiar with the tool and data 100 hours to complete.
Effective Performance Management by Transportation Agencies Guidebook Benchmarking and Comparative Measurement The Practice of Benchmarking Introduction ⢠Types of Benchmarking ⢠The Practice of Benchmarking ⢠Use Case Scenarios ⢠Case Studies 32 Step 5 Analyze Data Data cleaning is almost always required before the data can be analyzed. Data Cleaning If the benchmarking effort involves collecting new data, a formal quality assurance and quality control approach will help pinpoint any patterns of incorrect data and will aid in avoiding such issues in the future. Standard quality checks to consider include ⢠Missing records (e.g., total mileage does not account for the whole network), ⢠Missing required data elements, ⢠Data values out of the valid range, ⢠Data values not conforming to standard categories (coded items), and ⢠Data records not meeting business rules or validity criteria. In addition to having possible errors, the data may need to be standardized for appropriate comparisons across participants. Providing a standardized template for participants to complete, along with agreed-upon units and definitions, can help this process. Statistical Significance Be mindful of sample sizes prior to drawing conclusions about performance, particularly when data are segmented to control for different variables. If only a few observations underpin a performance result, the data may not be statistically significant and may need to be aggregated further to obtain acceptable results. Data Exploration Once data are cleaned, an agency should compare the values of selected benchmark measures against peersâ values. Visuals such as charts, maps, and graphs are more conducive to exploration and comparison than simple tables. Include data on explanatory variables to provide a picture of any important correlations, which will be helpful when assessing potential improvements. When analyzing information and developing visuals, ask what variation in the data is most informative, and select visuals and analyses suited to that situation. Trend over time? Use a basic line chart. Geographic patterns? There are a variety of map types to choose from. Single-value comparison among many agencies? Bar charts show this kind of variation best. Keep explanatory variable data less visually obvious so they do not distract from the primary data. Comparing data is an important milestone in the benchmarking process, but it is not the end. Further analysis, research, and discussion will reveal why some agencies perform better than others and will help identify how an agency might improve performance.
Effective Performance Management by Transportation Agencies Guidebook Benchmarking and Comparative Measurement The Practice of Benchmarking Introduction ⢠Types of Benchmarking ⢠The Practice of Benchmarking ⢠Use Case Scenarios ⢠Case Studies 33 Step 6 Identify Noteworthy Practices Data analysis should lead to conversations with top-performing agencies about the ways they achieve results. Noteworthy Practices Exchange Analysis of performance data should inspire questions and lead to seeking out new information from peer agencies. The means of this information exchange can be as informal or structured as the participants wish and may include any of the following: ⢠Informal phone calls or email exchanges with colleagues, ⢠Research and reports on external practices and tools, ⢠Conference calls with structured agendas during which one or more participants present their work, ⢠Interviews with high-performing peers, ⢠Topic area taskforces, or ⢠In-person meetings and workshops. Ideally, a facilitator or someone in a facilitatorâs role would provide the structure and take care of logistics for these activities. Having content organized and ready to discuss will help maximize everyoneâs time. Particular practices that might be shared in these interactions can include any of the following: ⢠Organizational structure and roles, ⢠Levels and types of investments over time for particular activities, ⢠Data collection efforts, ⢠Business processes, ⢠Management monitoring and reporting processes, ⢠Contracting terms and methods, ⢠Use of external service providers or vendors, ⢠Implementation of tools and technologies, ⢠Employee development and training, ⢠Communication and collaboration, and ⢠Activities implemented in response to external legislation or other mandates. Having top performers share the practices that led to their success is a great place to start. Equally helpful is allowing other participants to ask questions or presenting an endeavor that did not succeed.
Effective Performance Management by Transportation Agencies Guidebook Benchmarking and Comparative Measurement The Practice of Benchmarking Introduction ⢠Types of Benchmarking ⢠The Practice of Benchmarking ⢠Use Case Scenarios ⢠Case Studies 34 Step 7 Communicate Results Use succinct communication suited to the technical understanding of the audience to inform executive management, affected staff, or outside stakeholders about the findings and recommendations of the benchmarking effort. Effective Communications Communicating the findings and recommendations of the benchmarking effort to executive management or other stakeholders who may be affected by the recommended changes and process improvements is a vital step in the benchmarking process. Convincing executive management about the merits of the recommendations may require demonstrating the validity of changes if they are significant. The team should expect to work closely with internal process improvement teams, as paradigms are not easy to change and extensive effort may already be invested in investigating processes. The team must be prepared to respond to concerns raised at this stage about the benchmarking effort. Ideally, these concerns would have surfaced during the first two steps of the process. If so, the team should have already prepared material to address the concerns, to clearly define the issue at hand, and then discuss how the issue is fundamentally resolved. Communicating the pivotal role benchmarking played in obtaining insightful findings builds awareness and comfort with the value of benchmarking. Stories in department newsletters, presentations at various types of internal and external gatherings, and social media messaging can effectively communicate the value that benchmarking has provided. Presenting Benchmarking Results âThe American Society of Civil Engineers The American Society of Civil Engineers issues an annual assessment of Americaâs dams, aviation, bridges, ports, rail, and other infrastructure. To make their findings easily readable for the general public, they assign grades to each element. An A means exceptional and fit for the future, a B means good or adequate for now, a C means mediocre and requires attention, a D means poor and at risk, and an F means the element is failing or critical and is unfit for its purpose. Grades are instantly recognizable to a wide audience, making assessments easy to understand. https://www.infrastructurereportcard.org/
Effective Performance Management by Transportation Agencies Guidebook Benchmarking and Comparative Measurement The Practice of Benchmarking Introduction ⢠Types of Benchmarking ⢠The Practice of Benchmarking ⢠Use Case Scenarios ⢠Case Studies 35 Post-Benchmarking Activities Many agencies may wish to use findings as part of their ongoing internal process improvement activities. The remaining steps describe how post-benchmarking activities can be used to follow through on what was learned during benchmarking. Step 1. Set the Stage Step 2. Select Peer Agencies Step 3. Define the Approach Step 4. Obtain Data Step 5. Analyze Data Step 6. Identify Noteworthy Step 7. Communicate Results Post-Benchmarking Step 8. Recommend Post-Benchmarking Step 9. Repeat the Practices Improvements Process
Effective Performance Management by Transportation Agencies Guidebook Benchmarking and Comparative Measurement The Practice of Benchmarking Introduction ⢠Types of Benchmarking ⢠The Practice of Benchmarking ⢠Use Case Scenarios ⢠Case Studies 36 Post-Benchmarking: Step 8 Recommend Improvements The benchmarking team can discuss the applicability of noteworthy practices with agency decision makers and identify process improvements learned from the benchmarking effort that could result in performance gains. Achieving Performance Gains Through the use of data analysis and noteworthy practices review, a benchmarking team will assemble a set of relevant and evidence-based strategies for making improvements. These strategies and recommendations should be summarized in a document designed for the knowledge and predilections of the intended audience. In particular, recommendations should be communicated in ways that make a strong and persuasive case for action. Broad benchmarking-based recommendations should be backed up with specific support actions that can be implemented as part of process improvement efforts. For instance, a recommendation to adopt a level-of-service (LOS) system for improving agency maintenance activities would likely require detailed supporting actions to ensure that the main LOS system can be achieved. The team should seek to identify an entire scenario, providing recommendations in the greatest detail possible of what will be required. Ideally, the value produced by implementing each recommendation should be identified, along with its cost, an assessment of the relative degree of difficulty or risk of implementation, and an estimate of the time required. This information could be combined to form a scoring matrix for value, cost, degree of difficulty, risk, and time needed. The team would score the recommendations and rank them in order of the most significant value to the agency. For challenging recommendations, interim steps can provide a temporary bridge until permanent solutions can be fully implemented. In the previous LOS example, the recommendation could include implementing either an in-house or a commercial maintenance management system. Either option would likely take years to implement. In the interim, spreadsheets or inexpensive databases could be used to track the LOS effort and allow the recommendation to move forward.
Effective Performance Management by Transportation Agencies Guidebook Benchmarking and Comparative Measurement The Practice of Benchmarking Introduction ⢠Types of Benchmarking ⢠The Practice of Benchmarking ⢠Use Case Scenarios ⢠Case Studies 37 Post-Benchmarking: Step 9 Repeat the Process Benchmarking can be a continuous improvement process. Repeating the benchmarking process will produce more insights and will build stakeholder acceptance of recommendations. Using Benchmarking Using benchmarking as an integral part of an agencyâs performance management and process improvement program will yield the greatest benefits. The process of integrating new practices throughout an organization to improve performance can continue indefinitely, as exemplified by agencies that have been participating in benchmarking for decades. An organization may revisit results and reflect on its processes multiple times before an effect can be observed on the ground or in the data. Benchmarking should also be repeated regularly to keep up with best practices, which agencies too often experience as a moving target. This necessity is especially true for areas in which changes in technology could significantly affect efficiency and effectiveness. As an example, pavement data collection technology has continuously evolved at an impressive pace for the past 20 years. The most recent data capture technology enhancements, generally described as moving from 2D capabilities to 3D capabilities, provide for significant enhancement and refinement in data capture. These data capture enhancements and new automated data distress analysis capabilities make any older data less functional and less useful for analysis and prediction than newer data. Benchmarking Time Framesâ The Longer, the Better According to the Railway and Transport Strategy Centre of Imperial College, London, one-time benchmarking studies are typically not successful because several iterative cycles and ongoing work are required to achieve comparability. Similarly, over time the National Water and Wastewater Benchmarking Initiative (described in Case Study 1) has refined and streamlined its selection of indicators and methods of data collection, and its participants report that the process improves every year.
Effective Performance Management by Transportation Agencies Guidebook Benchmarking and Comparative Measurement The Practice of Benchmarking Introduction ⢠Types of Benchmarking ⢠The Practice of Benchmarking ⢠Use Case Scenarios ⢠Case Studies 38 Elements for Successful Benchmarking In addition to the nine basic steps, several overarching principles help determine the outcomes of benchmarking efforts. The following five elements are key aspects of any successful benchmarking initiative. Leadership Two aspects of leadership are key to benchmarking efforts. The first aspect is simply the presence of a benchmarking leader who manages the effort and ensures all steps are executed in ways that engage team members and generate desired products from each step. The second aspect is getting the support of agency leadership for the benchmarking effort. This support will help the benchmarking team stay focused, overcome barriers, make meaningful progress, and implement recommendations. Comparable Performance Metrics Benchmarking requires using comparable performance metrics among peer agencies. To have a measure that works for all participating agencies, compromises may be needed to allow comparability. Each agency has unique qualities, but transportation agencies also have a lot in common, and common metrics, although not perfect, should be used for making comparisons whenever possible. For transportation agencies, Moving Ahead for Progress in the 21st Century Act (MAP-21) and Fixing Americaâs Surface Transportation Act (FAST Act) legislation and resulting regulations provide specific performance metric requirements that will support benchmarking going forward. These new sets of standardized metrics will provide a sound basis for comparing performance and sharing practices for several core DOT functions. Appropriate Peer Groupings Data on other agenciesâ characteristics can help determine which agencies are suitable peers to benchmark against. Relevant characteristics for peer groupings vary by performance measure. For example, for on- time, on-budget project delivery, data on total program size or average project size may be of most relevance, while for safety, peers with similar degrees of urbanization or population density are most suitable. NCHRP Report 20-24(37)F lists data sources that can be used to identify peers across multiple performance areas. Although data-driven peer selection is a good practice, when benchmarking on a niche or emerging topic, data may not be available for guiding the selection of the ideal peer agency. It may simply come down to finding agencies that have the necessary program or data to
Effective Performance Management by Transportation Agencies Guidebook Benchmarking and Comparative Measurement The Practice of Benchmarking Introduction ⢠Types of Benchmarking ⢠The Practice of Benchmarking ⢠Use Case Scenarios ⢠Case Studies 39 compare performance. In these situations, careful research and talking with subject area experts can help guide selection of the most appropriate peers. Relevant and Accurate Data Demonstrating the value and credibility of benchmarking demands relevant and reliable data. Data must enable calculation of comparable performance metrics and must provide the necessary analytical context for interpreting and understanding results. Benchmarking typically requires a focus on data quality assurance. An initial benchmarking effort will typically begin with an evaluation of existing data, which provides a baseline for data improvement. Commitment to Continuous Improvement Benchmarking is most valuable as part of a wider organizational continuous improvement process. Benchmarking objectives and measures can be fine-tuned to support organizational improvement efforts.
The Practice of Benchmarking ⢠Use Case Scenarios Effective Performance Management by Transportation Agencies Benchmarking and Comparative Measurement Introduction ⢠Types of Benchmarking ⢠⢠Case Studies 40 Use Case Scenarios Five hypothetical examples of how agencies can implement benchmarking processes Guidebook Use Case Scenarios
Effective Performance Management by Transportation Agencies Benchmarking and Comparative Measurement Introduction ⢠Types of Benchmarking ⢠The Practice of Benchmarking ⢠Use Case Scenarios ⢠Case Studies 41 Use Case Scenarios Different agencies will benchmark in different ways depending on their needs. These five hypothetical examples of the benchmarking process can help readers imagine how benchmarking might be applicable in their organization. Example 1. Comparing DOTs Example 2. Comparing Divisions within a DOT Example 3. FHWA Assisting DOTs Example 4. Building a Benchmarking Example 5. Estimating Realistic Process Network Durations Guidebook Use Case Scenarios
Effective Performance Management by Transportation Agencies Guidebook Benchmarking and Comparative Measurement Use Case Scenarios Introduction ⢠Types of Benchmarking ⢠The Practice of Benchmarking ⢠Use Case Scenarios ⢠Case Studies 42 Example 1 Comparing DOTs A bridge division manager at a state DOT seeks to make the condition of the bridges in her state âbest in class.â She decides to benchmark her agencyâs performance against that of similar agencies. Her agency has not previously embarked on a bridge benchmarking project. Here are the steps she might follow: 1. The manager is concerned that progress on improving the condition of the bridges her department oversees is not advancing as fast as it could be. She asks division engineers and bridge maintenance staff from her department to join her on a benchmarking team. 2. The manager chooses performance measures relevant to her goals. She is mainly concerned about minimizing the percentage of bridge deck area that is classified as structurally deficient. She also wants to minimize bridge life cycle costs to avoid costly reconstructions. 3. She selects five peer agencies that have similar characteristics. She looks for states with a similar climate, comparable lane mileage, and a similar mix of rural and urban land area. 4. The manager and her team collect and analyze National Bridge Inventory (NBI) data from the five states and compare their DOTâs performance to the performance of peer agencies. They also consider approaches to measuring performance on bridges that are not part of the NBI. 5. The benchmarking team interviews bridge division managers at the three top- performing agencies to ask what approaches they have taken to bridge maintenance and life cycle planning. 6. The bridge division manager meets with division engineers and maintenance staff to discuss how best practices from high- performing peers might be adapted to their state. 7. Over time, the manager continues to monitor the same performance indicators to assess how well the new processes are working. The manager benchmarks the performance of her agency against peer agencies over multiple years to continue to improve over time.
Effective Performance Management by Transportation Agencies Guidebook Benchmarking and Comparative Measurement Use Case Scenarios Introduction ⢠Types of Benchmarking ⢠The Practice of Benchmarking ⢠Use Case Scenarios ⢠Case Studies 43 Example 2 Comparing Divisions within a DOT The head of a district within a state DOT wishes to use internal benchmarking to compare the performance of his district to other districts at the DOT. His state has not previously undertaken internal benchmarking. Here are the steps he might take: 1. The district engineer is concerned that construction projects in his district are more delayed or over budget than those of other districts. The district engineer asks his peers at the other districts to meet to discuss how they might compare data to improve performance and share best practices. 2. The district engineer and his peers decide on common measures to compare their relative performance. They decide to track how many construction projects they advertise per month, how many of those projects stay within the budget set by the department, and how many are completed on time. The districts might develop new performance metrics that could allow for more informative comparisons, such as how many of the projects exceed their budget by 10% or more or how many projects exceed their timeline by 30 days or more. 3. The district engineers set a schedule to meet every quarter and compare data and share best practices. Meeting regularly allows each district time to refine their practices for gathering data. By comparing the same performance metrics repeatedly over time, they can see which metrics are most useful, and they can add and subtract metrics as needed. They might also alter their meeting frequency depending on how much changes between meetings. 4. The district engineers use regular meetings as an opportunity to report back to one another on how well best practices work in their districts. They can also use the data they generate through their benchmarking process to make presentations to their stakeholders. Depending on the data and the goals of the districts, the group could aggregate the data and include it on a public website to demonstrate how they are using taxpayer dollars, or they could present data to the state legislature to show how the agency is currently using its funding in order to make a case for what the agency could do with additional funding.
Effective Performance Management by Transportation Agencies Benchmarking and Comparative Measurement Introduction ⢠Types of Benchmarking ⢠The Practice of Benchmarking ⢠Use Case Scenarios ⢠Case Studies 44 Example 3 FHWA Assisting DOTs An FHWA staffer wishes to assist state DOTs in reducing highway fatalities. Extensive data exist on this topic, but the staffer wishes to translate the data into actionable steps state DOTs could take. Here are steps she might follow: 1. The staffer knows some states perform better than others in reducing highway fatalities, and she is concerned that state DOTs do not know what practices to adopt to address the gap. 2. Based on MAP-21 performance measures and in consultation with colleagues and state DOT safety staff, she recommends which metrics are best for comparing highway fatalities, such as the 5-year rolling average normalized over a specified VMT. 3. She assembles and analyzes existing federal safety data, such as FARS. This review gives her an initial picture of how states compare using standardized reporting methods. 4. The staffer then identifies and contacts existing benchmarking organizations that have addressed similar issues, such as the Tri-State Partnership between the DOTs in Maine, New Hampshire, and Vermont described in Case Study 2. She reviews their reports and interviews officials who have been involved in existing benchmarking efforts. These reports and interviews can add more depth to the initial picture formed from federal data. 5. She uses the information gained from federal data and from existing benchmarking initiatives to develop a set of best practices for state DOTs to use in benchmarking their own efforts to reduce highway fatalities. She could also provide state DOTs with guidance on new benchmarking initiatives to undertake with comparable states based on the examples of existing partnerships. She establishes regular meetings with benchmarking partnerships so she can continue to update state DOTs on new best practices. Guidebook Use Case Scenarios
Effective Performance Management by Transportation Agencies Guidebook Benchmarking and Comparative Measurement Use Case Scenarios Introduction ⢠Types of Benchmarking ⢠The Practice of Benchmarking ⢠Use Case Scenarios ⢠Case Studies 45 Example 4 Building a Benchmarking Network A state DOT staffer is responsible for highway freight mobility in her state. Because so much freight moves across state lines and because delays in one state can affect shipping times in other states, the staffer wishes to form a freight mobility benchmarking network with a group of neighboring state DOT freight offices. Here are the steps she might take: 1. The staffer is concerned about how, and how much, highway congestion affects the cost of freight transportation and disrupts business supply chains. She is concerned because highway congestion raises the costs of shipping in two ways: it increases the time needed for goods to reach their destination, and more importantly, companies cannot rely on being able to ship goods by a specified time. The staffer asks her peers in neighboring state DOT freight offices to join her in creating a highway freight mobility benchmarking network. 2. The staffer and her peers meet to discuss performance measures. Successful benchmarking processes begin with the foundational steps, and so the group starts by determining which freight congestion metrics the states already have in common. Possible examples of existing metrics required by FHWA include the Interstate Travel Time Reliability Measure (percentage of person-miles traveled on the Interstate that are reliable) or the Truck Travel Time Reliability Index. They will explore additional factors such as geographic corridors and specific time periods. If the benchmarking group finds these performance metrics to be inadequate, they could work to determine additional relevant metrics. 3. The benchmarking group assembles existing data on freight mobility that meet their agreed-upon set of metrics. However, publicly available freight mobility data might be limited as this type of data is often held by private shipping companies rather than state DOTs. 4. To supplement publicly available data, the benchmarking group requests data from trucking companies and trucking associations. Following the example of other benchmarking networks, this benchmarking group assures confidentiality to companies that submit data to protect them from competitors. The benchmarking group also requests permission from shipping companies to place transponders on a sample of their trucks to gather new data on freight mobility. 5. The benchmarking group analyzes their data to identify obstacles to freight movement. Freight might move more slowly on certain days, at certain times of day, or during certain seasons. It may also move more slowly on certain highway segments or interchanges, or the analysis might point to other causes of delay.
Effective Performance Management by Transportation Agencies Guidebook Benchmarking and Comparative Measurement Use Case Scenarios Introduction ⢠Types of Benchmarking ⢠The Practice of Benchmarking ⢠Use Case Scenarios ⢠Case Studies 46 6. The benchmarking group uses the information gained from their data analysis to make recommendations about times, places, and methods for shipping goods that avoid congestion and result in faster and more reliable shipping times. 7. Over time, the benchmarking group continues to share freight mobility data. Continuing the benchmarking effort over multiple years allows the group to make adjustments as traffic trends and demand for shipping change.
Effective Performance Management by Transportation Agencies Guidebook Benchmarking and Comparative Measurement Use Case Scenarios Introduction ⢠Types of Benchmarking ⢠The Practice of Benchmarking ⢠Use Case Scenarios ⢠Case Studies 47 Example 5 Estimating Realistic Process Durations The AASHTO Lean Forum wants to examine the durations of particular business processes that are standard across state DOTs in order to better understand the range of business process time frames and to identify what particular organizations have done to speed up their processes. The Forum has looked at such trends in the past, but it has not done so systematically using benchmarking techniques. Below is a process the Forum might follow: 1. The members of the Lean Forum first identify the particular business process or set of processes they wish to investigate. They decide to examine the durations of design procurement processes. The Forum members select a benchmarking team leader and create a subcommittee to focus on this project. 2. The subcommittee chooses particular data points and performance measures it plans to collect from each participating agency. These may include the full duration of a design procurement process from concept to notice to proceed; the phases within the procurement process and their durations, such as the creation of the request for proposals or the selection process; or the way procurement offices are structured and how they fit into their agency. The subcommittee could also ask DOTs to identify particular tools or practices that have enabled them to speed up their procurement processes, such as the use of a digital application portal. 3. The subcommittee creates a preliminary list of state DOTs it would like to include in the study and identifies procurement staff at each agency to contact. Once this contact list has been created, subcommittee members reach out to procurement staff to gauge their interest in involvement. 4. Data are collected through two-part interviews. In the first part, participating state DOT procurement officials are asked for facts and figures on their full procurement process. This information may be supplemented with additional data from procurement offices after the interview itself. The second part of the interview is used to identify noteworthy practices. Procurement officials will be asked about their organizational structures, their implementation of tools and technologies, and ways they have made their procurement processes more time- and cost-efficient. 5. Subcommittee members analyze the collected data to determine the range of and average time frames for procurement processes across the participating state DOTs. They also look for patterns and trends from the
Effective Performance Management by Transportation Agencies Guidebook Benchmarking and Comparative Measurement Use Case Scenarios Introduction ⢠Types of Benchmarking ⢠The Practice of Benchmarking ⢠Use Case Scenarios ⢠Case Studies 48 interviews to identify a set of noteworthy practices that lower- performing state DOTs could implement to speed up their processes. The subcommittee publishes its findings in a report that can be accessed by state DOT officials.
Effective Performance Management by Transportation Agencies Benchmarking and Comparative Measurement Introduction ⢠Types of Benchmarking ⢠The Practice of Benchmarking ⢠Use Case Scenarios ⢠Case Studies 49 Case Studies Three case studies of organizations that have successfully carried out benchmarking initiatives Guidebook Case Studies
Effective Performance Management by Transportation Agencies Guidebook Benchmarking and Comparative Measurement Case Studies Introduction ⢠Types of Benchmarking ⢠The Practice of Benchmarking ⢠Use Case Scenarios ⢠Case Studies 50 Case Studies Case Study 1. National Water and Wastewater Initiative Case Study 2. Tri-State Partnership in Hampshire, and Vermont Case Study 3. Virginia DOT District Performance Program Benchmarking Maine, New Management
Effective Performance Management by Transportation Agencies Guidebook Benchmarking and Comparative Measurement Case Studies Introduction ⢠Types of Benchmarking ⢠The Practice of Benchmarking ⢠Use Case Scenarios ⢠Case Studies 51 Case Study 1 National Water and Wastewater Benchmarking Initiative The National Water and Wastewater Benchmarking Initiative (NWWBI; http://www.nationalbenchmarking.ca/) is a consortium of Canadian water and wastewater utilities and stormwater management programs that has won an American Public Works Association award for its progress in benchmarking. The NWWBI began in 1997 as a pilot project through the Canadian National Research Council for four cities that wanted to benchmark their wastewater practices. It continued as a small group of utilities committed to improving performance through benchmarking that was, and still is, facilitated by the engineering firm AECOM. The initiative quickly expanded beyond the original four cities to include water utilities and stormwater programs. Today the partnership includes utilities from 55 municipalities and districts, which collectively represent more than 60% of the Canadian population. Members pay a flat subscription fee for AECOMâs facilitation services, which include performance results analysis, workshops, access to archived resources and a help desk, and data collection support for new members. Although performance comparisons are part of the initiative, the focus of the group is on continuous improvement. The working definition of benchmarking for this initiative is as follows: The ongoing process of comparing products, services and practices with those of similar organizations, with the ultimate goal to continuously improve quality and performance. Unified Goals and Performance Measures Clearly established and widely agreed-upon definitions and measurement processes are a point of pride for the NWWBI staff and participants. When the facilitators began the initiative, they found that even though the entities they worked with were in the same sector and doing the same thing, there was substantial variation in how they went about providing their functions. At the start of the initiative, staff and participants sat down to develop the Utility Management Model, which rests on unified goals, definitions, and performance measures. This model provides the basis for ensuring that practical and relevant performance measures are selected and lays out the structure for continuous improvement that is central to NWWBIâs philosophy of benchmarking.
Effective Performance Management by Transportation Agencies Guidebook Benchmarking and Comparative Measurement Case Studies Introduction ⢠Types of Benchmarking ⢠The Practice of Benchmarking ⢠Use Case Scenarios ⢠Case Studies 52 Establishing this initial foundation involved a series of workshops with active consortium members. Participants discussed what the best performance indicators might be, and then selected a handful of measures. AECOM facilitators refined the selected indicators to ensure usability and alignment with the goals that came out of the workshops. The result was a set of coherent indicators that was ready for implementation. The facilitators stress that it took them a while to get the performance indicators right and for everyone to be on board with them. The indicator development process is repeated with each new module, and participants report that it gets better and easier over time. One issue that had to be resolved was related to confidentiality. In the beginning, many members were concerned about sharing performance information that would reflect poorly on their agencies. To address this concern, the facilitators asked all members to sign a statement that they would protect confidentiality of the information. This practice eased concerns and promoted more open participation and discussion. Although that clause remains in place, members reportedly no longer view discussing poor performance as being called out or judged. Members are comfortable with the goals and processes and can discuss issues with openness and confidence regardless of relative performance. Collecting Data NWWBI staff report data collection represents a significant effort for consortium participants. To help new members cope with this challenge, NWWBI provides hands-on assistance during the initial data-gathering process. This early assistance ensures a high level of confidence in data quality, completeness, and, perhaps most importantly for benchmarking, comparability across members. As part of this assistance, NWWBI provides training on the details of data gathering and preparation. NWWBI staff report new members take two to three years before they are ready to handle data collection without assistance. At that point members are expected to gather and submit data on their own unless they elect to pay an additional fee for support. Although the data collection process is a significant undertaking at the start, the level of effort for returning members decreases over time as staff become more comfortable with the process. Some utilities have automated the process through established scripts and queries that can be reused from year to year. One important factor in keeping the effort low after the initial hurdle is retaining staff who were trained on the process and requirements. Larger utilities have a dedicated full-time staff person for data gathering and compilation. NWWBI has three data collection deadlines over the year. The facilitators continually review opportunities to further streamline the data collection cycle and reduce the number of required elements. Although the performance indicators change little from year to year, the value of different data elements fluctuates based on issues of current concern. Once agencies have addressed an issue, the need for active benchmarking related to that issue is diminished. Facilitators conduct quality reviews of the submitted data. Data submittals are cross- referenced with that utilityâs financial reports and other publicly available information to ensure accuracy.
Effective Performance Management by Transportation Agencies Guidebook Benchmarking and Comparative Measurement Case Studies Introduction ⢠Types of Benchmarking ⢠The Practice of Benchmarking ⢠Use Case Scenarios ⢠Case Studies 53 Discussions with the facilitation staff indicate that, although collecting all the data necessary for quality benchmarking requires a significant effort for members, the upfront assistance by the facilitator for new participants, iron-clad definitions, and standardized measurement processes result in a streamlined and successful participant- submitted data collection process. Self-Assessment and Continuous Improvement NWWBI facilitators distinguish between metric benchmarking and process benchmarking. Metric benchmarking is an agencyâs day-to-day activity of looking at performance and comparing it with peers. It involves data collection, graphs, and charts. This day-to-day metric benchmarking activity can lead to process benchmarking, which concerns identifying activities that may improve performance. NWWBI members refer to the development of process benchmarking as âclosing the loop.â Process benchmarking is significantly more complex, requiring more resources and a higher level of commitment. NWWBI staff put it this way: âItâs not rocket science, but it is hard work.â Within the NWWBI, the goal of data collection and analysis is process benchmarking, and comparing performance is the means to this end. The groupâs facilitators produce reports on membersâ performance to help inform this process. All the work that comes after those reports is the heart of NWWBIâs benchmarking success. The different ways the group âcloses the loopâ are outlined below. ⢠Annual workshopâPeers and facilitators meet face to face to delve into utility performance in depth during the annual three-day workshop. Although the formal agenda and presentations provide a structure to the discussion and introduce topics of importance to everyone, the in-person workshop provides the most important opportunity for members to engage in the informal networking that members value highly. ⢠Process benchmarking task forcesâ Subgroups of members form task forces that cover specific topic areas such as water loss management. Each task force has an assigned staff member in charge of researching methodologies other institutions have developed or tools they have generated and then sharing those results with members. These task forces serve as ongoing points of contact for members. ⢠Conference callsâMembers stay in touch on a monthly basis through conference calls organized by the facilitators. These calls generally reflect task force topics, but they can be scheduled around particular issues that arise at any point. During most calls, at least one member presents an issue his or her utility is actively working on. Usually more advanced agencies share what is working, but facilitators sometimes find greater value in having low performers share their experiences and seek input. The facilitator on the call develops an action plan that stems from the discussion, which might include surveys or additional sessions between members. The presentations and meeting minutes from the calls are saved online in program documents for all members to review at any time. If there is sufficient interest in any of the conference call topics, the facilitator may conduct more calls on that topic or develop a workshop event around it.
Effective Performance Management by Transportation Agencies Guidebook Benchmarking and Comparative Measurement Case Studies Introduction ⢠Types of Benchmarking ⢠The Practice of Benchmarking ⢠Use Case Scenarios ⢠Case Studies 54 ⢠SurveysâSometimes members have a specific set of questions they would like peer input on outside of the regular conference calls. In these cases, facilitators work with the interested party to come up with a brief survey to send out to members. The requesting member can decide to survey the whole group or only a single task force, and the other members then respond with their experiences and input. If members express major interest in that topic, it could become the focus of a future conference call. ⢠Clearinghouse of documentsâThe NWWBIâs internal website houses all reports, presentations, discussion notes, meeting minutes, and other content generated over years of initiative operation. These documents are all available on the password-protected portion of the site that members can access. A portion of the project website contains all the performance information, data, and metadata for review and comparison. ⢠Informal networkâMembers regularly extoll the value of the informal aspect of the initiative for peer exchange and discussions on issues of specific importance to them. The opportunities to discuss performance with like-minded people doing the same thing is immensely valuable to participants. The facilitators at NWWBI regularly get feedback that networking is a big portion of the perceived benefit of being a member. Communicating Results The NWWBI periodically releases a public report that discusses its benchmarking methodology and hosts a website with supporting documentation, including articles written for publication and presentations on the initiative. In addition, individual members regularly give presentations on their own work and performance stories. NWWBI does not try to keep its methods secret, instead opting to publish its successes as a resource for others who wish to undertake benchmarking of their own.
Effective Performance Management by Transportation Agencies Guidebook Benchmarking and Comparative Measurement Case Studies Introduction ⢠Types of Benchmarking ⢠The Practice of Benchmarking ⢠Use Case Scenarios ⢠Case Studies 55 Case Study 2 Tri-State Partnership in Maine, New Hampshire, and Vermont The Tri-State Partnership is a collaborative benchmarking effort among the Maine, New Hampshire, and Vermont state DOTs. The initiative began in 2002 when transportation operations and maintenance personnel from the three states began meeting regularly to discuss best practices. Through this partnership the states developed common performance measures relating to asset conditions, business processes, and public safety. They used benchmarking to identify who had the best performance and examined the reasons. The practices that led to the better performance were shared and adopted by the other two states. The leaders of the three statesâ transportation agencies formalized their partnership in 2010 by signing a memorandum of understanding, which they updated in 2016. Performance reports are available annually (http://vtrans.vermont.gov/sites/aot/files/por tal/documents/other/2017%20Tri- State%20Report.pdf). Performance Measures The three states chose to benchmark their performance in five areas: business performance, bridge condition, pavement condition, traffic signs, and safety. For each of these areas they chose common performance metrics for comparison. The states agreed on three ways to measure business performance. The first was to measure the accuracy of the timing of their construction advertisement plans by calculating the percentage of projects that were advertised on time (for this purpose, within 30 days of when the plan had called for them to be advertised). The second was to measure the accuracy of the total delivery of their construction advertisement plans by comparing the planned and actual dollar value and quantity of advertised projects to date. The third was to measure the accuracy of construction cost estimates by comparing cost estimates to actual construction award costs, with the goal of having 50% of awarded projects be within 10% of their estimated costs. The states chose two bridge condition measures. The first was the percentage of structurally deficient bridges by deck area. The second was a goodâfairâpoor measure based on NBI bridge condition ratings. To assess pavement condition, the states adopted the International Roughness Index as a common measurement with different condition threshold values for Interstates and other expressways and lower functional class roads. The states analyzed their pavement conditions in terms of road classification, lane miles, and VMT. The three states worked toward a common traffic sign performance measure. Although they agreed on the importance of traffic signs for conveying essential information to the traveling public, each state had, in the past,
Effective Performance Management by Transportation Agencies Guidebook Benchmarking and Comparative Measurement Case Studies Introduction ⢠Types of Benchmarking ⢠The Practice of Benchmarking ⢠Use Case Scenarios ⢠Case Studies 56 taken different approaches to measuring traffic sign performance. Given their mismatched measurements, the states agreed that the percentage of non-Interstate signs exceeding their anticipated service life would be the best common measurement. They defined signs above service life as signs that are still functioning as intended and are providing adequate guidance to the traveling public. This definition accommodates the different approaches used by each state. For the safety performance measurement, the states used the number of deaths and incapacitating injuries per 100 million VMT. Collecting Data Although the Tri-State Partnership has been benchmarking their performance in the areas listed above, the states continue to refine and align their approaches to data collection: ⢠Maine has been collecting data on the quality of their construction advertisement plans longer than the other states, which has given New Hampshire and Vermont an opportunity to learn from Maine how best to track construction project schedules. ⢠Each state gathers data on pavement conditions by using different collection systems. However, each stateâs data collection system follows established protocols for its Highway Performance Management System (HPMS) submittal. As a result, the states are able to gather and compare pavement condition data, even though their collection systems vary. ⢠Each state collects traffic sign condition data differently. Vermont and Maine use the age of a sign as a proxy for condition, while New Hampshire conducts nighttime inspections to measure sign condition. The states report both their current sign conditions and the method by which they reached that determination. The common metric of sign service life accommodates the different ways each state collects its sign condition data. The Value of Collaboration Maine, New Hampshire, and Vermont have similar-sized road networks, with over 14 million road miles in Vermont, 16.5 million in New Hampshire, and 23.5 million in Maine. All three states are in the bottom 20% in terms of number of residents. Climate conditions are another important commonality. These commonalities have made it natural for officials to share and implement more effective management strategies that are relevant across the three agencies. Specifically, the Tri-State Partnership has benefitted the states by the following: ⢠Giving them a unified regional voice in national transportation policy, ⢠Giving them a unified regional approach to tracking asset conditions, and ⢠Allowing them to formalize the sharing of information and ideas to improve state and regional asset performance.
Effective Performance Management by Transportation Agencies Guidebook Benchmarking and Comparative Measurement Case Studies Introduction ⢠Types of Benchmarking ⢠The Practice of Benchmarking ⢠Use Case Scenarios ⢠Case Studies 57 Both AASHTO and FHWA have recognized the Tri-State Partnership as an exemplary model of performance and asset management. AASHTO and FHWA used the example of the partnership in developing national performance standards in the 2012 MAP-21. Process Improvements The three states work continuously to improve their collaboration process. The states release an annual report that incorporates new elements based on feedback from the previous year. Some of the process improvements they have made include the following: ⢠The Partnership changed its approach to measuring bridge conditions. Prior to 2013 the states had used a Bridge Condition Index, a composite measure of bridge condition that considered the bridgeâs substructure, deck, and superstructure weighted by bridge size. Beginning in 2013 the three states adopted a measure based on NBI, aligning them with standards used elsewhere in the country and providing a more unified regional approach to asset management. ⢠As a result of MAP-21, each state has worked on developing a Transportation Asset Management Plan. The process of developing these plans gave each state an opportunity to reassess how it measures asset performance, and these internal state reassessments have helped the Partnership to continue to align its performance measures. ⢠In their 2016 report, the states added a section called Tri-State Quick Facts that compares the statesâ transportation statistics, such as miles of public roadways, miles of National Highway System, highway fatalities, licensed commercial drivers employed by the state, and hours spent plowing in the most recent winter. These facts provide additional context for the discussion of shared performance measures. ⢠In future years the Partnership intends to develop performance measures consistent with MAP-21 final rulemaking regarding asset management and relevant changes in federal regulations. Overall the officials who have participated have found the Partnership to have positive effects. In their 2016 annual report they wrote, âAs agents of state government, the most important asset we can build and maintain is the trust of the people we serve.â
Effective Performance Management by Transportation Agencies Guidebook Benchmarking and Comparative Measurement Case Studies Introduction ⢠Types of Benchmarking ⢠The Practice of Benchmarking ⢠Use Case Scenarios ⢠Case Studies 58 Case Study 3 Virginia DOT District Performance Management Program Virginia DOTâs (VDOTâs) leadership holds a quarterly video conference with the administrators of its nine districts. Prior to the meeting, each district compiles a series of metrics and prepares a brief slide deck to present its results. Each district uses the same slide deck template. The slides are compiled into a single presentation, and the district administrators go through their slides in a fast-paced, round-robin style. Common metrics reported by each district include the following: ⢠Safetyâoccupational safety, crashes (preventable, nonpreventable, and undetermined), and traffic fatalities; ⢠Structuresâstructurally deficient bridges and culverts; ⢠Pavingâlane miles of paving; ⢠Traffic congestionâdesired trends and how the district hopes to achieve them; ⢠Construction project deliveryâ percentage of projects that are on time and on budget; and ⢠Americans with Disabilities Act (ADA) complianceânumber of curb ramp retrofits, dollars spent, ramps remaining, and dollars remaining. In addition to sharing performance metrics, the districts report on the strategies they are undertaking to improve their performance. Example strategies include holding regular meetings with localities to ensure ongoing coordination on projects, assessing the usefulness of pilot projects, and reviewing draft bid documents ahead of time to catch errors before projects go out to bid. After reviewing the district reports, VDOTâs central office divisions, which include Safety and Health, Transportation and Mobility Planning, Construction, Bridges, Location and Design, Maintenance, Materials, Operations, Traffic Engineering, Land Use, and Asset Management, report statewide performance metrics. The departmentâs benchmarking process was initiated as part of a broader performance management effort that involved establishing a performance dashboard (http://dashboard.virginiadot.org/). VDOTâs dashboard was created in 2003 to encourage transparency by presenting data to the public from across VDOTâs geographic districts and operational divisions. The dashboard has helped to drive performance improvement at VDOT and has served as a useful tool for pinpointing problem areas. All performance ratings in the benchmarking process and on the dashboard categorize performance measures by using a color
Effective Performance Management by Transportation Agencies Guidebook Benchmarking and Comparative Measurement Case Studies Introduction ⢠Types of Benchmarking ⢠The Practice of Benchmarking ⢠Use Case Scenarios ⢠Case Studies 59 scheme of green (good), yellow (marginal), and red (poor). The colors represent numerical values according to the type of data presented and the performance goal for that category, but the meaning of the colors is the same across different data types. For example, a project that is finished on or before its target completion date is green, a project completed late but within a set range of target completion dates is yellow, and a project that is later than the set range is red. Similarly, a project that came in on budget is green, a project that came in over budget but within a set percentage or dollar amount is yellow, and a project that exceeds the budget by more than the set amount is red. The three-color rating system aligns with Smart Scale, which Virginia uses to select transportation projects. Smart Scale involves scoring projects based on outcomes and objectives. The process is meant to encourage transparency and hold decision makers accountable for how they spend taxpayer dollars. Uses of Benchmarking VDOT uses its benchmarking process to set performance thresholds and targets for its districts by determining reasonable performance levels, exemplary performance levels, and minimum thresholds for performance. The regular comparison of district performance gives VDOT the data needed to analyze why one district performs significantly above or below expected performance levels. This focus educates all the districts on the specifics of practices that work and those that do not. Districts that do not meet targets are tasked with developing action plans. Districts typically provide notes on their quarterly meetings explaining why they are not meeting their targets and how they intend to meet them. If they are exceeding their targets, they report the reason for their superior performance. VDOT has found benchmarking to be useful in highlighting areas of concern. For example, VDOT had been receiving a large number of complaints about drainage. Benchmarking reporting brought this issue to the attention of VDOT leadership, who discovered two areas had a particularly high volume of complaints. One of these areas had experienced drainage problems after the discontinuation of a county leaf collection program. After this issue was identified and corrected, complaints went down. The benchmarking process has allowed VDOT leadership to focus on the agencyâs core issues and has helped to make progress toward VDOTâs performance goals by requiring districts to collect and present data. For example, the department wanted to prioritize retrofitting curb ramps and sidewalks to comply with the ADA. The benchmarking process required the districts to report regularly on their progress toward ADA retrofitting goals, which encouraged them to do more work toward meeting those goals. Culture Change at the Districts When VDOTâs benchmarking initiative began, the districts were hesitant to share data and compare themselves to one another. Some believed that comparing different regions of the state was not meaningful due to widely varying topography, degree of urbanization, and travel patterns. For example, the westernmost district, Bristol, is mountainous and rural, while the Hampton Roads district is coastal and dotted with cities.
Effective Performance Management by Transportation Agencies Guidebook Benchmarking and Comparative Measurement Case Studies Introduction ⢠Types of Benchmarking ⢠The Practice of Benchmarking ⢠Use Case Scenarios ⢠Case Studies 60 Benchmarking has gained gradual acceptance, however. One way VDOT began changing the culture was by instituting a âtriple crownâ award for districts that were on time, on budget, and meeting quality targets. This award became a discussion point in meetings and helped to create an atmosphere of friendly competition and drive continuous improvement. VDOT has also clearly communicated that benchmarking is about improvement, not shaming. The department compiles data from all the districts onto a summary spreadsheet that displays the best result and the median result on each metric. It also displays the lowest result, but it does not use the word âworst.â Instead, the Department labels it the âleast desirableâ outcome. This language choice, while subtle, helps to reinforce the emphasis on improvement. Process Evolution As mentioned, VDOTâs benchmarking initiative began in conjunction with the rollout of its performance dashboard. Although this process has been sustained across three changes in leadership, the details have evolved. The VDOT commissioner who started the process held monthly video conferences with all districts. The next commissioner replaced the monthly video conferences with quarterly visits to each of the nine districts, which amounted to 36 meetings per year. The following commissioner switched the format to quarterly statewide video conferences with smaller slide decks. Going forward, VDOT aims to streamline the data assembly process used to create the slide deck for the quarterly meetings. The data that each district assembles come from many sources and require significant manual effort (4â8 hours of staff time per measure) to compile. VDOT is working on ways to automate the process of assembling these data to make it less labor-intensive. Sustaining Momentum VDOT staff are confident that their benchmarking initiative will continue, both because it has been demonstrated to work and because it is integral to the agencyâs commitment to transparency. VDOTâs dashboard has been key to sustaining the benchmarking process. The dashboard provides public visibility to agency performance. There have been times since the benchmarking initiative began that regular meetings have stopped, and the districts lost focus or were unable to meet targets. Once meetings resumed, progress toward goals resumed as well.
