
2
Epidemiology of Childhood Cancer in the United States
When considering the epidemiology of cancer within defined populations and/or specific settings, it is important to understand the definitions of and distinctions among established metrics for characterizing cancer’s occurrence and outcomes. Box 2-1 defines the terms often used in describing the occurrence, outcomes, and risks of cancer and cancer-related outcomes.
Cancer therapy can potentially have adverse consequences. In this report and in the medical literature, the following terms are frequently used to denote the temporal occurrence of an event or condition representing the effect of cancer treatment on the health and function of the cancer patient:
- Acute effect of cancer therapy: an event or condition that occurs during or immediately following cancer treatment.
- Chronic effect of cancer therapy: an event or condition that was present during the time the survivor of cancer was receiving treatment and continues to be present in the posttreatment period.
- Late effect of cancer therapy: an event or condition that occurs at a time distant from completion of cancer therapy and was not present during the therapy or occurred acutely but resolved.
INCIDENCE
The National Cancer Institute’s Surveillance, Epidemiology, and End Results (SEER) Program represents the primary source for population-based data on cancer incidence in the United States (Howlader et al., 2019). The
SEER Program typically reports cancer incidence according to age-specific groupings consisting of 5-year intervals. For the present report, the committee used SEER data for the period 1990–20161 to calculate overall and diagnosis-specific (based on the International Classification of Childhood Cancer [Steliarova-Foucher et al., 2017]) incidence rates for ages 0–17 (see Table 2-1). For all malignant diagnoses collectively, the annual incidence in this age group is 176 cases per million population, which translates to an estimated 13,060 newly diagnosed cases per year.
___________________
1 Since the prepublication copy of the report was released, the date range was corrected from 2000–2016 to 1990–2016 to accurately reflect the date range for the data used in Table 2-1.
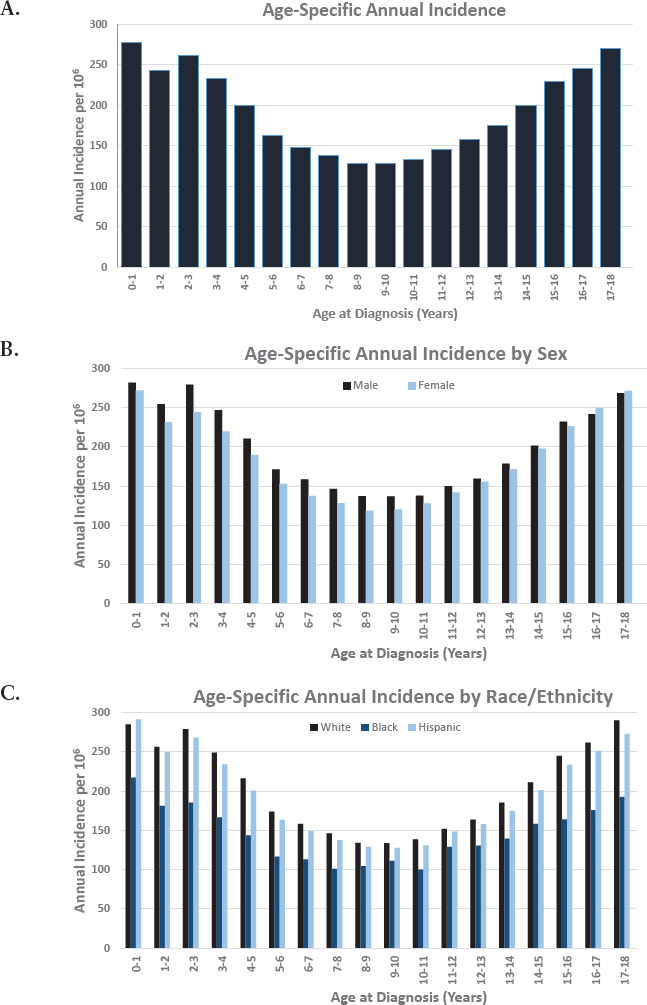
The age-specific distribution of the annual incidence rates for cancers diagnosed among those under age 18 is bimodal (U-shaped curve), with the highest age-specific incidence rate of 277.2 cases per million population occurring in the first year of life (see Figure 2-1A). Overall, males have a modestly higher incidence (199.6/106) compared with females (186.6/106) (see Figure 2-1B). The SEER Program reports incidence rates by race, defined by the categories White, Black, Other (American Indian/Alaska Native, Asian/Pacific Islander), and ethnicity, defined by the categories Hispanic-Latino and Non-Hispanic-Latino. In the under 18 age group, incidence rates are highest among Whites (204.5/106), followed by Hispanics-Latinos (195.7/106),
| Diagnosis (ICCC) | Annual Incidence/106 Age 0–17 Years | Proportion |
|---|---|---|
| All histology excluding benign CNS tumors | 176.0 | 1.00 |
|
48.8 | 0.28 |
| I(a) Lymphoid leukemias | 37.6 | 0.21 |
| I(b) Acute myeloid leukemia | 8.1 | 0.05 |
| I(c) Chronic myeloproliferative diseases | 1.0 | 0.01 |
| I(d) Myelodysplastic syndrome and other myeloproliferative | 0.4 | 0.00 |
| I(e) Unspecified and other specified leukemias | 1.7 | 0.01 |
|
22.5 | 0.13 |
| II(a) Hodgkin lymphoma | 9.3 | 0.05 |
| II(b) Non-Hodgkin lymphomas (except Burkitt lymphoma) | 10.1 | 0.06 |
| II(c) Burkitt lymphoma | 2.5 | 0.01 |
| II(d) Miscellaneous lymphoreticular neoplasms | 0.2 | 0.00 |
| II(e) Unspecified lymphomas | 0.3 | 0.00 |
|
51.6 | 0.29 |
| III(a) Ependymomas and choroid plexus tumors | 4.0 | 0.02 |
| III(b) Astrocytomas | 18.2 | 0.10 |
| III(c) Intracranial and intraspinal embryonal tumors | 6.4 | 0.04 |
| III(d) Other gliomas | 5.7 | 0.03 |
| III(e) Other specified intracranial/intraspinal neoplasms | 15.4 | 0.09 |
| III(f) Unspecified intracranial and intraspinal neoplasms | 1.9 | 0.01 |
| Diagnosis (ICCC) | Annual Incidence/106 Age 0–17 Years | Proportion |
|---|---|---|
|
9.5 | 0.05 |
| IV(a) Neuroblastoma and ganglioneuroblastoma | 9.2 | 0.05 |
| IV(b) Other peripheral nervous cell tumors | 0.3 | 0.00 |
|
3.7 | 0.02 |
|
7.6 | 0.04 |
| VI(a) Nephroblastoma and other nonepithelial renal tumors | 6.9 | 0.04 |
| VI(b) Renal carcinomas | 0.6 | 0.00 |
| VI(c) Unspecified malignant renal tumors | 0.0 | 0.00 |
|
2.9 | 0.02 |
| VII(a) Hepatoblastoma | 2.3 | 0.01 |
| VII(b) Hepatic carcinomas | 0.5 | 0.00 |
| VII(c) Unspecified malignant hepatic tumors | 0.0 | 0.00 |
|
9.6 | 0.05 |
| VIII(a) Osteosarcomas | 5.5 | 0.03 |
| VIII(b) Chondrosarcomas | 0.3 | 0.00 |
| VIII(c) Ewing tumor and related sarcomas of bone | 3.2 | 0.02 |
| VIII(d) Other specified malignant bone tumors | 0.5 | 0.00 |
| VIII(e) Unspecified malignant bone tumors | 0.1 | 0.00 |
|
12.2 | 0.07 |
| IX(a) Rhabdomyosarcoma | 5.1 | 0.03 |
| IX(b) Fibrosarcomas, peripheral nerve, and other fibrous | 1.1 | 0.01 |
| IX(c) Kaposi sarcoma | 0.0 | 0.00 |
| IX(d) Other specified soft-tissue sarcomas | 4.6 | 0.03 |
| IX(e) Unspecified soft-tissue sarcomas | 1.4 | 0.01 |
| Diagnosis (ICCC) | Annual Incidence/106 Age 0–17 Years | Proportion |
|---|---|---|
|
8.8 | 0.05 |
| X(a) Intracranial and intraspinal germ cell tumors | 2.0 | 0.01 |
| X(b) Extracranial and extragonadal germ cell tumors | 1.4 | 0.01 |
| X(c) Malignant gonadal germ cell tumors | 4.8 | 0.03 |
| X(d) Gonadal carcinomas | 0.3 | 0.00 |
| X(e) Other and unspecified malignant gonadal tumors | 0.2 | 0.00 |
|
16.8 | 0.10 |
| XI(a) Adrenocortical carcinomas | 0.2 | 0.00 |
| XI(b) Thyroid carcinomas | 7.7 | 0.04 |
| XI(c) Nasopharyngeal carcinomas | 0.4 | 0.00 |
| XI(d) Malignant melanomas | 3.0 | 0.02 |
| XI(e) Skin carcinomas | 0.1 | 0.00 |
| XI(f) Other and unspecified carcinomas | 5.5 | 0.03 |
| XII. Other and unspecified malignant neoplasms | 0.0 | 0.00 |
| XII(a) Other specified malignant tumors | 0.0 | 0.00 |
| XII(b) Other unspecified malignant tumors | 0.0 | 0.00 |
| Not classified by ICCC or in situ | 2.7 | 0.02 |
NOTE: CNS = central nervous system; ICCC = International Classification of Childhood Cancer.
SOURCE: National Cancer Institute’s Surveillance, Epidemiology, and End Results Program for the period 1990–2016.
SOURCE: National Cancer Institute’s Surveillance, Epidemiology, and End Results Program for the period 1990–2016.
Asians/Pacific Islanders (156.4/106), Blacks (146.1/106), and American Indians/Alaska Natives (93.5/106) (see Figure 2-1C).
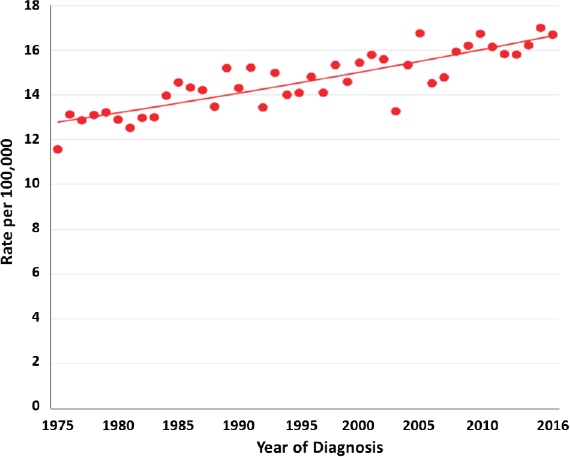
Over the past four decades, there has been a modest, yet continuous, increase in the incidence of cancers occurring under the age of 15 years in the United States (see Figure 2-2) and internationally (Steliarova-Foucher et al., 2018). Reasons posited for this observed increase have included improvements in diagnosis and cancer registration, the ability to diagnose some tumors at an earlier age, and changes in possible underlying environmental risk factors.
MORTALITY AND SURVIVAL
For individuals under 20 years of age in the United States, cancer is the second leading cause of death among females and the fourth among males. The leading causes of cancer-related death include brain and other nervous system, bone/joint, and soft-tissue cancers and leukemia (Siegel et al., 2020). Cancer is the leading cause of death due to disease among children under age 18.
Since the late 1960s and early 1970s, the survival rate among children diagnosed with cancer has steadily improved, and there has been a
SOURCE: National Cancer Institute’s Surveillance, Epidemiology, and End Results Program for the period 1974–2016.
corresponding decline in the cancer-specific death rate in this population (Smith et al., 2014). Research using data from population-based cancer registries and cooperative group clinical trials has shown that survival rates differ among racial and ethnic groups (Amirian, 2013; Henderson et al., 2011; Holmes et al., 2018; Jacobs et al., 2017; Kadan-Lottick et al., 2003; Kahn et al., 2019; Lupo and Spector, 2020). Non-Hispanic White children diagnosed with cancer often have the best survival rates compared to their peers from other racial and ethnic groups.
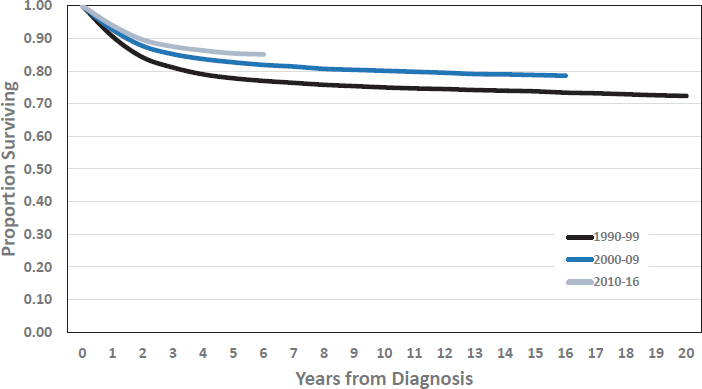
Survival rates for individuals diagnosed with cancer at ages 0–17 continue to improve (see Figure 2-3). The estimated proportion surviving 5 years from diagnosis increased from 77.8 percent to 82.7 percent to 85.4 percent for those diagnosed in the 1990s, 2000s, and 2010–2016, respectively. The proportion surviving at 5 years and 10 years varies considerably by specific cancer diagnosis (see Table 2-2).
CANCER-SPECIFIC INFORMATION
Cancers that occur among those aged 0–17 reflect a heterogeneous group of diseases with unique biologic, genetic, and demographic features. Moreover, the classification and categorization of childhood cancers are continually evolving with the emergence of new knowledge relating to the molecular, pathologic, and prognostic characteristics of this diverse group of malignancies. Leukemias, lymphomas, and central nervous system cancers
SOURCE: National Cancer Institute’s Surveillance, Epidemiology, and End Results Program for the period 1990–2016.
| Diagnosis (ICCC) | Survival Time | Year of Diagnosis | ||
|---|---|---|---|---|
| 1990–1999 | 2000–2009 | 2010–2016 | ||
| Lymphoid leukemias | 5 yr | 83.1% | 89.3% | 90.8% |
| 10 yr | 79.9% | 86.5% | ||
| Acute myeloid leukemia | 5 yr | 44.4% | 62.5% | 68.8% |
| 10 yr | 42.8% | 60.1% | ||
| Hodgkin lymphoma | 5 yr | 95.0% | 96.2% | 99.2% |
| 10 yr | 93.0% | 95.1% | ||
| Non-Hodgkin lymphomas | 5 yr | 80.2% | 85.0% | 91.0% |
| 10 yr | 79.1% | 83.4% | ||
| Ependymoma | 5 yr | 65.4% | 78.0% | 91.4% |
| 10 yr | 57.2% | 69.9% | ||
| Astrocytoma | 5 yr | 82.4% | 85.5% | 79.9% |
| 10 yr | 80.5% | 83.6% | ||
| Medulloblastoma | 5 yr | 61.9% | 72.8% | 67.6% |
| 10 yr | 57.5% | 67.0% | ||
| Neuroblastoma | 5 yr | 69.1% | 76.4% | 82.8% |
| 10 yr | 66.4% | 73.5% | ||
| Retinoblastoma | 5 yr | 96.8% | 97.4% | 93.0% |
| 10 yr | 96.4% | 97.4% | ||
| Wilms tumor | 5 yr | 91.4% | 91.7% | 96.4% |
| 10 yr | 89.7% | 90.9% | ||
| Hepatoblastoma | 5 yr | 62.6% | 73.5% | 87.9% |
| 10 yr | 62.6% | 71.6% | ||
| Osteosarcomas | 5 yr | 67.7% | 71.8% | 67.9% |
| 10 yr | 62.1% | 65.9% | ||
| Ewing tumor | 5 yr | 66.9% | 75.9% | 76.3% |
| 10 yr | 60.3% | 69.8% | ||
| Rhabdomyosarcomas | 5 yr | 69.1% | 66.7% | 74.1% |
| 10 yr | 67.7% | 62.2% | ||
| Non-rhabdomyosarcoma STS | 5 yr | 70.0% | 75.7% | 79.8% |
| 10 yr | 67.1% | 71.7% | ||
| Diagnosis (ICCC) | Survival Time | Year of Diagnosis | ||
|---|---|---|---|---|
| 1990–1999 | 2000–2009 | 2010–2016 | ||
| Germ cell tumors | 5 yr | 89.2% | 93.4% | 90.4% |
| 10 yr | 87.2% | 92.6% | ||
| Thyroid carcinomas | 5 yr | 98.7% | 99.0% | 99.3% |
| 10 yr | 97.3% | 99.0% | ||
| Malignant melanomas | 5 yr | 94.4% | 94.7% | 96.1% |
| 10 yr | 92.3% | 90.6% | ||
NOTE: ICCC = International Classification of Childhood Cancer; STS = soft-tissue sarcomas.
SOURCE: National Cancer Institute’s Surveillance, Epidemiology, and End Results Program for the period 1990–2016.
(CNS) combined account for 70 percent of cancer cases in this age range. Appendix B provides cancer-specific summaries, including population-based incidence and survival, for the major diagnoses occurring in childhood.
ETIOLOGIC RISK FACTORS
One of the earliest reports linking risk for childhood cancer and genetic syndromes, published in 1957, describes a higher-than-expected number of diagnoses of acute leukemia among children with Down syndrome (Krivit and Good, 1957). It has since become well recognized that a broad spectrum of genetic conditions is associated with specific cancer diagnoses among children (Brodeur et al., 2017; Ripperger et al., 2017) (see Table 2-3). More recently, there is increasing evidence suggesting that birth defects, both those with and without a known genetic basis, are associated with an increased risk of cancer among children (Lupo et al., 2019). With ongoing research and the application of advanced genomic technology, new genetic-based risks are continually being identified, providing additional insights into the importance of heritable predisposition in the etiology of cancer in this population, although it is important to note that the known genetic risks account for only a small proportion of the cancers occurring in those under age 18.
In contrast to the impressive gains achieved in treatment, survival rates, and insights into the genetic/biologic characteristics of childhood cancers, progress in understanding the etiology of most cancers in this age group has been limited. Demographic characteristics are the etiologic risk factors most strongly and consistently associated with the incidence of specific
| Cancer Type | Cancer-Predisposition Syndromes (gene) | Other Cancer-Predisposition Genes* |
|---|---|---|
| Acute lymphoid leukemia |
Down syndrome Li-Fraumeni syndrome (TP53) Noonan syndrome (PTPN11, SOS1, RAF1, RIT1, KRAS) DNA repair defects** |
ETV6, PAX5, IKZF1 |
| Acute myeloid leukemia |
Down syndrome Li-Fraumeni syndrome (TP53) Fanconi anemia (FANCA, FANCC, FANCG, BRCA2) Other bone marrow failure syndromes |
CEBPA, GATA2, ANKRD26, ETV6, RUNX1 |
| Juvenile myelomonocytic leukemia |
CBL syndrome Noonan syndrome (PTPN11, KRAS, NRAS) Neurofibromatosis 1 (NF1) |
|
| Medulloblastoma |
Gorlin syndrome (SUFU, PTCH1) Adenomatous polyposis coli (APC) Li-Fraumeni syndrome (TP53) Rubinstein-Taybi syndrome (CREBBP, EP300) Fanconi anemia (FANCA, FANCC, FANCG, BRCA2) Other DNA repair defects** |
BRCA1, PALB2 |
| Glioma |
Neurofibromatosis 1 (NF1) Tuberous sclerosis (TSC1, TSC2) Noonan syndrome (PTPN11, KRAS, NRAS, SOS1, RAF1, RIT1) Li-Fraumeni syndrome (TP53) Lynch syndrome (MLHL, MSH2, MSH6, PMS2, EPCAM) DNA repair defects** |
INK4A/ARF, CDK4 |
| Choroid plexus carcinoma |
Li-Fraumeni syndrome (TP53) |
|
| Non-Hodgkin and Hodgkin lymphomas |
DNA repair defects** Immunodeficiency syndromes*** |
|
| Neuroblastoma |
Beckwith-Wiedemann syndrome Weaver syndrome Sotos syndrome (NSD1) Simpson-Golabi-Behmel syndrome Rubinstein-Taybi syndrome (CREBBP, EP300) Costello syndrome Li-Fraumeni syndrome (TP53) |
ALK, PHOX2B |
| Cancer Type | Cancer-Predisposition Syndromes (gene) | Other Cancer-Predisposition Genes* |
|---|---|---|
| Retinoblastoma |
Li-Fraumeni syndrome (TP53) DICER1 syndrome (DCER1) Gorlin syndrome (SUFU, PTCH1) Beckwith-Weidemann syndrome DNA repair defects** |
RB1 |
| Rhabdomyosarcoma | ||
| Wilms tumor |
WAGR syndrome Deny-Drash syndrome Perlman syndrome (DIS3L2) Beckwith-Wiedemann syndrome Li-Fraumeni syndrome (TP53) Simpson-Golabi-Behmel syndrome (GPC3, GPC4) GLOW syndrome Bohring-Opitz syndrome (ASXL1) Mulibrey nanism (TRIM37) DNA repair defects** |
WT1 |
| Osteosarcoma |
Li-Fraumeni syndrome (TP53) Rothmund-Thomas syndrome (RECQL4) Hereditary multiple exostoses (EXT1, EXT2) |
RB1 (as a secondary malignancy) |
| Hepatoblastoma |
Beckwith-Wiedemann syndrome Simpson-Golabi-Behmel syndrome Soto syndrome (NSD1) Kabuki syndrome Li-Fraumeni syndrome (TP53) |
APCassociated conditions |
| Germ cell tumor | Schinzel-Giedion syndrome |
* Genes listed are those not directly related to a specific syndrome, but do reflect inherited genes that are associated with cancer risk.
** DNA repair disorders include conditions such as ataxia telangiectasia, Bloom syndrome, Fanconi anemia, dyskeratosis congenita, Nijmegen breakage syndrome, Rothmund-Thomson syndrome, Diamond-Blackfan syndrome, and Xeroderma pigmentosum.
*** Immunodeficiency syndromes include conditions such as common variable immunodeficiency, Wiskott-Aldrich syndrome, ataxia telangiectasia, and severe combined immunodeficiency.
SOURCES: Based on Brodeur et al., 2017; Ripperger et al., 2017.
cancer diagnoses among those under age 18. Examples of such risk factors include age, sex, and race/ethnicity:
- The age-specific patterns for the various malignancies in childhood are as follows:
- Early-onset tumors such as hepatoblastoma, retinoblastoma, Wilms tumor, and neuroblastoma have the highest incidence in the first years of life and occur only rarely after the age of 10.
- Late-onset tumors such as Hodgkin lymphoma, osteosarcoma, Ewing sarcoma, thyroid cancer, and melanoma generally have very low incidence during the first 5 years of life, subsequently rising with increasing age.
- Some cancers have a bimodal age distribution, such as the characteristic age peak of 3–6 years for childhood acute lymphoid leukemia and the U-shaped age distribution for germ cell tumors (GCTs).
- Some cancers, such as CNS malignancies, acute myeloid leukemia, and rhabdomyosarcoma, show only modest variation in age-specific incidence rates.
- With respect to the male/female ratio for the incidence of cancer in children, males have a higher incidence of acute lymphoid leukemia (1.2:1), Hodgkin lymphoma (1.2:1), non-Hodgkin lymphoma (2.0:1), medulloblastoma (1.4:1), hepatoblastoma (1.5:1), Ewing sarcoma (1.3:1), rhabdomyosarcoma (1.3:1), and GCT (1.3:1); females have a higher incidence of Wilms tumor (0.8:1), thyroid cancer (0.2:1), and malignant melanoma (0.8:1).
- Differences in the incidence of a number of childhood cancers among groups defined by race/ethnicity have generated hypotheses relating to genetic, socioeconomic, and culture-related etiologic factors. Examples of racial/ethnic differences in incidence include a twofold lower incidence of acute lymphoid leukemia among Blacks, the rare occurrence of Ewing sarcoma among Blacks, and a low incidence of neuroblastoma and CNS malignancies among Asians and Hispanics (Chow et al., 2010).
The lack of progress in identifying etiologic risk factors for childhood cancers is not the result of a lack of research. Numerous large case-control epidemiologic investigations, many conducted in North America and Europe during the 1980s and 1990s, included thousands of childhood cancers within the most common diagnoses and incorporated what was then state-of-the-art clinical and biological characterization of cases along with environmental sampling to enhance exposure assessment. These large-scale epidemiologic studies, employing primarily case-control designs, found a variety of associations for factors related to the preconception and pregnancy
periods (e.g., maternal smoking and alcohol or coffee consumption, prenatal vitamins, parental occupational exposures, residential chemical exposures); factors related to birth and delivery (e.g., parental age, birthweight, cesarean section birth, gestational age); and postnatal factors (e.g., breastfeeding; exposure to residential chemicals, passive smoke, and environmental or medical radiation) (Lupo and Spector, 2020). Importantly, the associations for only a few of these nongenetic risk factors have been found to be reproducible in multiple populations or to exhibit dose-risk relationships. Given the modest yield of these studies, subsequent research has focused largely on utilizing molecular genetic-based methods in epidemiologic investigations or meta-analyses of data from previous epidemiologic studies.
THERAPY-RELATED MORBIDITY
Over the past five decades, progress in cancer biology and therapeutics has resulted in steady improvement in outcomes for children with cancer. With access to contemporary therapy, 5-year survival rates for individuals diagnosed with cancer before age 20 exceed 80 percent, and survival into adulthood is anticipated for most (Siegel et al., 2020). It has been estimated that at the end of 2013, the number of survivors of childhood cancer living in the United States surpassed 420,000 (representing approximately 1 of 750 members of the total U.S. population), and based on current incidence and survival rates, the number of survivors of childhood cancer was expected to reach 500,000 by 2020 (Robison and Hudson, 2014).
The success reflected in this growing population of survivors of childhood cancer is offset, however, by the adverse health outcomes they experience related to cancer and its treatment. The cytotoxic agents and other modalities used to treat childhood cancers have been linked to risk for a variety of chronic health conditions that either develop early in the course of treatment and persist for the long term, or present as late effects many years after the completion of therapy. Cancer treatment–related toxicity is typically modality-specific and often dose-related, but additional factors related to the patient, the particular cancer, the health care system, and the cancer care provider influence an individual survivor’s health outcomes (Dixon et al., 2018; Robison and Hudson, 2014).
Chronic health problems are common among survivors treated for cancer during childhood; they increase in prevalence with the passage of time since diagnosis; and they encompass a spectrum of biomedical and psychosocial disorders (Armstrong et al., 2014; Bhakta et al., 2017; Gibson et al., 2018; Hudson et al., 2013). As described in detail in subsequent chapters of this report, there is remarkable diversity in the constellation of factors that can impact the risk profile as well as adversely impact the physical and mental/emotional functioning of survivors. Nonetheless, based on the age of the
survivor cohort, the time elapsed since diagnosis, and the method of health assessment (self-report versus medical evaluation), prevalence rates range from 60 percent to more than 90 percent for at least one chronic physical health problem and from 20 percent to more than 80 percent for severe, disabling, or life-threatening complications (Armenian et al., 2010; Armstrong et al., 2014, 2016; Bhakta et al., 2017; Geenen et al., 2007; Gibson et al., 2018; Hudson et al., 2013).
Importantly, chronic and late effects of cancer treatment clearly predispose survivors to greater hospital-related morbidity and premature mortality compared with age- and sex-matched controls (Armstrong et al., 2016; Rebholz et al., 2011; Reulen et al., 2010; Richardson et al., 2015). Observational studies of late health effects among survivors of childhood cancer have been instrumental in identifying, quantifying, and characterizing cancer treatment–related physical and mental/emotional health risks. In so doing, findings from health outcomes research have provided a major impetus for change in pediatric cancer therapy and have informed health screening of survivors of childhood cancer.
To demonstrate the magnitude of physical health conditions experienced by survivors, the cumulative burden methodology (Bhakta et al., 2017) was applied to data from a clinically assessed population at a single institution (St. Jude Children’s Research Hospital) (Hudson et al., 2017).
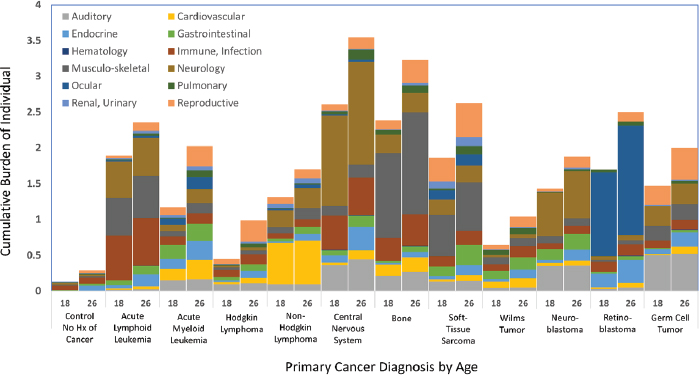
SOURCES: Data are from the St. Jude Lifetime Cohort Study (U01 CA195547) and generated from the dataset utilized in Bhakta et al., 2017, which describes the study population and methods.
Figure 2-4 shows the level of serious, disabling, or life-threatening physical disease-related morbidity experienced by survivors of childhood cancer at 18 and 26 years of age—two time points of importance relative to accessing disability support and parental health care coverage, respectively.
FINDINGS AND CONCLUSIONS
Findings
2-1 Over the past four decades, there has been a modest, yet continuous, increase in the incidence of cancers occurring under the age of 15 in the United States and internationally.
2-2 Since the late 1960s, the survival rate in children and adolescents diagnosed with cancer has steadily improved, with a corresponding decline in the cancer-specific death rate. The 5-year survival rate for individuals under age 18 who were diagnosed with cancer between 2010 and 2016 is 85.4 percent.
2-3 The proportion of children and adolescents diagnosed with cancer who are surviving at 5 years and 10 years varies considerably by specific cancer diagnosis.
2-4 Cancers occurring under age 18 represent a highly heterogeneous group of malignancies with unique biologic and genetic features, as well as age-, sex-, and race-specific incidence rates.
2-5 Even with the improvements realized in survival, cancer remains the leading cause of death from disease among children and adolescents in the United States.
2-6 It is estimated that as of 2020, there are approximately 500,000 individuals in the United States who were diagnosed and treated for cancer during childhood.
2-7 Although some genetic syndromes are known to increase the risk of cancer before age 18, the etiology of the majority of cancers in this age range is largely unknown.
2-8 Chronic health problems related to the toxicity of cancer treatment are common among survivors of childhood cancer, increase in prevalence with the passage of time since diagnosis, and encompass a spectrum of biomedical and psychosocial disorders.
2-9 Based on historical cohorts of survivors of childhood/adolescent cancers, the cumulative burden of multiple chronic health conditions is substantially greater in this population than is observed in individuals without a history of cancer.
2-10 Chronic and late effects of cancer treatment clearly predispose survivors to greater and more severe morbidity and premature mortality compared with age- and sex-matched controls.
Conclusions
2-1 While cancers diagnosed among those under age 18 represent less than 1 percent of all cancers diagnosed in the United States, the high proportion of survivors among this population represents individuals at high risk of experiencing serious, disabling, and life-threatening acute, chronic, and late adverse effects of cancer and its therapy.
2-2 Adult survivors of childhood cancers have a real and increasing risk of experiencing disabling conditions as a result of chronic and late effects of the cancer and its treatment.
REFERENCES
Amirian, E. S. 2013. The role of Hispanic ethnicity in pediatric Wilms’ tumor survival. Pediatric Hematology and Oncology 30:317–327.
Armenian, S. H., C. L. Sun, J. B. Teh, M. Arora, K. S. Baker, L. Francisco, S. J. Forman, and S. Bhatia. 2010. Ethnic differences in chronic health conditions after hematopoietic cell transplantation: A report from the Bone Marrow Transplant Survivor Study. Cancer 116(17):4152–4159.
Armstrong, G. T., T. Kawashima, W. Leisenring, K. Stratton, M. Stovall, M. M. Hudson, C. A. Sklar, L. L. Robison, and K. C. Oeffinger. 2014. Aging and risk of severe, disabling, life-threatening, and fatal events in the Childhood Cancer Survivor Study. Journal of Clinical Oncology 32(12):1218–1227.
Armstrong, G. T., Y. Chen, Y. Yasui, W. Leisenring, T. M. Gibson, A. C. Mertens, M. Stovall, K. C. Oeffinger, S. Bhatia, K. R. Krull, P. C. Nathan, J. P. Neglia, D. M. Green, M. M. Hudson, and L. L. Robison. 2016. Reduction in late mortality among 5-year survivors of childhood cancer. New England Journal of Medicine 374(9):833–842.
Bhakta, N., Q. Liu, K. K. Ness, M. Baassiri, H. Eissa, F. Yeo, W. Chemaitilly, M. J. Ehrhardt, J. Bass, M. W. Bishop, K. Shelton, L. Lu, S. Huang, Z. Li, E. Caron, J. Lanctot, C. Howell, T. Folse, V. Joshi, D. M. Green, D. A. Mulrooney, G. T. Armstrong, K. R. Krull, T. M. Brinkman, R. B. Khan, D. K. Srivastava, M. M. Hudson, Y. Yasui, and L. L. Robison. 2017. The cumulative burden of surviving childhood cancer: An initial report from the St. Jude Lifetime Cohort Study (SJLIFE). Lancet 390(10112):2569–2582.
Brodeur, G. M., K. E. Nichols, S. E. Plon, J. D. Schiffman, and D. Malkin. 2017. Pediatric cancer predisposition and surveillance: An overview, and a tribute to Alfred G. Kundson Jr. Clinical Cancer Research 23(11):e1–e5.
Chow, E. J., S. E. Puumala, B. A. Mueller, S. E. Carozza, E. E. Fox, S. Horel, K. J. Johnson, C. C. McLaughlin, P. Reynolds, J. Von Behren, and L. G. Spector. 2010. Childhood cancer in relation to parental race and ethnicity: A 5-state pooled analysis. Cancer 116(12):3045–3053.
Dixon, S. B., K. L. Bjornard, N. M. Alberts, G. T. Armstrong, T. M. Brinkman, W. Chemaitilly, M. J. Ehrhardt, I. Fernandez-Pineda, L. M. Force, T. M. Gibson, D. M. Green, C. R. Howell, S. C. Kaste, A. C. Kirchhoff, J. L. Klosky, K. R. Krull, J. T. Lucas Jr., D. A. Mulrooney, K. K. Ness, C. L. Wilson, Y. Yasui, L. L. Robison, and M. M. Hudson. 2018. Factors influencing risk-based care of the childhood cancer survivor in the 21st century. CA: A Cancer Journal for Clinicians 68(2):133–152.
Geenen, M. M., M. C. Cardous-Ubbink, L. C. Kremer, C. van den Bos, H. J. van der Pal, R. C. Heinen, M. W. Jaspers, C. C. Koning, F. Oldenburger, N. E. Langeveld, A. A. Hart, P. J. Bakker, H. N. Caron, and F. E. van Leeuwen. 2007. Medical assessment of adverse health outcomes in long-term survivors of childhood cancer. JAMA 297(24):2705–2715.
Gibson, T. M., S. Mostoufi-Moab, K. L. Stratton, W. M. Leisenring, D. Barnea, E. J. Chow, S. S. Donaldson, R. M. Howell, M. M. Hudson, A. Mahajan, P. C. Nathan, K. K. Ness, C. A. Sklar, E. S. Tonorezos, C. B. Weldon, E. M. Wells, Y. Yasui, G. T. Armstrong, L. L. Robison, and K. C. Oeffinger. 2018. Temporal patterns in the risk of chronic health conditions in survivors of childhood cancer diagnosed 1970-99: A report from the Childhood Cancer Survivor Study cohort. Lancet Oncology 19(12):1590–1601.
Henderson, T. O., S. Bhatia, N. Pinto, W. B. London, P. McGrady, C. Crotty, C-L. Sun, and S. L. Cohn. 2011. Racial and ethnic disparities in risk and survival in children with neuroblastoma: A Children’s Oncology Group study. Journal of Clinical Oncology 29:76–82.
Holmes, L., P. Chavan, T. Blake, and K. Dabney. 2018. Unequal cumulative incidence and mortality outcome in childhood brain and central nervous system malignancy in the USA. Journal of Racial and Ethnic Health Disparities 5:1131–1141.
Howlader, N., A. M. Noone, M. Krapcho, D. Miller, A. Brest, M. Yu, J. Ruhl, Z. Tatalovich, A. Mariotto, D. R. Lewis, H. S. Chen, E. J. Feuer, and K. A. Cronin, eds. 2019. SEER cancer statistics review, 1975-2016. Bethesda, MD: National Cancer Institute. Based on November 2018 SEER data submission, posted to the SEER web site, April 2019. https://seer.cancer.gov/csr/1975_2016/ (accessed May 6, 2020).
Hudson, M. M., K. K. Ness, J. G. Gurney, D. A. Mulrooney, W. Chemaitilly, K. K. Krull, D. M. Green, G. T. Armstrong, K. A. Nottage, K. E. Jones, C. A. Sklar, D. K. Srivastava, and L. L. Robison. 2013. Clinical ascertainment of health outcomes among adults treated for childhood cancer. JAMA 309(22):2371–2381.
Hudson, M. M., M. J. Ehrhardt, N. Bhakta, M. Baassiri, H. Eissa, W. Chemaitilly, D. M, Green, D. A. Mulrooney, G. T. Armstrong, T. M. Brinkman, J. L. Klosky, K. R. Krull, N. D. Sabin, C. L. Wilson, I. C. Huang, J. K. Bass, K. Hale, S. Kaste, R. B. Khan, D. K. Srivastava, Y. Yasui, V. M. Joshi, S. Srinivasan, D. Stokes, M. E. Hoehn, M. Wilson, K. K. Ness, and L. L. Robison. 2017. Approach for classification and severity grading of long-term and late-onset health events among childhood cancer survivors in the St. Jude Lifetime Cohort. Cancer Epidemiology, Biomarkers & Prevention 26(5):666–674.
Jacobs, A. J., E. B. Lindholm, C. F. Levy, F. D. Fish, and R. D. Glick. 2017. Racial and ethnic disparities in treatment and survival of pediatric sarcoma. Journal of Surgical Research 219:43–49.
Kadan-Lottick, N. S., K. K. Ness, S. Bhatia, and J. G. Gurney. 2003. Survival variability by race and ethnicity in childhood acute lymphoblastic leukemia. JAMA 290:2008–2014.
Kahn, J. M., K. M. Kelly, Q. Pei, R. Bush, D. L. Friedman, F. G. Keller, S. Bhatia, T. O. Henderson, C. L. Schwartz, and S. M. Castellino. 2019. Survival by race and ethnicity in pediatric and adolescent patients with Hodgkin lymphoma: A Children’s Oncology Group study. Journal of Clinical Oncology 37:3009–3017.
Krivit, W., and R. A. Good. 1957. Simultaneous occurrence of mongolism and leukemia: Report of a nationwide survey. American Journal of Diseases of Children 94(3):289–293.
Lupo, P., and L. G. Spector. 2020. Pediatric cancer: Progress and priorities. Cancer Epidemiology, Biomarkers & Prevention 29(6):1081–1094.
Lupo, P. J., J. M. Schraw, T. A. Desrosiers, W. N. Nembhard, P. H. Langlois, M. A. Canfield, G. Copeland, R. E. Meyer, A. L. Brown, T. M. Chambers, P. Sok, H. E. Danysh, S. E. Carozza, S. D. Sisoudiya, S. G. Hilsenbeck, A. E. Janitz, M. E. Oster, A. E. Scheuerle, J. D. Schiffman, C. Luo, A. Mian, B. A. Mueller, C. D. Huff, S. A. Rasmussen, M. E. Scheurer, and S. E. Plon. 2019. Association between birth defects and cancer risk among children and adolescents in a population-based assessment of 10 million live births. JAMA Oncology 5(8):1150–1158. Erratum in JAMA Oncology 5(8):1232.
NCI (National Cancer Institute). 2020. NCI dictionary of cancer terms. https://www.cancer.gov/publications/dictionaries/cancer-terms (accessed August 12, 2020).
Rebholz, C. E., R. C. Reulen, A. A. Toogood, C. Frobisher, E. R. Lancashire, D. L. Winter, C. E. Kuehni, and M. M. Hawkins. 2011. Health care use of long-term survivors of childhood cancer: The British Childhood Cancer Survivor Study. Journal of Clinical Oncology 29(31):4181–4188.
Reulen, R. C., D. L. Winter, C. Frobisher, E. R. Lancashire, C. A. Stiller, M. E. Jenney, R. Skinner, M. C. Stevens, and M. M. Hawkins; British Childhood Cancer Survivor Study Steering Group. 2010. Long-term cause-specific mortality among survivors of childhood cancer. JAMA 304(2):172–179.
Richardson, D. P., C. Daly, R. Sutradhar, L. F. Paszat, A. S. Wilton, L. Rabeneck, and N. N. Baxter. 2015. Hospitalization rates among survivors of young adult malignancies. Journal of Clinical Oncology 33(24):2655–2659.
Ripperger, T., S. S. Bielack, A. Borkhardt, I. B. Brecht, B. Burkhardt, G. Calaminus, K. M. Debatin, H. Deubzer, U. Dirksen, C. Eckert, A. Eggert, M. Erlacher, G. Fleischhack, M. C. Frühwald, A. Gnekow, G. Goehring, N. Graf, H. Hanenberg, J. Hauer, B. Hero, S. Hettmer, K. von Hoff, M. Horstmann, J. Hoyer, T. Illig, P. Kaatsch, R. Kappler, K. Kerl, T. Klingebiel, U. Kontny, U. Kordes, D. Körholz, E. Koscielniak, C. M. Kramm, M. Kuhlen, A. E. Kulozik, B. Lamottke, I. Leuschner, D. R. Lohmann, A. Meinhardt, M. Metzler, L. H. Meyer, O. Moser, M. Nathrath, C. M. Niemeyer, R. Nustede, K. W. Pajtler, C. Paret, M. Rasche, D. Reinhardt, O. Rieß, A. Russo, S. Rutkowski, B. Schlegelberger, D. Schneider, R. Schneppenheim, M. Schrappe, C. Schroeder, D. von Schweinitz, T. Simon, M. Sparber-Sauer, C. Spix, M. Stanulla, D. Steinemann, B. Strahm, P. Temming, K. Thomay, A. O. von Bueren, P. Vorwerk, O. Witt, M. Wlodarski, W. Wössmann, M. Zenker, S. Zimmermann, S. M. Pfister, and C. P. Kratz. 2017. Childhood cancer predisposition syndromes—A concise review and recommendations by the Cancer Predisposition Working Group of the Society for Pediatric Oncology and Hematology. American Journal of Medical Genetics 173(4):1017–1037.
Robison, L. L., and M. M. Hudson. 2014. Survivors of childhood and adolescent cancer: Lifelong risks and responsibilities. Nature Reviews Cancer 14(1):61–70.
Siegel, R. L., K. D. Miller, and A. Jemal. 2020. Cancer Statistics, 2020. CA: A Cancer Journal for Clinicians 70(1):7–30.
Smith, M. A., S. F. Altekruse, P. C. Adamsom, G. H. Reaman, and N. L. Seibel. 2014. Declining childhood and adolescent cancer mortality. Cancer 120(16):2497–2506.
Steliarova-Foucher, E., M. Colombet, L. A. G. Ries, P. Hesseling, F. Moreno, H. Y. Shin, and C. A. Stiller, eds. 2017. International incidence of childhood cancer, Volume III (electronic version). Lyon, France: International Agency for Research on Cancer. http://iicc.iarc.fr/results (accessed May 6, 2020).
Steliarova-Foucher, E., M. M. Fidler, M. Colombet, B. Lacour, P. Kaatsch, M. Piñeros, I. Soerjomataram, F. Bray, J. W. Coebergh, R. Peris-Bonet, C. A. Stiller, and ACCIS contributors. 2018. Changing geographical patterns and trends in cancer incidence in children and adolescents in Europe, 1991-2010 (Automated Childhood Cancer Information System): A population-based study. Lancet Oncology 19(9):1159–1169.


