
Appendix H Potential Economic Costs and Benefits of Individual Fishing Quotas to the Nation
The charge to the committee in the Sustainable Fisheries Act mandates an evaluation of the "potential social and economic costs and benefits to the nation" of individual fishing quotas (IFQs) (Sec. 108[f]). Other chapters of this report have described and elaborated on the specific effects of these programs. The purpose of this appendix is to attempt to quantify some of the costs and benefits that may accrue to the nation as a whole from the implementation of IFQ programs. The committee found it impossible to conduct a true cost-benefit analysis of any U.S. IFQ fishery because of insufficient data. The committee presents the following data and analyses as order-of-magnitude estimates. Recommendations are also presented regarding data needed to improve such estimates.
In evaluating the potential economic costs and benefits to the nation from IFQ programs, several factors need to be examined. First, calculating the benefits and costs of IFQ programs would have to take into consideration the changes in value to consumers (in terms of both product mix and quality). These calculations would require an extensive analysis of the particular fishery and therefore would go well beyond the information in this appendix. Further, although revenues generated from taxes or fees associated with an IFQ program may offset some of the monetary costs associated with administering these programs, they are not the principal benefits of an IFQ program. The real net benefits of an IFQ program consist of increases in revenues over costs, including management and enforcement costs. Tax revenue are transfers from individual entities to the government and should not be confused with real changes in net benefits to the nation. Their fiscal effects are important, however, because they provide a funding base for management and enforcement costs that are currently paid almost
exclusively from public revenue. The factors that must be assessed in order to ascertain the overall costs and benefits from the implementation of an IFQ program include the following:
- Potential generation of revenue from fees or taxes from the IFQ program;
- Potential changes in the cost of administration for the fishery;
- Potential changes in the economic efficiency of fishing operations;
- Potential changes in employment in the fishery and associated industries;
and
- Potential long-term effects on fishery-dependent communities.
In many cases, it is difficult to distinguish between costs incurred by general fishery management practices and those incurred in IFQ management. As the following analysis will shows, there are not adequate data to perform a complete cost-benefit analysis for any U.S. IFQ fishery.
Potential Revenue from Fees and Taxes
Although open-access fishery management systems may require a permit, endorsement, license, or other form of certification, fees from these systems are usually insignificant compared to the other costs required to engage in fishing (e.g., labor, gear, fuel, equipment) and usually do not generate substantial tax revenue. Exceptions, however, include among others a 2% landings tax in Alaska that provides significant revenues to local and state governments.
Several difficulties arise in assessing the potential revenues generated by IFQ management compared to other forms of fishery management. In many cases, it is difficult to obtain accurate estimates of quota price and therefore the value of the quota in the U.S. programs. The Alaskan halibut and sablefish IFQ programs have the best information available concerning variations in quota price, due in part to research conducted by the National Marine Fisheries Service (NMFS), the Alaska Commercial Fisheries Entry Commission (CFEC), and independent quota brokers, as well as the large volume of transactions.
There are several ways in which revenue can be derived from IFQ fisheries. First, the potential increases in net revenue due to the improved efficiency of the IFQ fishery can provide increased revenues to the fishery (e.g., reduced variable costs through the use of less gear and cost efficient equipment). Second, revenue can increase due to changes in harvest patterns and product forms (e.g., increased exvessel prices due to handling and closer alignment of landings with market demand). Fiscal revenue (transfers of revenues from the fishery to government), can be generated through a combination of corporate and business taxes, capital gains taxes, landings taxes, and vessel fees. The Magnuson-Stevens Act provides several mechanisms for assessing fees on the operation of IFQ fisheries. The act
specifically provides for the assessment of a fee of up to 3% of the exvessel value of the fish landed under an IFQ program (Sec. 304[d][2]). Further, up to 0.5% of the value of a limited access permit or IFQ can be collected upon registration and transfer of the title of a permit, for the operation of a limited access system administration fund, or for the general administration of the fishery from which the fee is collected (Sec. 305 [h]). Non-IFQ fisheries do not specifically provide for the assessment of additional exvessel fees, so the adoption of an IFQ program could generate significant tax revenue compared with other forms of fishery management. The following sections evaluate the potential revenues from capital gains taxes, the 3% exvessel fee, and the 0.5% registration and transfer fee. These revenue projections are limited by the terms of the Magnuson-Stevens Act. Thus, these projections do not reflect what could be possible with more liberal provisions in future amendments to the Magnuson-Stevens Act nor do these projections consider changes in state or federal corporate or other business tax receipts that could arise from increases in the profitability that are attributable to the implementation of IFQs.
Potential Revenue from Capital Gains Taxes
Capital gains taxes can be assessed on the increased value of commodities such as stocks, bonds, real estate, and other "capital assets," including IFQs. Capital gains are not subject to taxation until they are "realized," generally considered to occur when the appreciated asset is sold. To conduct an assessment of the potential revenue from capital gains taxes, it is important to have relatively accurate information on the amount of quota being traded, and the price at which the quota shares were purchased (if any), and the sale price. Unfortunately, not all IFQ fisheries have reliable transfer and price information to provide the baseline assessment of the value of quota shares. The surf clam/ocean quahog (SCOQ) IFQ program does not require that price information be reported and there are no independent brokerage firms. There has been very little trading in the wreckfish IFQ program, according to information available from the South Atlantic Fishery Management Council. Thus, capital gains are not likely to be significant.
Independent brokers are active in the Alaskan halibut and sablefish programs, and can provide data on the range of quota prices. The quality of data available and the types of data collected vary among the independent broker firms. There have been significant variations in price, and precise determinations of potential capital gains revenue are not possible without access to proprietary data. Transfer price information for any new or existing IFQ programs would improve the ability to quantify the potential capital gains revenues. Data on the number of transfers, the number of pounds transferred, and the sale price per transfer in the Alaskan halibut and sablefish IFQ program are maintained by the
TABLE H.1 Total Number and Pounds of Permanent (IFQ/QS) Transfers in the Alaskan Halibut and Sablefish IFQ Programs (1995-1997)
NMFS Restricted Access Management (RAM) Division from information provided by NMFS, CFEC, and the Alaska Department of Fish and Game (Table H.1, Figures H.1-H.4).
To determine the value of quota share (QS), data on the number of transfers, the amount of quota transferred, and the price of the transfer are required. Unfortunately, the data available from both NMFS and independent quota brokers are not sufficiently detailed to provide an accurate determination of the value of the quota. Data on the ranges of quota market prices were provided to the committee by the CFEC and one of the larger IFQ brokerage firms, Access Unlimited, Inc. (Tables H.2-H.4). The actual transaction prices vary depending on the negotiating positions of the buyer and seller and seasonal fluctuations in the market. Prices offered for quota may also vary depending on whether the quota offered is blocked or unblocked, and the relative size of the quota share being offered. Typically, unblocked quota shares sell for higher prices. Additionally, prices offered for quota shares for small-vessel classes (Class D) tend to be lower than for larger-vessel classes (Class C and B), although these trends seem to have been affected by regulations allowing Class C and B quota to be used, or "fished-down," on smaller vessels (Class D).
Providing a range of the total value of the quota is necessary because it is not appropriate to assume that the average price of the quota is the mean of the minimum and maximum values reported. The information provided comes from a larger IFQ brokerage firm; however, trades also occur outside brokerage firms. The indication from testimony and information provided to the committee is that these trades may occur at a lower price than those conducted through a brokerage firm.
Several general trends can be inferred from the market price of quota share in the Alaskan halibut and sablefish IFQ programs. As might be anticipated, the price of quota was lower during the first year of the program than in subsequent

Figure H.1
Number of permanent (IFQ/QS) transfers per International Pacific Halibut Commission (IPHC) regulatory area in the Alaskan halibut IFQ program (1995-1997). NOTES: Transfers to surviving spouses are excluded. Permanent transfers include sweep-ups (even to the same person). Source: NMFS RAM Division.
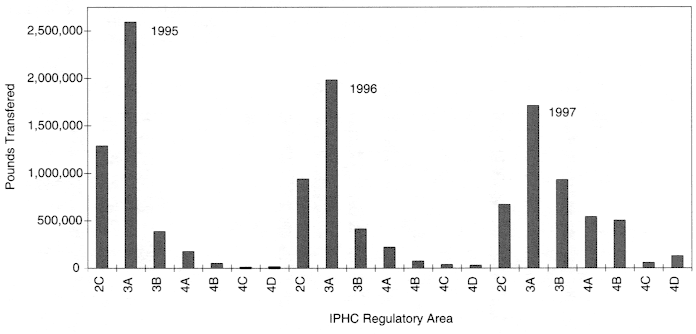
Figure H.2
Pounds of permanent (IFQ/QS) transfers per International Pacific Halibut Commission (IPHC) regulatory area in the Alaskan halibut IFQ program (1995-1997). NOTES: Transfers to surviving spouses are excluded. Permanent transfers include sweep-ups (even to the same person). Pounds are the pounds actually transferred and may not necessarily equal the pounds of landings that the quota transferred will yield in a given year. Source: NMFS RAM Division.
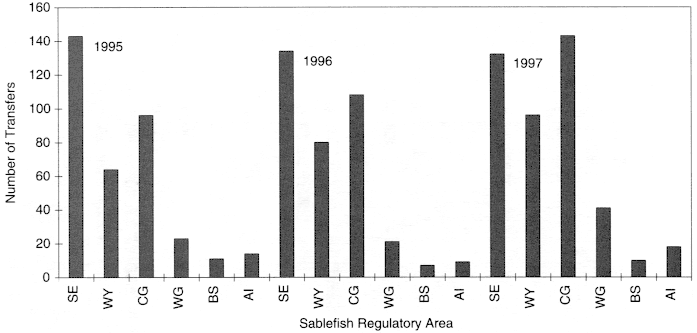
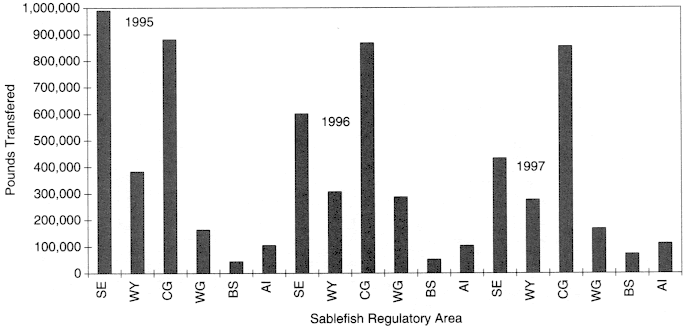
Figure H.4
Pounds of permanent (IFQ/QS) transfers per sablefish regulatory area in the Alaskan sablefish IFQ program (1995-1997). NOTES: Transfers to surviving spouses are excluded. Permanent transfers include sweep-ups (even to the same person). Pounds are the pounds actually transferred and may not necessarily equal the pounds of landings that the quota transferred will yield in a given year. Source: NMFS RAM Division.
TABLE H.2 1995 Market Prices of Permanent (IFQ/QS) Transfers per International Pacific Halibut Commission (IPHC) and Sablefish Regulatory Area per Quarter in the Alaskan Halibut and Sablefish IFQ Programs
|
|
|
2nd Quarter (price/pound) |
3rd Quarter (price/pound) |
4th Quarter (price/pound) |
|||
|
Species |
Area (vessel class) |
High |
Low |
High |
Low |
High |
Low |
|
Halibut |
2C (D) |
$7.50 |
$6.00 |
$7.90 |
$6.00 |
$7.75 |
$5.00 |
|
|
2C (C) |
$9.25 |
$8.50 |
$9.25 |
$8.25 |
$9.00 |
$7.75 |
|
|
2C (B) |
$9.25 |
$8.50 |
$9.25 |
$8.25 |
$9.00 |
$7.75 |
|
|
3A (D) |
$8.00 |
$6.00 |
$7.25 |
$6.00 |
$7.00 |
$5.00 |
|
|
3A (C) |
$8.50 |
$7.75 |
$8.50 |
$7.25 |
$8.00 |
$7.00 |
|
|
3A (B) |
$8.00 |
$7.25 |
$8.50 |
$7.25 |
$7.75 |
$6.75 |
|
|
3B (D) |
$7.75 |
$6.00 |
$8.25 |
$6.00 |
$6.75 |
$5.50 |
|
|
3B (C) |
$7.75 |
$6.00 |
$8.25 |
$7.25 |
$7.25 |
$6.75 |
|
|
3B (B) |
$8.25 |
$7.75 |
|
|
|
|
|
Sablefish |
SE (C) |
$8.10 |
$5.50 |
$8.00 |
$5.50 |
$8.00 |
$5.50 |
|
|
SE (B) |
$8.00 |
$7.50 |
$7.50 |
$7.00 |
$7.50 |
$7.00 |
|
|
WY (C) |
$8.10 |
$5.50 |
$8.00 |
$5.50 |
$8.00 |
$5.50 |
|
|
WY (B) |
$8.00 |
$7.50 |
$7.50 |
$7.00 |
$7.50 |
$7.00 |
|
|
CG (C) |
$7.25 |
$5.50 |
$7.25 |
$5.50 |
$7.25 |
$5.50 |
|
|
CG (B) |
$7.25 |
$6.25 |
$7.25 |
$6.75 |
$7.25 |
$6.75 |
|
|
WG (C) |
$6.50 |
$5.50 |
$6.50 |
$5.50 |
$6.50 |
$5.50 |
|
|
WG (B) |
$6.50 |
$5.50 |
$6.50 |
$5.50 |
$6.50 |
$5.50 |
|
NOTES: 1. Refer to Appendix G for maps displaying the halibut and sablefish regulatory areas. 2. No trades were recorded in the first quarter since the program was not fully implemented until March 1995. 3. Market prices for halibut regulatory areas 4A-4D, sablefish regulatory areas Al (Aleutian Islands) and BS (Bering Sea), and vessel class A are not reported because data on market prices for quota for these vessels and regions are not sufficiently complete. Moreover, Class A transfers represent a small fraction of the total quota share transferred. 4. Market prices are derived from values reported by IFQ brokerage firms. The actual price of quota may vary from these ranges. The high and low designations are subjective definitions provided by the brokerage firms and do not correspond to the average price of quota shares transferred. Both blocked and unblocked quota are considered within the price ranges given. 5. Sablefish regulatory areas: SE (Southeast), WY (West Yakutat), CG (Central Gulf), WG (Western Gulf). 6. Halibut vessel Class B = catcher vessel greater than 60 feet in length; halibut vessel Class C = catcher vessel between 60 and 35 feet in length; halibut vessel Class D = catcher vessel less than 35 feet in length. 7. Sablefish vessel Class B = catcher vessel greater than 60 feet in length; sablefish vessel Class C = catcher vessel less than 60 feet in length. SOURCE: Access Unlimited, Inc. |
|||||||
TABLE H.3 1996 Market Prices of Permanent (IFQ/QS) Transfers per International Pacific Halibut Commission (IPHC) and Sablefish Regulatory Area per Quarter in the Alaskan Halibut and Sablefish IFQ Programs
|
|
|
1st Quarter (price/pound) |
2nd Quarter (price/pound) |
3rd Quarter (price/pound) |
4th Quarter (price/pound) |
||||
|
Species |
Area (vessel class) |
High |
Low |
High |
Low |
High |
Low |
High |
Low |
|
Halibut |
2C (D) |
$7.50 |
$5.00 |
$10.00 |
$6.50 |
$9.10 |
$8.25 |
$9.25 |
$8..25 |
|
|
2C (C) |
$8.50 |
$6.50 |
$10.75 |
$6.50 |
$10.00 |
$9.00 |
$10.00 |
$9.00 |
|
|
2C (B) |
$9.10 |
$8.75 |
|
|
|
|
|
|
|
|
3A (D) |
$7.50 |
$5.00 |
$8.00 |
$6.00 |
$8.00 |
$6.75 |
$8.50 |
$7.00 |
|
|
3A (C) |
$8.00 |
$7.00 |
$10.00 |
$6.50 |
$10.00 |
$6.75 |
$11.00 |
$7.50 |
|
|
3A (B) |
$8.00 |
$6.75 |
$10.00 |
$7.00 |
$10.00 |
$6.75 |
$11.00 |
$7.50 |
|
|
3B (D) |
$6.75 |
$5.25 |
$7.00 |
$5.75 |
|
|
|
|
|
|
3B (C) |
$8.00 |
$6.00 |
$7.50 |
$6.75 |
$9.50 |
$6.00 |
$12.00 |
$7.50 |
|
|
3B (B) |
$7.25 |
$6.50 |
$7.50 |
$6.00 |
$9.50 |
$6.00 |
$12.00 |
$7.50 |
|
Sablefish |
SE (C) |
$8.00 |
$5.00 |
$9.00 |
$6.50 |
$9.00 |
$7.25 |
$9.00 |
$7.25 |
|
|
SE (B) |
$9.00 |
$7.00 |
$7.75 |
$7.00 |
$9.00 |
$7.25 |
$9.00 |
$7.25 |
|
|
WY (C) |
$7.75 |
$5.00 |
$9.00 |
$7.25 |
$9.00 |
$7.25 |
$9.00 |
$7.25 |
|
|
WY (B) |
$9.00 |
$7.00 |
$7.75 |
$7.00 |
$9.00 |
$7.25 |
$9.00 |
$7.25 |
|
|
CG (C) |
$8.00 |
$5.50 |
$7.00 |
$5.75 |
$7.25 |
$5.75 |
$8.00 |
$5.75 |
|
|
CG (B) |
$8.00 |
$5.50 |
$7.25 |
$5.75 |
$7.25 |
$5.75 |
$8.00 |
$5.75 |
|
|
WG (C) |
$6.75 |
$5.25 |
$6.75 |
$5.25 |
$6.75 |
$5.25 |
$6.75 |
$6.50 |
|
|
WG (B) |
$6.75 |
$5.25 |
$6.75 |
$5.25 |
$6.75 |
$5.25 |
$6.75 |
$6.50 |
|
NOTES: See notes for Table H.2. SOURCE: Access Unlimited, Inc. |
|||||||||
TABLE H.4 1997 Market Prices of Permanent (IFQ/QS) Transfers per International Pacific Halibut Commission (IPHC) and Sablefish Regulatory Area per Quarter in the Alaskan Halibut and Sablefish IFQ Programs
|
|
|
1st Quarter (price/pound) |
2nd Quarter (price/pound |
3rd Quarter (price/pound |
4th Quarter (price/pound) |
||||
|
Species |
Area (vessel class) |
High |
Low |
High |
Low |
High |
Low |
High |
Low |
|
Halibut |
2C (D) |
$9.50 |
$8.50 |
$9.50 |
$8.50 |
$12.00 |
$8.00 |
$12.50 |
$8.00 |
|
|
2C (C) |
$12.00 |
$9.00 |
$13.00 |
$9.00 |
$15.00 |
$10.00 |
$15.00 |
$10.00 |
|
|
2C (B) |
$12.00 |
$9.00 |
|
|
$15.00 |
$10.00 |
$15.00 |
$9.00 |
|
|
3A (D) |
$8.50 |
$7.50 |
$8.00 |
$6.50 |
$10.50 |
$6.50 |
$11.50 |
$6.50 |
|
|
3A (C) |
$11.50 |
$7.00 |
$12.25 |
$6.50 |
$12.00 |
$6.50 |
$13.00 |
$6.50 |
|
|
3A (B) |
$11.50 |
$7.00 |
$12.25 |
$7.00 |
$12.00 |
$6.50 |
$13.00 |
$6.50 |
|
|
3B (D) |
$8.25 |
$7.50 |
$8.00 |
$6.75 |
$10.00 |
$6.00 |
$9.50 |
$6.00 |
|
|
3B (C) |
$12.00 |
$7.50 |
$11.50 |
$7.50 |
$12.00 |
$6.00 |
$12.00 |
$6.00 |
|
|
3B (B) |
$12.00 |
$7.50 |
$12.00 |
$7.50 |
$12.00 |
$6.00 |
$12.00 |
$6.00 |
|
Sablefish |
SE (C) |
$10.00 |
$7.25 |
$10.50 |
$7.25 |
$13.50 |
$7.25 |
$15.00 |
$7.75 |
|
|
SE (B) |
$10.00 |
$7.25 |
$10.50 |
$7.25 |
$13.50 |
$7.25 |
$14.00 |
$7.75 |
|
|
WY (C) |
$9.00 |
$5.00 |
$10.00 |
$7.25 |
$11.50 |
$7.25 |
$14.00 |
$7.25 |
|
|
WY (B) |
$9.00 |
$7.00 |
$10.00 |
$7.25 |
$12.50 |
$7.25 |
$14.50 |
$7.25 |
|
|
CG (C) |
$10.00 |
$5.75 |
$10.00 |
$5.75 |
$9.00 |
$5.50 |
$12.00 |
$5.50 |
|
|
CG (B) |
$10.00 |
$5.75 |
$10.00 |
$5.75 |
$11.75 |
$5.75 |
$13.25 |
$5.50 |
|
|
WG (C) |
$6.75 |
$6.50 |
$6.75 |
$5.25 |
$8.50 |
$5.00 |
$8.50 |
$5.00 |
|
|
WG (B) |
$6.75 |
$6.50 |
$6.75 |
$5.25 |
$8.50 |
$5.00 |
$9.50 |
$6.50 |
|
NOTES: See notes for Table H.2. SOURCE: Access Unlimited, Inc. |
|||||||||
years due to several factors. Litigation pending by the Alliance Against IFQs, the unfamiliarity of lenders with the IFQ programs and the risks involved, the newness of the program, and the fishermen's lack of familiarity with the regulations concerning quota exchange all contributed to create market conditions that did not favor significant long-term capital risks. As might be anticipated, the confidence of lenders has increased as the price of quota has increased. As the program has continued, familiarity with it has improved, and litigation has been appealed and denied. Additional factors such as an increased exvessel price of product or shifts in the markets from frozen product to higher-priced fresh product have most likely also contributed to increased quota prices. In recent months, the economic instability of Asian financial markets has affected seafood imports and may be reflected in fluctuations in quota prices.
The prices of quota share in the future may be affected by a wide range of factors. As an example, recent drops in exvessel prices in halibut, due in part to large stock size, increased total allowable catch (TAC), and a large inventory of frozen product, could cause fluctuations in quota price. Lower exvessel prices in sablefish have also been observed, possibly due in part to the unfavorable market conditions in Japan and other Asian countries that are the principal markets for this product. Future quota prices for sablefish may continue to reflect these conditions. The implementation of the North Pacific Loan Program provided for in the Magnuson-Stevens Act (Sec. 108[g]) has recently been announced, and loans to entry-level fishermen of approximately $5,000,000 are anticipated to be available for fiscal year 1998. These loans (having favorable interest rates) may also affect the price of quota share, particularly for smaller amounts of quota. Tables H.2-H.4 summarize the quarterly market values of quota traded in the Alaskan halibut and sablefish IFQ programs and provide an indication of the range of variation in market price since the inception of the program.
It is important to note that capital gains taxes can be assessed on any sale of quota shares that results in a capital gain. In the case of initially allocated quota, the entire value of the quota sold would be subject to capital gains taxes. In the case of quota that is purchased and sold, only the net capital gain (the sale price less the original purchase price) would be subject to taxation. It is difficult to determine the precise amount of revenue generated from capital gains taxes on the sale of quota for several reasons:
- Not all quota is sold. In the case of the Alaskan halibut and sablefish IFQ programs there have been numerous in-kind trades, particularly during the first two years of the program. These exchanges included trades for shares of quota in other regions or exchanges for other limited access permits (e.g., salmon or herring permits). These exchanges are not subject to capital gains taxation. In some cases, quota may be transferred in exchange for a percentage of the harvest revenue, gear, or other equipment, and these agreements also would not be subject to capital gains taxation. However, trades that included goods and services
- may be easily transferred to cash, and thus could be subject to other forms of taxation.
- In some cases, the sale of quota was between family members, and thus, price for the quota may have been substantially lower than its market value, and the amount of capital gains revenue collected would have been much lower than that generated from quota shares traded on the open market. However, these exchanges could be subject to other forms of taxation as gifts or inheritance.
- The price of quota differs between the various classes, regions, and the times of sale. As an example, the prices for quota in more desirable regions for halibut and sablefish tend to be higher (e.g., halibut in Area 2C, sablefish in Area SE; Tables H.2-H.4).
- Purchased IFQs are considered a depreciable asset. Any purchased quota shares will depreciate by 1/15th of its purchase price value per year. After 15 years or more, the potential tax revenue from capital gains taxes that could be collected from the sale of quota will be on the entire sale value of the quota, just like shares received through an initial allocation. Only a portion of sold quota shares is subject to capital gains taxes before 15 years, with the portion of the asset taxed increasing over time.
An accurate determination of the potential revenue generated by capital gains tax in the Alaskan halibut and sablefish IFQ programs would require more accurate information on the price and amounts of quota traded than is available through existing sources of data. The committee recommends mandatory reporting of information on the price of quota exchanges, in the format appropriate for determining the value of the quota sold for all individual fishing quota and limited access programs so that the potential tax revenue from these programs can be calculated accurately.
Because of the difficulty of determining the total amount of quota that could be subject to capital gains taxes, the committee was unable to determine the precise amount of tax revenue generated. Nevertheless, simple calculations suggest that at current market prices of about $7.50 per pound of halibut QS and $10.00 per pound of sablefish QS, the total asset value of QS holdings is on the order of $2-3 billion for halibut QS and $3-4 billion for sablefish QS. Consequently, there is substantial potential for capital gains revenues. Efforts to quantify the amount of capital gains tax revenue generated by the trade of IFQs should be encouraged, and future programs could be designed to provide data that would estimate the revenues generated from quota trading (e.g., using zero-revenue auctions; See Chapter 6).
Potential Revenue From a 3% Exvessel Landing Fee
A preliminary analysis of the potential future revenue from a 3% exvessel landing fee requires knowledge about both the amount of fish landed and the average exvessel price of the fish. The variability in stock conditions and harvest
TABLE H.5 Potential Revenue From the 3% Exvessel Fee for the Surf Clam, Ocean Quahog, Wreckfish, Halibut, and Sablefish IFQ Fisheries Based on Total Harvest and Average Exvessel Price
size and variability in price make it difficult to predict the exact amount of revenue that will be generated by the 3% exvessel fee.
A historical analysis of the stock assessments for IFQ fisheries indicates that there is substantial interannual variability in the level of the stocks. The TAC set for a given year reflects this variation. In providing an estimate of potential revenue, a range of TACs reflecting historical data is used as a basis of assessing potential catches. Based on 1996 or 1997 harvest levels and the average exvessel price, the revenues from the 3% fee are described in Table H.5.
Potential Revenue from a 0.5% Registration and Transfer Fee1
The potential revenue generated from a 0.5% registration and transfer fee value will vary widely depending on the amount and value of quota traded. It is
not possible to determine precisely the potential revenue generated from this fee unless the amount of each sale is recorded and available in a centralized data source. Because of these considerations, the committee was not able to estimate precisely the potential revenue generated from the 0.5% fee. The Alaskan halibut and sablefish fishery has the best available data for assessing the potential revenue from a 0.5% registration and transfer fee. However, an analysis of the potential revenue generated from the 0.5% fee in the Alaskan halibut and sablefish IFQ programs is problematic for several reasons:
- Historic transactions may not reflect future quota share prices or trade volume.
- The high level of uncertainty regarding IFQ markets and the relatively short time that this program has been in operation limit the precision of estimates based on previous exchanges for determining potential future revenue.
- A precise evaluation of the potential revenue from past transfers would require access to proprietary data on the actual price paid by the purchasers of the quota. By assuming that a 0.5% fee would be assessed once for both the transfer and the registration of the quota, the cost could be split between the purchaser and the seller of the quota.
General Considerations for Assessing Quota Value
To determine the potential value of the quotas in an IFQ program, it is important to note that the value of the quota depends on a wide range of factors, including the stability of the market, the accessibility of capital (in turn affected by the confidence of lenders in the security of quota share as a financial instrument and any IFQ-specific loan programs), the degree of consolidation and the incentives and disincentives for consolidation, and the financial situation of the seller. It is likely that the more freely transferable a quota share is, the more likely it is to be traded, and the higher is the potential revenue generated from capital gains taxes and the 0.5% transfer fee. The revenue generated by the fees assessed under an IFQ program is greater than the revenue generated by fees generated under open-access fisheries (essentially zero). Even if a similar 3% exvessel landings fee were assessed on open-access fisheries, IFQs and other limited entry permits provide capital gains tax revenue that are not available from open-access fisheries.
Potential Changes in the Cost of Administration for the Fishery
Both the literature and the experiences of other nations indicate that the implementation of IFQ programs may increase the cost of managing a given fishery. Increases in administrative costs in U.S. fisheries may be due to in-
creases in the costs of development of regulations for a new program, additional evaluation by the NMFS General Counsel, and increases in staff time required at the regional councils and among NMFS and Coast Guard staff for administration, monitoring, and enforcement. Another cost of such systems is the cost of data collection, management, and distribution. Efforts to include a wider range of potential participants in the development and implementation of IFQ programs will require additional meetings and other activities that could add to the development costs of a program.
In particular, the enforcement of an IFQ program may be more costly than for an open-access fishery. Because IFQ programs rely on the accurate reporting of individual catch and landing data, unless these data are already collected in existing management systems, new enforcement and monitoring activities may be needed. Depending on the nature of the fishery, these costs could be significantly greater than for an existing management regime. In general, fisheries with a large number of participants with small vessels, landing at numerous ports in regions with easy access to markets for unprocessed product (e.g., New England fisheries, Gulf of Mexico shrimp) will be the most difficult to monitor and enforce. Fisheries with these characteristics would require greater increases in expenditures to provide adequate monitoring and enforcement. Moreover, the same conditions that facilitate misreporting or cheating in an IFQ fishery are likely to encourage similar behavior in other non-IFQ management regimes. It is difficult to determine the appropriate level of monitoring and enforcement for a given fishery, although regional councils and fishermen in the region are likely to be able to determine what types of monitoring and enforcement programs would have to be designed for a given fishery.
A preliminary analysis of the cost of the existing management of the Alaskan halibut and sablefish IFQ programs follows. These programs were chosen because data are more readily available and more detailed than for either the SCOQ or the wreckfish IFQ programs. Based on data provided by the NMFS RAM Division, the NMFS Enforcement Division, and U.S. Coast Guard responsible for overseeing IFQ enforcement, it is clear that there were significant new expenditures for personnel, contractual services related to the establishment and maintenance of computer technology, and the computerized transaction terminals that were used in this IFQ program. Table H.6 provides the actual and projected costs of the RAM Division, Office of Administrative Appeals (OAA), and NMFS enforcement for the Alaskan halibut and sablefish IFQ programs. It should be kept in mind that in some cases, enforcement personnel also provide services to non-IFQ fisheries so that the numbers presented in Table H.6 are maximum numbers. In the case of the RAM Division, the tasks assigned to personnel also include other limited access management programs, and some of the personnel costs indicated here would include expenditures for activities other than IFQ management.
TABLE H.6 Actual and Projected Implementation and Maintenance Costs for the Alaskan Halibut and Sablefish IFQ Programs for the RAM Division, the OAA, and NMFS Enforcement (thousands of dollars)
The data in Table H.6 do not include the costs that may be incurred by other agencies involved with the management and enforcement of the halibut and sablefish fisheries, such as the U.S. Coast Guard (USCG) and the North Pacific Fishery Management Council (NPFMC). Although other agencies—such as the Alaska Department of Fish and Game, the Commercial Fisheries Entry Commission, and the International Pacific Halibut Commission (IPHC)—all have some involvement in the management of the IFQ fisheries, the committee assumed that expenditures by these agencies dedicated to halibut and sablefish management were not significantly higher under IFQ management than under the previous open-access system. A more precise estimate of the management costs for the halibut and sablefish fisheries would have to consider the budgets of these agencies in more detail.
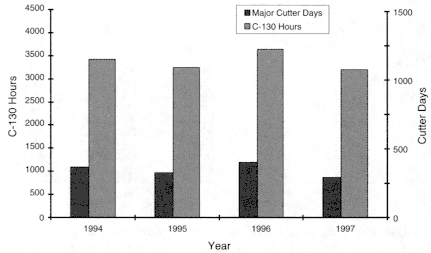
Figure H.5
Number of major cutter days and C-130 hours dedicated to fisheries enforcement by Coast Guard District 17 in the North Pacific region. Source: USCG, 17th District.
In the case of the Coast Guard, since the implementation of the IFQ programs, the number of search and rescue (SAR) operations has decreased dramatically (see Table 3.2). Overall, the total vessel and aircraft time dedicated to fisheries enforcement in Coast Guard District 17 activity has been relatively steady for the past few years (Figure H.5). The halibut fishery has the largest number of vessels in the North Pacific region, and it would be expected that significant efforts would have to be dedicated to enforcement and monitoring operations for this fleet as the season lengthens.
Both ship time and aircraft hours dedicated to enforcement operations in the halibut and sablefish fisheries have increased with the implementation of IFQ programs (Figures H.6-H.7). However, in 1997, the overall time spent in fisheries enforcement operations in the Alaskan halibut and sablefish IFQ fisheries decreased from the 1995-1996 period, possibly as a result of improved enforcement techniques, shifting enforcement operations to other fisheries, or other unrelated events. Based on Coast Guard data, it appears that both the total number of fisheries violations and the percentage of boardings resulting in violations have decreased with the implementation of IFQ programs (Figure H.8).
An average price per hour for aircraft and vessel operations was determined based on data from the U.S. Coast Guard and used to estimate enforcement costs prior to and following the implementation of IFQs. These costs reflect the time allocated to fisheries enforcement operations categorized by the Coast Guard for the halibut and sablefish fisheries, but do not include expenditures by the Coast
Figure H.6
Number of vessel (major cutters, patrol boats, buoy tenders) days dedicated to fisheries enforcement by Coast Guard District 17 in the Alaskan halibut and sablefish fisheries. Source: USCG, 17th District.
Figure H.7
Number of aircraft (HU-25, C-130, helicopter) hours dedicated to fisheries enforcement by Coast Guard District 17 in the Alaskan halibut and sablefish fisheries. SOURCE: USCG, 17th District.
Figure H.8
Number of boardings and fishery violations reported by Coast Guard District 17 in the Alaskan halibut and sablefish fisheries. Source: USCG, 17th District.
Guard for dockside enforcement operations or any increases in personnel costs that may be required to support the increased level of vessel operations in these fisheries. These costs are provided in Table H.7.
From the data provided, overall vessel and aircraft enforcement costs have increased under IFQ management for operations in Coast Guard District 17. However, it appears that these costs were reduced in 1997 compared with the 1995-1996 period, possibly due to improved techniques, increased familiarity with enforcement requirements by fishermen, and/or a shift of enforcement efforts to dockside operations or other fishery operations, drug interdiction efforts, or other missions requiring the reallocation of assets. The estimated costs may not reflect the total costs of all enforcement operations; however, they should indicate the relative trends in enforcement expenditures. Both the Coast Guard and the NPFMC should monitor future trends in enforcement costs in order to provide a long-term perspective of the potential costs of the enforcement of IFQ programs over time.
It should be noted that the costs derived from this analysis are not necessarily applicable to other fisheries. The halibut and sablefish IFQ fisheries are conducted in a relatively remote region by more than 2,000 vessels under potentially hazardous weather conditions, in a region with relatively high operating costs. It is reasonable to assume that enforcement costs under any IFQ regime will be higher if there are a large number of small vessels operating in remote areas.
Table H.7 Enforcement Costs for the Operation of Vessels and Aircraft in the Alaskan Halibut and Sablefish IFQ Program Reported by Coast Guard District 17
Comparison of Potential Revenue and Anticipated Expenditures
Without detailed information about the amount of capital gains revenue or changes in corporate or business tax revenues, it is not possible to precisely quantify the potential fiscal revenue from the Alaskan IFQ programs. Although the total revenue from the Alaskan halibut and sablefish IFQ fisheries cannot be precisely quantified given the existing data, the program does have the potential to generate revenue through a variety of taxes and fees. The cost of management conducted prior to implementation of the program did not have cost recovery fees specifically associated with it.
No attempt was made to determine whether the revenues generated from the SCOQ and wreckfish IFQ fisheries were sufficient to cover the additional administrative costs that have been incurred in managing these fisheries because clearly definable costs attributable to the IFQ management of these programs and accurate price data were not available. It does appear, based on testimony and our analyses, that IFQ management is likely to be more costly than traditional forms of management. However, it is likely that IFQ-managed fisheries could provide a positive net revenue flow to the nation if the capital gains revenue and changes in corporate and business tax revenues are sufficiently high and if the 3% exvessel fee and 0.5% registration and transfer fee are implemented. Again, the calculations used here assume the maximum fee provided for under the Magnuson-Stevens Act; higher or lower fees will affect the revenue generated.
It should be noted that the Magnuson-Stevens Act authorizes up to 25% of the fees collected under the mandated 3% exvessel fee in existing IFQ programs to be used to aid in financing the purchase of IFQs by fishermen who fish from small vessels or who are the first-time purchasers of quota (Sec. 304[d]). In the North Pacific region, these fees are mandated to be used to finance small-vessel (Classes B, C, and D) and entry-level fishermen (fishermen who do not own halibut and sablefish IFQ, who harvest less than 8,000 pounds in a given year, and who participate aboard a vessel) in the Alaskan halibut and sablefish IFQ programs (Sec. 108[g][2]). Additionally, fees collected under the assessment of the 0.5% transfer fee must be used for the implementation of a central registry system for limited access system permits and for administering and implementing the Magnuson-Stevens Act provisions for the fishery in which the fee is assessed (Sec. 305[h]). The specific use of the fee is determined by the Secretary of Commerce (Sec. 305[h]). These reallocations of funds could reduce the total amount of revenue that could be used for the general management of an IFQ program.
Although it is difficult to predict the costs of implementing other IFQ programs, it is possible that if more programs were implemented, costs would be reduced based on experiences with previous programs. In addition, facilities developed for monitoring existing IFQ programs might be extended to additional programs with little additional costs. For example, the computerized transaction
terminals used in the Alaskan halibut and sablefish IFQ programs could be used for recording landings of additional species in other programs with little or no increase in hardware costs if those fisheries used similar ports and facilities. It is reasonable to assume that if IFQ management were attempted in regions with significant IFQ experience and infrastructure, the costs of initial implementation would be lower than for previously implemented programs. Further, it is likely that if IFQs were implemented for large fisheries with fewer vessels, a well-organized biological data gathering system, limited enforcement costs, and high exvessel revenues (e.g., Alaskan pollock), the capital gains taxes and exvessel fees assessed from these larger fisheries would be more than sufficient to cover additional administrative costs and could generate significant net tax revenue to the nation, as well as potentially improving the operational efficiency of these fisheries.
For fisheries with large numbers of vessels and complicated enforcement, IFQ-based management could be more costly than traditional forms of management if fees assessed are significantly lower than the costs of additional enforcement that may be required under IFQ management. It should be noted that other forms of limited access management may be equally costly; however, unlike IFQ programs, other limited access programs do not have specific cost recovery fees established and may consequently have higher net costs than IFQ management. If there are sufficient data to determine both the costs and the revenues generated by IFQ programs, it could be possible to determine the total costs of a program and the revenue required to offset these costs.
Potential Changes in the Economic Efficiency of Fishing Operations
The committee heard testimony that the implementation of IFQ programs has provided an opportunity for improved economic efficiency in fishing operations. Measuring how the change in management regime might affect the economic efficiency of fishery operations requires reasonably accurate information on changes in the costs and revenues of fishing operations. Since many of these data are proprietary and not available, precise estimates of the potential effects of IFQ management on economic efficiency are not possible. However, the committee heard testimony from both proponents and opponents of IFQ management that fishing operations had changed with the implementation of IFQ programs. The increased revenues generated by the improved economic efficiency of fishing operations will be one of the principal benefits of an IFQ program; however, quantifying these benefits is difficult.
Many participants in IFQ fisheries indicated that under IFQ management, fishing operations could be modified to take advantage of more favorable weather conditions, and better exvessel prices or to accommodate opportunities in other fisheries, reducing the costs or increasing the revenues of operating a vessel. A
Figure H.9
Estimate of halibut killed by lost and abandoned longline gear in the 1991-1997 Alaskan commercial halibut fishery (IPHC regulatory Areas 2C-4).
SOURCES: Gilroy et al. (1996); IPHC (1997).
number of individuals in the Alaskan halibut and sablefish IFQ fisheries noted that because of these changes, they were able to use less gear, lost less gear, and realized significant savings over pre-IFQ gear expenditures. This information seems to be corroborated by data from IPHC, where the ratios of gear (skates) lost to gear used (skates hauled) in Alaskan halibut regulatory Areas 2C and 3A are similar to the ratios observed in the Canadian halibut individual vessel quota (IVQ) fishery in regulatory Area 2B (IPHC, 1997). Figure H.9 summarizes the estimates provided by IPHC on the pounds of halibut killed in the Alaskan halibut fishery from lost or abandoned longline gear. Since the inception of the halibut IFQ program in 1995, there appears to be a significant decrease in the number and pounds of halibut killed due to ghost fishing. These values may be indicative of savings in the Alaskan sablefish fishery, which uses similar gear and techniques.
Some vessel owners in the fishery stated that costs for fuel, food, and other supplies had also been reduced due to the longer time for preparation, improved planning opportunities, and ability to travel to port to obtain supplies as needed. A number of vessel owners stated that in the derby fisheries, spares of all types of equipment had to be carried aboard so that repairs could be made at sea and fishing operations continued because the day-long open season had to be utilized fully. Some vessel owners stated that with the advent of the IFQ programs, less nonessential equipment had to be carried aboard and the costs and space required to carry this equipment had been reduced and unneeded equipment could be sold. Some of this testimony is corroborated by surveys of vessel owners in the halibut
and sablefish IFQ program conducted by the CFEC, indicating that after the first year of the IFQ program (1995), costs for repairs, gear, and insurance had dropped and costs for fuel, ice, and food had increased slightly (Knapp and Hull, 1996).
The most significant increase in operating costs appears to be the purchase of quota itself. The committee was not able to gather sufficient data to compare the costs of quota purchase to the savings reported in equipment, fuel, and gear costs. Assessment of both the 3% exvessel fee and the 0.5% registration and transfer fee will also add to the overall cost of harvesting halibut and sablefish in the IFQ programs. Once these fees are assessed, their effects on the profitability of fishing operations will have to be considered.
Other changes in the efficiency of fishing operations seem to have developed in some of the fisheries. Participants in the wreckfish and Alaskan halibut and sablefish IFQ fisheries stated that because of the changes in fishing operations and the ability to provide more marketable fresh product more consistently, opportunities existed to expand operations into the wholesaling and marketing of product.
As might be anticipated, some of the changes in the patterns of product delivery negatively affected the operations of processors. The committee heard testimony that some processors in the SCOQ and the Alaskan halibut and sablefish IFQ programs felt that the shift from large pulses of product to a more even product flow had disadvantaged some of their operations. However, it appears that not all types of processing operations were equally affected by these shifts in product flow. Some processors in the Alaskan halibut and sablefish IFQ fisheries were not significantly disadvantaged by the changes in product flow. The committee did not hear specific testimony on those operations that appeared to have experienced reduced revenue with the shift to an IFQ fishery; however, it is reasonable to assume that processing operations that had relied on large pulses of product for processing for the frozen market and had failed to modify their operations to accommodate the longer IFQ season would be less profitable as season lengthened. Similarly, processing operations that shifted to accommodate longer seasons and the increasing availability of fresh product could maintain more profitable operations. From testimony received from the processing industry, it is not clear that all processing operations will be economically disadvantaged with the shift to an IFQ-managed fishery. Moreover, with changes in both exvessel and wholesale prices, it is unclear whether processor revenues have increased or decreased.
The North Pacific Fishery Management Council conducted an analysis of the potential economic effects of implementing IFQ programs for halibut and sablefish prior to their implementation (NPFMC, 1997b). These analyses indicated that the implementation of IFQ programs for these fisheries could result in significant increases in revenue due to (1) increased product quality and exvessel price; (2) decreased processing and marketing costs; (3) decreased fishing mortality due to lost gear; (4) reduction in the redundant gear costs; (5) improved
efficiency of harvesting operations; (6) decreases in discard mortality of bycatch (specifically rockfish and sublegal halibut); and (7) decreased discard of incidental harvests of halibut in the sablefish fisheries.
Potential Changes in Employment in the Fishery and Associated Industries
The committee received testimony that the implementation of IFQ programs can affect the number of crew positions and total employment in a fishery. A more detailed discussion of the findings concerning the changes in crew employment and number of vessels in the fishery is found in Appendix G. Several vessel owners and crew members mentioned that the number of crew members had been reduced with the implementation of the halibut and sablefish IFQ programs. Although fewer crew members may improve the economic efficiency of the vessel operation, this may have significant adverse affects on the individual crew members. The number of crew members employed is at least partially balanced by an increase in the number of days of employment for those remaining. Information from the Deep Sea Fishermen's Union provided to the committee seems to indicate that the crew members responding to an informal survey had increased incomes, but it is difficult to determine if this is due principally to the implementation of the halibut and sablefish IFQ programs. Studies have also been conducted by the CFEC (Knapp, 1997b) in an attempt to compare possible changes in personal income with the implementation of IFQs. However, these studies compare changes in personal income during the first year of the program, and subsequent studies looking at the longer-term effects of IFQ management on crew income are not available.
The committee did not hear specific testimony on how the shift to an IFQ-managed fishery might affect other industries involved in the maintenance or provisioning of fishery operations. As previously mentioned, reduced gear needs could affect those industries supplying gear, and reduced fuel and supply costs could affect other industries. Since gear expenditures and other provisions may be affected by a wide range of factors, it is not clear that IFQ management will either positively or negatively affect these industries. Although it is not unreasonable to assume that IFQ management may alter season length and fishing operations, and therefore affect industries that rely on the fishing industry, the effects of IFQ management on these other industries is not clear. Also, it is difficult to determine how these industries had responded to potential changes in demand caused by the IFQ programs. It is possible that some have modified their business operations to account for these changes.
Another issue on which there is limited information is the effect of IFQ management regimes on consumer demand. The committee received information from both the CFEC and the Canadian Department of Fisheries and Oceans that the implementation of IFQ programs in the halibut fisheries resulted in a
substantial increase in the percentage of product delivered to the market fresh, probably reflecting consumer preferences. If IFQs significantly expand the fresh market by providing higher-quality product for a longer period of time, this could have substantial economic effects including the expansion of marketing and wholesale operations and potentially a reduction in more traditional markets for frozen halibut. In general, it is reasonable to assume that if IFQs provide greater opportunities for fulfilling consumer preferences, IFQ management could provide significant net benefits to the nation in terms of new marketing efforts and increased consumer satisfaction. It would be worthwhile to examine in more detail the ways in which IFQ management affects the marketing of fish product.
Potential Long-Term Effects on Fishery-Dependent Communities
The committee has provided some description of the potential effects of IFQ implementation in Appendix G, which is reflected in several of the recommendations in Chapter 6. In most cases, the lack of socioeconomic data makes it impossible to characterize precisely how communities may be affected by the implementation of an IFQ program and the potential costs and benefits to the nation from these effects on fishing communities. Because a wide range of factors—including the status of other fisheries, market conditions, and alternative employment opportunities—affect fishery-dependent communities, attributing specific conditions in a community to the effects of IFQ management is difficult.
One factor that could be measured, which may provide some indication about the ability of fishery-dependent communities to respond to potential changes with the implementation of an IFQ program, is the distribution of quota in certain communities from the inception of the IFQ program to the present. Only the Alaskan halibut and sablefish IFQ fisheries have sufficient data regarding the purchase and transfer of quota in specific communities. These effects can be typified by five communities with a history of dependence on fishery resources that have typically been active in both the halibut and the sablefish fisheries: Homer, Kodiak, Petersburg, Seward, and Sitka, Alaska. The Commercial Fisheries Entry Commission and the NMFS RAM Division have tracked the total number or quota shareholders and the amount of quota held in these communities, and the total number and amount of quota held by crew members in these communities (Tables H.8-H.12).
Since the inception of the IFQ programs, four of these communities have maintained or increased their absolute amount and total percentage of quota shares. In some fishing areas, the amount and percentage of quota held may have dropped since the inception of the program, but in general, the numbers of total quota units held has increased in four of the five communities. Data indicate that residents of Kodiak and Seward hold slightly less halibut quota now than at the time of implementation; however, both communities have increased their hold-
TABLE H.8 Initial Allocation and Recent Holdings of Quota Share by Residents of Homer, Alaska in the Alaskan Halibut and Sablefish IFQ Programs
TABLE H.9 Initial Allocation and Recent Holdings of Quota Share by Residents of Kodiak, Alaska in the Alaskan Halibut and Sablefish IFQ Programs
|
Halibut |
||||||
|
Quota Initially Issued |
Quota Holdings as of December 31, 1997 |
|||||
|
Area |
Persons Issued |
1997 IFQ Pounds |
% of Area |
Persons Holding |
1997 IFQ Pounds |
% of Area |
|
2C |
31 |
24,079 |
0.24 |
18 |
9,492 |
0.09 |
|
3A |
385 |
5,675,162 |
22.69 |
295 |
5,458,522 |
21.86 |
|
3B |
180 |
1,673,027 |
18.53 |
148 |
2,044,212 |
22.71 |
|
4A |
62 |
518,270 |
17.59 |
56 |
609,392 |
20.73 |
|
4B |
26 |
435,748 |
15.64 |
20 |
344,313 |
12.37 |
|
4C |
8 |
68,658 |
11.84 |
7 |
80,448 |
13.87 |
|
4D |
10 |
35,227 |
4.34 |
11 |
63,185 |
7.78 |
|
4E |
2 |
0 |
0.00 |
2 |
0 |
0.00 |
|
Total |
388 |
8,430,170 |
|
331 |
8,609,563 |
|
|
Sablefish |
||||||
|
Quota Initially Issued |
Quota Holdings as of December 31, 1997 |
|||||
|
Area |
Persons Issued |
1997 IFQ Pounds |
% of Area |
Persons Holding |
1997 IFQ Pounds |
% of Area |
|
SE |
22 |
46,271 |
0.58 |
18 |
39,372 |
0.49 |
|
WY |
30 |
303,601 |
6.02 |
30 |
299,897 |
5.95 |
|
CG |
74 |
1,052,034 |
9.28 |
72 |
1,265,744 |
11.19 |
|
WG |
24 |
72,617 |
2.21 |
28 |
222,498 |
6.78 |
|
AI |
12 |
23,945 |
1.51 |
11 |
22,059 |
1.39 |
|
BS |
16 |
84,709 |
8.73 |
18 |
98,791 |
10.18 |
|
Total |
74 |
1,583,178 |
|
77 |
1,948,360 |
|
|
NOTES: See notes for Table H.8. SOURCES: CFEC, NMFS RAM Division. |
||||||
TABLE H.10 Initial Allocation and Recent Holdings of Quota Share by Residents of Petersburg, Alaska in the Alaskan Halibut and Sablefish IFQ Programs
|
Halibut |
||||||
|
Quota Initially Issued |
Quota Holdings as of December 31, 1997 |
|||||
|
Area |
Persons Issued |
1997 IFQ Pounds |
% of Area |
Persons Holding |
1997 IFQ Pounds |
% of Area |
|
2C |
255 |
1,854,685 |
18.41 |
231 |
2,352,833 |
23.35 |
|
3A |
66 |
1,188,194 |
4.75 |
73 |
1,580,709 |
6.32 |
|
3B |
9 |
190,532 |
2.09 |
6 |
186,809 |
2.07 |
|
4A |
6 |
48,454 |
1.64 |
5 |
50,286 |
1.71 |
|
4B |
3 |
76,669 |
2.76 |
2 |
86,236 |
3.10 |
|
4D |
3 |
15,382 |
2.66 |
2 |
14,889 |
2.57 |
|
4E |
2 |
0 |
1.58 |
2 |
0 |
1.58 |
|
Total |
266 |
3,373,916 |
|
255 |
4,271,812 |
|
|
Sablefish |
||||||
|
Quota Initially Issued |
Quota Holdings as of December 31, 1997 |
|||||
|
Area |
Persons Issued |
1997 IFQ Pounds |
% of Area |
Persons Holding |
1997 IFQ Pounds |
% of Area |
|
SE |
52 |
1,083,684 |
13.38 |
51 |
1,076,846 |
13.39 |
|
WY |
31 |
417,783 |
8.28 |
34 |
482,460 |
9.60 |
|
CG |
37 |
1,121,114 |
9.89 |
29 |
1,351,733 |
11.93 |
|
WG |
8 |
113,970 |
3.46 |
5 |
100,195 |
3.04 |
|
AI |
5 |
29,114 |
1.83 |
4 |
25,734 |
1.74 |
|
BS |
4 |
84,158 |
8.67 |
4 |
65,401 |
6.74 |
|
Total |
57 |
2,849,824 |
|
68 |
3,102,370 |
|
|
NOTES: See notes for Table H.8. SOURCES: CFEC, NMFS RAM Division. |
||||||
TABLE H.11 Initial Allocation and Recent Holdings of Quota Share by Residents of Seward, Alaska in the Alaskan Halibut and Sablefish IFQ Programs
|
Halibut |
||||||
|
Quota Initially Issued |
Quota Holdings as of December 31, 1997 |
|||||
|
Area |
Persons Issued |
1997 IFQ Pounds |
% of Area |
Persons Holding |
1997 IFQ Pounds |
% of Area |
|
2C |
4 |
19,777 |
0.20 |
0 |
0 |
0.00 |
|
3A |
63 |
428,831 |
1.71 |
43 |
408,811 |
1.64 |
|
3B |
11 |
209,872 |
0.39 |
10 |
35,751 |
0.40 |
|
4A |
2 |
13,962 |
0.47 |
2 |
3,799 |
0.13 |
|
4B |
0 |
0 |
0.00 |
2 |
13,383 |
0.48 |
|
4E |
0 |
0 |
0.00 |
1 |
0 |
5.83 |
|
Total |
66 |
497,607 |
|
44 |
461,744 |
|
|
Sablefish |
||||||
|
Quota Initially Issued |
Quota Holdings as of December 31, 1997 |
|||||
|
Area |
Persons Issued |
1997 IFQ Pounds |
% of Area |
Persons Holding |
1997 IFQ Pounds |
% of Area |
|
SE |
3 |
52,823 |
0.65 |
1 |
41,249 |
0.51 |
|
WY |
6 |
77,741 |
1.54 |
4 |
112,948 |
2.24 |
|
CG |
25 |
199,860 |
1.76 |
18 |
261,042 |
2.31 |
|
WG |
2 |
3,892 |
1.18 |
2 |
4,761 |
0.15 |
|
AI |
1 |
375 |
0.02 |
1 |
1,172 |
0.07 |
|
BS |
0 |
0 |
0.00 |
1 |
2,531 |
0.26 |
|
Total |
25 |
334,691 |
|
18 |
423,703 |
|
|
NOTES: See notes for Table H.8. SOURCES: CFEC, NMFS RAM Division. |
||||||
TABLE H.12 Initial Allocation and Recent Holdings of Quota Share by Residents of Sitka, Alaska in the Alaskan Halibut and Sablefish IFQ Programs
|
Halibut |
||||||
|
Quota Initially Issued |
Quota Holdings as of December 31, 1997 |
|||||
|
Area |
Persons Issued |
1997 IFQ Pounds |
% of Area |
Persons Holding |
1997 IFQ Pounds |
% of Area |
|
2C |
328 |
1,681,263 |
16.68 |
275 |
1,737,254 |
17.21 |
|
3A |
130 |
801,740 |
3.21 |
115 |
992,008 |
3.97 |
|
3B |
21 |
254,369 |
2.82 |
16 |
243,353 |
2.70 |
|
4A |
16 |
103,349 |
3.51 |
10 |
111,990 |
3.81 |
|
4B |
8 |
114,685 |
4.12 |
5 |
97,001 |
3.48 |
|
4C |
2 |
3,721 |
0.64 |
2 |
3,721 |
0.64 |
|
4D |
2 |
6,861 |
0.85 |
1 |
2,981 |
0.37 |
|
Total |
337 |
2,965,988 |
|
303 |
3,188,308 |
|
|
Sablefish |
||||||
|
Quota Initially Issued |
Quota Holdings as of December 31, 1997 |
|||||
|
Area |
Persons Issued |
1997 IFQ Pounds |
% of Area |
Persons Holding |
1997 IFQ Pounds |
% of Area |
|
SE |
118 |
1,826,071 |
22.55 |
104 |
2,044,985 |
25.44 |
|
WY |
38 |
316,597 |
6.28 |
36 |
410,737 |
8.15 |
|
CG |
34 |
711,411 |
6.28 |
30 |
733,224 |
6.48 |
|
WG |
13 |
198,916 |
6.04 |
10 |
189,701 |
5.78 |
|
AI |
7 |
85,932 |
5.41 |
8 |
86,335 |
5.44 |
|
BS |
6 |
47,031 |
4.85 |
6 |
48,541 |
5.00 |
|
Total |
120 |
3,185,958 |
|
114 |
3,513,523 |
|
|
NOTES: See notes for Table H.8. SOURCES: CFEC, NMFS RAM Division. |
||||||
ings of sablefish quota significantly (Tables H.9 and H.11). All five communities seem to have fewer individual holders of quota now than at the beginning of the program (Tables H.8-H.12). The data from Homer indicate that there has been a substantial decrease in both the number of quota shareholders and the amount of quota held. The committee did not analyze where these quota shares were transferred, nor the employment status of individuals that had sold quota and left the fishery.
These trends may not extend to other communities in the region or to a wider range of communities. Additionally, it is difficult to determine the number of individuals who had been active in these fisheries prior to implementation of the IFQ programs who may have chosen to purchase quota if they were not allocated quota during the initial allocation process. CFEC has produced a number of studies analyzing the trends in participation in the Alaskan halibut and sablefish fisheries prior to implementation of the IFQ programs. In some communities, the total amount of quota held in halibut and sablefish has increased by up to 20% above the initial quota allocations (e.g., sablefish IFQ in Kodiak, halibut IFQ in Petersburg; Tables H.9 and H.10). In the case of Homer, the total amount of quota held decreased by nearly 15% in both the halibut and the sablefish fisheries (Table H.8). These data suggest that in four of the five communities, substantial investments have been made in the IFQ programs, and following these trends will help provide further information about the ability of similar communities dependent on fishing to become actively involved in IFQ programs.
The CFEC, in response to a request from the NMFS RAM Division, has also compiled data tracking the gross revenue in many of the Alaskan communities where IFQ is held. Data from the CFEC indicate that for all five of the communities analyzed in this section, the gross revenues of the IFQ holders in these communities for both the halibut and the sablefish IFQ fisheries have increased since the inception of the program (CFEC, 1998). Further, these data indicate that the gross revenue per individual quota holder has increased in both the halibut and the sablefish fisheries in all five of these communities since the inception of the program (CFEC, 1998).
The CFEC also provides data on the amount of investment by crew members, and the changes in the allocation of quotas in these communities, in order to provide some perspective on the potential economic effects of the implementation of IFQ programs (Tables H.13-H.17). However, the results may not be representative of all communities, and a more thorough analysis may be necessary. Tables H.13-H.17 show that investment in the IFQ program is increasing in the five communities examined, and in some cases, crew members from specific communities now comprise a small, but apparently increasing, portion of the overall amount of quota held by the community in some areas (e.g., Kodiak crew members in Area 3B and 4A halibut, Petersburg crew members in Area 2C halibut; Tables H.14 and H.15). However, overall, these data indicate that, generally, crew members do not hold a large percentage of quota share in the
TABLE H.13 Quota Share Holdings for Crew Members with a Homer Designated City Address in the Alaskan Halibut and Sablefish IFQ Programs as of December 31, 1997
TABLE H.14 Quota Share Holdings for Crew Members with a Kodiak Designated City Address in the Alaskan Halibut and Sablefish IFQ Programs as of December 31, 1997
|
Area |
Number of Crew |
1997 IFQ Pounds |
Crew IFQ Pounds as a Percent of City Pounds |
Crew IFQ Pounds as a Percent of Area Pounds |
|
Halibut |
||||
|
2C |
1 |
280 |
3.0 |
0.00 |
|
3A |
37 |
519,310 |
9.5 |
2.08 |
|
3B |
28 |
379,915 |
18.6 |
4.22 |
|
4A |
12 |
119,795 |
19.7 |
4.07 |
|
4B |
5 |
47,433 |
13.8 |
1.70 |
|
4C |
1 |
3,178 |
4.0 |
0.55 |
|
4D |
3 |
17,694 |
28.0 |
2.18 |
|
Total |
59 |
1,087,605 |
12.6 |
2.13 |
|
Sablefish |
||||
|
AI |
1 |
137 |
0.6 |
0.01 |
|
CG |
5 |
34,533 |
2.7 |
0.31 |
|
SE |
1 |
16 |
0.0 |
0.00 |
|
WG |
4 |
28,077 |
12.6 |
0.86 |
|
WY |
4 |
17,054 |
5.7 |
0.34 |
|
Total |
8 |
79,816 |
4.1 |
0.26 |
|
Grand Total |
59 |
1,167,422 |
11.1 |
1.43 |
|
NOTES: See notes for Table H.13. SOURCES: CFEC, NMFS RAM Division. |
||||
TABLE H.15 Quota Share Holdings for Crew Members with a Petersburg Designated City Address in the Alaskan Halibut and Sablefish IFQ Programs as of December 31, 1997
|
Area |
Number of Crew |
1997 IFQ Pounds |
Crew IFQ Pounds as a Percent of City Pounds |
Crew IFQ Pounds as a Percent of Area Pounds |
|
Halibut |
||||
|
2C |
50 |
367,216 |
15.49 |
3.64 |
|
3A |
17 |
171,900 |
10.81 |
0.69 |
|
3B |
1 |
2,324 |
1.24 |
0.03 |
|
4A |
2 |
24,274 |
48.27 |
0.83 |
|
Total |
60 |
565,715 |
13.18 |
1.87 |
|
Sablefish |
||||
|
CG |
3 |
63,154 |
4.67 |
0.56 |
|
SE |
9 |
69,883 |
6.58 |
0.87 |
|
WY |
6 |
34,534 |
7.16 |
0.69 |
|
Total |
14 |
167,570 |
5.43 |
0.33 |
|
Grand Total |
66 |
733,285 |
9.9 |
0.90 |
|
NOTES: See notes for Table H.13. SOURCES: CFEC, NMFS RAM Division. |
||||
TABLE H.16 Quota Share Holdings for Crew Members with a Seward Designated City Address in the Alaskan Halibut and Sablefish IFQ Programs as of December 31, 1997
|
Area |
Number of Crew |
1997 IFQ Pounds |
Crew IFQ Pounds as a Percent of City Pounds |
Crew IFQ Pounds as a Percent of Area Pounds |
|
Halibut |
||||
|
3A |
8 |
31,701 |
7.8 |
0.13 |
|
3B |
2 |
4,722 |
13.2 |
0.05 |
|
Total |
8 |
36,423 |
7.9 |
0.07 |
|
Grand Total |
8 |
36,423 |
4.1 |
0.04 |
|
NOTES: See notes for Table H.13. There were no crew sablefish IFQ held in the community of Seward. SOURCES: CFEC, NMFS RAM Division. |
||||
TABLE H.17 Quota Share Holdings for Crew Members with a Sitka Designated City Address in the Alaskan Halibut and Sablefish IFQ Programs as of December 31, 1997
|
Area |
Number of Crew |
1997 IFQ Pounds |
Crew IFQ Pounds as a Percent of City Pounds |
Crew IFQ Pounds as a Percent of Area Pounds |
|
Halibut |
||||
|
2C |
53 |
202,425 |
11.7 |
2.01 |
|
3A |
24 |
95,634 |
9.6 |
0.38 |
|
3B |
5 |
42,622 |
17.5 |
0.47 |
|
4A |
3 |
28,462 |
25.4 |
0.97 |
|
Total |
69 |
369,143 |
11.6 |
0.72 |
|
Sablefish |
||||
|
CG |
6 |
25,347 |
3.5 |
0.22 |
|
SE |
13 |
90,229 |
4.4 |
1.12 |
|
WY |
6 |
15,210 |
3.7 |
0.30 |
|
Total |
19 |
130,787 |
3.7 |
0.43 |
|
Grand Total |
76 |
499,930 |
7.5 |
0.61 |
|
NOTES: See notes for Table H.13. SOURCES: CFEC, NMFS RAM Division. |
||||
communities examined. Examining these trends in crew investment in the IFQ programs may help to improve the understanding of the incentives or effects of investment in these programs and could provide guidance for future IFQ programs or investment policies. Trends in crew holdings of quota share with the implementation of the North Pacific Loan Program should be monitored by NMFS, CFEC, or the North Pacific Council to provide more data on crew investment and the efficacy of loan programs in increasing the share of quotas held by crew members and smaller quota holders.
Based on the information on the distribution of quota, it appears that in all of these communities, vessel owners, and to a limited extent, crew members have made substantial investments to participate in the Alaskan halibut and sablefish IFQ fisheries. Overall, crew members held 11.2% of the halibut TAC and 4.6% of the sablefish TAC in 1997, and these percentages appear to be increasing (NMFS, 1998). Even in those communities where the total quota share may not have increased, or has decreased (e.g., halibut in Kodiak, halibut and sablefish in Homer), there appear to be shifts in the areas where quota is held, possibly representing preferences in location, regional variations in exvessel price, or the
TABLE H.18 Percentage of Landings in Weight for the Alaskan Halibut Fishery (1991-1996)
|
Year |
Total Landings (pounds) |
% Catcher Vessels (Alaska) |
% Catcher-Processors |
% Catcher Vessels (other states) |
|
1991 |
49,535,011 |
91.6 |
4.9 |
3.5 |
|
1992 |
51,829,522 |
92.6 |
5.1 |
2.2 |
|
1993 |
48,449,185 |
88.0 |
8.9 |
3.2 |
|
1994 |
44,449,185 |
87.2 |
9.1 |
3.7 |
|
1995 |
32,151,518 |
90.0 |
7.6 |
2.4 |
|
1996 |
35,386,715 |
89.2 |
8.3 |
2.6 |
|
SOURCE: CFEC. |
||||
affordability of quota share in other areas. These data indicate that fewer vessel owners, and fewer participants overall, hold quota than at the implementation of the program. Based on testimony from other sources, it is likely that the reduction in quota shareholders represents a reduction in the number of individual fishing operations in these fisheries. Note, however, that even with these reductions, the current number of quota shareholders is greater that the maximum number of fishermen who participated in any given year of the derby fishery. Additionally, based on testimony received from these communities and other regions, it appears that the overall crew employment in the remaining fishing operations has probably decreased. However, the gross revenue per quota shareholder appears to have increased since the inception of the program (CFEC, 1998).
What is much more difficult to determine is the overall effects of these shifts on the local economies. Investment in the IFQ programs has increased, the amount of product landed in Alaska has not changed significantly, and the general ranking of these communities in terms of landed product from these fisheries does not appear to have significantly changed since the implementation of the program (Tables H.18-H.21). However, there are certainly shifts within the landings of product, although it is not clear if these changes are due to factors other than the implementation of IFQ management and drawing conclusions on the long-term distributions of landings is difficult. Overall exvessel price for the product has increased, although prices have fallen recently due to substantial increases in the TAC and possibly other factors. Data for 1997 were not available at the time of the committee's analysis; however, additional years of harvest landings data will provide a more accurate indication of whether there are any changes in the relative rankings of ports in terms of landings.
Some communities have also been affected by changes in other fisheries, such as low exvessel prices for salmon and herring, and it is not easy to separate the effects of changes in other fisheries from the potential effects of the IFQ
TABLE H.19 Percentage and Relative Ranking of Landing (in Weight) for Alaskan Ports in the Alaskan Halibut Fishery (1991-1996)
TABLE H.20 Percentage of Harvest Landings in Weight for the Alaskan Sablefish Fishery (1991-1996)
|
Year |
Total Landings (pounds) |
% Catcher Vessels (Alaska) |
% Catcher-Processors |
% Catcher Vessels (other states) |
|
1991 |
51,209,634 |
87.7 |
12.1 |
0.2 |
|
1992 |
48,400,987 |
85.3 |
13.6 |
1.1 |
|
1993 |
49,313,981 |
78.0 |
21.3 |
0.7 |
|
1994 |
44,827,268 |
81.1 |
16.7 |
2.2 |
|
1995 |
40,628,028 |
84.3 |
13.6 |
2.1 |
|
1996 |
33,143,809 |
82.4 |
15.8 |
1.8 |
|
SOURCE: CFEC. |
||||
fisheries. Additionally, the change in processing operations with the shift to a larger percentage of the market sold as fresh product has probably reduced employment at processing plants that produced frozen product. However, other employment opportunities could have been created to market fresh product.
The fact that these communities have increased their overall quota share seems to indicate a desire by some residents to make the investments necessary to continue in the halibut and sablefish fisheries. These data indicate that there are opportunities for members of these communities to invest in quota; however, the relative ease of access to capital and the possible constraints that this may have on the overall quota holdings in these communities could not be determined. Undoubtedly, some members of the communities have benefited from the initial allocation of quota shares whereas others, including crew, have lost employment in the fishery as a result of fewer fishing operations or the consolidation of fishing operations. The committee received testimony from these communities that some vessel owners and crew members who had not received quota had “bought into" the fishery and felt that fishing under IFQ management was preferable to the previous derby fisheries. Others, typically those who did not receive an initial allocation or a significant initial allocation, stated that price of the quota prohibited them from participating in the fisheries and expressed great dissatisfaction with the IFQ programs.
Based on the testimony received and trends in the allocation of quota in these communities, and from testimony from other communities, it is difficult to determine precisely the economic effects of IFQ management on the overall economic conditions in these communities, and the net benefits and costs of IFQs to the nation. The fact that some members of these communities have purchased quota and that crew members appear to be increasing their share of quota seems to indicate that residents of these communities can continue to be involved in these fisheries. If quota share holdings in all or most of these communities decreased significantly, this would be a strong indication that these communities were
TABLE H.21 Percentage and Relative Ranking of Harvest Landed (in Weight) for Alaskan Ports in the Alaskan Sablefish Fishery (1991-1996)
unable to participate in the fisheries. The fact that gross revenues appear to have increased since the inception of the programs suggests that the implementation of IFQs has improved the profitability of fishing operations in these communities, based on the assumption that costs have not increased considerably.
Implementation of the IFQ programs has altered the ways in which communities participate in these fisheries; however, it is not clear that this change has been detrimental to these communities as a whole from an economic perspective. Analysis of trends in quota share and crew participation could provide a clearer indication of the long-term effects of the halibut and sablefish IFQ programs on communities. However, the increasing quota share in four of the five communities reviewed indicates that the means for purchasing quota and participating in these fisheries exists and substantial investments are being made by some members of these communities. These data suggest that significant changes in the Alaskan halibut and sablefish IFQ programs could have profound economic effects on those members of the community that hold quota and participate in these fisheries, as well as on the overall economic stability of these communities.
Overall Consideration of the Potential Economic Costs and Benefits to the Nation
It appears that substantial savings have been realized by vessel operators due to improved harvesting conditions, but the amount of these savings cannot be precisely quantified. Overall, it appears that the economic efficiency of fishing operations has improved by allowing greater freedom for harvesters to time their harvests and select fishing techniques to minimize costs and increase the profitability of their operations. In the case of the Alaskan halibut IFQ program, it appears that fresh markets are expanding and exvessel prices are increasing. Expenditures for search and rescue operations have been significantly reduced. Nevertheless, expenditures for enforcement operations for the U.S. Coast Guard and NMFS appear to have increased.
There appear to have been consolidation of quota and reduction in employment opportunities for some crew members. Some crew members have purchased quota, and in some regions the share of quota held by crew members may become significant if current trends continue. Gross revenue appears to have increased for quota shareholders. Processing operations have also been affected, although the economic benefits or costs of these changes are not clear. Improved monitoring and data collection regarding the effects of income distribution in the processing sector and among crew members could further clarify the relative impacts of IFQ management on these sectors. Assessment of the 3% exvessel fee and the 0.5% registration and transfer fee provided for in the Magnuson-Stevens Act will further increase the revenue transferred to the Treasury and available to fund IFQ management. As stated earlier, it is likely that if IFQ programs were implemented for larger fisheries with higher exvessel value, the assessment of
capital gains taxes, the 3% exvessel fee, and the 0.5% registration and transfer fee could generate significant net revenues for the nation, or for individuals and communities disadvantaged by IFQs.
In analyzing these potential benefits and costs, it is important to consider that there are continual changes in the structure of fishery management. In some cases, the long-term economic benefits of shifting management to IFQs may be significant. In other fisheries, these long-term benefits may not be as significant. It is important that no matter what the management regime used, the economic costs and benefits of this management system be considered in comparison to other management options and their potential costs and benefits. If IFQ programs are proposed for other fisheries, the committee recommends that improved socioeconomic data collection and analysis be conducted to provide a clearer indication as to both the national and the local costs and benefits of this and alternative management tools.
Care must be taken in distinguishing between real benefits and costs on the one hand and fiscal effects, or transfers, on the other. The real net benefits of an IFQ program consist of increases in revenues over costs, including management and enforcement costs. Increased tax revenues are important, however, due to the fact that management and enforcement costs are currently being paid almost exclusively from public revenue and increased tax revenues from capital gains taxes. Other sources also transfer funds to pay for the administration of these programs. The economic benefits of an IFQ program will be reflected in the value of quota, which appears to have increased since the inception of the program. Economic benefits will also be reflected in better quality of product and higher demand for the product.
In summary, this appendix provides some indication of the range of issues that must be considered when comparing IFQ management to other forms of management. A worthwhile exercise in the development of future IFQ programs is to identify the range of economic costs and benefits associated with IFQ management. The collection of data on the price of transfer, the value of the quota, and other economic factors will greatly improve the ability to assess the overall costs and benefits of IFQs on the regional and national levels. The only U.S. IFQ programs that could be analyzed in any depth are those for the Alaskan halibut and sablefish fisheries. The SCOQ and wreckfish IFQ programs collect very few of the data necessary for a thorough analysis of net economic benefits and costs. The committee recommends mandatory reporting of transfer price information for all existing and new IFQ programs.


