
3
Imperative: Achieving Greater Value in Health Care
Thomas Kundig periodically suffered back pain from an old rock climbing accident. When the pain recurred, he would contact his clinician, only to wait for at least a week to obtain an appointment with a specialist. He would have his back imaged (generally with an x-ray but at least once with magnetic resonance imaging [MRI]) and then receive a prescription for painkillers to get him through the episode. For Thomas, the problem was not just the cost of these therapies, but the hassle and time demands of tests and visits. But Thomas’s outlook improved when his health care system changed the way it treated back pain at its spine clinic. Patients now began with physical therapy, with MRIs and intensive imaging being limited to those patients they were most likely to benefit. As a result of this new approach to back pain treatment, when Thomas’s back pain returned the next time, the clinic had an appointment available for the next day. Based on an evaluation of his symptoms, a doctor found he did not need an MRI or prescription medications, but instead prescribed physical therapy and an over-the-counter anti-inflammatory drug. After four physical therapy sessions, Thomas’s back felt better, and he learned how to continue the exercises on his own, which felt to him like more of a permanent solution to the problem (Fuhrmans, 2007). Nationwide, studies have found that imaging for lower back pain is overused, being prescribed for many patients who will not benefit from these intensive tests (Good Stewardship Working Group, 2011).
As patients and providers struggle with the increased complexity of modern medicine (Chapter 2), the nation struggles with the clear and compelling imperative to improve the value of health care—that is, to achieve better outcomes at lower cost. The challenges of complexity and value are closely linked as the central dilemmas driving the need for attention to opportunities for the continuous learning and improvement that is the focus of this report.
Currently, the U.S. health care system is failing to achieve its potential in either the quality of care or the outcomes of care. These shortfalls can be seen in areas as diverse as patient safety, the evidence basis for care, care coordination, access to care, and health disparities. If the health care system is to realize its potential, a concerted effort to learn and improve on each of these dimensions will be necessary.
Patient Safety
More than a decade ago, the Institute of Medicine (IOM) released To Err Is Human: Building a Safer Health System, in which it was estimated that at least 44,000 people, and perhaps as many as 98,000, died in hospitals every year as a result of preventable medical errors (1999). Ten years later, as illustrated in Box 3-1, medical errors still occur routinely (Downey et al., 2012). A study of 10 North Carolina hospitals over a 5-year period, for example, found that approximately 18 percent of patients were harmed by medical care, with 63 percent of those cases being judged as preventable (Landrigan et al., 2010). This finding was reinforced by a nationwide study revealing that one in seven Medicare patients suffered harm from hospital care, with an additional one in seven suffering temporary harm from care-related problems that were detected in time and corrected; 44 percent of these errors were found to be preventable (Levinson, 2010). A third study found that the rate of adverse events in hospitals could be as high as one-third of all admissions (Classen et al., 2011). One of the difficulties of measuring the magnitude of medical errors is that they often are unreported. A recent study found that 86 percent of adverse events were not submitted to existing hospital incident reporting systems, partly because of confusion about what constitutes patient harm (Levinson, 2012). These errors carry substantial financial costs, lengthen patients’ hospital stays, and in some cases increase mortality (Zhan and Miller, 2003).
Although infections and complications once were viewed as routine consequences of medical care, it is now recognized that strategies and evidence-based interventions exist that can significantly reduce the incidence
BOX 3-1
An Example of Patient Harm
The human impact of medical errors is best appreciated from the lens of the individuals affected. One notable example is that of Ms. Grant, a 68-year-old nondiabetic who underwent cardiac bypass surgery. Two weeks after a series of complications related to her surgery, she was in stable condition in the intensive care unit (ICU). Her doctor noted that she was doing well and appeared to be on the way to a full recovery.
At 6:45 AM, Ms. Grant’s arterial line became blocked—a frequent occurrence for this type of case—and her ICU nurse promptly responded with a 1-2 mL heparin flush. Ms. Grant appeared to be recovering from the setback until 8:15 AM, when her ICU nurse heard her coughing and rushed into her room to find her seizing. The nurse gave Ms. Grant labetalol to control her high systolic blood pressure, and the ICU team administered a barrage of diagnostics and therapies.
At 8:45 AM, Ms. Grant’s results returned from the laboratory. Her serum glucose level was undetectable. Confused by these results, the ICU team administered two ampules of 50 percent dextrose in water to control Ms. Grant’s sudden hypoglycemia, and then began to investigate her rapid deterioration.
At 9:15 AM, the team discovered a near-empty 10 mL vial of insulin on a medicine cart outside Ms. Grant’s room, suggesting that earlier that morning, the ICU nurse had inadvertently treated Ms. Grant’s arterial line blockage not with heparin but with insulin. Upon further investigation, the ICU team found that multidose vials of both heparin and insulin were on top of the medicine cart outside Ms. Grant’s room at the time of the error. The vials looked similar, both held 10 mL of solution, and it was ICU practice to use multidose vials. Even though insulin should have been stored in the refrigerator, it was routinely kept on the medicine cart, and the hospital had no system of double checking or barcode checking high-risk drugs before they were administered.
Ms. Grant spent 7 weeks in a coma, at which point her family withdrew life support and she died (Bates, 2002).
As with many medical errors, the problem was not just the action of the individual clinician but the system that allowed it to happen. This particular error, the incorrect administration of insulin, accounts for 11 percent of serious medication errors, and insulin and heparin are known to be mistaken for one another because they are both administered in similar units and often stored in close proximity. Further, Ms. Grant’s case is not unique to the hospital at which she sought care, but involved an error that has been experienced by many patients across the country (Cohen, 1999; Cohen et al., 1998).
and severity of such events. For example, there are proven methods for preventing catheter-related bloodstream infections, especially in intensive care unit (ICU) settings (Pronovost et al., 2006). Given that these potentially deadly infections prove fatal 12-25 percent of the time, such interventions can have a substantial impact on mortality (CDC, 2011). Despite progress
in reducing the number of these infections with evidence-based interventions, however, 23,000 such infections occurred in inpatient wards in 2009, at an extraordinary cost to the health care system and with an unacceptable risk of serious harm to patients (CDC, 2011). Such evidence-based interventions exist for many aspects of patient safety, yet few are used widely in patient care.
The Evidence Basis for Care
Another area for improvement is ensuring that clinical evidence guides patient care. For example, Americans receive only about half of the preventive, acute, and chronic care recommended by current research and evidence-based guidelines (McGlynn et al., 2003). Patients with diabetes, for instance, receive the recommended preventive care only 21 percent of the time (AHRQ, 2011b).
Estimates vary on the proportion of clinical decisions that are based on evidence, with some studies suggesting only 10-20 percent (Darst et al., 2010; IOM, 1985). The need for evidence also is reflected in clinical guidelines. A study of guidelines for the 10 most common types of cancer found that only 6 percent of the guidelines’ recommendations were based on a high level of evidence with uniform consensus (Poonacha and Go, 2011). An examination of 51 guidelines for treating lung cancer, for example, found that less than a third of the recommendations were evidence based (Harpole et al., 2003; IOM, 2009a). Another study found that fewer than half of the guidelines for treatment of infectious diseases are based on clinical trials (Lee and Vielemeyer, 2011).
Even when evidence-based guidelines are available, they are not always followed. For example, a recent analysis of implantable cardioverter-defibrillator (ICD) implants found that 22 percent were implanted in circumstances counter to the recommendations of professional society guidelines (Al-Khatib et al., 2011). While ICDs can be life-saving for many patients, they can be uncomfortable, inconvenient, and even life-threatening when implanted inappropriately.
This failure to deliver evidence-based care to patients results in suboptimal health outcomes. For example, consistently providing preventive services and interventions according to the best clinical evidence could prevent or postpone the majority of deaths from heart disease in the adult population (Kottke et al., 2009). The limited evidence supporting care delivery also contributes to widespread variations in clinical practice. For example, one study found that deliveries of normal-weight babies by caesarean section accounted for 7 percent of all births in some regions and almost 30 percent in others (Baicker et al., 2006).
Care Coordination
The coordination of each patient’s care over time is another area for improvement. As patients move among providers and settings, they are subject to treatment errors and duplicative services. A recent survey revealed that patients experience problems with receiving results of medical tests and information about their medical history and that test results frequently are unavailable at the time of doctors’ appointments. Almost 20 percent of patients reported that test results or medical records were not transferred from another provider or a laboratory in time for an appointment. Nearly one-quarter of patients said their health care provider had to order a previously performed test to have accurate information for diagnosis (Stremikis et al., 2011). Similarly, care often is not coordinated with the patient. One study found that in 1 of every 14 tests, either the patient was not informed of a clinically significant abnormal test result, or the clinician failed to record reporting the result to the patient (Casalino et al., 2009). In the previously cited study of Stremikis and colleagues (2011), half of survey respondents said they had experienced waste and inefficiency in the health care system, and one-third said the system is poorly organized (Stremikis et al., 2011).
Patients also have reported poor communication between their primary care providers and specialists, and the reported likelihood of these coordination failures increases with the number of physicians seen (Stremikis et al., 2011). This trend is particularly concerning given that, as noted in Chapter 2, Medicare patients see an average of seven physicians, including five specialists, split among four different practices (Pham et al., 2007). The presence of multiple comorbidities only exacerbates this trend. One study found that while the average Medicare patient with type 2 diabetes but no comorbidity saw an average of 5.6 physicians in a year, a patient with 10 comorbidities saw 28.2 physicians (Niefeld et al., 2003). Another study found that in a single year in fee-for-service Medicare, the typical primary care physician had to coordinate with 229 other physicians in 117 different practices (Pham et al., 2009). Further, the rate at which physicians refer patients has doubled over the past decade, and the number of primary care visits resulting in a referral has increased by nearly 160 percent (Barnett et al., 2012). Coordination failures also are likely exacerbated by the wide variety of professionals in health care today (Leape and Berwick, 2005). Modern medicine includes nurses in more than 50 specialties, physicians in more than 50 medical specialties, physician assistants, pharmacists, physical therapists, psychologists, dentists, and many others, all of whom must
communicate with each other across specialties and across professional lines to manage a patient’s care successfully.1
Poor communication and coordination among providers extend to inpatient care. A survey of hospital patients found that 75 percent were unable to identify the clinician in charge of their care (Arora et al., 2009). Moreover, the number of clinicians a patient sees in the hospital is growing; in just the period from 1970 to the late 1990s, the number of clinicians seen by a typical hospital patient increased from 2.5 to more than 15 (Gawande, 2011). A recent study of hospital patients’ contact with health care professionals found that during their hospitalization, medical patients saw an average of 18 different doctors, nurses, and other health care workers, while surgical patients saw an average of 27 (Whitt et al., 2007).
Patient handoffs—the transfer of responsibility for a patient from one provider to another—exemplify the care fragmentation experienced by many patients. A study of handoffs from ICUs to inpatient wards found that only 26 percent of receiving physicians communicated verbally with sending physicians during the transfer (Li et al., 2011). Fragmentation among different elements of the health care system continues upon a patient’s discharge from the hospital. A study investigating the adequacy of discharge summaries found that they mentioned only 16 percent of tests with pending results and failed to document follow-up providers’ information 33 percent of the time (Were et al., 2009). This communication gap makes it difficult for patients’ primary care providers and other members of their care team to remain informed of their condition and to guide their care successfully going forward (Leape and Berwick, 2005).
One of the most dramatic results of this lack of care coordination is the number of patients who must reenter the hospital soon after discharge. One study found that almost one-fifth of Medicare patients were rehospitalized within 30 days (Jencks et al., 2009). These rehospitalizations were responsible for $15 billion in Medicare spending in 2005 alone (Medicare Payment Advisory Commission, 2008). While a patient may have to be rehospitalized for many reasons, one of the most prominent is a lack of effective transition between hospital care and care delivered in community settings. Indeed, half of patients who were quickly rehospitalized were not seen by a health care provider before being readmitted (Jencks et al., 2009), suggesting that no provider was responsible for transitioning the patient back into the community. Figure 3-1 shows a representative timeline of
___________________________________________________
1The number of specialties was calculated based on specialty and subspecialty certificates provided by American Board of Medical Specialties member boards, American Osteopathic Association specialty certifying boards, and American Board of Nursing Specialties approved certification programs.
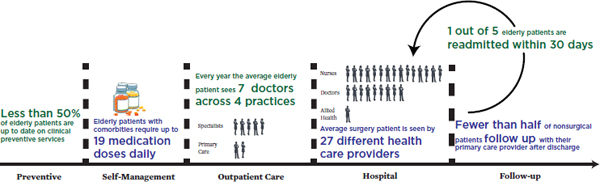
FIGURE 3-1 Representative timeline of a patient’s experiences in the U.S. health care system.
SOURCE: Data derived from Boyd et al., 2005; Jencks et al., 2009; Pham et al., 2007; Shenson et al., 2007; Whitt et al., 2007.
the preventive, self-management, outpatient, hospital, and follow-up care patients experience in the U.S. health care system.
Multiple evidence-based interventions exist to improve care coordination. These range from the transitional care model (Naylor et al., 1994, 1999, 2004) to guided care (Boult et al., 2008, 2011; Boyd et al., 2010), to many varieties of medical homes (Rosenthal, 2008). Many care coordination problems thus could be resolved if the knowledge that currently exists were applied.
Access to Care
A lack of timely access to care is another concerning impact of complexity on the quality of health care. Many studies have explored the number of Americans who lack insurance coverage and the deleterious impact on their health (IOM, 2002, 2003a,b, 2004, 2009b). Other obstacles to accessing care exist as well. In one survey, 29 percent of patients reported having difficulty obtaining an appointment with their health care provider when sick, while almost 60 percent noted problems with obtaining care outside of traditional business hours (nights, weekends, holidays) without going to the emergency room (Stremikis et al., 2011).
As a result of these access issues, many Americans are forced to visit the emergency room—one of the most costly settings for care—for treatment of chronic illnesses that could be managed in an outpatient setting. For example, asthma can be properly managed entirely through outpatient care. However, many patients fail to receive high-quality asthma management, which results in 1.75 million visits to the emergency room and almost 0.5 million hospitalizations each year (Akinbami et al., 2011). As a result,
the United States has a higher rate of hospital admissions for asthma than other developed nations (Squires, 2011).
Health Disparities
The complexity of modern health care often has impeded efforts to close unacceptable gaps in quality of care and health outcomes based on race, ethnicity, and income. As noted in previous IOM studies, the use of evidence-based treatments and the quality of care vary by race and ethnicity (IOM, 2003c). These disparities continue to be reported; for example, one recent study noted three-fold differences among different ethnic groups in the use of intravenous tissue plasminogen activator (tPA) for eliminating cerebral blood clots in stroke patients (Hsia et al., 2011). Moreover, an evaluation by the Agency for Healthcare Research and Quality (AHRQ) found that individuals with lower incomes received lower-quality care on 80 percent of the AHRQ core quality measures (AHRQ, 2011a). These disparities in care, along with social determinants, contribute to disparities in overall health (Woolf and Braveman, 2011). For example, life expectancy at birth is 4-6 years less for African Americans than for Caucasians, and the mortality rate for African American infants is double the national average (National Center for Health Statistics, 2011).
Overall Impact
The above shortfalls in the generation, diffusion, and application of knowledge on effective clinical care have a measurable impact on Americans’ health. One way to measure this impact is through mortality amenable to health care, defined as the number of deaths that should not occur in the presence of timely and effective health care. Examples of amenable mortality include childhood infections, surgical complications, and diabetes. The level of amenable mortality varies almost threefold among states, ranging from 64 to 158 deaths per 100,000 population (McCarthy et al., 2009; Schoenbaum et al., 2011). If all states had provided care of the quality delivered by the highest-performing state, 75,000 fewer deaths would have occurred across the country in 2005.
It is important to stress that there are multiple areas of excellence in the U.S. health care system in which technically advanced, compassionate care improves the health of patients and extends their lives. One such area is cancer care. The outcomes for
cancer patients in the United States tend to be better than those in other countries (Coleman et al., 2008; Gatta et al., 2000). For breast, colorectal, and cervical cancers, 5-year survival rates are high compared with rates in other developed nations, while overall mortality is comparatively low (Squires, 2011). The positive outcomes for cancer care underscore the potential for the health care system to improve in overall quality and address the areas for improvement discussed above.
Conclusion 3-1: Health care safety, quality, and outcomes for Americans fall substantially short of their potential and vary significantly for different populations of Americans.
Related findings:
- Medical care is guided insufficiently by evidence. Americans receive only about half of the preventive, acute, and chronic care recommended by current research and guidelines.
- Preventable medical harm is pervasive, despite proven methods for its reduction. One study found that nearly one in five hospital patients are harmed during their stay, and nearly two-thirds of that harm is preventable.
- The nature and quality of health care vary considerably among states, with serious health and economic consequences. If all states could provide care of the quality provided by the highest-performing state, an estimated 75,000 fewer deaths would have occurred across the country in 2005.
- Poor continuity of care is both harmful and costly. In 2004, one-fifth of Medicare patients were rehospitalized within 30 days, and Medicare rehospitalizations were responsible for $15 billion of Medicare spending in 2005 alone.
In addition to quality shortfalls, the value of health care is compromised by excess costs and waste (Brook, 2010). In 2012, the United States will spend $2.8 trillion, about 18 percent of the nation’s gross domestic product, on the health care system (Keehan et al., 2011). The high cost of health care by itself might not be a reason for concern. Patients, consumers, and the public might simply be choosing to invest more of their resources in health care because this investment is improving their health (Baicker and Chandra, 2011; Cutler et al., 2006). What is concerning, however, is the unsustainable rate of growth in health care costs. For 31 of the past 40 years, health care costs have increased at a greater rate than the economy as a whole, and health care spending is expected to continue increasing more rapidly than the total economy, growing 4 to 8 percent per year through 2020 (CMS, 2012; Keehan et al., 2011). To put these cost increases into perspective, if the cost of other goods had risen as quickly as health care costs in the post–World War II period, a dozen eggs now would cost $55,
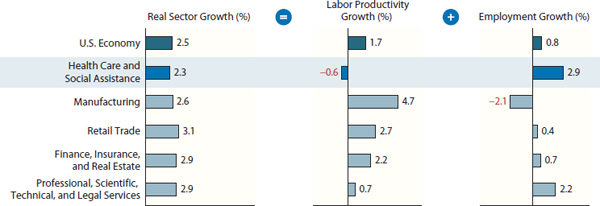
FIGURE 3-2 Real sector growth, broken into labor productivity and employment growth, for health care and other sectors of the U.S. economy.
SOURCE: Kocher and Sahni, 2011. Copyright © (2011) Massachusetts Medical Society. Reprinted with permission from Massachusetts Medical Society.
a gallon of milk would cost $48, and a dozen oranges would cost $134. 2,3 Notably, moreover, growth in health care costs has not been accompanied by a commensurate growth in the productivity of the health care labor force similar to the gains seen in other industries (see Figure 3-2) (Kocher and Sahni, 2011).
In considering the growth in health care costs, it is important to consider the specific impact of this growth on different stakeholders. For governments, health care expenditures are quickly consuming larger and larger fractions of the overall budget. Health care costs for the Department of Defense alone now top $50 billion a year, almost a tenth of its budget (Government Accountability Office, 2011). Likewise, Medicaid expenditures now consume almost 20 percent of state budgets, crowding out other priorities, such as education (National Association of State Budget Officers, 2011). State funding for higher education has seen decreases of up to 20 percent as a result of increasing Medicaid costs (Kane and Orszag, 2003). These decreases in spending for education and other national priorities can be expected to continue unless the rate of health care spending is slowed.
For the public, the cost of health care is consuming more of every paycheck and rising higher than any increases in pay. In the past decade, the average income for a family of four with health insurance rose by 30 percent, while the family’s health care costs (including health insurance premiums
___________________________________________________
2All monetary estimates were converted to 2009 dollars using the Consumer Price Index inflation estimates unless otherwise noted (U.S. Bureau of Labor Statistics, 2011b).
3For the estimate of the cost of various food products assuming health care inflation rates, food prices from 1945 were calculated from the 1945 U.S. Statistical Abstract, with health care prices being drawn from national health expenditure accounts (Hansen, 1945; Keehan et al., 2011; Rice and Cooper, 1971).
and out-of-pocket costs) increased by 76 percent, effectively eliminating any wage increases (Auerbach and Kellermann, 2011). In 2012, almost 4 in 10 Americans with a serious illness, medical condition, injury, or disability reported that medical costs were a serious financial problem for them or their families (NPR et al., 2012). As a result of these rising costs, many families must forgo care; the percentage of the public unable to receive needed care in the past year because of its cost rose from 9 percent in 1999 to 15 percent in 2009. That figure for 2009 was fully 37 percent for those who were uninsured (National Center for Health Statistics, 2011). These high costs have strained families’ budgets and put coverage out of reach for many, contributing to the 50 million Americans without health insurance coverage (DeNavas-Walt et al., 2011).
In addition to unsustainable cost growth, there is evidence that a substantial proportion of health care expenditures is wasted, leading to little improvement in health or in the quality of care. Estimates vary on waste and excess health care costs, but they are large. The IOM workshop summary The Healthcare Imperative: Lowering Costs and Improving Outcomes assesses waste by evaluating excess costs in six domains: unnecessary services, services inefficiently delivered, prices that are too high,4 excess administrative costs, missed prevention opportunities, and medical fraud (IOM, 2010). These estimates, presented by workshop speakers with respect to their areas of expertise and based on assumptions from limited observations, suggest the substantial contribution of each domain to excess health care costs (see Table 3-1). Although these estimates have unknown overlap, their sum—$765 billion—indicates the significant scale of waste in the system.
Two other independent and differing analytic approaches—considering regional variation in costs and comparing costs across countries—produce similar estimates, with total excess costs approaching $750-$760 billion in 2009 (Farrell et al., 2008; IOM, 2010; Wennberg et al., 2002). One approach entailed analyzing health care spending in the United States versus that in peer countries of the Organisation for Economic Co-operation and Development (OECD) after adjusting for wealth. Based on 2006 data, excess U.S. health expenditures compared with those of OECD countries were estimated to constitute almost one-third of overall spending. After adjusting to 2009 health care expenditures, this estimate would be approximately $750 billion (Farrell et al., 2008). The second analysis examined variations
___________________________________________________
4In this report, price refers to the amount charged for a given health care service or product. It is important to note that there are frequently multiple prices for the same service or product, depending on the patient’s insurance status and payer, as well as other factors. Cost is the total sum of money spent at a given level (episodes, patients, organizations, state, national), or price multiplied by the volume of services or products used.
TABLE 3-1 Sources of Estimated Excess Costs in Health Care (2009)
| Category | Sources | Estimate of Excess Costs |
| Unnecessary Services |
|
$210 billion |
| Inefficiently Delivered Services |
|
$130 billion |
| Excess Administrative Costs |
|
$190 billion |
| Prices That Are Too High |
|
$105 billion |
| Missed Prevention Opportunities |
|
$55 billion |
| Fraud |
|
$75 billion |
SOURCE: Adapted with permission from IOM, 2010.
in Medicare spending across the country. It found that if Medicare spending were at the same level as the lowest decile, after adjusting for age, sex, and race, almost 30 percent of Medicare spending could be saved (Wennberg et al., 2002). Extrapolating this result to national health care spending in 2009 would lead to an estimated $750 billion in excess costs. While there are methodological issues with each approach to estimating excess costs, the consistently large figures resulting from each approach signal the potential for reducing health care costs while improving quality and health outcomes.
To highlight one factor in Table 3-1, higher prices are a major contributor to higher health care spending in the United States. A 2012 review found that the average commercial price in the United States was higher than that in the country with the next-highest price by 150 percent for a daily stay in a hospital, by 120 percent for an appendectomy, and by 50 percent for a hip replacement (International Federation of Health Plans, 2012). While prices do not fully explain the differences in costs among different countries, they are one major factor (Anderson et al., 2003).
To understand the scale of this waste, it is useful to compare it against other national expenses. For example, the estimated unnecessary costs and waste in health care outstrip the Fiscal Year 2009 outlays for the Department of Defense by more than $100 billion (OMB, 2010). Similarly, it is more than 1.5 times the nation’s total infrastructure investment in 2004, including roads, railroads, aviation, drinking water, telecommunications, and other structures, counting both public and private funding.5
This represents a tremendous opportunity cost, because this money could be directed toward higher-value health care uses. For instance, one-quarter of the amount could provide all recommended childhood and adolescent vaccinations to 152 million children (nearly the number of children born in the 40 years between 1968 and 2008).6 If this health care waste were eliminated, the redirected funds could provide health insurance coverage for more than 150 million workers (including both employer and employee contributions), equal to the entirety of the civilian labor force.7 And just a fraction of the unnecessary expenditures in health care could fund the $24 billion investment in public health needed to enable the delivery of a minimum level of public health services to every community in the United States (IOM, 2012).
Such waste also has opportunity costs for society more broadly. If only half of these excess expenditures were applied to other functions, it would be enough to buy groceries for every household in America for an entire
___________________________________________________
5Comparisons of health care waste with the national infrastructure investment were drawn from a Congressional Budget Office analysis (Congressional Budget Office, 2008), while the Department of Defense budget was calculated from the Fiscal Year 2009 outlays listed in the Fiscal Year 2011 U.S. Government Budget (OMB, 2010).
6The cost of childhood and adolescent vaccinations was drawn from a paper by Lindley et al. (2009), while the number of children born between 1968 and 2008 came from Centers for Disease Control and Prevention (CDC) data (Martin et al., 2010).
7The average premiums for a single worker were calculated using the Kaiser Family Foundation’s 2009 Employer Health Benefits survey, with the size of the 2009 civilian labor force being derived from Bureau of Labor Statistics estimates (Kaiser Family Foundation and Health Research & Educational Trust, 2009; U.S. Bureau of Labor Statistics, 2012).
year.8 If the waste in health care were redirected, it could provide every young person in America aged 18-24 the average annual tuition and fees of a 4-year institution of higher learning for 2 years.9 Or the total could pay the salaries of all of the nation’s first response personnel, including firefighters, police officers, and emergency medical technicians, for 12 years.10
Conclusion 3-2: The growth rate of health care expenditures is unsustainable, with waste that diverts major resources from necessary care and other priorities at every level—individual, family, community, state, and national.
Related findings:
- Health care costs in the United States far outpace the growth rate of costs in the rest of the economy. For 31 of the past 40 years, health care costs have increased at a greater rate than the economy as a whole, and now constitute 18 percent of national gross domestic product.
- The growth in health care costs has contributed to stagnation in real income gains for American families. Although income for families with health insurance has increased by 30 percent over the past decade, these gains have effectively been eliminated by a 76 percent increase in health care costs.
- A substantial portion of health care spending is wasteful. The total amount of unnecessary health care costs and waste in 2009 was an estimated $750-$765 billion, more than a third of total health care expenditures.
- Wasteful health expenditures directly stifle progress on other priorities. State Medicaid expenditures have displaced education investments, for example. If the waste in health care were redirected, it
___________________________________________________
8The cost of groceries was estimated from household expenditures on food for home use as listed in the Consumer Expenditure Survey, while the number of households was obtained from census estimates (U.S. Bureau of Labor Statistics, 2011a; U.S. Census Bureau, 2010).
9To calculate the years of tuition that could be available for young adults, the average cost of a 4-year institution of higher learning was obtained from U.S. Department of Education statistics, while the number of young adults aged 18 to 24 came from 2010 census estimates (Aud et al., 2011; U.S. Census Bureau, 2011).
10The comparison with expenditures on first responders was calculated from the annual salary data for firefighters, police officers, and emergency medical technicians provided in the 2009 National Compensation Survey, while the total number of individuals in those occupations was drawn from the 2009 Occupational Employment Statistics (U.S. Bureau of Labor Statistics, 2010a,b).
- could provide every young person in America 2 years of education at a 4-year institution of higher learning.
The examples discussed in this chapter highlight areas in which the health care system is failing to achieve its potential. They demonstrate the unevenness of the system’s performance, with many organizations and clinicians providing good care while others struggle in an increasingly complex and chaotic environment. Overcoming these problems will require transforming how the health care enterprise generates, processes, and applies information to improve the care of patients.
The stakes are high, with measurable impacts on care effectiveness, the economy, and overall health. If the nation’s care reached the quality of the highest-performing state, an estimated 75,000 fewer deaths would have occurred nationwide in 2005 (McCarthy et al., 2009; Schoenbaum et al., 2011). And several estimates suggest that up to $750 billion is lost annually as a result of care delivered inefficiently and ineffectively (IOM, 2010). If the necessary transformation does not occur, the health care system will continue on its current path, and each of these shortfalls will persist or worsen. While some patients will continue to receive world-class, excellent care, too many others will experience unnecessary harm and poor-quality care. Stress on clinicians will grow as they try to coordinate increasingly complex care with an increasing number of other health care providers. Costs and waste will continue to grow as well, squeezing out other important priorities. This future does not have to occur. The problems of shortfalls in outcomes and cost excesses can be addressed through the application of tools and strategies that enable continuous learning and improvement in care delivery, the subject of the next chapter.
AHRQ (Agency for Healthcare Research and Quality). 2011a. 2010 national healthcare disparities report. Rockville, MD: U.S. Department of Health and Human Services.
AHRQ. 2011b. National healthcare quality report, 2011. Rockville, MD: U.S. Department of Health and Human Services, AHRQ.
Akinbami, L. J., J. E. Moorman, and X. Liu. 2011. Asthma prevalence, health care use, and mortality: United States, 2005-2009. National Health Statistics Report (32):1-14.
Al-Khatib, S. M., A. Hellkamp, J. Curtis, D. Mark, E. Peterson, G. D. Sanders, P. A. Heidenreich, A. F. Hernandez, L. H. Curtis, and S. Hammill. 2011. Non-evidence-based ICD implantations in the United States. Journal of the American Medical Association 305(1):43-49.
Anderson, G. F., U. E. Reinhardt, P. S. Hussey, and V. Petrosyan. 2003. It’s the prices, stupid: Why the United States is so different from other countries. Health Affairs (Millwood) 22(3):89-105.
Arora, V., S. Gangireddy, A. Mehrotra, R. Ginde, M. Tormey, and D. Meltzer. 2009. Ability of hospitalized patients to identify their in-hospital physicians. Archives of Internal Medicine 169(2):199-201.
Aud, S., W. Hussar, G. Kena, K. Bianco, L. Frohlich, J. Kemp, and K. Tahan. 2011. The condition of education 2011. Washington, DC: U.S. Department of Education, National Center for Education Statistics.
Auerbach, D. I., and A. L. Kellermann. 2011. A decade of health care cost growth has wiped out real income gains for an average US family. Health Affairs 30(9):1630-1636.
Baicker, K., and A. Chandra. 2011 (unpublished). Aspirin, angioplasty, and proton beam therapy: The economics of smarter health care spending. Cambridge, MA: Harvard University.
Baicker, K., K. S. Buckles, and A. Chandra. 2006. Geographic variation in the appropriate use of cesarean delivery. Health Affairs (Millwood) 25(5):w355-w367.
Barnett, M. L., Z. Song, and B. E. Landon. 2012. Trends in physician referrals in the United States, 1999-2009. Archives of Internal Medicine 172(2):163-170.
Bates, D. W. 2002. Unexpected hypoglycemia in a critically ill patient. Annals of Internal Medicine 137(2):110-116.
Boult, C., L. Reider, K. Frey, B. Leff, C. M. Boyd, J. L. Wolff, S. Wegener, J. Marsteller, L. Karm, and D. Scharfstein. 2008. Early effects of “guided care” on the quality of health care for multimorbid older persons: A cluster-randomized controlled trial. The Journals of Gerontology. Series A, Biological Sciences and Medical Sciences 63(3):321-327.
Boult, C., L. Reider, B. Leff, K. D. Frick, C. M. Boyd, J. L. Wolff, K. Frey, L. Karm, S. T. Wegener, T. Mroz, and D. O. Scharfstein. 2011. The effect of guided care teams on the use of health services: Results from a cluster-randomized controlled trial. Archives of Internal Medicine 171(5):460-466.
Boyd, C. M., J. Darer, C. Boult, L. P. Fried, L. Boult, and A. W. Wu. 2005. Clinical practice guidelines and quality of care for older patients with multiple comorbid diseases: Implications for pay for performance. Journal of the American Medical Association 294(6):716-724.
Boyd, C. M., L. Reider, K. Frey, D. Scharfstein, B. Leff, J. Wolff, C. Groves, L. Karm, S. Wegener, J. Marsteller, and C. Boult. 2010. The effects of guided care on the perceived quality of health care for multi-morbid older persons: 18-month outcomes from a cluster-randomized controlled trial. Journal of General Internal Medicine 25(3):235-242.
Brook, R. H. 2010. The end of the quality improvement movement: Long live improving value. Journal of the American Medical Association 304(16):1831-1832.
Casalino, L. P., D. Dunham, M. H. Chin, R. Bielang, E. O. Kistner, T. G. Karrison, M. K. Ong, U. Sarkar, M. A. McLaughlin, and D. O. Meltzer. 2009. Frequency of failure to inform patients of clinically significant outpatient test results. Archives of Internal Medicine 169(12):1123-1129.
CDC (Centers for Disease Control and Prevention). 2011. Vital signs: Central line-associated blood stream infections—United States, 2001, 2008, and 2009. Morbidity and Mortality Weekly Report 60(8):243-248.
Classen, D. C., R. Resar, F. Griffin, F. Federico, T. Frankel, N. Kimmel, J. C. Whittington, A. Frankel, A. Seger, and B. C. James. 2011. ‘Global trigger tool’ shows that adverse events in hospitals may be ten times greater than previously measured. Health Affairs (Millwood) 30(4):581-589.
CMS (Centers for Medicare & Medicaid Services). 2012. National health expenditures summary and GDP: Calendar years 1960-2010. http://www.cms.gov/Research-Statistics-Data-and-Systems/Statistics-Trends-and-Reports/NationalHealthExpendData/downloads/tables.pdf (accessed August 31, 2012).
Cohen, M. R. 1999. Medication errors. Washington, DC: American Pharmaceutical Association Publications.
Cohen, M. R., S. M. Proulx, and S. Y. Crawford. 1998. Survey of hospital systems and common serious medication errors. Journal of Healthcare Risk Management 18(1):16-27.
Coleman, M. P., M. Quaresma, F. Berrino, J. M. Lutz, R. De Angelis, R. Capocaccia, P. Baili, B. Rachet, G. Gatta, T. Hakulinen, A. Micheli, M. Sant, H. K. Weir, J. M. Elwood, H. Tsukuma, S. Koifman, G. A. E Silva, S. Francisci, M. Santaquilani, A. Verdecchia, H. H. Storm, J. L. Young, and CONCORD Working Group. 2008. Cancer survival in five continents: A worldwide population-based study (CONCORD). Lancet Oncology 9(8):730-756.
Congressional Budget Office. 2008. Issues and options in infrastructure investment. Washington, DC: Congressional Budget Office.
Cutler, D. M., A. B. Rosen, and S. Vijan. 2006. The value of medical spending in the United States, 1960-2000. New England Journal of Medicine 355(9):920-927.
Darst, J. R., J. W. Newburger, S. Resch, R. H. Rathod, and J. E. Lock. 2010. Deciding without data. Congenital Heart Disease 5(4):339-342.
DeNavas-Walt, C., B. D. Proctor, and J. C. Smith. 2011. Income, poverty, and health insurance coverage in the United States: 2010. Washington, DC: U.S. Census Bureau.
Downey, J. R., T. Hernandez-Boussard, G. Banka, and J. M. Morton. 2012. Is patient safety improving? National trends in patient safety indicators: 1998-2007. Health Services Research 47(1 Pt. 2):414-430.
Farrell, D., E. Jensen, B. Kocher, N. Lovegrove, F. Melhem, L. Mendonca, and B. Parish. 2008. Accounting for the cost of US health care: A new look at why Americans spend more. Washingtion, DC: McKinsey Global Institute.
Fuhrmans, V. 2007. A novel plan helps hospital wean itself off pricey tests. Wall Street Journal, January 12.
Gatta, G., R. Capocaccia, M. P. Coleman, L. A. Gloeckler Ries, T. Hakulinen, A. Micheli, M. Sant, A. Verdecchia, and F. Berrino. 2000. Toward a comparison of survival in American and European cancer patients. Cancer 89(4):893-900.
Gawande, A. 2011. Cowboys and pit crews. New Yorker, May 26.
Good Stewardship Working Group. 2011. The “top 5” lists in primary care: Meeting the responsibility of professionalism. Archives of Internal Medicine 171(15):1385-1390.
Government Accountability Office. 2011. DoD health care: Prohibition on financial incentives that may influence health insurance choices for retirees and their dependents under age 65. Washington, DC: Government Accountability Office.
Hansen, M. H. 1945. Statistical abstract of the United States: 1944-45. Washington, DC: U.S. Department of Commerce, Bureau of the Census.
Harpole, L. H., M. J. Kelley, G. Schreiber, E. M. Toloza, J. Kolimaga, and D. C. McCrory. 2003. Assessment of the scope and quality of clinical practice guidelines in lung cancer. Chest 123(Suppl. 1):S7-S20.
Hsia, A. W., D. F. Edwards, L. B. Morgenstern, J. J. Wing, N. C. Brown, R. Coles, S. Loftin, A. Wein, S. S. Koslosky, S. Fatima, B. N. Sánchez, A. Fokar, M. C. Gibbons, N. Shara, A. Jayam-Trouth, and C. S. Kidwell. 2011. Racial disparities in tissue plasminogen activator treatment rate for stroke: A population-based study. Stroke 42(8):2217-2221.
International Federation of Health Plans. 2012. IFHIP 2011 comparative price report. London, UK: International Federation of Health Plans.
IOM (Institute of Medicine). 1985. Assessing medical technologies. Washington, DC: National Academy Press.
IOM. 1999. To err is human: Building a safer health system. Washington, DC: National Academy Press.
IOM. 2002. Care without coverage: Too little, too late. Washington, DC: National Academy Press.
IOM. 2003a. A shared destiny: Community effects of uninsurance. Washington, DC: The National Academies Press.
IOM. 2003b. Hidden costs, value lost: Uninsurance in America. Washington, DC: The National Academies Press.
IOM. 2003c. Unequal treatment: Confronting racial and ethnic disparities in health care. Washington, DC: The National Academies Press.
IOM. 2004. Insuring America’s health: Principles and recommendations. Washington, DC: The National Academies Press.
IOM. 2009a. America’s uninsured crisis: Consequences for health and health care. Washington, DC: The National Academies Press.
IOM. 2009b. Initial national priorities for comparative effectiveness research. Washington, DC: The National Academies Press.
IOM. 2010. The healthcare imperative: Lowering costs and improving outcomes: Workshop series summary. Washington, DC: The National Academies Press.
IOM. 2012. For the public’s health: Investing in a healthier future. Washington, DC: The National Academies Press.
Jencks, S. F., M. V. Williams, and E. A. Coleman. 2009. Rehospitalizations among patients in the Medicare fee-for-service program. New England Journal of Medicine 360(14):1418-1428.
Kaiser Family Foundation and Health Research & Educational Trust. 2009. Employer health benefits: 2009 annual survey. Menlo Park, CA: Henry J. Kaiser Family Foundation.
Kane, T. J., and P. R. Orszag. 2003. Funding restrictions at public universities: Effects and policy implications. Washington, DC: Brookings Institution.
Keehan, S. P., A. M. Sisko, C. J. Truffer, J. A. Poisal, G. A. Cuckler, A. J. Madison, J. M. Lizonitz, and S. D. Smith. 2011. National health spending projections through 2020: Economic recovery and reform drive faster spending growth. Health Affairs (Millwood) 30(8):1594-1605.
Kocher, R., and N. R. Sahni. 2011. Rethinking health care labor. New England Journal of Medicine 365(15):1370-1372.
Kottke, T. E., D. A. Faith, C. O. Jordan, N. P. Pronk, R. J. Thomas, and S. Capewell. 2009. The comparative effectiveness of heart disease prevention and treatment strategies. American Journal of Preventive Medicine 36(1):82-88.
Landrigan, C. P., G. J. Parry, C. B. Bones, A. D. Hackbarth, D. A. Goldmann, and P. J. Sharek. 2010. Temporal trends in rates of patient harm resulting from medical care. New England Journal of Medicine 363(22):2124-2134.
Leape, L. L., and D. M. Berwick. 2005. Five years after to err is human: What have we learned? Journal of the American Medical Association 293(19):2384-2390.
Lee, D. H., and O. Vielemeyer. 2011. Analysis of overall level of evidence behind infectious diseases society of America practice guidelines. Archives of Internal Medicine 171(1):18.
Levinson, D. R. 2010. Adverse events in hospitals: National incidence among Medicare beneficiaries. Washington, DC: U.S. Department of Health and Human Services, Office of Inspector General.
Levinson, D. R. 2012. Hospital incident reporting systems do not capture most patient harm. Washington, DC: U.S. Department of Health and Human Services, Office of Inspector General.
Li, P., H. T. Stelfox, and W. A. Ghali. 2011. A prospective observational study of physician handoff for intensive-care-unit-to-ward patient transfers. American Journal of Medicine 124(9):860-867.
Lindley, M. C., A. K. Shen, W. A. Orenstein, L. E. Rodewald, and G. S. Birkhead. 2009. Financing the delivery of vaccines to children and adolescents: Challenges to the current system. Pediatrics 124(Suppl. 5):S548-S557.
Martin, J. A., B. E. Hamilton, P. D. Sutton, S. J. Ventura, T. J. Mathews, and M. J. K. Osterman. 2010. Births: Final data for 2008. Hyattsville, MD: National Center for Health Statistics.
McCarthy, D., S. How, C. Schoen, J. Cantor, and D. Belloff. 2009. Aiming higher: Results from a state scorecard on health system performance. New York: Commonwealth Fund Commission on a High Performance Health System.
McGlynn, E. A., S. M. Asch, J. Adams, J. Keesey, J. Hicks, A. DeCristofaro, and E. A. Kerr. 2003. The quality of health care delivered to adults in the United States. New England Journal of Medicine 348(26):2635-2645.
Medicare Payment Advisory Commission. 2008. Reforming the delivery system. Washington, DC: Medicare Payment Advisory Commission.
National Association of State Budget Officers. 2011. State expenditure report 2010: Examining fiscal 2009-2011 state spending. Washington, DC: National Association of State Budget Officers.
National Center for Health Statistics. 2011. Health, United States, 2010: With special feature on death and dying. Hyattsville, MD: U.S. Department of Health and Human Services, CDC.
Naylor, M., D. Brooten, R. Jones, R. Lavizzo-Mourey, M. Mezey, and M. Pauly. 1994. Comprehensive discharge planning for the hospitalized elderly. A randomized clinical trial. Annals of Internal Medicine 120(12):999-1006.
Naylor, M. D., D. Brooten, R. Campbell, B. S. Jacobsen, M. D. Mezey, M. V. Pauly, and J. S. Schwartz. 1999. Comprehensive discharge planning and home follow-up of hospitalized elders: A randomized clinical trial. Journal of the American Medical Association 281(7):613-620.
Naylor, M. D., D. A. Brooten, R. L. Campbell, G. Maislin, K. M. McCauley, and J. S. Schwartz. 2004. Transitional care of older adults hospitalized with heart failure: A randomized, controlled trial. Journal of the American Geriatrics Society 52(5):675-684.
Niefeld, M. R., J. B. Braunstein, A. W. Wu, C. D. Saudek, W. E. Weller, and G. F. Anderson. 2003. Preventable hospitalization among elderly Medicare beneficiaries with type 2 diabetes. Diabetes Care 26(5):1344-1349.
NPR, Robert Wood Johnson Foundation, and Harvard School of Public Health. 2012. Poll: Sick in America (summary). http://www.npr.org/documents/2012/may/poll/summary.pdf (accessed May 21, 2012).
OMB (Office of Management and Budget). 2010. Fiscal year 2011 budget of the U.S. government. Washington, DC: OMB.
Pham, H. H., D. Schrag, A. S. O’Malley, B. Wu, and P. B. Bach. 2007. Care patterns in Medicare and their implications for pay for performance. New England Journal of Medicine 356(11):1130-1139.
Pham, H. H., A. S. O’Malley, P. B. Bach, C. Saiontz-Martinez, and D. Schrag. 2009. Primary care physicians’ links to other physicians through Medicare patients: The scope of care coordination. Annals of Internal Medicine 150(4):236-242.
Poonacha, T. K., and R. S. Go. 2011. Level of scientific evidence underlying recommendations arising from the national comprehensive cancer network clinical practice guidelines. Journal of Clinical Oncology 29(2):186-191.
Pronovost, P., D. Needham, S. Berenholtz, D. Sinopoli, H. Chu, S. Cosgrove, B. Sexton, R. Hyzy, R. Welsh, G. Roth, J. Bander, J. Kepros, and C. Goeschel. 2006. An intervention to decrease catheter-related bloodstream infections in the ICU. New England Journal of Medicine 355(26):2725-2732.
Rice, D. P., and B. S. Cooper. 1971. National health expenditures, 1929-70. Social Security Bulletin 34(1):3-18.
Rosenthal, T. C. 2008. The medical home: Growing evidence to support a new approach to primary care. Journal of the American Board of Family Medicine 21(5):427-440.
Schoenbaum, S. C., C. Schoen, J. L. Nicholson, and J. C. Cantor. 2011. Mortality amenable to health care in the United States: The roles of demographics and health systems performance. Journal of Public Health Policy 32(4):407-529.
Shenson, D., J. Bolen, and M. Adams. 2007. Receipt of preventive services by elders based on composite measures, 1997-2004. American Journal of Preventive Medicine 32(1):11-18.
Squires, D. 2011. The U.S. health system in perspective: A comparison of twelve industrialized nations. New York: Commonwealth Fund.
Stremikis, K., C. Schoen, and A.K. Fryer. 2011. A call for change: The 2011 Commonwealth Fund survey of public views of the U.S. health system. New York: Commonwealth Fund.
U.S. Bureau of Labor Statistics. 2010a. May 2009 national occupational employment and wage estimates. http://www.bls.gov/oes/2009/may/oes_nat.htm (accessed May 22, 2012).
U.S. Bureau of Labor Statistics. 2010b. National compensation survey: Occupational earnings in the United States, 2009. http://www.bls.gov/ncs/ocs/sp/nctb1346.pdf (accessed May 22, 2012).
U.S. Bureau of Labor Statistics. 2011a. Average annual expenditures and characteristics of all consumer units, consumer expenditure survey, 2006-2010. http://www.bls.gov/cex/2010/standard/multiyr.pdf (accessed August 31, 2012).
U.S. Bureau of Labor Statistics. 2011b. Consumer Price Index (CPI). http://www.bls.gov/cpi/ (accessed September 25, 2011).
U.S. Bureau of Labor Statistics. 2012. Labor force statistics from the current population survey. http://data.bls.gov/pdq/SurveyOutputServlet?request_action=wh&graph_name=LN_cpsbref1 (accessed May 23, 2012).
U.S. Census Bureau. 2010. Households and families: 2010. http://www.census.gov/prod/cen2010/briefs/c2010br-14.pdf (accessed September 25, 2011).
U.S. Census Bureau. 2011. Age and sex composition: 2010. http://www.census.gov/prod/cen2010/briefs/c2010br-03.pdf (accessed May 22, 2012).
Wennberg, J. E., E. S. Fisher, and J. S. Skinner. 2002. Geography and the debate over Medicare reform. Health Affairs (Millwood) (Suppl. Web Exclusives):W96-W114.
Were, M., X. Li, J. Kesterson, J. Cadwallader, C. Asirwa, B. Khan, and M. Rosenman. 2009. Adequacy of hospital discharge summaries in documenting tests with pending results and outpatient follow-up providers. Journal of General Internal Medicine 24(9):1002-1006.
Whitt, N., R. Harvey, G. McLeod, and S. Child. 2007. How many health professionals does a patient see during an average hospital stay? New Zealand Medical Journal 120(1253):U2517.
Woolf, S. H., and P. Braveman. 2011. Where health disparities begin: The role of social and economic determinants—and why current policies may make matters worse. Health Affairs (Millwood) 30(10):1852-1859.
Zhan, C., and M. R. Miller. 2003. Excess length of stay, charges, and mortality attributable to medical injuries during hospitalization. Journal of the American Medical Association 290(14):1868-1874.


