
Chapters 4 and 5 examined the role of health systems and health behaviors in explaining the U.S. health disadvantage, but health is also deeply influenced by “social determinants,” such as income and wealth, education, occupation, and experiences based on racial or ethnic identification. These factors have been shown to contribute to large health disparities in the United States and other countries and should be considered in efforts to explain disparities in health among countries. Although the science of the social determinants of health is still evolving, a growing body of biological, epidemiological, and social science research has revealed pervasive and strong links between a range of social factors that shape living and working conditions and a wide array of health outcomes. A rapidly accumulating literature also is elucidating the biological processes that may account for these health effects (Adler and Stewart, 2010; Braveman et al., 2011b; Commission on the Social Determinants of Health, 2008).
Following widespread convention, we use the term “social” to refer to economic as well as psychosocial factors. Access to, and the quality of, medical care are clearly influenced by social policies, such as the legislation creating Medicare and Medicaid in 1965 and the Affordable Care Act in 2010. Generally, however, and in this report, the terms “social factors” and “social determinants of health” refer to factors outside the domain of public health and health care, which are covered in Chapter 4.
As discussed above, the terms “upstream” and “downstream” are often used to denote relative positions of a given health determinant on plausible causal chains. Upstream factors are closer to the fundamental cause and often farther (“distal”) from the observed health outcome; downstream
(“proximate”) factors are closer to the ends of causal chains. Upstream social factors that have repeatedly been linked with important health outcomes in many populations include income, accumulated wealth, educational attainment, and experiences based on racial or ethnic identification. Downstream factors (which may be shaped by upstream factors) include unhealthy diets, lack of exercise, and smoking. Features of neighborhoods and work environments may be thought of as midstream.
This chapter focuses on the social factors that current knowledge suggests may contribute significantly to the U.S. health disadvantage and that can be compared across high-income countries: income and poverty, income inequality, education, employment, social mobility, household composition, and experiences based on racial or ethnic identification (Galea et al., 2011; Link and Phelan, 1995; Marmot, 2005).
The chapter focuses primarily on social characteristics of individuals, families, and populations. The potential role of the social environment-—such as features of housing, transportation, and neighborhoods—in contributing to the U.S. health disadvantage is the focus of Chapter 7.
As in other chapters, the panel posed three questions:
• Do social factors matter to health?
• Are adverse social factors more prevalent in the United States than in other high-income countries?
• Do differences in social factors explain the U.S. health disadvantage?
Before turning to these questions, however, we offer an important comment on evidence and the role of social factors on health. Documenting causality and testing the effectiveness of interventions for social factors is inherently challenging (Braveman et al., 2011b; Kawachi et al., 2010). The time intervals between exposures to social factors and a health outcome—such as the psychosocial consequences of poverty—may be quite long (Braveman et al., 2010a; Galobardes et al., 2008; Rychetnik et al., 2002). Exposures may occur during childhood, gestation, or even during the childhood of one’s parents (Hertzman, 1999; Kuh et al., 2002; Melchior et al., 2007; Turrell et al., 2007). Furthermore, the causal pathways from fundamental social causes to health outcomes are often complex, with opportunities for effect modification at multiple steps along the way (Braveman et al., 2010a). Relationships are also not unidirectional: cross-sectional associations do not clarify the role of reverse causality, as when poor health limits education or income. Adverse health and socioeconomic circumstances can also negatively affect household stability, family composition, and social support. Because it would be both difficult, if not unethical, to test these hypotheses in randomized controlled
trials,1 researchers use a variety of other methods, including multivariate modeling, instrumental variables, quasi-experimental designs, Bayesian approaches to inference, natural experiments, and “connecting-the-dots” between disparate bodies of knowledge (Braveman et al., 2010a; Dow et al., 2010; Kelly et al., 2006).
Another challenge in analyzing social factors in a cross-national context is that a given factor may have different health implications depending on local circumstances. Standards of living vary across countries, as do social safety nets and other programs designed to alleviate poverty, unemployment, and homelessness. We therefore approach this topic aware of these important caveats and limitations.
QUESTION 1:
DO SOCIAL FACTORS MATTER TO HEALTH?
Recent reviews have documented links between social factors and health, elucidated plausible causal pathways, and discussed the strength of evidence for causality (Adler and Rehkopf, 2008; Adler and Stewart, 2010; Braveman et al., 2010a, 2011b; Commission on the Social Determinants of Health, 2008; Kawachi et al., 2010). As shown in Box 6-1, among the broad types of social factors with strong and pervasive links to a wide array of important health outcomes are income (Mackenbach et al., 2005; Muennig et al., 2010; Woolf et al., 2010), accumulated wealth (Pollack et al., 2007), educational attainment (Elo and Preston, 1996; Jemal et al., 2008a; Woolf et al., 2007), occupational characteristics (An et al., 2011), and social inequality based on racial or ethnic group (Bleich et al., 2012; Marmot, 2005; Williams and Collins, 2001; Williams and Mohammed, 2009). In this section, we briefly summarize this literature.
Income and Wealth
Extensive evidence documents the association between income and mortality. Unhealthy behaviors, such as smoking, tend to be more prevalent among low-income groups. Income or wealth enables one to afford a nutritious
_________________
1The premise that randomized controlled trials are the “gold standard” for establishing causal relationships has put the accumulation of knowledge about the social determinants of health at a distinct disadvantage. It is increasingly recognized that scientifically valid studies of social factors that can answer important questions must draw on a wide variety of well-implemented research designs (Anderson and McQueen, 2009; Black, 1996; Glasgow et al., 2006; McQueen, 2009; Petticrew and Roberts, 2003; Victora et al., 2004).
BOX 6-1
Social Factors That Affect Health Outcomes
Upstream social factors—Laws, policies, and underlying values that shape the following:
• Income and wealth
• Education
• Employment
• Household composition
• Experiences based on race or ethnic group
• Social mobility
• Stressful experiences related to any of the above
• Income inequality
Midstream social factors—Factors that are strongly influenced by upstream factors and that are likely to affect health:
• Housing
• Transportation
• Other conditions in homes, schools, workplaces, neighborhoods, and communities, including conditions that produce stress and family disruption (e.g., parenting skills, parenting stress, leisure time, quality of schooling, physical and psychosocial working conditions)
diet (Treuhaft and Karpyn, 2010), to buy or rent healthy housing2 in a healthy neighborhood (Shaw, 2004), and to engage in regular exercise (e.g., through gym membership or living where it is safe and pleasant to exercise outdoors). However, careful analysis of longitudinal data has revealed that the association between adverse economic conditions and mortality persists even after adjusting for unhealthy behaviors (Lantz et al., 2010), suggesting that economic stresses may also affect health through other pathways. Access to employment, educational opportunities, and medical care can be constrained by one’s income, particularly in the absence of adequate public transportation (Gordon-Larsen et al., 2006). Exposure to poverty during childhood may have particularly strong and enduring effects on health across the entire life course (Cohen et al., 2010; Pollitt et al., 2005). Material hardship is strongly related to family strife and disruption (Braveman
_________________
2Healthy housing refers to domiciles that are free of health and safety threats, such as lead, which can affect children’s cognitive function, and free of excessive dust, mites, and mold, which can provoke and exacerbate respiratory disease (Lanphear et al., 2001).
et al., 2010a; Evans et al., 2012). Accumulated wealth can buffer the adverse effects of temporary periods of lower income.
Income Inequality
Income inequality in a society has repeatedly been shown to be inversely associated with good health, but there is controversy about the health effects of relative income inequality apart from the effects of absolute poverty or economic hardship (Subramanian and Kawachi, 2004). Some experts view relative inequality as a factor with independent effects, which may touch the whole population, perhaps by undermining social cohesion (see Chapter 7) (Daniels et al., 2000; Pickett and Wilkinson, 2009, 2010; Wilkinson and Pickett, 2007, 2009). Other research, however, challenges the premise that relative economic inequality exerts an independent effect apart from its association with absolute levels of material deprivation (Beckfield, 2004; Deaton and Lubotsky, 2009; Lynch et al., 2001, 2004a, 2004b). The apparent association between economic inequality and poor health could reflect other more fundamental factors that shape both economic inequality and health, such as a society’s lack of social solidarity. There is, however, consensus about the adverse health implications of absolute material deprivation.3
Education
Education and health are strongly interrelated. In 2006, the life expectancy of 25-year-old American men without a high school diploma was 9.3 years shorter than those with a bachelor’s degree or higher education; the corresponding disparity for women was 8.6 years (National Center for Health Statistics, 2012).4 Education is generally a prerequisite for desirable employment and associated income and other resources (e.g., medical insurance, pensions, sick leave). Early childhood experiences and education shape early childhood development, which in turn influences school readiness and, ultimately, educational attainment. Education can confer knowledge, problem-solving skills, and a sense of control over life circumstances.
These psychosocial factors have been strongly tied to healthy behaviors (Dunn, 2010; Pampel et al., 2010; Umberson et al., 2008) and, in some
_________________
3Debates about the role of relative economic inequality isolated from the effects of absolute deprivation have generally been confined to academic settings. In most contexts, economic inequality is assumed to refer to absolute economic adversity for substantial segments of a population alongside extreme wealth for others. High levels of relative inequality and absolute hardship/poverty coexist in the United States and many other nations.
4In some research, the association between education and unhealthy behaviors and mortality loses significance after controlling for confounding variables, notably income (Lantz et al., 2010).
cases, more directly to health outcomes (Matthews et al., 2010; Pudrovska et al., 2005). For example, across countries, education and smoking rates are inversely related (Garrett et al., 2011; National Center for Health Statistics, 2012; Pampel and Denney, 2011), and parental education is associated with the health behaviors of children.5 Other evidence also supports causal connections between education and health outcomes (Fonsenca and Zheng, 2011; Lleras-Muney, 2005), but the two may also have common antecedents. Hopelessness and powerlessness, for example, may contribute both to unhealthy behaviors and to educational and occupational setbacks, and they may link more directly to poor health through plausible physiologic mechanisms (Boehm and Kubzansky, 2012; Downey and Van Willigen, 2005; Goodman et al., 2009; Marmot et al., 1997; Matthews et al., 2010; Pudrovska et al., 2005; Seeman et al., 2010).
Employment
Employment shapes health in diverse ways, in part by determining employment opportunities and income (World Economic Forum, 2011). Low-skilled and low-status employment is more likely to involve exposure to physical hazards, such as toxic chemicals (e.g., pesticides, cleaning solvents), and to occupational injuries. Job loss, unemployment, and economic contraction have been linked with ill health and higher mortality because of psychosocial as well as economic consequences (Bartley and Owen, 1996; McLeod et al., 2012; Paxson and Schady, 2005; Strully, 2009; Sullivan and von Wachter, 2009), although the evidence is not conclusive (Catalano et al., 2011). (See Chapter 7 for additional evidence on the health and injury risks associated with the work environment.)
Social Status
Income, wealth, education, and employment all have implications for prestige and acceptance in society, and hence may affect health through psychosocial pathways involved in perceived position in a social hierarchy. Lower perceived social status has been associated with adverse health outcomes in some studies even after considering objective measures of resources and social status (Singh-Manoux et al., 2003, 2005).
_________________
5In 2007-2010, in U.S. households in which the head of household had less than a high school education, 24 percent of boys and 22 percent of girls were obese. In households where the head had a bachelor’s degree or higher, the corresponding figures were 11 percent for boys and 7 percent for girls (National Center for Health Statistics, 2012).
Household Composition
Household composition, which is strongly related to income and education, can influence social factors that in turn influence health.6 For example, children in low-income single-parent households experience higher rates of poverty, food insecurity, unstable housing, and other adverse living conditions (Center on Human Needs, 2012a). Poverty puts strains on families and creates a greater risk of single-parent households (Center on Human Needs, 2012a; DeNavas-Walt et al., 2011).
Low-income households are often the setting for adolescent childbearing, which is more common in the United States than in other high-income countries (see Chapter 2). Adolescent motherhood affects two generations, children and mothers. Adolescent mothers are less likely than other adolescents to complete their education, and they have more restricted labor market opportunities and more disadvantaged family and household environments (Ashcraft and Lang, 2006; Hoffman and Maynard, 2008). Their children face a greater risk of poor child care, weak maternal attachments, poverty, and other adverse conditions (Baldwin and Cain, 1980; Card, 1981). The female children of adolescent mothers are also at increased risk of becoming adolescent mothers themselves, thus perpetuating adverse conditions over two generations (Kahn and Anderson, 1992).
Racial and Ethnic Factors
In many countries, a variety of health outcomes vary markedly by race and ethnicity (Agency for Healthcare Research and Quality, 2011; Commission on Social Determinants of Health, 2008). These health disparities often mirror large differences in income, wealth, education, occupation, and neighborhood conditions among people of different races and ethnicities, differences that reflect a historical legacy of discrimination (Acevedo-Garcia et al., 2008; Bleich et al., 2012; Cullen et al., 2012; Williams, 1999; -Williams and Collins, 1995, 2001).7 For example, in the United States, blacks with the same level of education as whites have lower incomes, as well as markedly lower levels of accumulated wealth even at the same level of income (Braveman et al., 2005; Kawachi et al., 2005). Living in a society with a high degree of racial inequality may harm the health of society at large—not only of those who experience disadvantage—in the same ways
_________________
6As noted above, the reverse is also true: illness can influence household composition and stability, as well as education and income opportunities.
7It is now widely recognized that racial and ethnic groupings are primarily social, not biological, constructs, and that genetic differences probably make a small contribution to racial or ethnic health disparities (American Anthropological Association, 1998; McCann-Mortimer et al., 2004; Winker, 2004).
that some researchers have argued that relative economic inequality may be detrimental to society at large, for example, by undermining social cohesion and trust (Wilkinson and Pickett, 2009) or by affecting individuals’ sense of their relative social standing (Marmot, 2006). Unfortunately, as noted below, data are lacking to compare degrees of racial inequality across high-income countries.
In the United States, racial and ethnic groups that have historically experienced discrimination,8 including blacks, Native Americans, and Hispanics, may suffer ill health effects from these experiences. The health effects may result both from material deprivation and other conditions that directly damage health and from physiologic mechanisms involved in reactions to stress. Such stress, which has been linked with smoking (Purnell et al., 2012) and hypertension (Sims et al., 2012), can result not only from overtly discriminatory experiences but also from a pervasive vigilance about whether harmful incidents will occur to themselves or their families (Krieger et al., 2011; Nuru-Jeter et al., 2009). A relative difference in social standing or a sense of social exclusion for any reason may induce stress and influence one’s sense of self-worth or control, which may in turn influence subsequent economic success, health-related behaviors, and health outcomes (Dunn, 2010; Umberson et al., 2008).
Migration
Migration and associated experiences and cultural traditions have been shown to influence health and health behaviors. Almost 14 percent of the U.S. population in 2008 was born outside the United States (OECD, 2011e). Although some immigrants are at higher risk of certain infectious diseases, most recent immigrants to the United States generally have favorable health profiles compared with the native-born population.
Stress
Psychological distress that arises from any of the above social factors, including from social rejection or exclusion associated with racial or ethnic identification, may lead to worse health through physiologic mechanisms involved in stress (Matthews et al., 2010; McEwen and Gianaros, 2010). Those mechanisms include the effects of stress on the hypothalamic-pituitary-adrenal (HPA) axis, the sympathetic nervous system, and immune
_________________
8This legacy has been perpetuated by deeply rooted societal structures, even in the absence of conscious intent to discriminate. This form of unintentional discrimination is often referred to as structural or institutional racism, deeply rooted ways in which opportunity is differentially structured along racial or ethnic lines (Smedley, 2012).
and inflammatory phenomena (Danese et al., 2007; Halfon and Hochstein, 2002; McEwen and Gianaros, 2010; Shonkoff et al., 2009). These effects are thought to induce end organ damage and cardiovascular disease (Barker, 1998; McEwen and Gianaros, 2010). While life-long stress leads to accumulated damage, early exposure to stress can affect sensitive biological processes, such as brain development, and thereby permanently disrupt stress responses later in life (Gluckman and Hanson, 2006; Shonkoff et al., 2009).
A Life-Course Perspective
Research increasingly confirms that health is shaped by social factors that individuals have faced across their entire life courses, not just current or recent experiences. Social disadvantages—and the health consequences associated with them—may accumulate across an individual’s lifetime and span multiple generations, making the unfavorable odds increasingly difficult to overcome (Goodman et al., 2011).
Social disadvantage can therefore play an important contributory role to the development of chronic diseases and other conditions that threaten the health and life expectancy of adults age 50 and older, but they can also foster the health problems of early life, including many of the conditions discussed in Chapters 1 and 2. For example, the educational attainment and cognitive skills of today’s youth could influence the behaviors that contribute to infant and child mortality due to rates of accidents and homicides; adolescent births and sexually transmitted infection; HIV/AIDS; and drug-related mortality.
Chronic material hardship or stressful events in childhood may also manifest their effects in mid- or even late adulthood (Cohen et al., 2010; Goodman et al., 2011). Chronic social or economic hardship during childhood has been linked with morbidity and mortality due to cardiovascular disease, diabetes, and other chronic diseases in adulthood (Hertzman, 1999; Kuh et al., 2002; Lawlor et al., 2005; Melchior et al., 2007; Turrell et al., 2007). There is evidence of health consequences from experiences during critical or sensitive periods (e.g., in early childhood and puberty), as well as from the cumulative effects of experiences over an individual’s life course (Murray et al., 2011; National Research Council and Institute of Medicine, 2000; Viner, 2012; World Bank, 2007). Over and above the influence of any particular event, the number of such events and the number of domains affected by social disadvantage can determine the health damage associated with poverty (Evans and Kim, 2010; Sexton and Linder, 2011).
Inheritance is a major route of transmission for wealth and its associated advantages. Low social mobility—that is, the low likelihood that a person born to low-income or poorly educated parents will achieve higher
income or education levels as an adult—could exacerbate the health effects of adverse social conditions by leading to the accumulation of social disadvantage across generations, thereby producing greater poverty or other consequences that compromise health (Case et al., 2005). Downward social mobility has repeatedly been linked with adverse health outcomes (Case and Paxson, 2010, 2011; Currie and Widom, 2010; Delaney and Smith, 2012). Lack of upward mobility in a society could exacerbate economic and social inequality and could plausibly affect health through a range of pathways, including by shaping optimism (Boehm and Kubzansky, 2012) and health-related behaviors (Dehlendorf et al., 2010; McDade et al., 2011) and possibly by undermining feelings of social solidarity (Pickett and Wilkinson, 2010; Wilkinson and Pickett, 2009).
Epigenetic Effects
Social factors—or their consequences in social and physical environments—may also influence health by interacting with a person’s genotype in ways that can trigger or suppress the phenotypic expression of deleterious (or favorable) genes that may be related to obesity, heart and lung disease, diabetes, and cancer. A deleterious gene in one’s DNA may not be harmful in the absence of certain triggers that “turn on” gene expression and cause cancers to develop. These modifications in gene expression, which are thought to occur through molecular processes (such as histone modification and DNA methylation) can be inherited and affect the health of offspring. “Epigenetics” refers to the transfer, from one generation to the next, of gene expression patterns that do not rely explicitly on differences in the DNA code (Gluckman and Hanson, 2006; Institute of Medicine, 2006b; Sandoval and Esteller, 2012). Social and environmental factors may therefore influence biological outcomes through their effects on gene expression.
Cross-country comparisons of social factors can be difficult because of differences in measurement, as well as the meaning of a given factor in different settings. Readily comparable cross-national data are not available on all relevant factors. For example, racial and ethnic disparities are important to health, but data are lacking to compare the United States with peer countries in terms of the magnitudes of racial and ethnic health disparities. Data are available, however, to examine health disparities by income, education, and other socioeconomic determinants. The comparative data produced by the OECD are widely considered to be the best available and are the principal source of cross-national comparisons presented here.
In aggregate, socioeconomic conditions—income and wealth—in the United States are at or above average for high-income countries. Both the size of the U.S. economy and median household income in the United States are among the highest in the world. As of 2007, the United States ranked second in the OECD (after Luxembourg) in annual household income9 (OECD, 2011e) and seventh in gross domestic product per capita (World Bank, 2012a). However, the United States ranks poorly on the equitable distribution of economic resources, with relatively high levels of poverty and income inequality.
Poverty
The relative poverty rate,10 defined as the proportion of the population with low incomes relative to the median income, has been higher in the United States than in other high-income countries since at least 1980 (Luxembourg Income Study, 2012). Historically, the U.S. poverty rate declined from very high levels in the 1940s to low levels in the late 1970s (Danziger and Gottschalk, 1986): the rate (based on total household income) fell from 40.5 percent in 1949 to 22.1 percent in 1959, 14.4 percent in 1969, and 13.1 percent in 1979 (Ross et al., 1987). During these same decades, many European countries instituted social welfare reforms that were designed to promote social equity and alleviate economic distress (see Chapter 8), lowering the rates of poverty in many of these countries (Brady, 2005). The gap between the levels of income inequality in the United States and other rich democracies began to widen in the 1970s-1980s, possibly because of the adoption of more conservative economic policies in the United States and a retrenchment in public assistance programs (Card and Freedman, 1993; Danziger and Gottschalk, 1995; Hanratty and Blank, 1990).
Absolute poverty is a basis for comparing incomes across countries against a common benchmark (such as a given level of income in U.S. dollars). Analyses that have used a common data set to compare countries in terms of absolute poverty find that other countries seem to have higher rates
_________________
9Household income is defined by the OECD as annual median equivalized household disposable income: gross household income after deduction of direct taxes and payment of social security contributions and excluding in-kind services provided to households by governments and private entities, consumption taxes, and imputed income flows due to home ownership (OECD, 2011e).
10Relative poverty is defined by the OECD as the percentage of people living with less than 50 percent of median equivalized household income. “People are classified as poor when their equivalized household income is less than half of the median prevailing in each country. The use of a relative income-threshold means that richer countries have the higher poverty thresholds. Higher poverty thresholds in richer countries capture the notion that avoiding poverty means an ability to access the goods and services that are regarded as customary or the norm in any given county” (OECD, 2011e, p. 68). See above discussion of absolute poverty as an alternate measure.
than the United States (Kenworth, 1998; Sharpe, 2011; Smeeding, 2006). This finding reflects the higher overall standard of living in the United States (Smeeding, 2006). For example, in one analysis, the U.S. absolute poverty rate was lower than 8 of 10 high-income countries (Gornick and Jäntti, 2010).
Beginning in the 1980s, relative poverty rates in the United States have consistently exceeded those of other high-income countries (Smeeding, 2006) (see Figure 6-1). This difference has increased over time. By the late 2000s, the relative poverty rate in the United States exceeded that of all 16 peer countries. It also exceeded rates in 31 OECD countries, including Australia, Chile, the Czech Republic, Estonia, Hungary, Japan, Korea, Mexico, New Zealand, Poland, the Slovak Republic, Slovenia, and Turkey (OECD, 2011e).
Measured in terms of relative poverty, the United States also has the highest rate of child poverty of the 17 peer countries (Gornick and Jäntti, 2010; OECD, 2012e). As of 2008, more than one in five (21.6 percent) U.S. children lived in poverty, the fifth highest rate among 34 OECD countries (OECD, 2012e).11 Similarly, a UNICEF study found the United States to have the highest child poverty rate of the 24 rich countries it examined (UNICEF, 2007).12 As with poverty overall, the trend first became noticeable in the 1980s, a time of economic transformation in the United States, and the effect on child poverty rates was dramatic: within the short span of the mid-1980s, child poverty increased by almost one-third in the United States (Jäntti and Danziger, 1994). Since then, the country has consistently had the highest relative child poverty rates among all rich nations (OECD, 2012e; Whiteford and Adema, 2007) (see Figure 6-2).
Income Inequality
According to the OECD, income inequality in the United States in the late 2000s was higher than the average of all OECD countries. One common measure of income inequality is the Gini coefficient, which ranges from 0 to 1 with larger values indicating greater inequality: the OECD average was 0.31, and it was 0.38 in the United States. The U.S. Gini coefficient exceeded that of all 16 peer countries, as well as all other OECD countries except Chile, Mexico, and Turkey (OECD, 2011e).13
_________________
11The U.S. child poverty rate also exceeds that of many emerging economies in the former Soviet satellite countries of Eastern Europe.
12Measured in terms of absolute poverty, a few high-income countries appear to have higher child poverty rates than the United States (Gornick and Jäntti, 2010).
13The OECD values for the Gini coefficient in the United States are lower than those reported by the U.S. Census Bureau, which reported a Gini coefficient of 0.47 in 2010 (DeNavas-Walt et al., 2011).
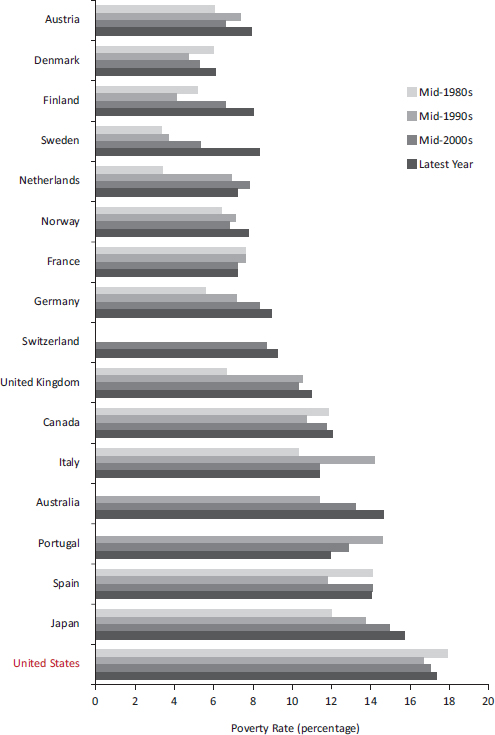
FIGURE 6-1 Poverty rates in 17 peer countries.
NOTES: Poverty rates are based on relative poverty, defined here as incomes below 50 percent of the median income of the country. Poverty rates for Switzerland were not available for certain years.
SOURCE: Data from OECD (2012l), StatExtracts: Income distribution—Poverty.
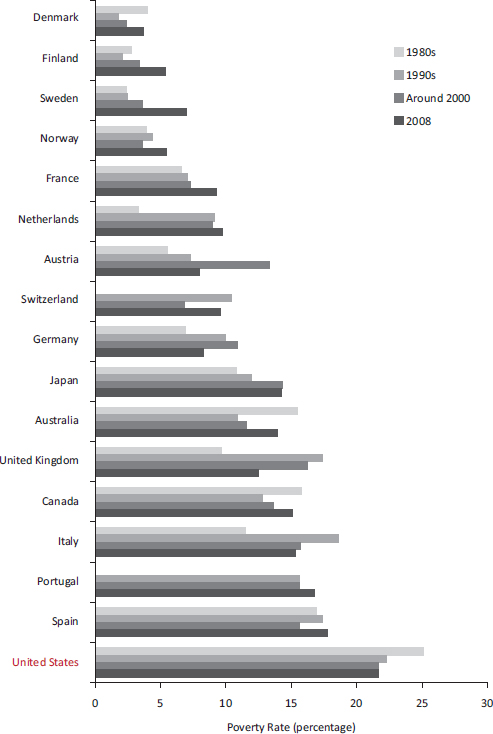
FIGURE 6-2 Child poverty in 17 peer countries.
NOTES: Poverty rates are based on relative poverty. Data for Portugal and Switzerland were not available for certain years.
SOURCES: Data from Whiteford and Adema (2007, Table 1), OECD (2012e), and Table CO2.2A.
Income inequality has been rising in the United States since 1968 (DeNavas-Walt et al., 2011; Taylor et al., 2011). Income inequality has also risen throughout most high-income countries, but not as dramatically.14 Since the 1980s, levels of income inequality in the United States have been higher than in all other high-income countries except Portugal and Spain.
Education
Educational Attainment
The U.S. ranking on educational attainment when examined in the aggregate appears similar to that of many other high-income countries. However, a closer examination reveals that the nation has been losing ground for decades. Although educational indicators for the United States have generally not worsened over time in their absolute levels, other rich countries have been gradually but substantially increasing their populations’ educational attainment and performance over time. This improvement is true not only among the 17 high-income peer countries examined in Part I, but also among other countries (e.g., Korea), whose rapidly improving educational performance is surpassing the United States. According to the World Economic Forum (2011), the education system of the United States ranks 26th on how well its education system meets the needs of a competitive economy. The United States does rank highly among older age groups, but the rankings are mediocre or below average among younger adults or cohorts who have been educated in more recent decades (OECD, 2011a).
Years of Schooling
As of 2003, U.S. adults aged 25-64 had completed an average of 13.3 years of formal education, ranking fourth among the 17 peer countries examined in Part I. The ranking for older adults (ages 45-64) was even higher: U.S. women in that age group had more years of schooling than older women in any peer country. In contrast, the United States ranked seventh in the years of schooling of young adult males (ages 25-34); the country also ranked below some countries that were outside the peer comparison group, such as Korea (OECD, 2012f).
_________________
14Income inequality has been rising in the United States over the past three to four decades but has also risen in Finland, Italy, the Netherlands, New Zealand, Norway, Portugal, Sweden, and the United Kingdom (Förster and d’Ercole, 2005).
Enrollment in Child Care and Preschool
According to OECD data from the 17 peer countries, enrollment rates of children under age 3 in formal child care are also lower in the United States than in eight peer countries (see Figure 6-3). Figure 6-4 shows that enrollment rates in educational preschool (ages 3-5) are also lower in the United States than in all but two peer countries (OECD, 2012j). Comparisons with other countries indicate that Korea, as well as Mexico and most Eastern European countries, have higher rates of participation in educational preschool than the United States (OECD, 2012j).
Completion of Secondary Education
Across all age groups in the United States, approximately 88 percent of adults have completed a secondary education (the U.S. equivalent of high school), which remains the highest ranking among the 17 peer countries. However, other countries (including countries outside the peer group, such as those in Eastern Europe and Korea) are gaining ground, and thus the U.S. ranking among young adults is less favorable. Among adults aged 25-34, the United States ranks fourth among peer countries in the completion of secondary schooling and is now outranked by the Czech Republic, Korea (OECD, 2011a), Poland, and Slovenia.
The United States also has a significant high school dropout problem, although it has declined since the 1970s (Snyder and Dillow, 2011). In 2006, 11 peer countries had higher percentages of 17-year-olds enrolled in secondary education than did the United States (National Center for Education Statistics, 2012b).15 As shown in Figure 6-5, among 13 peer countries that provided data for 2009, 10 countries16 exceeded the United States in the percentage of the population who had graduated from upper secondary education. As of 2009, the U.S. upper secondary graduation rate (76.4 percent) had declined below the OECD average and was lower than that of several former Soviet countries, including Hungary, Poland, Slovenia, the Slovak Republic, and the Czech Republic (OECD, 2011a). As the OECD (2011a, p. 44) explains:
Now, at least 80% of young adults in all OECD countries complete an upper secondary education. Within this general pattern, the United States has seen only a small improvement, having started out from the highest high-school completion rate, while Finland and Korea transformed themselves
_________________
15Other countries, including Chile, the Czech Republic, Hungary, Korea, Poland, and the Slovak Republic, also had higher secondary education enrollment rates than the United States.
16When the analysis was restricted to young persons of typical graduation age, nine countries had higher rates than the United States (National Center for Education Statistics, 2012b).
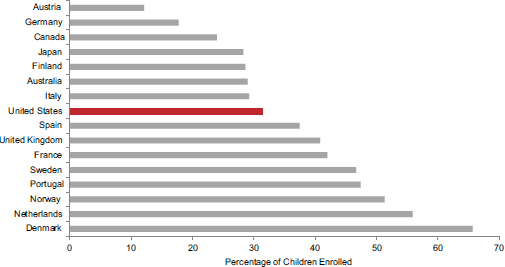
FIGURE 6-3 Enrollment of children aged 0-2 in formal child care in 16 peer countries, 2008.
SOURCE: Data from OECD (2012j), OECD Family Database, Table PF3.2.
from countries where only a minority of students graduated from secondary school to those where virtually all students do.
Completion of Tertiary Education
For decades, the United States has led the world in college education, and it still maintains that status: among peer countries, only Canada has a higher rate for completion of tertiary education. Other countries, however, have been rapidly gaining ground, which is reflected in a clear cohort effect across age groups. Among the 17 peer countries examined in Part I, the United States ranks second in tertiary education among people aged 55-64, third for those aged 45-54, fourth for those aged 35-44, and ninth for those aged 25-34.17Figure 6-6 shows that college completion among adults aged 25-34 is higher in eight peer countries than in the United States. It is also higher in a number of countries outside the peer group, such as Korea and Russia (OECD, 2011a). According to the OECD (2011a, p. 16):
Half a century ago, employers in the United States and Canada recruited their workforce from a pool of young adults, most of whom had high school diplomas and one in four of whom had degrees—far more than in
_________________
17In 2006, 16 of the 29 OECD countries reporting outperformed the United States on the percentage of the population of the typical graduation age who had received bachelor’s degrees (National Center for Education Statistics, 2012c).
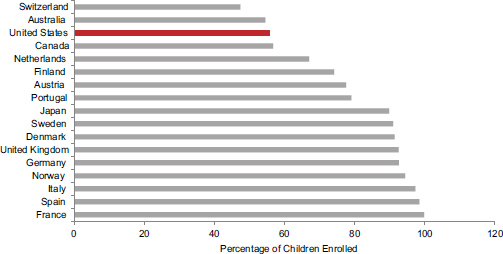
FIGURE 6-4 Enrollment of children aged 3-5 in preschool in 17 peer countries, 2008.
SOURCE: Data from OECD (2012j), OECD Family Database, Table PF3.2.
most European and Asian countries. Today, while North American graduation rates have increased, those of some other countries have done so much faster, to the extent that the United States now shows just over the average proportion of tertiary-level graduates at ages 25-34.
College graduation rates in the United States increased from 33 to 37 percent between 1995 and 2009. The OECD average at the start of the same time period (1995) was 20 percent, but by 2009 it had reached 39 percent, exceeding the U.S. graduation rate (National Center for Education Statistics, 2012b).18 As of 2006, 10 of the peer countries19 that reported data outperformed the United States on the percentage of the population of the typical graduation age who had received bachelor’s degrees (National Center for Education Statistics, 2012c).
_________________
18Americans who do complete college are more likely to have a degree that the OECD classifies as “less than 3 years” (e.g., associate degrees). The proportion of degrees in this category is 7 percent for the OECD but 35 percent in the United States. Only Turkey has a larger proportion of students who are so classified (OECD, 2011a).
19Other countries outside the peer group also outperformed the United States, including Hungary, Korea, Poland, and Russia.
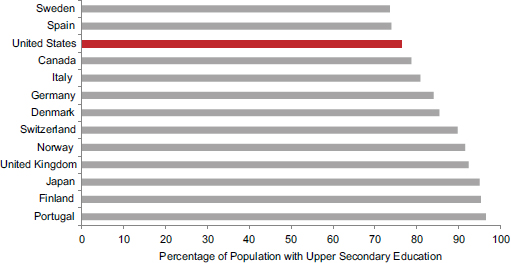
FIGURE 6-5 Upper secondary education rates in 13 peer countries, 2009.
NOTE: Upper secondary education corresponds to International Standard Classification of Education (ISCED) classifications 3 and 4, equivalent to high school in the United States, which prepares students for university-level education, vocationally oriented tertiary education, or workforce or postsecondary nontertiary education.
SOURCE: Data from OECD (2011a, Table A2.1).
Educational Achievement
Educational achievement on cognitive tests may be a more meaningful measure of education than the number of years of schooling. U.S. test scores are about average among high-income countries (Hanushek et al., 2008), but they are above average for U.S. grade school students. International comparisons of the reading literacy of fourth grade students are conducted periodically in the Progress in International Reading Literacy Study (PIRLS).20 As of the 2001 PIRLS, the United States ranked eighth, fifth, and thirteenth, respectively, of 27 countries, on combined reading literacy, average literary subscale, and average informational subscale scores. The countries participating in the 2001 PIRLS included 9 of the 17 peer countries examined in Part I and, among these, the United States ranked fifth for combined reading literacy of fourth graders. The 2006 PIRLS included 12 peer countries, among which U.S. fourth graders ranked seventh for combined reading score (Baer and McGrath, 2007; Ogle, 2003).
_________________
20The International Association for the Evaluation of Educational Achievement (IEA) is the international coordinating body for PIRLS studies; in the United States, PIRLS is overseen by the National Center for Education Statistics (NCES) in the U.S. Department of Education.
The mathematics and science aptitudes of students in fourth and eighth grade are tested in the Trends in International Mathematics and Science Study (TIMSS), which is administered in the United States by the U.S. Department of Education. The U.S. scores in 1995 and 2007 ranked highly among the peer countries examined in Part I,21 although the highest mathematics scores in 2007 were reported by China, Hong Kong, Japan, Kazakhstan, the Russian Federation, and Singapore (Gonzales, 2008).
Less encouraging results for the United States have emerged from the OECD Programme for Student International Assessment (PISA), which assesses the cognitive performance of high school students. Since 2000, the PISA has been administered every 3 years to 15-year-old students to assess cognitive skills in reading, mathematics, and science and general problem-solving skills. A National Academy of Sciences et al. (2007, p. 31) report, Rising Above the Gathering Storm, reacted with concern to the 2003 PISA scores:
Students in the United States are not keeping up with their counterparts in other countries. In 2003 [PISA] measured the performance of 15-year-olds in 49 industrialized countries. It found that U.S. students scored in the middle or in the bottom half of the group in three important ways: our students placed 16th in reading, 19th in science literacy, and 24th in mathematics. In 1996 (the most recent data available), U.S. 12th graders performed below the international average of 21 countries on a test of general knowledge in mathematics and science.
In our examination of the 2003 PISA data for the 17 peer countries that are the focus of Part I, we found that U.S. 15-year-olds ranked seventh lowest in reading (just above the OECD average) and science (just below the OECD average), and third lowest in mathematics. By the time of the 2006 PISA, the U.S. rankings had deteriorated further (see Table 6-1). Among the 17 peer countries, U.S. 15-year-olds ranked fifth lowest in science, third lowest in mathematics, and lowest in reading.22 The U.S. science score was exceeded by many nonpeer countries, led by China and followed by Estonia, New Zealand, Liechtenstein, Korea, Slovenia, the Czech Republic, Belgium, Ireland, Poland, Croatia, and Latvia (OECD, 2012n). The U.S. scores and ranking improved somewhat in the 2009 PISA, but they remained at or below the OECD average. By 2009, the U.S. science score was exceeded by 14 countries, led by China, Singapore, and Korea (OECD, 2012n).
Because those affected by the U.S. health disadvantage include people
_________________
21Several peer countries (e.g., Austria, Denmark, Finland, France, Germany, the Netherlands) were not included in one or both years.
22The 2009 PISA also showed that U.S. students were among those least likely in OECD countries to read for enjoyment (OECD, 2011a).
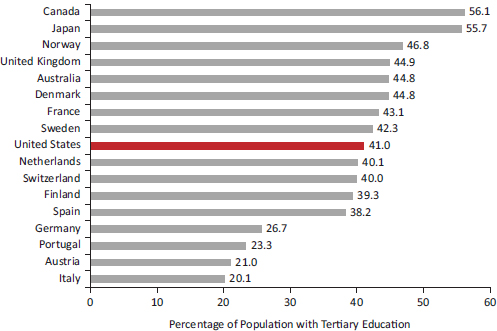
FIGURE 6-6 Percentage of adults aged 25-34 with a tertiary education in 17 peer countries, 2009.
NOTE: Tertiary education corresponds to International Standard Classification of Education (ISCED) classifications 5A and 5B, equivalent to a 2-year or 4-year college education in the United States.
SOURCE: Data from OECD (2011a, Table A1.3a).
who were educated many years ago, educational performance in the past decade, as reported above, may be less relevant to current health outcomes than the quality of education in prior decades. Hanushek and colleagues (2008) compiled data for 50 countries from 1964 to 2003 by standardizing the results of 12 PISA tests and other international mathematics and science assessments. In the 1960s and 1970s, U.S. students had lower scores than those in 13 countries (including 9 of the peer countries examined in Part I). The United States was outranked by 18 countries in the 1980s (including 10 peer countries), by 20 countries in the 1990s (including 9 peer countries), and by 23 countries in the 2000s (including 10 peer countries). By the 2000s, Finland and nonpeer countries such as Korea, Taiwan, and Japan were the top performers (Hanushek et al., 2008).
TABLE 6-1 Comparative Ranking of 15-Year-Old Students in High-Income Countries, 2006
| Rank | Reading | Science | Mathematics |
| 1 | Finland | Finland | Finland |
| 2 | Canada | Canada | Netherlands |
| 3 | Australia | Japan | Switzerland |
| 4 | Sweden | Australia | Canada |
| 5 | Netherlands | Netherlands | Japan |
| 6 | Switzerland | Germany | Australia |
| 7 | Japan | United Kingdom | Denmark |
| 8 | United Kingdom | Switzerland | Austria |
| 9 | Germany | Austria | Germany |
| 10 | Denmark | Sweden | Sweden |
| 11 | Austria | Denmark | France |
| 12 | France | France | United Kingdom |
| 13 | Norway | United States | Norway |
| 14 | Portugal | Spain | Spain |
| 15 | Italy | Norway | United States |
| 16 | Spain | Italy | Portugal |
| 17 | United States | Portugal | Italy |
NOTES: Actual scores for United States vs. OECD average were as follows: Reading (est. 460 vs. 495), Science (489 vs. 500), and Mathematics (474 vs. 498). According to the OECD’s website, the U.S. reading data that were originally displayed in bar charts were “subsequently removed from the PISA publications for technical reasons.” In the 2009 PISA, the U.S. reading score was 487, lower than all but three peer countries.
SOURCE: Data from OECD (2012n).
Employment
The recession-related decline in employment between 2007 and 2009 was more abrupt in the United States than in many countries (OECD, 2011e), but unemployment rates in the United States have traditionally not exceeded those of other high-income countries since the 1980s (Nickell et al., 2005; U.S. Census Bureau, 2012).23 The United States had notably high unemployment rates in the 1960s and the mid-1970s, rates that were
_________________
23The United States has one of the lowest levels of employment for college graduates (OECD, 2011a).
higher than those in Australia, Canada, France, Italy, Japan, Sweden, the United Kingdom, and West Germany (U.S. Census Bureau, 1970, 1980).24
Social Mobility
Multiple studies have demonstrated that the United States has less social mobility than other countries (Blanden et al., 2005; Corak, 2004; Isaacs et al., 2008; Solon, 2002). A report by the Brookings Institution (Isaacs et al., 2008, p. 40) noted:
Men born into the poorest fifth of families in the United States in 1958 had a higher likelihood of ending up in the bottom fifth of the earnings distribution than did males similarly positioned in five Northern European countries—42 percent in the United States, compared to 25 to 30 percent in the other countries.
In contrast, in the United States now, “only 8 percent make the ‘rags to riches’ climb from bottom to top rung in one generation, while 11 to 14 percent do so in other countries” (Isaacs et al., 2008, p. 40). A 2011 follow-up study reported that one-third of Americans who grew up in the middle class fall below that category as adults (Acs, 2011).
A 2010 OECD report found that nine other OECD countries outranked the United States on the link between individuals’ and their parents’ earnings, an accepted measure of economic mobility (OECD, 2010a). A 2005 report from Warwick University concluded that the United States has a particularly “high likelihood [compared with Nordic countries, and a higher likelihood than the United Kingdom] that sons of the poorest fathers will remain in the lowest earnings quintile … [and a] … very low likelihood that sons of the highest earners will show [long-term] downward … mobility” (Jäntti et al., 2005, p. 27). Another study concluded that “Intergenerational [economic] mobility in the United States is lower than in France, Germany, Sweden, Canada, Finland, Norway, and Denmark; only the United Kingdom had a lower rate of mobility than the United States” (Hertz, 2006, p. i).25
Homelessness
Data are limited to compare housing instability in the United States and other high-income nations. A telephone survey in Belgium, Germany, Italy,
_________________
24Data are lacking to compare the occupational health and safety of workers in the United States and other high-income countries.
25Blacks in the United States have less economic mobility than whites (Blanden et al., 2005; Hertz, 2006).
the United Kingdom, and the United States found that the United Kingdom (7.7 percent) and the United States (6.2 percent) had higher lifetime rates of literal homelessness than did the other countries (Toro et al., 2007).
Incarceration
The United States has the highest incarceration rate among affluent countries—approximately 750 of every 100,000 U.S. citizens are in prison—and the rate has been increasing over time (Glaze, 2011; Pew Center on the States, 2008). Between 1987 and 2007, year-end prison counts in the United States nearly tripled from 585,084 to 1,596,127 (Pew Center on the States, 2008). And within the United States, the rate of ever having gone to prison among males was more than six times higher among blacks than whites (Bonczar, 2003). The U.S. Department of Justice estimates that if incarceration rates remain unchanged, 6.6 percent of U.S. residents (and 32.2 percent of black males) born in 2001 will go to prison at some point in their lifetime (Bonczar, 2003).
Household Composition
Between 1940 and 2000, the percentage of U.S. children born to unmarried women increased from approximately 4 percent to almost 35 percent (U.S. Census Bureau, 2003). By 2008, 30 percent of U.S. households with children were headed by a single parent. The corresponding percentages in comparable countries—including Canada, Japan, Denmark, France, Germany, Ireland, Netherlands, Sweden, and the United Kingdom—also increased during these decades, but none had the high percentage of the United States. In 2007, 39.7 percent of live births in the United States were to unmarried women, although some other countries (including Denmark, France, and Sweden) reported even higher rates (U.S. Census Bureau, 2011). A study that compared the United States with 16 other countries (including 9 of the peer countries examined in Part I) found that children born in the United States can expect to live more years with parents apart, with a single mother, without a mother, or in a maternal stepfamily than children in other countries (Heuveline et al., 2003). Single-parent households have a greater need for some social services, such as day care, which are less available in the United States.
Summary
The United States differs from other high-income countries in several social domains that relate to health outcomes26:
• The United States has the second highest median household income in the OECD but the fourth highest (among all OECD countries and the highest among peer countries) level of income inequality, the latter having increased in the United States since 1968.
• Since the 1980s, the United States has had among the highest rates of overall poverty and child poverty of all rich nations and many less affluent countries.
• The United States ranks high in average years of schooling and educational attainment, but other countries (including many emerging economies) have been improving educational performance more rapidly, and U.S. adults aged 25-34 now have mediocre rates for completing secondary and tertiary education.
• U.S. preschool enrollment is lower than in most high-income countries.
• Although U.S. grade school students score well relative to children in other countries, by age 15 U.S. students have average or below-average scores on mathematics, science, and reading.
• The United States has low levels of social mobility relative to other high-income countries.
• The United States has the highest rate of incarceration among high-income countries.
• The United States has the highest rate of households with children headed by a single parent.
QUESTION 3:
DO DIFFERENCES IN SOCIAL FACTORS EXPLAIN THE
U.S. HEALTH DISADVANTAGE?
It is highly plausible—although not proven—that the social conditions discussed above have contributed to the U.S. health disadvantage relative
_________________
26Racial and ethnic disparities are an important domain that affects health outcomes (Agency for Healthcare Research and Quality, 2011). However, for reasons noted above, notably the lack of comparable evidence, this summary does not include differences among the United States and other countries in the magnitude of racial or ethnic disparities. It focuses on socioeconomic differences, for which data are more readily available, but the panel is acutely aware of the important additional role of race and ethnicity in the health profile of all high-income countries. We also note that the implications of the listed conditions can differ substantially across countries because of differences in social programs and the strength of safety nets.
to other high-income countries. In particular, overall poverty and child poverty are especially plausible explanations for the pervasive U.S. health disadvantage across multiple causes of illness, unhealthy behaviors, and mortality during the first three or possibly four decades of life. Both have been markedly higher in the United States than in almost all other high-income countries during the years when people now in their 20s, 30s, or early 40s were born, growing up, or entering young adulthood. Conditions for children and young people during that period could have shaped risks for low birth weight and infant mortality among the babies born to that cohort, as well as risks for virtually all of the health conditions on which the United States has a disadvantage during the first three or four decades of life. Adult poverty during the past three to four decades may even explain some of the health disadvantage observed among older U.S. adults, but these effects might be less dramatic than those for younger age groups.
Chapters 1 and 2 documented that the U.S. health disadvantage is not confined to minorities or those with low incomes or low educational levels but exists at all socioeconomic levels and for non-Hispanic whites. The high rates of poverty and child poverty in the United States would not explain the persistence of the problem in these advantaged groups, although it is possible that social inequality itself contributes to or reflects conditions that affect the entire population.
Similarly, it is plausible that racial inequality in the United States compounds the societywide effects of economic inequality with which it is intertwined, but empirical cross-national data on this dimension of social inequality are unavailable. The large incarcerated population in the United States suggests a profound degree of multidimensional social disadvantage that affects many people—not only prisoners themselves but also their families and communities (Wildeman and Western, 2010). Racially disproportionate incarceration rates in the United States are probably reflections of multiple societal problems and are a likely contributor to the health risks associated with poverty and to social immobility.
Although the United States has a proportionally larger foreign-born population than the OECD average (OECD, 2011e), the large immigrant population does not explain the U.S. health disadvantage because of the “immigrant paradox,” the tendency of first-generation immigrants to have better health than the native-born population. This phenomenon is chiefly manifested in the United States as the so-called Hispanic paradox, in which Hispanic Americans tend to have better health outcomes than people born in the United States, especially within 10 years of immigration (Markides
and Eschbach, 2005). The phenomenon has also been documented among black immigrants from Africa and the Caribbean (Collins et al., 2002).27
Differences in child care and preschool education in the United States could have broad effects that reach beyond disadvantaged groups. Strong evidence demonstrates that high-quality child care and early childhood development programs (from infancy through age 5) lead to higher educational attainment, income, and employment rates in adulthood, and lower rates of criminal behavior. Although the benefits of preschool education are greater for poor children than others, they have been demonstrated among children of diverse socioeconomic backgrounds; and the benefits are themselves strong predictors of subsequent health (Karoly et al., 2005; National Research Council and Institute of Medicine, 2000; Rolnick and Grunewald, 2003).
The mixed but overall mediocre—and in some cases very low—comparative standing of the United States on educational attainment and measures of educational achievement in secondary and tertiary education may contribute to the U.S. health disadvantage. The educational attainment and cognitive skills of today’s young adults could, for example, influence the behaviors that can contribute to infant and child mortality due to accidents and homicides; adolescent births and sexually transmitted infections; HIV/AIDS incidence and mortality; and drug-related mortality. That the United States once led the world on educational attainment and has a highly educated cohort of older adults, however, makes education a less likely contributor to the health disadvantages currently observed among older Americans. They were educated many decades ago, when their counterparts in other high-income countries did not, as a group, hold an educational advantage.
Inequalities in life expectancy and all-cause death rates among Americans with different levels of education and income have been increasing for decades (Dow and Rehkopf, 2010; Jemal et al., 2008b; Meara et al., 2008; Pappas et al., 1993), and this gradient may be steeper in the United States than in other high-income countries. In an examination of mortality rates by educational attainment among adults aged 30-74, mortality rates among white men were higher in the United States than in England and Wales, France, Norway, Sweden, and Switzerland, but the excess mortality was more pronounced in lower than in higher educational groups (Avendano et al., 2010). For example, although mortality among U.S. men was 30 percent higher than among Swedish men, it was 24 percent higher among men with a tertiary or higher education, but 55 percent higher among men
_________________
27The panel did not examine evidence regarding whether or not some of the specific health disadvantages observed in the United States (e.g., certain communicable diseases and injuries) are more common among immigrants.
with a lower secondary education or less. The authors concluded that part of the excess mortality among U.S. men is due to larger inequalities in mortality by educational levels in the United States than those in some European countries.
A variety of hypotheses could explain this pattern, among them that prosperity in the United States may be more deeply tied to higher education (Cutler et al., 2011). The consequences of inadequate educational attainment may differ by country, depending on the educational credentials required for desirable jobs, economic security, and other material and psychosocial benefits gained through employment. In comparison with the United States, only Poland, Portugal, Spain, and Turkey have similarly low rates (approximately 20 percent or less) of skilled employment among employed persons who lack tertiary schooling, indicating the larger socioeconomic consequences in the United States of not having a tertiary education (OECD, 2009b).
The health benefits associated with education might be stronger in the United States than in other countries. A recent study reported that life expectancy among people with less than 12 years of education decreased in the United States between 1990 and 2008, at the same time that it increased among people with 12 or more years of education (Olshansky et al., 2012). Underscoring the importance of education, the study also found that blacks and Hispanic Americans with 16 or more years of education lived 7.5 years and 13.6 years longer, respectively, than whites with less than 12 years of education, although racial and ethnic disparities persisted at all levels of education. The study noted that “[t]he same highly educated black men and women who live longer than less educated whites still live about 4.2 years less than comparably educated whites” (p. 1,806).
More so than in other countries, there appears to be a stronger link in the United States between parental education and children’s economic, educational, and socioemotional outcomes (Ermisch et al., 2012). Mediocre performance on education could be a result of disadvantaged home environments, such as a lack of parental stimulation of children’s cognitive development, or other disadvantages that could accompany child poverty (Ermisch et al., 2012). Compared with disadvantaged students in many high-income countries, those in the United States appear to have less “resilience” and to show greater deficiencies in reading (OECD, 2011a). Their disadvantage also could be exacerbated by deficiencies in health during childhood and young adulthood (Fletcher and Richards, 2012).
Another factor that could compound the effects of low income and education is the comparatively weak social safety net (i.e., fewer publicly funded transfers and services) in the United States (Avendano and Kawachi, 2011). A weaker safety net may exacerbate the detrimental health effects of poverty, unemployment, and economic insecurity (Bartley et al., 1997; Dow
and Rehkopf, 2010). The health effects of unemployment may be buffered, for example, by programs that provide job training and counseling, medical care, and income and housing supports for the unemployed (Bartley and Owen, 1996). In one recent study, prospective data from the United States and Germany covering 1984 to 2005 showed that unemployment was associated with higher mortality in the United States but not in Germany. This relationship was only evident among low- and medium-skilled workers, prompting this analysis by the authors (McLeod et al., 2012, pp. 1,544-1,555):
In the American cohort there was no relationship between unemployment and mortality for the high-skilled. It appears that individuals with a high level of education may be best suited to take advantage of the more flexible labor markets within the United States. The high-skilled were also more likely to receive benefits, when unemployed, than were those of lower skill levels. These individuals may also have other resources (e.g., savings, familial resources, and social or business contacts from educational or professional organizations) to draw upon that would buffer the effect of unemployment on health…. In Germany, the unemployed medium-skilled had the lowest relative risk of dying. This is the strongest evidence that institutional environment can affect the relationship between unemployment and health as institutional protection is targeted toward medium (and vocationally) skilled workers in Germany.
The health consequences of low income may be mitigated by other resources that help individuals and families meet their basic needs (Anand and Ravallion, 1993), such as free or subsidized food, medical care, child care, elder care, education, housing, public transportation, recreational services (e.g., parks, supervised activities for children), and other social protections. A study of 18 countries documented that social security transfers and public health spending significantly reduce poverty levels (Brady, 2005).
As with other social factors, child poverty could potentially have more severe adverse health consequences in the United States than in other affluent nations. Greater public investments in child and family supports—including child care, early childhood development, and preschool programs (see Chapter 8)—appear to help alleviate the effects of child poverty in other countries. For example, in a study that compared Sweden and the United States in the 1980s, the authors found that child poverty rates did not differ substantially when measured by household income before social transfers and taxes (Jäntti and Danziger, 1994, p. 50):
After counting income from both the market and the welfare state, 12.8% of children in the United States and 2.1% of children in Sweden were disposable income-poor. The difference in disposable income poverty rates
between children living in two-parent and single-mother families was 32.5 percentage points in the United States, but virtually nil in Sweden. Over the mid-1980s, child poverty increased by almost one-third in the United States (from 9.6% to 12.8%), while it fell slightly in Sweden (from 2.6% to 2.1%).
The relatively weak social safety net in the United States is a potential explanation not only of a health disadvantage among low-income children and a contributor to low social mobility, but also of the health disadvantages observed among children in all income groups. Stronger safety nets could, at least in theory, lessen the stress and anxiety associated with a potential loss of income or the high costs of medical care, child care, and education (Bartley et al, 1997).28
Safety net programs, the quality of schools, and economic conditions in the United States are shaped in part by public policies, such as the relatively low public spending on services for families and young children compared with other high-income countries. The role of public policies in shaping social conditions is discussed further in Chapter 8.
Part I of this report documents that life expectancy and other health outcomes (e.g., infant mortality) in the United States began to lose pace with other high-income countries in the late 1970s, a trend that has continued to the present. During this same time, as this chapter notes, there has also been a potentially important co-occurrence of worsening social conditions in the United States, notably a rise in income inequality, poverty, child poverty, single-parent households, divorce, and incarceration—all more pronounced than in other rich nations—and the loss of the U.S. leadership position in education. Like the U.S. health disadvantage, many of these social problems began to differentiate the United States from other rich nations in the late 1970s and 1980s.
Whether these co-occurring social trends, individually or in combination, were causally related to the increasing U.S. health disadvantage is still unclear. Answering this question requires a careful examination of historical data to make relevant cross-national comparisons on a range of social conditions over several decades. The cross-country rankings on social indicators discussed in this chapter reflect relatively recent data (since the
_________________
28The role of safety net programs and their interplay with other societal factors is undoubtedly complex, however. As discussed further in Chapter 8, European studies have shown that although stronger safety nets are consistently associated with better aggregate health in countries, they do not necessarily correlate with the size of health inequalities within European countries (Kunst et al., 1998; Mackenbach et al., 1997, 2008).
1980s), but as noted throughout this report, current health outcomes may have been influenced significantly by social conditions experienced much earlier, particularly for children in the post–World War II era. To understand the current U.S. health disadvantage, it would be important to examine cross-nationally the trajectories of social factors, including programs, services, and spending, that were in place four to six decades before the relevant health outcomes appeared.
Whether the worsening social conditions in the United States and its growing health disadvantage are causally interrelated, their co-occurrence during the same time span in recent U.S. history certainly warrants further scrutiny. As documented in this and the next chapter, there have been dramatic changes in the social fabric of the United States; see in particular the discussion of social capital in Chapter 7. These unsettling trends present a potentially important explanation for the U.S. health disadvantage and are shaped by a range of more deeply rooted societal and structural factors. An examination of these underlying causes can shed light on why the United States appears to be losing ground in so many domains: not only health, but also education, economic equality, and child well-being.
Chapter 7 explores the role of the physical and social environment as an explanatory factor. Chapter 8 explores the important role of life-styles, cultural attributes, public policies, spending priorities, and values as contributors to the patterns observed in this report. These societal factors cannot be ignored when trying to understand either the U.S. health disadvantage or the unfavorable social and economic circumstances reported in this chapter.


