
Appendix C
Commissioned Paper: Workforce Trends in Computer Science
John Bound and Nicolas Morales
August 2016
There has been a long-standing interest in understanding the nature of the educational pipeline for STEM careers. Classic research by economists (e.g., Arrow and Capron, 1959; Freeman, 1976; Ryoo and Rosen, 2004) has focused on how wages, employment, and educational decisions adjust to changes in demand for scientists and engineers. This work emphasized the notion that the supply of scientists and engineers is likely to be inelastic in the short run, as growth in supply requires expansion in postsecondary degree attainment in scientific fields, while supply is quite elastic over a longer time horizon. Of particular concern is that limits in the supply of science and engineering (S&E) workers during “boom” periods would limit productivity growth, while poor employment prospects for high-skill workers would follow in downturns.
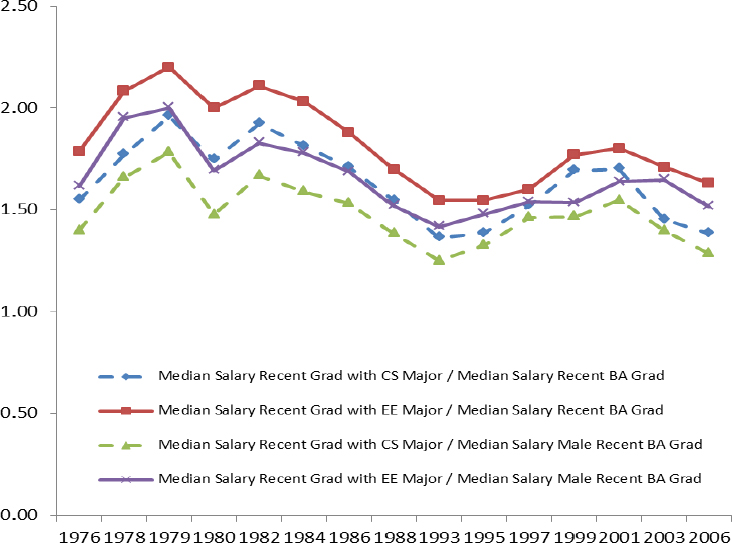
Yet, entry to S&E fields from new college graduates is not the only pathway to adjustment. While early models of the scientific workforce focused exclusively on the enrollment response margin among U.S. students, such approaches do not account for either the flow of workers from other fields or the flow of foreign-trained S&E workers from abroad. Bound et al. (2013), focusing on the market for computer scientists and electrical engineers, argue that the availability of foreign skilled workers over the past few decades increased the responsiveness of the S&E labor market to shifts in the demand for these occupations. As shown in Figure C.1, they find that the wage response to the boom and bust for IT workers in the period surrounding the turn of the century was more muted than the boom and bust that occurred in the late 1970s and early 1980s. They argue that this was, in part, due to the increased availability of foreign skilled workers.
In a similar vein Bound et al. (2015) model how the labor market adjusted to the increase in the demand for computer scientists during the 1990s boom
not just by increases in enrollment in computer science majors and the flow of workers from other occupations but also by high-skilled foreign-born workers. In this report we update some of these earlier tabulations to show how the market for computer scientists is adjusting to recent increases in the demand for such individuals.
EMPLOYMENT
The share of college graduates working in computer science has been steadily increasing for the past 20 years, with the occupation share in computer science rising from 2.5 percent in 1994 to 5.5 percent in 2015, as shown in Figure C.2. The sharpest growth in employment occurred during the latter half of the 1990s after the introduction of the Internet for commercial purposes, which boosted productivity and increased demand for workers in computer science.1
___________________
1 Throughout this paper we will refer to those working in computer science as those who show occupational codes of “Computer Systems Analysts and Computer Scientists” and “Computer Software Developers.”
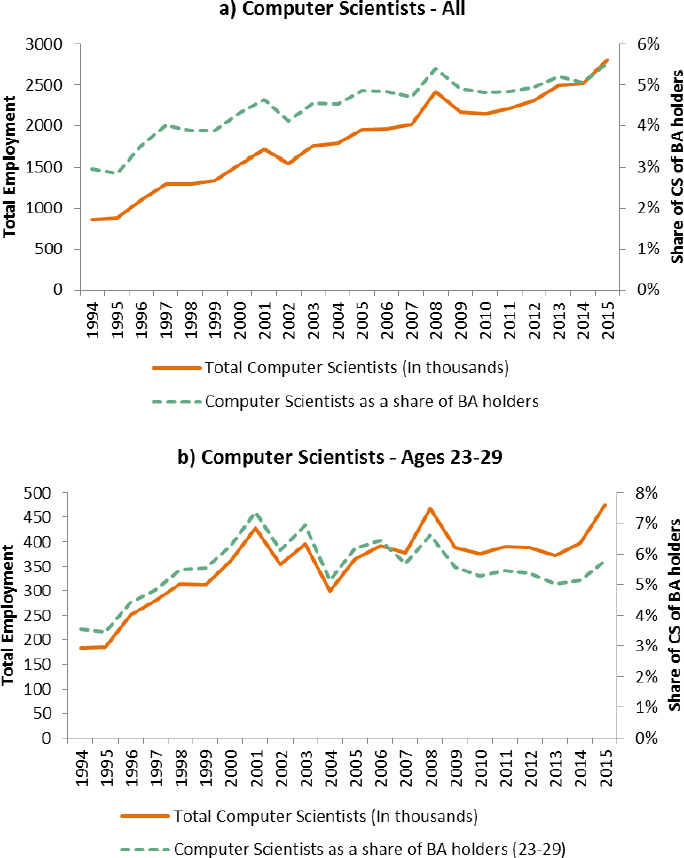
Net employment in computer science increased by 650,000 positions during that period, and the share of college graduates working in computer science increased from 2.9 percent in 1995 to 4.3 percent in 2000. This IT boom was followed by the dot-com bust, which created significant job losses among computer scientists but did not stop the long-term growth of computer science among other college occupations. If we focus on younger workers age 23 to 29, there is employment
growth over the 1990s, followed by a period of stagnation, with a spike just before the Great Recession, and then a rapid rise since 2013. The 23- to 29-year-old computer scientists seem to respond more to business cycle variations than the total number of computer scientists, as their labor supply fluctuates more throughout the period.
EARNINGS AND WAGES
Earnings followed a similar trend to employment during the late 1990s, as shown in Figure C.3. Median earnings for computer scientists increased by 12 to 15 percent between 1995 and 2000 when compared to wages of engineers (panel a)
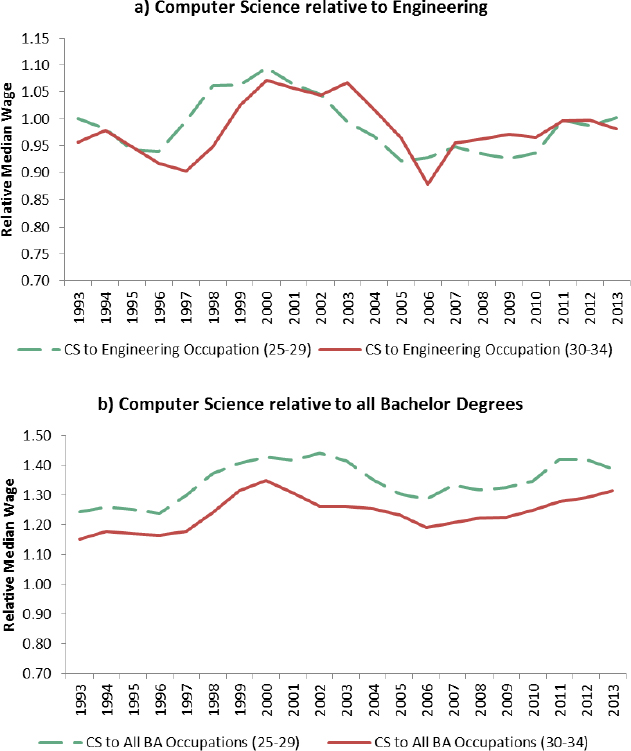
and almost 20 percent with respect to wages for all college graduates (panel b).2 While employment as a share of college graduates kept increasing after the year 2000, relative earnings decreased up until 2006 before increasing again in the last decade, although at a much lower rate than observed during the IT boom in the 1990s. As noted by Bound et al. (2013), the decrease in earnings caused by the dot-com bust was less pronounced than the one observed after the hardware boom in the 1980s. The subsequent recovery also happened faster in the 2000s when compared to the bust in the 1980s, as relative earnings started increasing only 5 years after the bust. Overall, young workers (age 25-29) seem to have higher entry-level wages as computer scientists and engineers than in other occupations, as the series for young workers in Figure C.3, panel b, is consistently above the series for older workers (age 30-34).
SUPPLY-SIDE ADJUSTMENT
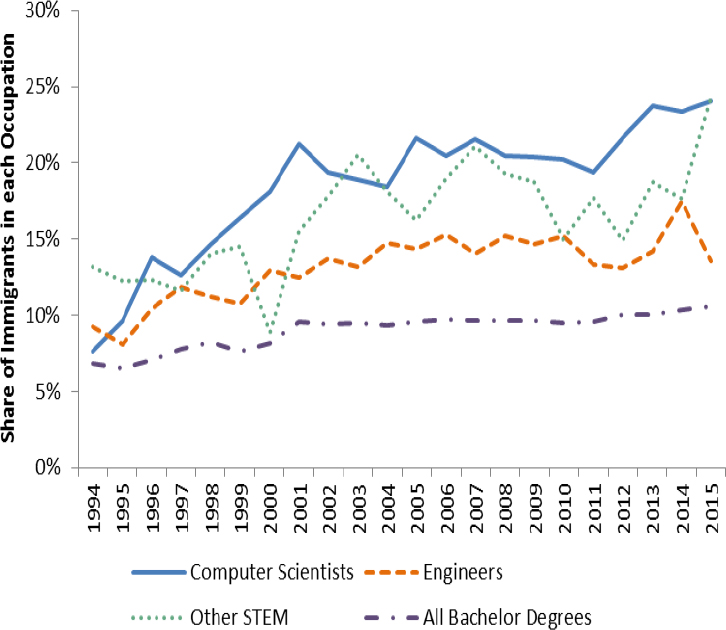
The increase of the computer science workforce as a share of total college graduates for the past 20 years can be attributed to three main sources: new graduates with degrees in computer science joining the labor market, workers from other fields who are drawn into computer science, and foreign workers who migrate to the United States to work as computer scientists. As shown in Figure C.4, the foreign source is particularly significant in computer science relative to other fields. Here and elsewhere we count as immigrants only those who report immigrating after they turned 22, treating those who immigrated as children (typically with their families) or as college students as U.S. residents. Historically, the share of foreign workers who work as computer scientists has been well above other fields such as engineering and other science, technology, engineering, and mathematics (STEM) occupations such as physics, mathematics, and biology.3 While engineering had, on average, 15.6 percent of its workforce as foreign workers, computer science went from 10.6 percent in 1994 to 26.8 percent in 2015. Foreign workers who have college degrees, including those with advanced degrees, generally get to the United States through the H-1B visa program, which is targeted to high-skilled immigrants and has a yearly cap that limits the number of immigrants who can get into the country every year. H-1B visas expire after a period of 3 years (with the possibility of renewal for 3 more years), although a significant fraction of those on H-1Bs are able to become permanent residents. The immigrant share rose during IT booms and stagnated during the dot-com bust in the early part of the next decade. Indeed, while the H-1B visa cap has been reached for most years since the mid-1990s, this was not true in the years immediately following the dot-com bust.
___________________
2 In the CPS, respondents are asked about earnings for the previous calendar year. We date the earnings by the year in which they were earned. Thus, the 2013 earnings number reflects responses in the 2014 survey.
3 We define STEM fields as engineering, computer science, physical and life sciences, mathematics, and statistics. When we refer to “other STEM,” we exclude engineering and computer science.
Degrees awarded in computer science respond to changes in wages but with a lag, which is understandable, considering students need time to adjust and change their college major choices. As shown in Figure C.5, panel b, bachelor’s degrees in computer science as a share of total degrees had their biggest peaks during the early 1980s, after the hardware boom, and during the late 1990s, after the IT boom, and there is evidence of an increase since 2009 consistent with the relative wage recovery observed in Figure C.3.
Some simple calculations using earnings and degrees suggest that college degrees seem to be responding less to changes in earnings for young workers when compared to what they did during the IT boom of the 1990s. Between 1995 and 2000 median wages of computer scientists relative to all college graduates increased by 14.1 percent, while relative degree attainment in computer science in the same period increased by 44 percent. If instead we look at the period from 2008 to 2013, relative wages increased by 7.6 percent but relative degrees seem to have responded less than in the past, growing by just 12.5 percent during the period. It is hard to know how much to make of these differences. Such a lower
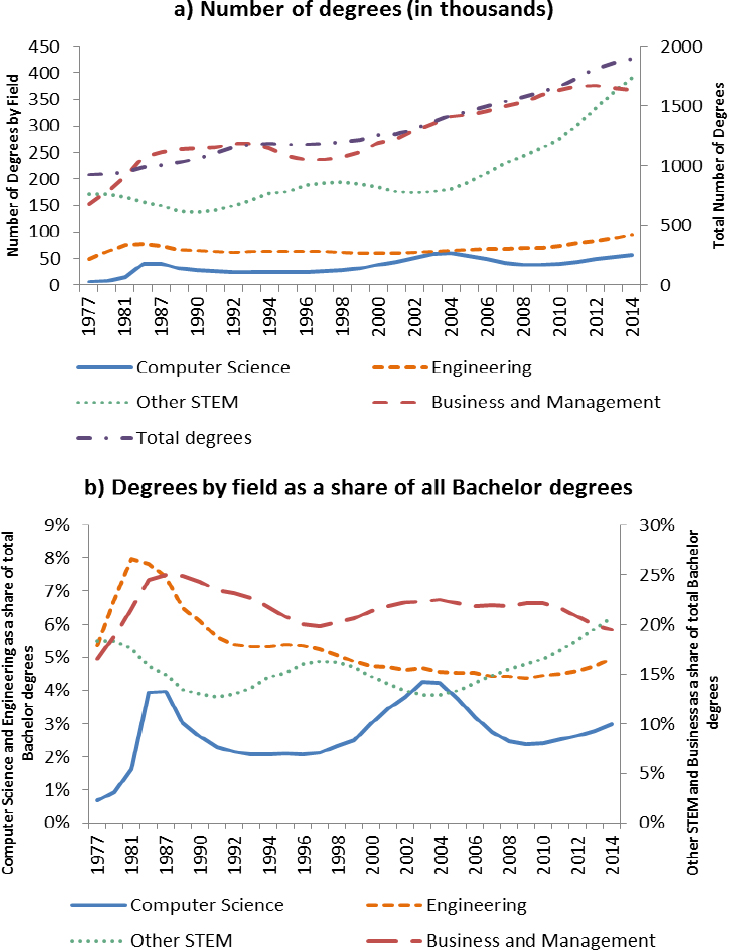
response might be explained by different expectations of current students on how persistent the increase in earnings will be. If such a trend continues, we might see a larger response of degree attainment in computer science in subsequent years.
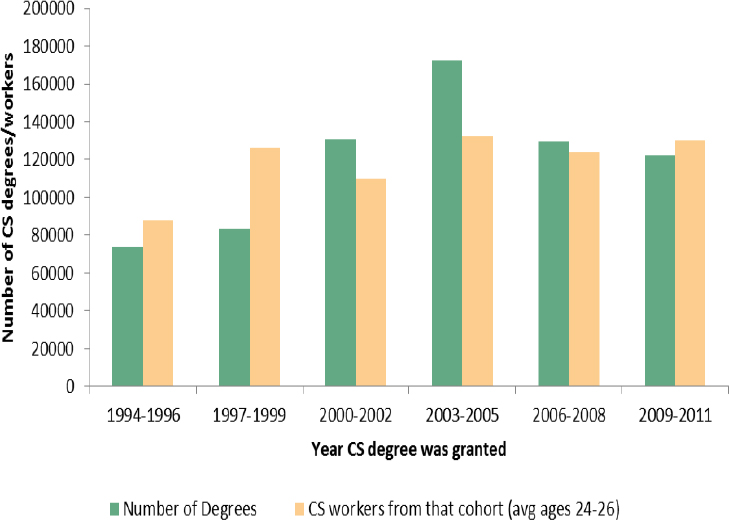
In Figure C.6 we compare the number of degrees that are produced in a given year with the employment in computer science for the cohort that graduated in that same year. During boom periods (e.g., 1994-1999 and 2009-2011), a larger number of college graduates end up working as computer scientists than those who obtained undergraduate degrees in computer science.4 This trend was re-
___________________
4 We emphasize that here we compare degrees awarded to the number of individuals working in the field. Even when these numbers line up, this does not imply that all of those with computer science degrees work as computer scientists or that all those working as computer scientists have undergraduate degrees in the field.
versed during the decade after the dot-com boom, with the number of individuals who obtained degrees exceeding the number who ended up working as computer scientists. This pattern reinforces the idea that enrollment and graduation decisions respond to a lag in changes in earnings, such that workers who are not computer scientists move into the field when demand is high and workers with computer science degrees move out of the field when demand is low. It is also a signal of recovery that between 2009 and 2011, we see higher employment levels in computer science than those graduating in the field, which is consistent with the recent increase in demand for computer scientists.
Figure C.6 also highlights the importance of distinguishing between two groups: those who work as computer scientists and those who get college degrees in computer science but do not necessarily work as computer scientists once they join the labor market. As shown in Table C.1, those who work as computer scientists majored in a variety of fields other than computer science and information degrees. Some of these are closely related fields such as engineering or mathematics, but a nontrivial fraction come from other backgrounds such as business management, economics, and finance.
When looking at those who get their degrees in computer science, these degree recipients are more concentrated in computer science occupations, although more than 40 percent of them go to work in diverse fields other than computer science.5Tables C.1 and C.2 use data from the period between 2009 and 2014, which was a period of high demand where people were being pulled into computer science from other occupations. It makes sense then that a majority of degree holders in computer science work as computer scientists, while the computer science occupation reflects inflow from a number of fields.
There is significant heterogeneity in earnings that depends on undergraduate degree field of study. Table C.3 shows estimates of a simple linear regression where we regressed the natural logarithm of annual earnings for those who work as computer scientists on indicators for the bachelor’s degree field these workers obtained. The coefficients in Table C.3 can be interpreted as the average extra percent earnings that a worker in computer science with a given degree gets when compared to a computer scientist with a non-STEM degree. Among those who work as computer scientists, those who have a computer science degree earn 17 percent more than non-STEM degree holders. Those drawn into computer science who have engineering or other STEM degrees earn on average 19 and 12 percent higher respectively than those who have non-STEM degrees and work as computer scientists. Foreigners who immigrated after turning 22 and who, presumably, obtained their college degree outside the United States also earn a premium, though most of this premium can be explained by the fields in which
___________________
5 We define those who earn a bachelor’s degree (B.A.+B.S.) in computer science as those who state the following degree fields in the ACS: “Computer and Information Systems,” “Computer Programming and Data Processing,” “Computer Science,” “Information Sciences,” “Computer Information Management,” and “Computer Networking and Telecommunications.”
TABLE C.1 Main Bachelor’s Degree for Those Working as Computer Scientists (2009-2014)
| Main Bachelor’s Degree | Age 23-29 | Age 30-39 | Foreign 23-39 |
|---|---|---|---|
| Computer science | 23.9% | 22.2% | 25.0% |
| Computer engineering | 6.9% | 5.0% | 11.7% |
| Computer and information | 6.7% | 7.5% | 5.9% |
| Electrical engineering | 4.4% | 4.5% | 15.2% |
| Business management and administration | 4.3% | 5.6% | 1.3% |
| Management information | 3.1% | 4.4% | 0.5% |
| Economics | 2.6% | 1.8% | 0.9% |
| Information sciences | 2.4% | 2.3% | 0.7% |
| Finance | 2.4% | 1.7% | 0.5% |
| General business | 2.4% | 2.9% | 2.1% |
| Mathematics | 2.3% | 2.3% | 3.0% |
| Other | 38.5% | 39.7% | 33.3% |
| Number of observations | 15,008 | 26,674 | 13,167 |
SOURCE: American Community Survey (ACS).
TABLE C.2 Occupation for Those Who Obtained a Computer Science Bachelor’s Degree (2009-2014)
| Age 23-29 | Age 30-39 | |
|---|---|---|
| Computer software developers | 37.7% | 30.7% |
| Computer systems analysts | 22.5% | 21.1% |
| Managers and administrators | 5.3% | 11.8% |
| Subject instructors (high school/college) | 1.6% | 1.0% |
| Management analysts | 1.6% | 2.0% |
| Repairers of data processing equipment | 1.4% | 0.9% |
| Supervisors and proprietors of sales jobs | 1.2% | 1.5% |
| Other | 28.7% | 31.1% |
| Number of observations | 10,781 | 23,835 |
SOURCE: American Community Survey (ACS).
TABLE C.3 Degree Wage Premium for Those Working as Computer Scientists (2009-2014)
| Log (Annual Wage) | Log (Annual Wage) | Log (Annual Wage) | Log (Annual Wage) | |
|---|---|---|---|---|
| Computer and information systems degree | 0.001 [0.007] |
0.0574c [0.0157] |
–0.00156 [0.011] |
–0.0139 [0.0101] |
| Computer programming and data processing degree | –0.015 [0.021] |
0.0414 [0.0522] |
–0.0491 [0.0413] |
0.000708 [0.028] |
| Computer science degree | 0.167c [0.004] |
0.241c [0.01] |
0.162c [0.00732] |
0.149c [0.00583] |
| Information sciences degree | 0.059 c [0.011] |
0.0611a [0.0251] |
0.0393a [0.0186] |
0.0804c [0.0166] |
| Computer information management degree | –0.069c [0.016] |
0.0266 [0.0311] |
-0.0717b [0.0273] |
-0.0935c [0.0268] |
| Computer networking and telecommunications degree | –0.049a [0.021] |
0.0472 [0.0424] |
-0.0371 [0.0324] |
-0.0889a [0.0355] |
| Engineering degree | 0.193c [0.005] |
0.253c [0.0113 |
0.195c [0.0084 |
0.174c [0.00612 |
| Other STEM degree | 0.124c [0.005] |
0.112c [0.0163] |
0.102c [0.011] |
0.128c [0.00672 |
| Foreign CS worker | 0.144c [0.00397] |
0.221c [0.0114] |
0.168c [0.00657] |
0.104c [0.00553] |
| N | 108,226 | 15,582 | 34,439 | 57,888 |
| Adjusted R-squared | 0.182 | 0.105 | 0.091 | 0.089 |
| Sample | All CS workers | Age 23-29 | Age 30-39 | Age 40+ |
NOTE: Standard errors in brackets; a p < 0.05, b p < 0.01, c p < 0.001. The dependent variable is log annual wage, and we include covariates such as gender, indicators for Hispanic and black non-Hispanic, age group indicators (22-29, 30-39, 40+), indicators for highest degree attained (master’s, professional degree, and Ph.D.), and year-fixed effects for 2010-2014. We also include a foreign worker indicator and set degree indicators to zero when the individual is foreign. Sample includes all workers in computer science between 2009 and 2014 who attained a bachelor’s degree or higher, who are not self-employed, and who have been working full time for at least one year. The omitted degree category is non-STEM degrees. SOURCE: American Community Survey.
these individuals obtained their undergraduate degrees. The natural interpretation of the premium such individuals earn is that they are more productive either because of the skills they possess or because of the jobs they are in. While a computer science or information sciences degree does earn a premium with respect to non-STEM degrees, other degree holders such as computer information management earn somewhat less, on average, than non-STEM degree holders who work as computer scientists.
In columns 3 through 5 in Table C.3 we split the sample by age. The large earnings premium observed for those with degrees in engineering or computer science declines perceptibly but does not disappear.
We carry out a similar analysis by looking at the earnings of those who have degrees in computer science and look at the average returns of working in a given occupation compared to non-STEM occupations. Table C.4 shows that those with degrees in computer science who work as software developers or engineers earn substantial premiums over those working in other occupations. Excluding immigrants does not significantly change these results.
To conclude our analysis we look into the characteristics of those working in computer science as well as computer science bachelor’s degree holders in Table C.5. Women are underrepresented when compared to all bachelor’s degree holders, since only 25.1 percent of those working in CS and 25.7 percent of those who get degrees in computer science are women, compared to 49.6 percent among all bachelor’s degrees in our sample. Despite this underrepresentation the share of women in computer science is higher than in engineering, where only 13.3 percent of their workers and 13.7 percent of their degree holders are women.
Blacks and Hispanics do not seem underrepresented in computer science when looking at degrees, since they are at or above the all bachelor’s degrees
TABLE C.4 Occupation Wage Premium for Those Who Have a Computer Science-Related Degree (2009-2014)
| Log (Annual Wage) | Log (Annual Wage) | |
|---|---|---|
| Computer systems analysts and computer scientists | 0.022a | 0.011 |
| [0.006] | [0.006] | |
| Computer software developers | 0.181a | 0.180a |
| [0.005] | [0.006] | |
| Engineering occupation | 0.159a | 0.157a |
| [0.012] | [0.014] | |
| Other STEM occupation | 0.002 | 0.0212 |
| [0.018] | [0.021] | |
| N | 65,681 | 54,443 |
| Adjusted R-squared | 0.172 | 0.176 |
| Sample | All CS graduates | CS graduates excluding foreign workers |
NOTE: Standard errors in brackets; a p < 0.001. The dependent variable is log annual wage, and we include covariates such as gender, indicators for Hispanic and black non-Hispanic, age group indicators (22-29, 30-39, 40-49, +50), indicators for highest degree attained (master’s, professional degree, and Ph.D.), and year-fixed effects for 2010-2014. Sample includes all workers who attained a bachelor’s degree in computer science, who are not self-employed, and who have been working full time for at least one year. The years of the sample are between 2009 and 2014. The omitted occupation category is non-STEM occupations. SOURCE: American Community Survey.
TABLE C.5 Diversity Measures by Occupation and Bachelor’s Degree (2009-2014)
| Occupations | Bachelor’s Degrees | All Bachelor’s Degrees | |||||
|---|---|---|---|---|---|---|---|
| Computer Science | Engineering | Other STEM | Computer Science | Engineering | Other STEM | ||
| % Female | 25.1% | 13.3% | 40.8% | 25.7% | 13.7% | 41.4% | 49.6% |
| % Black, non-Hispanic | 5.9% | 4.0% | 5.1% | 9.2% | 4.5% | 5.9% | 7.6% |
| % Hispanic | 4.6% | 5.6% | 4.9% | 6.9% | 7.7% | 5.5% | 7.0% |
| Number of observations | 132,144 | 84,312 | 49,677 | 83,330 | 241,519 | 265,571 | 2,788,574 |
NOTE: Sample includes employed workers who obtained a bachelor’s degree from a 4-year institution or higher. SOURCE: American Community Survey, years 2009-2014.
average. They do seem to migrate out of the computer science occupation toward other jobs, since the percentage of blacks and Hispanics working as computer scientists is lower than the all bachelor’s degrees average.
In this paper we look into the labor market for computer scientists and find that, since 2006, workers in this occupation experienced a recovery both in employment and earnings that keeps going until today, although at a slower pace than the increase in demand observed in the late 1990s due to the IT boom. When demand for computer scientists increases, supply can adjust through three different margins: a larger inflow of immigrants who work as computer scientists, a larger rate of enrollment in computer science undergraduate majors, and drawing workers that majored in other fields to work as computer scientists. We find evidence of an increase in all three sources of computer scientists at a lower rate than the one observed during the 1990s boom, consistent with the slower recovery of relative earnings.
REFERENCES
Arrow, Kenneth J., and William M. Capron. 1959. Dynamic shortages and price rises: The engineer-scientist case. Quarterly Journal of Economics 73(2): 292-308.
Bound, John, Breno Braga, Joseph M. Golden, and Sarah Turner. 2013. Pathways to adjustment: The case of information technology workers. American Economic Review Papers and Proceedings 103(3): 203-207.
Bound, John, Breno Braga, Joseph M. Golden, and Gaurav Khanna. 2015. Recruitment of foreigners in the market for computer scientists in the United States. Journal of Labor Economics 33(S1): S187-S223.
Freeman, Richard B. 1976. A cobweb model of the supply and starting salary of new engineers. Industrial and Labor Relations Review 29(2): 236-248.
Ryoo, Jaewoo, and Sherwin Rosen. 2004. The engineering labor market. Journal of Political Economy 112(1): SI 10-40.


