
5
Impacts of Enrollment Growth on Diversity in Computing
Diversity is critical to success in any field. Diversity of perspectives and experiences results in robust thinking and approaches that can help yield solutions and products that meet the needs of a diverse customer base, which often improves the value of a product across the spectrum of users. Diversity is often linked to positive outcomes, such as greater innovation, productivity, and profit.1
A recent industry report identified a “massive economic opportunity” associated with increasing the ethnic and gender diversity in the U.S. technology workforce, with the potential to add $470 to $570 billion to the U.S. tech sector and support the creation of jobs and the improvement of products. The report identifies underrepresentation of African American and Latino/Latina workers in the tech industry compared to the U.S. workforce as a whole, accounting for 7 and 8 percent of tech workers, respectively, compared to 12 and 16 percent of all U.S. workers, as illustrated in Figure 5.1. The gap is even larger for women, who represent only 28 percent of the tech workforce compared to 47 percent of the overall labor force.2
The lack of diversity in computer science and in the information technology sector of the economy, especially among women and underrepresented minorities, is a well-recognized challenge.3 These representation rates are even smaller than those reported for the tech industry as a whole when considering diversity in computing occupations among all U.S. bachelor’s degree holders. According to data from the American Community Survey, between 2009 and 2014, 25.1 per-
___________________
1 See NCWIT (2014).
2 See Intel Corporation and Dalberg Global Development Advisors (2016).
3 See, for example, Cereijido and Selyukh (2016); Donnelly (2017); Margolis and Fisher (2002); Wiener (2016).
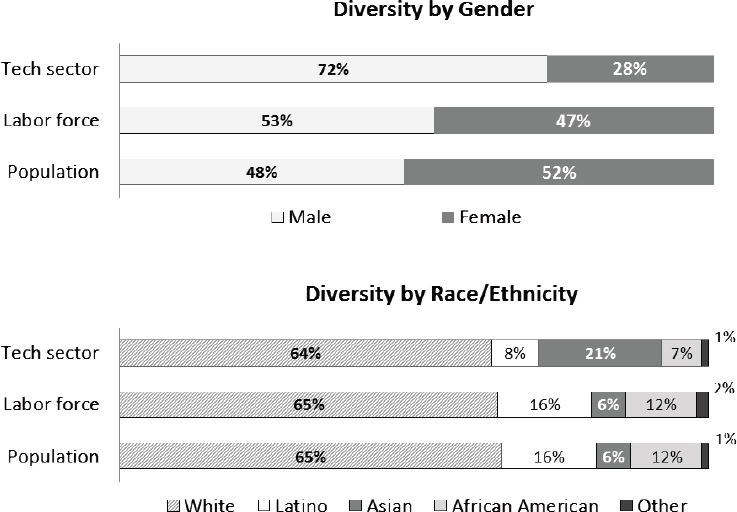
NOTE: Numbers may not add to 100 percent, presumably due to rounding, SOURCE: Data from Intel Corporation and Dalberg Global Development Advisors. 2016. Decoding Diversity: The Financial and Economic Returns to Diversity in Tech. Online. Available at https://www.intel.com/content/www/us/en/diversity/decoding-diversity-report.html.
cent of these workers were female, 5.9 percent were African American, and 4.6 percent were Hispanic or Latino/Latina (Bound and Morales, 2016).
For these reasons the participation of women and underrepresented minorities in computing is of unique interest to many in higher education, government, and industry, and it is of particular importance to the future of the discipline.
The recent enrollment growth in computing presents a unique opportunity for departments to increase student diversity. However, to accomplish this increase, it is important for departments to be intentional about the increase—that is, to put into place programs, policies, and partnerships to increase diversity. For the purposes of this report, “underrepresented minorities” are defined as including the following groups: black or African American, Hispanic, and American Indian or Alaska Native; other (including two or more races) are included in the category of “other or unknown” in the Integrated Postsecondary Education Data System (IPEDS) data. The committee recognizes that people with disabilities comprise an important community that is underrepresented in computing; however, due to the lack of sufficient data, this dimension of diversity is not discussed in this report.
This chapter revisits the national statistical data on undergraduate degree completion (discussed in Chapter 2) with an eye to diversity trends in computer science (CS). Then, current enrollments data from multiple surveys are examined to elucidate recent diversity trends in student enrollment in CS courses and degree programs for available samplings of institutions. Potential diversity challenges and opportunities related to the current enrollment surge are explored.
HISTORICAL DIVERSITY OF UNDERGRADUATE CIS DEGREE RECIPIENTS
As context for thinking about diversity in computing in the current enrollment boom, it is instructive to consider the historical participation of women and underrepresented minorities in computer science and related majors. These trends are explored for women and underrepresented minorities in the following sections based upon available data.4
Representation of Women among CIS Degree Recipients
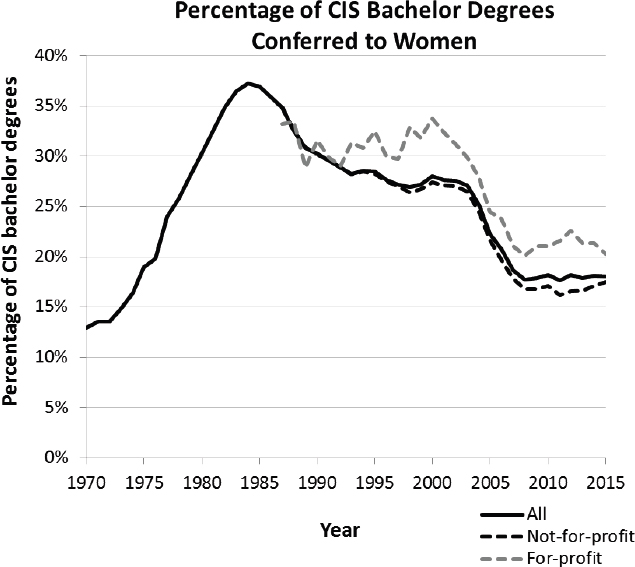
The relative share of computer and information science and support services (CIS)5 bachelor’s degrees reported going to women at all institutions increased until 1985, during the first historical surge in CIS degree production, peaking at 37 percent 2 years before the mid-1980s decline in overall annual CIS bachelor’s degree production, as illustrated in Figure 5.2. At that time this share decreased abruptly, leveling off somewhat in the mid-1990s, then dropping again precipitously beginning in 2004, one year before the 2005 onset of the decline in overall CIS bachelor’s degree production during the dot-com bust. After 2008 the share of CIS bachelor’s degrees awarded to women leveled off, remaining steady near 18 percent overall through 2015. While representation of women is slightly less at not-for-profit institutions, this gap narrowed somewhat between 2011 and 2015.6
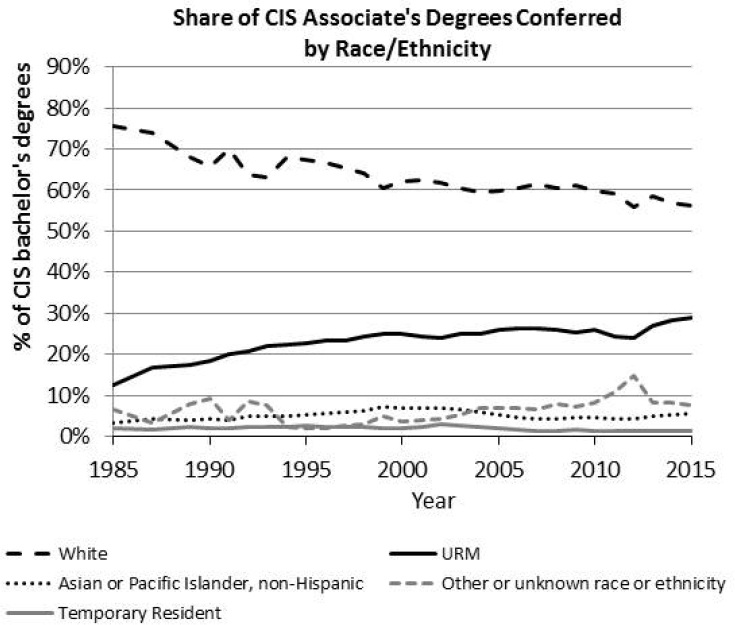
CIS Degrees by Race/Ethnicity
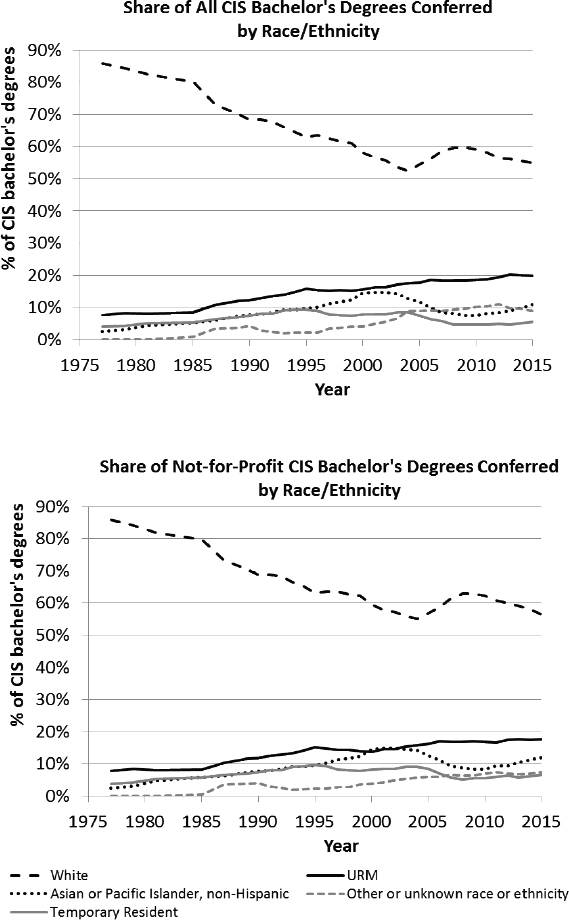
Figure 5.3 illustrates the relative share of all U.S. (CIS) bachelor’s degrees conferred each year to all categories of race/ethnicity from 1977 through 2015 at all institutions (left) and at not-for-profit institutions.7 While representation of
___________________
4 Note that there is some degree of uncertainty in the participation rates discussed in this section. In particular, race/ethnicity is not reported for all national degree production data from IPEDS; a significant number are reported as “other” (which includes two or more races) or “unknown.”
5 According to the IPEDS “detailed” classifier, corresponding to the entire 11 series of Classification of Instructional Programs (CIPs). See NSF (2016b, Chapter 2) for additional discussion of this classifier.
6 There is some evidence that the rate of participation among women has begun to increase at many institutions in recent years. This is discussed in more detail later in this chapter.
7 According to the IPEDS “detailed” classifier, corresponding to the entire 11 series of CIPs. See NSF (2016b, Chapter 2) for additional discussion of this classifier.
underrepresented minorities is higher at for-profit institutions, the share of CIS bachelor’s degrees reported for underrepresented minorities has increased both in general and at not-for-profit institutions since 1975.8 However, this increase has not been uniform across all underrepresented groups.
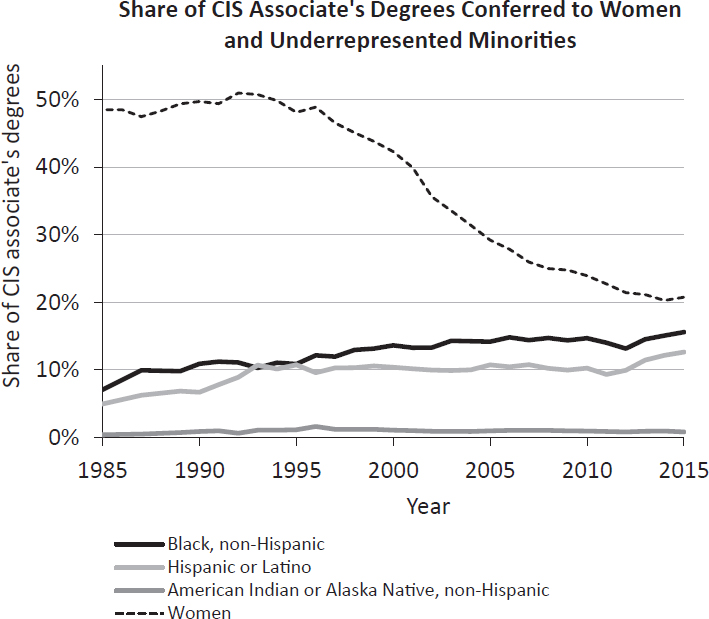
CIS Degree Production for Women and Underrepresented Minorities
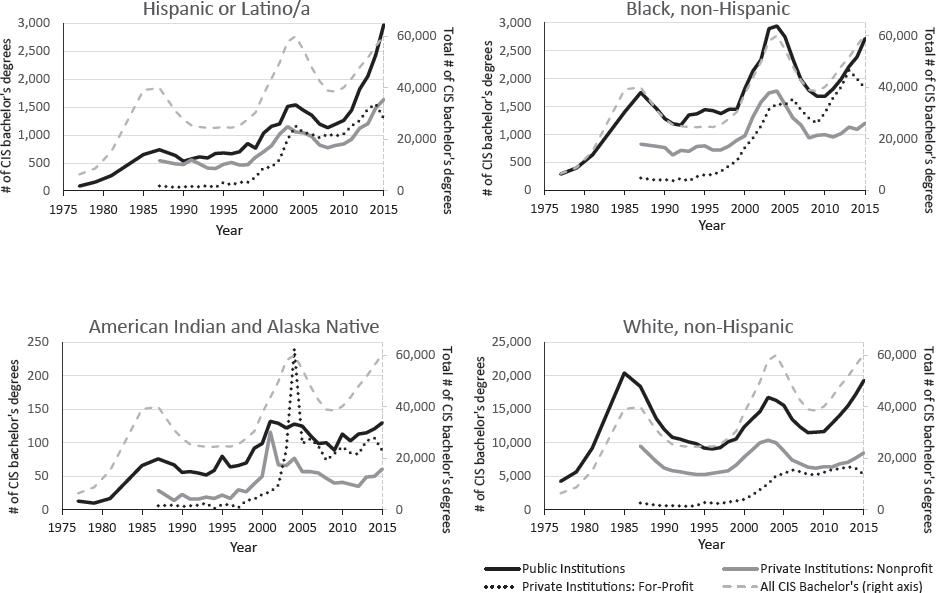
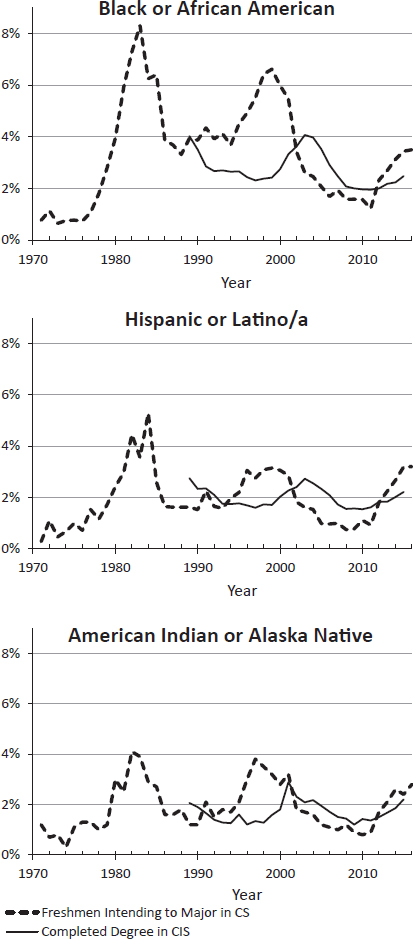
The time series trends for Hispanic or Latino, black (non-Hispanic), and American Indian or Alaska Native (non-Hispanic) students at all institutions and at not-for-profit institutions only are illustrated in Figure 5.4. The share of all CIS bachelor’s degrees going to Hispanic students has increased steadily, as has
___________________
8 It should be noted that a significant fraction of students do not identify a race/ethnicity each year, contributing to significant uncertainty about the accuracy of the apparent trends for any particular race/ethnic group.
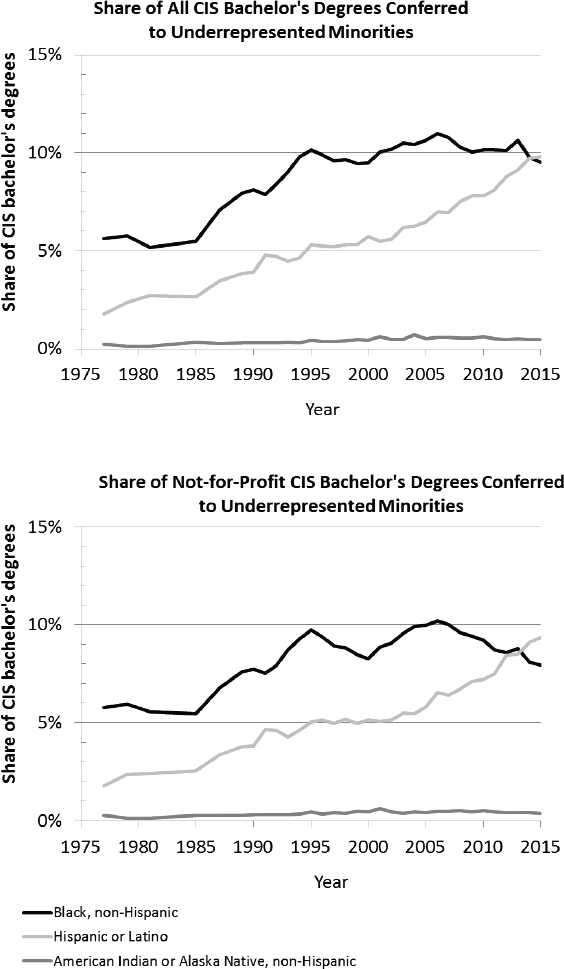
the share of all U.S. bachelor’s degrees9 and the representation of Hispanics in the U.S. population.10 While the share of CIS bachelor’s degrees going to black, non-Hispanic students has increased over the long term with some fluctuations, it has decreased somewhat in recent years (from 10.1 to 9.5 percent overall between 2010 and 2015, and from 10.2 to 7.9 percent at not-for-profit institutions between 2006 and 2015).
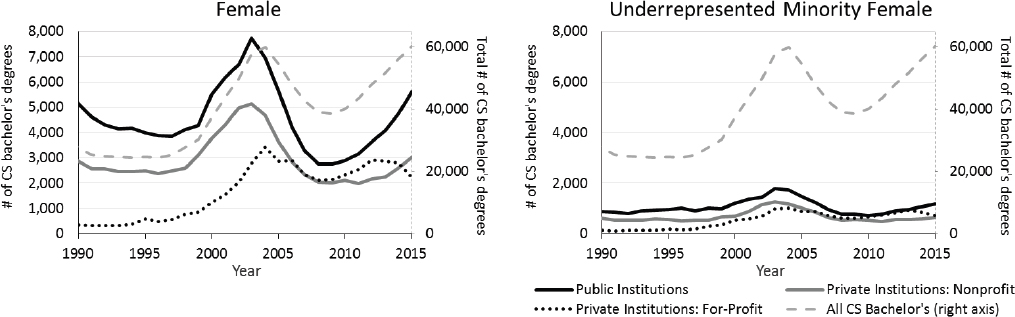
The absolute numbers of degrees conferred to students of each underrepresented race/ethnic group are illustrated by institution type (public, private, for-profit) in Figure 5.5, and for women in Figure 5.6.
For all ethnicities and genders, public institutions provide the largest number of graduates, with the exception of American Indian or Alaska Natives in 2004 where more graduates came from for-profit institutions. For African Americans and American Indians or Alaska Natives, for-profit institutions produced the second largest number of graduates in recent years (and did until 2015 for women and Hispanics); for white, non-Hispanic students, non-profit, private institutions produce the second largest number of graduates.
It is notable that, for white students, public institutions have been by far the top CIS degree producers, accounting for more than twice as many degrees as private or for-profit institutions (which produced similar amounts) since 2012. In contrast degrees awarded to Hispanic or Latina females, American Indian or Alaska Native students, and black or African American students have a much more significant contribution from for-profit institutions, which typically do not provide exposure to research or the environment of institutions with advanced degrees, or access to top recruiters and job opportunities.
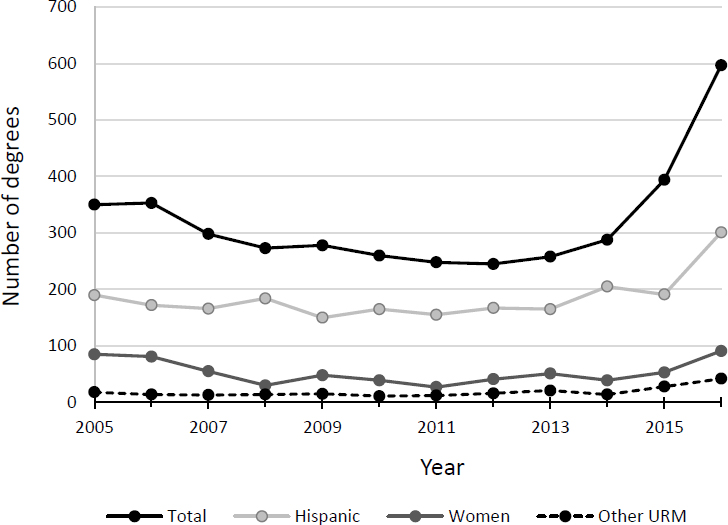
Data on recent CS/CE degree production by race and gender is also available for Computing Alliance for Hispanic-Serving Institutions (CAHSI) institutions, illustrated in Figure 5.7; a recent increase in degree production is apparent (as discussed in Chapter 3). While the sample size is quite small compared to the national data, it is worth noting that degree production is notably high for Hispanics; overall the relative participation of women, Hispanics, and other underrepresented minorities (in this case, identified as African Americans, Native Americans, and Pacific Islanders) has also increased somewhat in recent years (Hug et al., 2017).
FINDING 6: CS and CIS have historically had low representation of women and underrepresented minorities. This trend of underrepresentation in bachelor’s degree completions had not improved significantly as of 2015, but there is some evidence that representation is improving among students currently majoring or interested in majoring in CS.
___________________
9 The share of all bachelor’s degrees conferred to Hispanic students has similarly increased over time (NSF, 2016b).
10 See Flores (2017).
RECENT DEGREE PRODUCTION FOR WOMEN AND UNDERREPRESENTED MINORITIES IN CORE CS, CE, AND IS
The data discussed in the previous sections provide a useful picture of historical diversity trends in CS and related fields. As noted in previous chapters the CIS categories include some fields that may be outside traditional or core CS disciplines, and do not include computer engineering (CE). In order to examine the participation of underrepresented minorities in core CS, CE, and information science (IS) at not-for-profit universities since the recent enrollment surge began, the share of degrees in each of these fields going to women, and black or African American, American Indian or Alaska Native, and Hispanic/Latino students are plotted in Figures 5.8, 5.9, 5.10, and 5.11. For the purpose of these analyses, these three fields are defined as follows: (1) core CS corresponds to the IPEDS CIPs
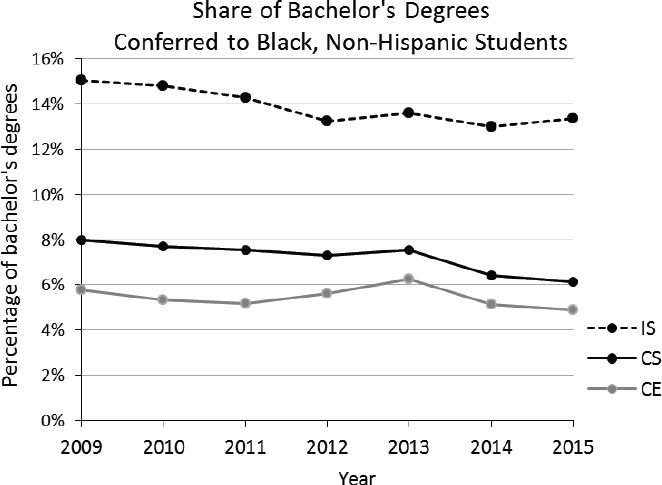
of 11.0101 and 11.0701, (2) CE corresponds to the IPEDS CIP of 14.09xx, and (3) IS corresponds to the IPEDS CIP of 11.0401.11
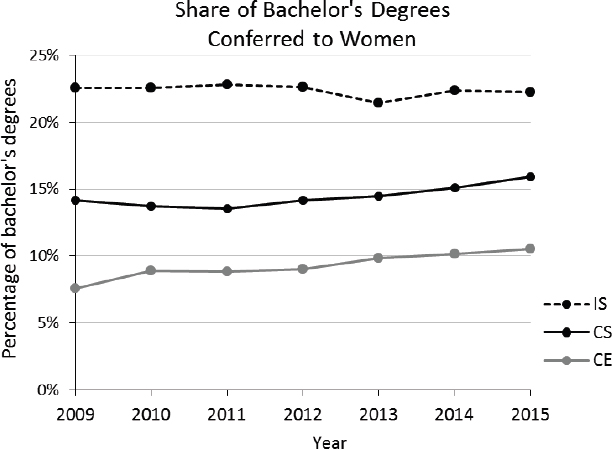
It is noteworthy that women are much better represented in information science/studies than in core CS, and not surprising that they are more poorly represented in CE, as engineering overall generally has the lowest representation of women among science, technology, engineering, and mathematics (STEM) fields. While the share of women in IS has been relatively constant at around 22 percent since the recent enrollment surge began, the share in core CS has increased from 13.6 percent in 2011 to 15.9 percent in 2015.
In their Generation CS report, the Computing Research Association (CRA) broke down the trends for core CS further, to compare the representation of women at doctoral (CS Ph.D.-granting) and non-doctoral (CS non-Ph.D.-granting) institutions, approximately corresponding to those polled in the Taulbee and NDC surveys, respectively. They found that the share of bachelor’s degrees going to women at doctoral institutions rose from 11.4 percent in 2009 to 15.3 percent in 2015; representation of women was higher overall at non-doctoral institutions,
___________________
11 See the section “Data Used in the Development of This Report” in Chapter 1 for additional discussion of the IPEDS classifiers for computer science and related fields.
where they accounted for 17.0 percent of CS degrees in 2009, dropped to slightly below 16 percent from 2011 to 2014, and rose to 16.6 percent in 2015. This shows that, while the representation of women in core CS has been higher at non-doctoral programs than at doctoral programs, the latter has improved steadily since 2011, and nearly bridged the gap by 2015.
Black or African American students also have much higher representation—by approximately a factor of 2—among IS bachelor’s degree recipients than for core CS or CE at not-for-profits. At the same time, while the absolute number of black or African American students completing computer science and related degrees has increased in the current surge, this increase has been slower than that of other race/ethnic groups. As a result, the share of CS, CE, and IS degrees going to African Americans actually decreased between 2009 and 2015, falling from 8.0 to 6.1 percent (CS), 5.8 to 4.9 percent (CE), and 15.0 to 13.4 percent (IS). According to the IPEDS analysis in the Generation CS report (CRA, 2017a), representation of this group dropped both at doctoral-granting (from 5.5 to 4.3 percent) and non-doctoral-granting (from 10.6 to 8.6 percent) institutions between 2009 and 2015; representation of black or African American students completing CS bachelor’s degree programs at non-doctoral institutions was double that at doctoral institutions.
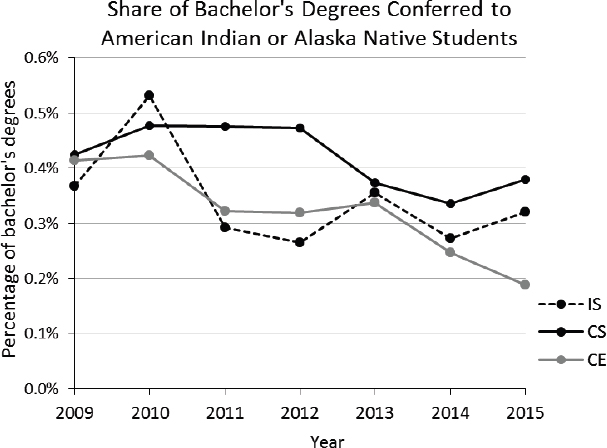
American Indian or Alaska Native students have also seen declining representation in core CS, CE, and IS. Overall representation is similar between the three fields, and the low numbers make it difficult to analyze further.
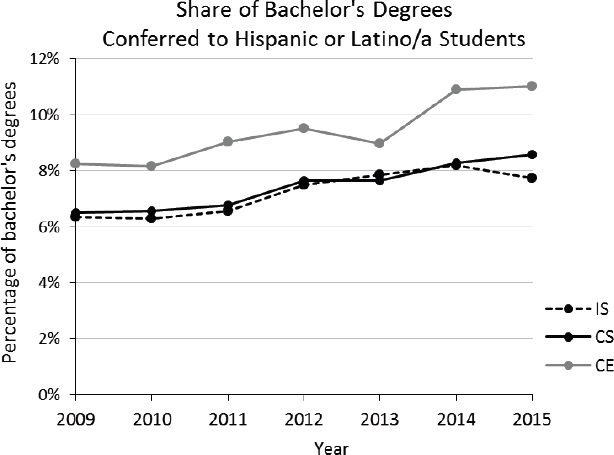
Hispanic or Latino students have seen increasing representation in all three fields, with very similar shares of the degrees produced in both core CS and IS. Unlike the other groups discussed in this section, the share of degrees conferred to Hispanic or Latino students is markedly larger for CE than for CS or IS.
According to the further CRA analysis of bachelor’s degree production in core CS, increasing representation of Hispanic/Latino students has occurred at both doctoral and non-doctoral units over this time, with a consistently lower share but larger growth (from 5.8 to 8.4 percent) at doctoral units compared to non-doctoral (from 7.0 to 8.5 percent).
DIVERSITY OF COMPUTER SCIENCE ENROLLMENTS
In order to better understand the relationship between diversity in both CS degree program and course enrollment in the context of the recent surge, it is instructive to consider available surveys, given the lack of national-scale data about degree enrollments and course enrollments, as discussed in Chapters 2 and 3. The committee turned to five data sources, three of which were discussed in more detail in Chapter 3: (1) data on freshman intent to major in CS from the Freshman Survey Trends of the Cooperative Institutional Research Program (CIRP) of the Higher Education Research Institute (HERI) at the University of California, Los Angeles; (2) CS program enrollment data from Ph.D.-granting institutions surveyed by the CRA during the time period of 2012 through 2015, as part of the Taulbee Survey; (3) the CRA and Association for Computing Machinery (ACM) Enrollment Surveys, including data on course enrollments; (4) data collected and analyzed by the Consortium for Undergraduate STEM Success; and (5) enrollment data for members of CAHSI. While these case studies represent a small subset of U.S. institutions, they nonetheless allow for a unique and in-depth look at diversity of enrollment in CS majors or courses, which complements that provided by the degree production data presented in the preceding section. In the following, gender diversity and the representation of underrepresented minorities in undergraduate computing are explored using the available data.
Intent to Major in Computer Science
While the fraction of CIS bachelor’s degrees awarded to women remained relatively flat from 2009 to 2015, the fraction of female baccalaureates whose degrees were in CIS did increase slightly (from 0. 74 to 0.99 percent of female bachelor’s degree recipients) during this time, meaning that the participation rate in CS among women has increased at the same time as it has for men (from 4.57 to 6.02 percent of male bachelor’s degree recipients). Among respondents to the
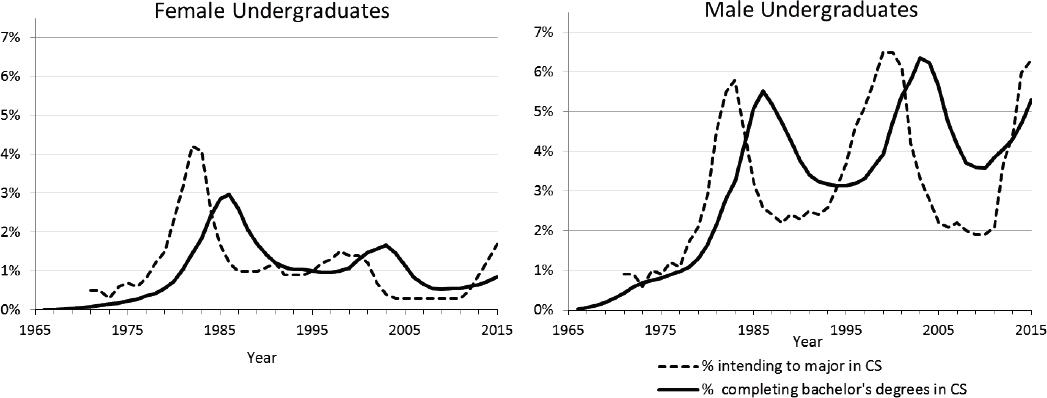
HERI CIRP survey (discussed in Chapter 3), the share of female freshmen intending to major in CS increased from 0.3 to 1.7 percent between 2011 and 2015, compared to an increase from 2.1 to 6.3 percent for male freshman. These data, illustrated in Figure 5.12, suggest that the relative growth in the share of students interested in enrolling in CS as a major is higher for women than for men.
Similar data for underrepresented minorities, shown in Figure 5.13, show that these groups have also begun to participate at increasing rates in computer science bachelor’s programs at not-for-profit institutions. However, unlike for women and Hispanics, the rates of intent to major in CS among black and American Indian or Alaska Native students have not yet reached dot-com-era levels.
The HERI CIRP survey is based on a sampling of students at a subset of all not-for-profit institutions of higher education, whereas the IPEDS degree completions are extracted from all not-for-profit institutions, and the specific data presented may include more disciplines than those counted in the HERI CIRP survey. In addition, students change majors during their undergraduate careers for a number of reasons; it remains to be seen whether the faster increase in interest among women (according to the survey) will translate to an increase in the share of CIS degrees going to women when the freshmen of 2011-2015 graduate, and how increased participation among underrepresented minorities will affect the overall diversity among CS bachelor’s holders.
Computer Science Program and Course Enrollments
As discussed in Chapter 3 the CRA conducts an annual survey of Ph.D.granting institutions to collect data on CS degree production (bachelor’s, master’s, and doctoral), faculty demographics, faculty salary, and Ph.D. graduate placement. The Taulbee Survey is distributed to 266 Ph.D.-granting departments annually. Because CRA is focused on computing research, it only recently began collecting data on undergraduate enrollment in the degree program, with data broken out by ethnicity and gender beginning in the 2012-2013 academic year. In the first 3 years, 121 departments responded to this section of the survey (though not necessarily the same 121 departments each year); 155 responded for the 2015-2016 academic year.
Overall, average CS program enrollments per department more than doubled in this time period. At the same time, upward trends were observed in the percentage of Hispanic (7.8 to 9.5 percent), multiracial non-Hispanic (2.1 to 3.0 percent), and female (13.9 to 18.3 percent) subgroups. The percentage of black or African American students fluctuated around 5 percent, most recently decreasing, and the percentage of American Indian or Alaska Native and Native Hawaiian or other Pacific Islander was small, below 0.5 percent. The shares of major enrollments for women and for all race/ethnicity groups are displayed in Table 5.1.
The corresponding statistics for the non-doctoral institutions responding to this survey are listed in Table 5.2. While these data are less complete, the
| 2012-2013 | 2013-2014 | 2014-2015 | 2015-2016 | |
|---|---|---|---|---|
| Total enrollment | 43,391 | 72,447 | 90,604 | 104,634 |
| Women | 13.9% | 15.3% | 16.5% | 18.3% |
| American Indian or Alaska Native | 0.4% | 0.4% | 0.4% | 0.1% |
| Native Hawaiian or other Pacific Islander | 0.2% | 0.2% | 0.3% | 0.3% |
| Multiracial not Hispanic | 2.1% | 2.7% | 2.8% | 3.0% |
| Black or African American | 4.9% | 5.0% | 5.4% | 4.8% |
| Hispanic, any race | 7.8% | 8.8% | 9.0% | 9.5% |
| Asian | 16.1% | 19.5% | 21.6% | 23.8% |
| White | 58.9% | 54.4% | 51.0% | 47.4% |
| Nonresident alien | 9.6% | 8.9% | 9.5% | 11.0% |
NOTE: Students with no or unknown race/ethnicity listed were excluded from the total in calculation of the corresponding percentages. SOURCE: CRA Taulbee Survey.
TABLE 5.2 Demographics of CS Undergraduate Program Enrollments at NDC (Non-CS Doctoral) Institutions
| 2012-2013 | 2013-2014 | 2014-2015 | 2015-2016 | |
|---|---|---|---|---|
| Institutions reporting | 101 | 163 | 132 | 121 |
| Total enrollments reported | 6,659 | 14,061 | 12,759 | 11,864 |
| Average enrollments per institution reporting | 66 | 86 | 97 | 98 |
| Women | 12.6% | 11.0% | 16.1% | 16.0% |
| American Indian or Alaska Native | 0.3% | 0.3% | 0.4% | 0.4% |
| Native Hawaiian or other Pacific Islander | 0.2% | 0.2% | 0.2% | 0.2% |
| Multiracial not Hispanic | 1.3% | 2.0% | 1.7% | 2.4% |
| Black or African-American | 5.3% | 4.4% | 4.8% | 5.5% |
| Hispanic, any race | 7.0% | 8.3% | 7.1% | 6.6% |
| Asian | 6.3% | 6.1% | 9.5% | 8.7% |
| White | 53.3% | 52.0% | 51.4% | 46.3% |
| Nonresident alien | 3.3% | 4.1% | 4.3% | 5.1% |
NOTE: Students with no or unknown race/ethnicity or gender listed were excluded from the total in calculation of the corresponding percentages. SOURCE: ACM NDC Survey; unpublished data courtesy of ACM.
reported representation levels are similar, though generally smaller for women and Hispanic students.
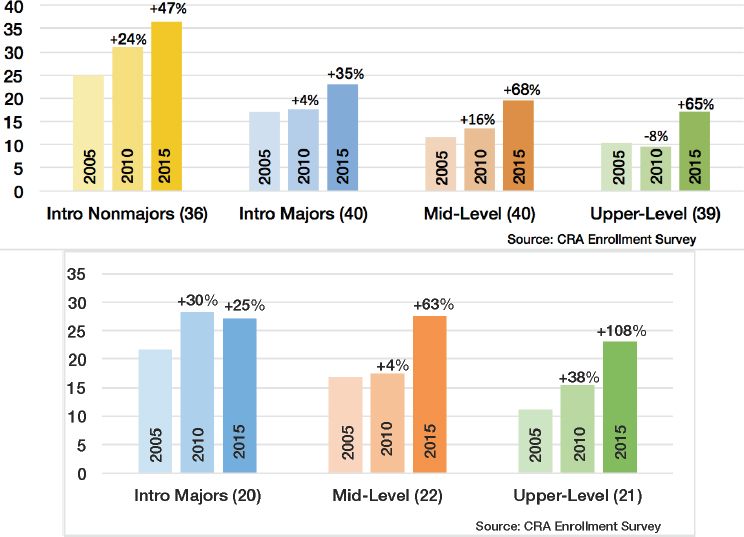
As discussed in Chapter 3 the CRA conducted in collaboration with ACM a special survey of institutions to obtain detailed evidence of the extent and impact of the current enrollment surge at CS departments. The overall goal of this 2015 survey was to measure, assess, and better understand enrollment trends, with a focus on undergraduate degree programs.12
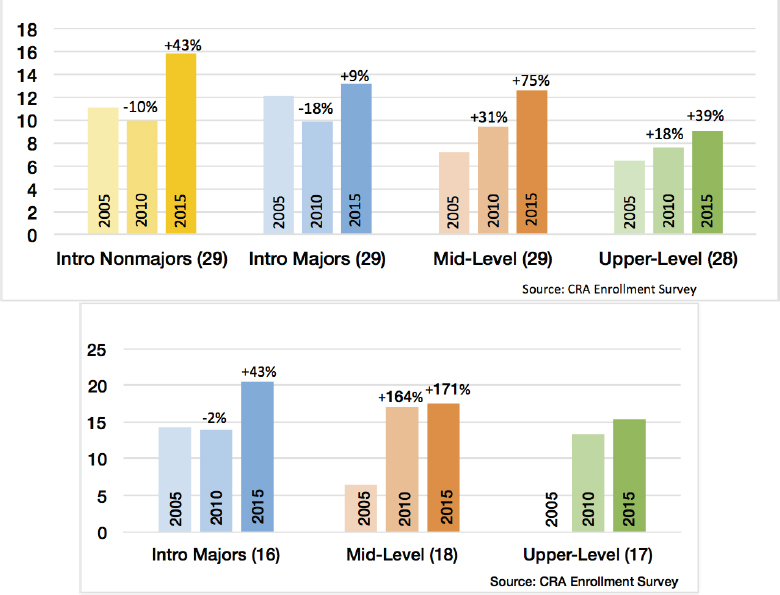
In addition to total course enrollment numbers, institutions were asked to provide the demographics of the students enrolled in courses that are representative of the four course categories: introduction for non-majors, introduction for majors, mid-level, and upper-level computer science courses (CRA, 2017a).
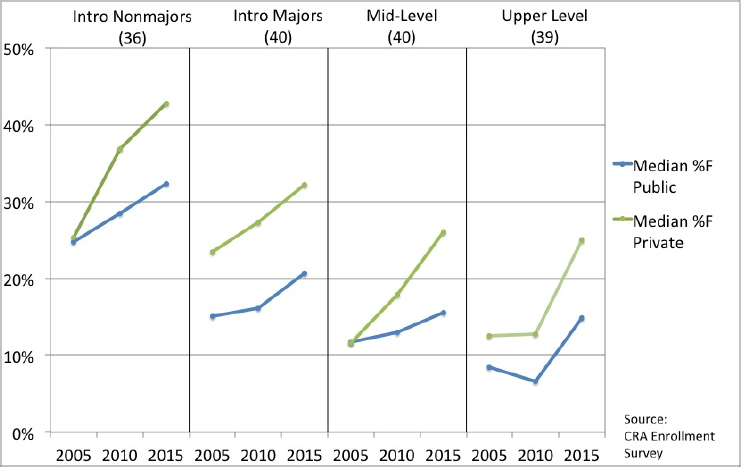
Figure 5.14 illustrates the median percentage of female students in each category of class at the doctoral (top panel) and non-doctoral (bottom panel) institutions that responded to the survey. The median response for doctoral institutions
___________________
indicated a slight increase in representation of women in all but the upper-level course between 2005 and 2010, and a more pronounced increase across all course types between 2010 and 2015. The median response for non-doctoral institutions showed similar trends for mid- and upper-level courses (this category does not include courses directed at non-majors, as few non-doctoral institutions reported courses of this type). This suggests that there is reason to expect that the fraction of CS degrees awarded to women will increase in upcoming years unless something disrupts the trends in the pipeline. The illustrated decrease in participation of women along the course progression could be due in part to the time lag between courses (e.g., trends in introductory classes would take a few years to propagate as students advance), but it nonetheless illustrates that attrition rates are higher among women than men.
For CS Ph.D.-granting institutions, the data are further broken down by private versus public institutions in Figure 5.15, which indicates that women make up a larger percentage of CS students at private institutions than at public ones, and the rate of increase is higher.
The median number of underrepresented minority CS students at responding institutions increased for all course levels between 2005 and 2015, as illustrated in Figure 5.16. It is worth noting that minority-serving institutions (MSIs) contribute
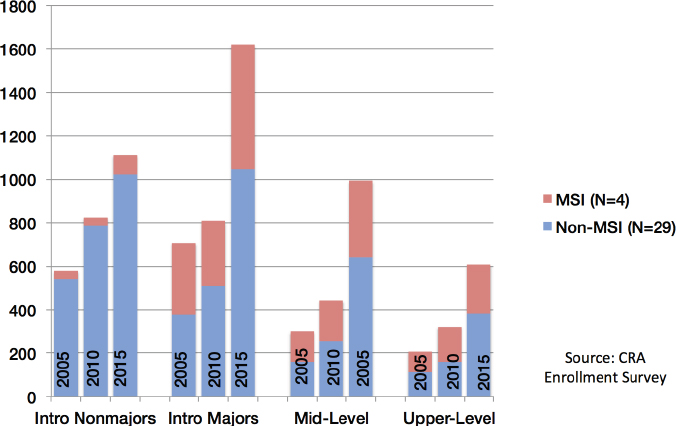
to these numbers disproportionately. The median percentage of underrepresented minority CS students at non-MSI institutions is illustrated in Figure 5.17 for all course levels at doctoral (top panel) and non-doctoral (bottom panel) institutions. For each course category the fraction is higher in 2015 than in 2010 or 2005, though an increase did not necessarily occur during each 5-year interval.
DIVERSITY IMPACTS ASSOCIATED WITH ENROLLMENT GROWTH
Representation of Women
Interest in CS as a major among both the female and male freshmen populations rose significantly in the lead-up to the surge in CS degree production in the 1980s; the corresponding representation of women among CS degree recipients increased. In the dot-com era, interest again increased among freshmen of both genders, but the increase was less pronounced among women than among men. However, in the wake of this growth, the share of female undergraduates intending to major in CS seemed to drop much more than it did for male undergraduates, according to Figure 5.12. Because these trends in freshman interest in the major were surveyed within the first few weeks of students’ undergraduate education, student interest as measured by the survey is likely informed by a
student’s preexisting understanding, and affinity for the substance of the discipline, knowledge of the requirements of the major, perception of the culture of the academic program compared to that of other fields, and expectations of career opportunities. Several recent studies have identified factors that may contribute to women’s interest levels in computer science. In general women’s awareness or perception that STEM fields tend to be male dominated can affect their participation rates or interest level (Sax et al., 2017). For example, the existence of masculine stereotypes in the environment of a computing classroom can decrease a woman’s sense of ambient belonging in the environment, and discourage interest in the environment, whether or not there are any males present (Cheryan et al., 2009).
Because many factors influence these decisions, it would be difficult to define a single cause for the decreasing representation of women in CS and
related fields after past surges.13 Nonetheless, there is a very real possibility that the state or culture of academic computer science was or became somehow uniquely discouraging to women at times when enrollments surged. Thus, with the onset of the current surge, it is critical to consider the potential impacts of enrollment growth—and the actions that institutions take in response to this growth—on the inclusiveness of academic programs.
Representation of Underrepresented Minorities
During the increases in overall enrollment in the mid-1980s and late 1990s, participation among black, Hispanic/Latino, and American Indian/Alaska Native students increased as well. In the wake of both past increases, the share of CIS degrees conferred to students from these groups also increased. In the recent period of enrollment increases, the share of CIS degrees awarded to Hispanic students has increased, but the share going to black and American Indian or Alaska Native students has decreased. While these results are mixed, there may be opportunities to harness the current enthusiasm for the field to build and sustain new interest in computing among individuals from underrepresented or disadvantaged groups by considering best practices described in the next section and collaborating with organizations focused on broadening participation in computing.
Capitalizing on enrollment growth is of particular importance, given that computing jobs offer higher wages on average for new college graduates and throughout one’s career, computing skills are more commonly valued in the highest-paying occupations, and computing jobs are expected to grow at twice the rate of all U.S. jobs through 2024, as discussed in Chapter 4.
Best Practices for Diversity
An institution’s actions to respond to increased demand for computing courses has the potential to affect its alignment with best practices for diversity. At the same time, the need to respond to increased demand also provides an opportunity for institutions to rethink and redesign practices to increase diversity.
The subject of diversity in STEM-related disciplines has been well studied and reported on for many years. Factors that affect diversity are broad ranging and include institutional and departmental policies on admissions, dedicated retention programs and support structures, pedagogical approaches, perceptions of the value of a discipline, identity with the major, and the nature of the learning environment (Eagan et al., 2010).
___________________
13 For some historical context on forces affecting the participation of women in computer science, see Misa (2011) and Ensmenger (2012).
A review of literature suggests the following best practices for recruitment, retention, and success of diverse student populations in STEM and computing disciplines:
- Minimize or remove the presence of ambient stereotypes in the classroom (Cheryan et al., 2009).
- Include service learning and real-world context in the curriculum (Brinkman and Diekman, 2016; Davis and Finelli, 2007).
- Build meaningful relationships with faculty and peers in the field (Chang et al., 2014; Cole and Espinoza, 2008; Conrad et al., 2009; Gates et al., 2016; Newhall et al., 2014; Peckham et al., 2007; Wilson et al., 2012).
- Emphasize collaborative problem solving and interdisciplinary projects (Peckham et al., 2007; Pulimood and Wolz, 2009).
- Provide multiple pathways to attract computing majors (Peckham et al., 2007).
- Enable student participation in undergraduate research programs (Chang et al., 2014; Conrad et al., 2009; Davis and Finelli, 2007; Gates et al., 2016; Villa et al., 2013; Wilson et al., 2012).
- Provide introductory course options that separate students with prior experience in computer science from those with no experience (Cohoon and Luther, 2011).
- Provide learning environments other than those expected in the normative culture of computer science (Simon et al., 2015).
- Enlist a diverse team of faculty, instructors, and mentors.
- Finally, active assessment and refinement of institutional culture and practices with an eye to inclusivity is an obvious—but not trivial—step for improving diversity.
While such practices reflect the current state of thinking about diversity, it is worth noting that many of these studies are based on single-institution or single-time-point cases. Thus, much of the available literature has been somewhat limited in causally attributing positive trends to these practices. There is a great need for more broad and longitudinal studies on the efficacy and underlying mechanisms of such actions for increasing participation and retention among women and underrepresented minorities.
Diversity and Institutional Responses to Increasing Enrollments
As computing departments face pressures created by rapidly increasing enrollments in computing majors and courses, decisions about how to deal with these pressures must be made. Availability of faculty, graduate/undergraduate teaching assistants, classroom space, and financial resources influence the responses of individual institutions. Some of the possible responses do not curb
demand for courses but accommodate it, such as by hiring additional faculty (tenure-track, non-tenure-track, visiting, or adjunct), making wider use of teaching assistants to teach classes and provide instructional support, or increasing the number and size of course sections offered. In other cases restrictions are placed on the number and type of students being serviced by the department. These actions include imposing enrollment caps on the major, tightening admission requirements for the major, restricting registration in high-demand courses to majors and minors only, and reducing offerings of courses that are not as highly demanded or that service students outside the computing major, as identified by the CRA and ACM Enrollments Surveys discussed in Chapter 3.14 Less than half (46.5 percent) of the responding doctoral institutions reported considering potential impacts on diversity when choosing what actions to take; 79.8 percent of respondents reported that they are not monitoring for diversity effects at these transition points.
Deploying new admissions policies as a way of managing enrollment demands poses the potential to negatively impact diversity in computing programs—indeed, one explanation proposed for the sudden drop in the participation of women in computing in the 1980s is that the practices put in place at many universities to manage that boom in enrollments created an unfriendly or even hostile climate that was found to be less welcoming or appealing by female students.
While there is evidence that diversity of CS enrollments has been increasing at many of the institutions currently experiencing surges in enrollment (as discussed earlier in this chapter), there is no guarantee that tactics recently (or soon to be) deployed for managing large enrollments will not disrupt this trend.
For example, overreliance on past measures of knowledge or success, such as standardized testing, for decisions about acceptance into courses and majors could be limiting to diversity. The ethnicity breakdowns of scoring on the SAT (NCES, 2015) and ACT (NCES, 2010b) exams reported by the NCES show that underrepresented minorities score lower on these exams than their white and Asian counterparts, which may be due to disparities in the opportunities available to different populations at the K-12 level. In particular, studies have found correlation between SAT performance and socioeconomic factors (Geiser, 2015). Several authors have made the case for broadening admissions decisions in general beyond such narrow quantitative measures (Aguinis et al., 2016; Manning, 1989; Nunez, 2015; Soares, 2012).
Expectation of K-12 exposure to computer science can also have a negative impact on diversity. This expectation may manifest as an element of the admissions decision process, or it may be implicitly included in the expectations of student skill level in the first required computer science course. For example,
___________________
14 This list of possible restrictions corresponds with the actions identified in the questionnaire for the CRA Enrollments Survey and is not necessarily comprehensive. For example, another restriction would be to prohibit students already declared in another major from switching into CS as a major, regardless of any other mechanism of capping the major.
TABLE 5.3 Number and Mean Scores of AP Computer Science-A Test Takers by Ethnicity (2010-2015)
| Race/gender | # of Test Takers | % of Test Takers | Mean Score | |||
|---|---|---|---|---|---|---|
| Male | Female | Male | Female | Male | Female | |
| White | 21,779 | 4919 | 40.1 | 9.0 | 3.09 | 2.91 |
| Asian | 11,110 | 4803 | 20.4 | 8.8 | 3.36 | 3.28 |
| Hispanic | 4820 | 1436 | 8.9 | 2.6 | 2.35 | 2.03 |
| Two or more races | 1770 | 645 | 3.3 | 1.2 | 3.15 | 2.99 |
| Black | 1415 | 612 | 2.6 | 1.1 | 2.10 | 1.81 |
| No response | 651 | 177 | 1.2 | 0.3 | 3.15 | 2.79 |
| American Indian | 79 | 9 | 0.1 | <0.1 | 2.80 | 1.89 |
| Native Hawaiian | 56 | 15 | 0.1 | <0.1 | 2.38 | 2.20 |
| Other | 57 | 26 | 0.1 | <0.1 | 3.14 | 3.19 |
| Total | 41,737 | 12,642 | 76.8 | 23.2 | 3.05 | 2.90 |
SOURCE: Data from the College Board.
reliance on participation or performance in Advanced Placement (AP) Computer Science-A (illustrated in Table 5.3) as a means of limiting the number of students in courses or degree programs would also have the effect of limiting the diversity (that is, participation of women and underrepresented minorities, with the exception of students who declared two or more races) in undergraduate enrollments.15 In 2015 girls represented only 22 percent and underrepresented minorities only 13 percent of AP test-takers. In nine states, not a single African American student took the exam (Heitin, 2015).
However, introduction of the new AP CS Principles (CSP, discussed in Chapter 4) resulted in a near doubling of the number of students taking an AP CS course between 2016 and 2017 to approximately 111,000 in 2017 (Chatlani, 2017; College Board, 2017; CRA, 2017b). CSP has also been credited with increasing the number of minorities and women taking a CS AP exam, with minority students accounting for 20 percent and women for 27 percent of 2017 test takers; however, this representation has not yet reached parity with the general population.16
The discussions in previous sections focused on institutions that offer 4-year undergraduate degrees. It is important, however, to note that minority, first-generation, and low-income students disproportionately attend 2-year institutions
___________________
15 Data obtained from https://research.collegeboard.org/programs/ap/data/archived/ over the years 2010-2015.
16 See Chatlani (2017); Kamenetz (2017); Partovi (2017); Purdue (2017).
for economic reasons. In 2011 nearly half of all students at the undergraduate level attended 2-year colleges (Kena et al., 2014; Mooney and Foley, 2011), and approximately 18 percent of individuals who received bachelor’s degrees in science and engineering between 2007 and 2011 had previously earned associate’s degrees. The share of CIS degrees accounted for by women and underrepresented minorities is higher for associate’s degrees than it is for CIS bachelor’s degrees, as illustrated in Figures 5.18 and 5.19.
A recent study by Excelencia in Education found that today’s college students no longer fit the perceived “traditional” student profile of a full-time student transitioning directly from high school to a 4-year college or university (Santiago et al., 2015). This is true, for example, of CAHSI students, who often take a longer path to graduation because of financial constraints and responsibilities for families and dependents. A survey of CAHSI institutions (Thiry and Hug, 2016b) revealed that 23 percent of CAHSI students temporarily left the university (i.e., did not enroll for one or two semesters) because of economic hardship, 50 percent worked outside their studies, and 53 percent were first-generation college students. Many of the CAHSI institutions receive transfer credits from 2-year colleges for approximately 30 to 40 percent of their students.
CAHSI is now piloting efforts to extend peer-led team learning (PLTL) to 2-year feeder colleges with the intent to increase the computing pipeline to 4-year colleges. PLTL has significantly contributed to students’ persistence in their chosen major. Prior to the implementation of PLTL in “gatekeeper” courses in the major, merely 77 percent of the enrolled students finished the course, while 87 percent of students completed the course after PLTL implementation (Thiry and Hug, 2016b). In addition, over the years, CAHSI departments have made an effort to foster student participation in computing clubs and professional chapters of computing groups. Indeed, CAHSI students report that they participate in computing-related organizations at slightly higher rates than the national sample of computing students. Likewise, CAHSI students report much higher rates of participation in computing-related groups for minority students than the national sample of students (Thiry and Hug, 2016b).
FINDING 7: There is no guarantee that the representation of women and underrepresented minorities in CS will improve without a focused effort. Retention is always a challenge, and adverse conditions associated with high demand for courses—as well as actions taken by institutions in order to manage enrollments—could negatively impact the inclusiveness of undergraduate computing programs.
ACTIVE EFFORTS TO INCREASE DIVERSITY IN COMPUTING
As discussed in previous sections the recent increases in degree production (2009 to present) and computing enrollments (roughly 2005 to present) have
coincided with increases in the total number of women and underrepresented minorities participating in computer science and related fields. While the share of CIS degrees going to women has not increased during this time, there is some evidence to suggest that participation among women in CS has begun to rise. These trends may be due in part to recent efforts to broaden participation in computing, including activities aimed at increasing diversity in computing and to increase the participation of students in CS at the K-12 levels.17
___________________
17 See the section “Increased Participation in Computing at Primary and Secondary Levels” in Chapter 4 for additional discussion of increasing CS exposure in K-12.
Organizations such as the Computing Research Association Committee on the Status of Women in Computing Research, the Association for Computing Machinery Council on Women in Computing, the Anita Borg Institute, and the National Center for Women & Information Technology (NCWIT) support a range of such initiatives and provide useful resources, such as mentoring and guidance on mentoring practices for women in computing. Efforts to support and increase gender and racial/ethnic diversity in computing include the Grace Hopper Conference (Anita Borg Institute, 2017a), organized by the Anita Borg Institute; the ACM-W Celebrations of Women & Computing conferences (ACM-W, 2017); the Richard Tapia Conference (ACM, 2017), organized by the Center for Minorities and People with Disabilities in IT (CMD-IT) and sponsored by the ACM; the CMD-IT University Award, which recognizes institutions for effective retention of underrepresented minorities in undergraduate CS programs; the
Building, Recruiting, and Inclusion for Diversity Initiative (Anita Borg Institute, 2017b), co-led by the Anita Borg Institute and Harvey Mudd College; the CAHSI Summit, co-located with the HENAAC Conference organized by Great Minds in STEM;18 and NCWIT’s Aspiration program for high school girls (NCWIT, 2017). Sustained success in these and related programs will likely contribute to future increases in diversity in computing.
In addition, many CS departments today have support and outreach programs for women and underrepresented minority students in their departments and broader communities. Such efforts are expected to improve the environment for these students and help decrease attrition among these groups.19
A constellation of public and private efforts to boost high school students’ CS skills and knowledge may increase the numbers and diversity of undergraduates enrolling in CS courses and majoring in CS over time. However, such an increase may further contribute to the enrollment pressures that many institutions are currently experiencing and intensify demands for solutions. Furthermore, attrition among women and underrepresented groups remains a challenge in computer science and related fields; while increasing interest shows promise, deliberate efforts may be needed to translate this into increasing representation of these groups in these fields.
LEVERAGING BOOMING ENROLLMENTS TO INCREASE DIVERSITY IN COMPUTER SCIENCE AND RELATED FIELDS
Increasing enrollments in CS courses pose a range of challenges for CS units and the students seeking these courses. Much emphasis has been placed on the negative implications for diversity—in particular, due to increasing competition for courses and higher student-to-faculty ratios for these courses, which could lead to less-welcoming, even hostile environments. As discussed in previous sections, this is a serious risk.
At the same time, the recent boom does present some opportunities for improving diversity. Even if representation levels of women and underrepresented minorities have not increased much, on average, the absolute number of students from these groups has. As these numbers continue to rise there will be a larger critical mass for creating or strengthening supportive peer communities and networks, and for the successes of women and underrepresented minorities to become visible and inspirational to their peers. There will be more women and underrepresented minorities to serve as peer mentors and undergraduate teaching assistants, which may help to evolve the image of the field.
Furthermore, where demand is increasing, institutions will adapt in response, whether in the near term, the long term, or both. Any changes to policies, prac-
___________________
18 See CAHSI (2017b).
19 For example, see CSWN (2017); CS Women UMass Amherst (2017); PWiCS (2017); Women@CC (2017); Women@SCS (2017).
tices, and pedagogies that ensue have the potential to change the culture of the program for the better, but only if institutions make such cultural shifts a priority. In the following chapter, the range of options available to institutions are discussed, along with their advantages and risks; diversity implications are a key dimension.
This page intentionally left blank.


