
4
Internal Combustion Engine-Based Powertrain Technologies
The spark-ignition internal combustion engine (ICE) fueled by gasoline is by far the dominant form of propulsion in the current U.S. fleet, with 96% of model year (MY) 2019 vehicles containing a spark-ignition ICE engine, and 91% powered exclusively by a spark-ignition ICE (EPA, 2020a). Even with increasing levels of electrification, the spark-ignition engine will continue to play a significant role in ICE-only powertrains as well as in hybrid and plug-in hybrid powered vehicle powertrains in 2025–2035. This chapter discusses the technological development of conventional powertrains, specifically ICEs and transmissions and including those developed for integration into hybrid electric applications of all levels. The electric components and batteries used in hybrid powertrain systems are addressed in Chapter 5.
In 2025–2035, automakers will pursue a variety of powertrain options to improve fuel economy. Therefore, rather than focusing solely on individual technologies and their fuel economy benefits and costs, conventional and hybrid powertrain technologies are described in the context of “pathways” representing significant trends in engine technology and development. This pathway approach allows technologies to be evaluated, including their potential contribution in specific system-level applications. For example, the benefit of cylinder deactivation is different for a downsized/boosted 4-cylinder engine than for a large displacement, naturally aspirated 8-cylinder engine and might therefore be prioritized differently for different applications. Additionally, manufacturers will pursue multiple strategies to satisfy customer requirements in different vehicle classes and carlines. For example, in the midsize crossover segment alone, the largest and fastest growing vehicle class, U.S. market MY 2020 powertrains include diesel, hybrid, plug-in hybrid, naturally aspirated ICE, downsized/boosted ICE, and battery electric vehicles (BEVs). The efficiency approach pursued by automakers will likely be a mix of some or all of these pathways in addition to non-powertrain technologies. Last, because the impacts of these technologies differ by their implementation, engine technology efficiency must be assessed within the context of powertrain systems.
4.1 DOWNSIZED/BOOSTED ICE PATHWAY
Downsized/boosted engines are ICEs where the swept volume (displacement) of the engine has been reduced, while vehicle performance is maintained by pressure charging the intake air using a turbocharger or supercharger. Such engines represented 34% of the market in 2019 (EPA, 2020a). Their current technology status and opportunities for energy improvement and the committee’s estimated costs and capabilities of future turbocharged/boosted technologies in 2025–2035 are described below.
4.1.1 Current Technology in Downsized/Boosted ICE Pathway
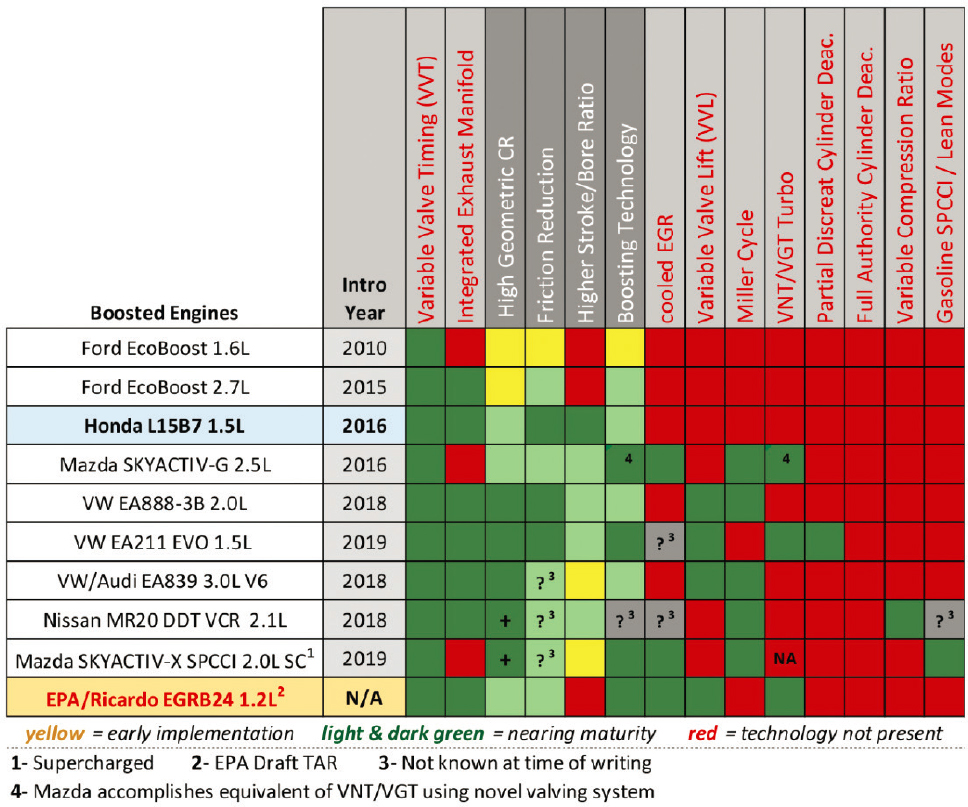
In 2015, the National Research Council (NRC, 2015) described the next steps toward turbocharged/downsized engines as turbocharging and downsizing Level 1 (33% downsized), stoichiometric direct injection, variable valve timing (VVT), dual cam phasing, and idle stop-start. In MY 2019, engines with these technologies are available from most manufacturers and found in all light-duty vehicle (LDV) segments (EPA, 2020a). In particular, turbocharged engines with gasoline direct injection enabling engine displacement reduction have achieved a market penetration rate of 24% in MY 2017, as noted in Chapter 3, Table 3.2, and are likely to be a predominant engine type in 2025.
4.1.2 Efficiency Aspects Improved by Downsizing and Boosting
Automotive engines have traditionally been oversized for regular operation so that they can meet the peak performance demands of a given vehicle application. Such engines were naturally aspirated and operated at far less than peak engine efficiency when operating on the relatively lightly loaded fuel economy drive cycles. To improve performance and engine efficiency, pressure-charged engines were developed that can generate higher torque levels at lower relative engine speeds. Such engines can offer comparable vehicle performance from a smaller engine. These smaller displacement engines, often with fewer cylinders, run in a more efficient region of the engine’s speed and load map during normal operation owing to lower throttling and frictional losses. On the other hand, boosted engines are more prone to knocking owing to the higher density air/fuel charge and therefore tend to be tuned with a lower compression ratio (CR) than modern naturally aspirated engines with gasoline direct injection. The result is a lower peak efficiency for downsized/boosted engines than that of a naturally aspirated engine, but more time spent operating in the higher efficiency region.
Initially, the downsized/boosted engine offerings were largely based on the suite of technologies applied to already existing engine platforms. Manufacturers have further improved upon the basic concept through optimized engine architectural design and technologies. For instance, the bore/stroke ratio has been optimized for downsized/boosted engines. The first downsized/boosted engines were designed like older naturally aspirated engines, as square or over-square (bore size greater than or equal to stroke dimension), which, for naturally aspirated engines, allows for improved breathing (larger valve sizes) and revving capability to generate power at higher engine speeds. Purpose-designed downsized/boosted engines, on the other hand, tend to be under square (bore less than stroke) similar to diesels, enabling a more compact package with greater structural rigidity under the higher pressure operating conditions of turbocharged engines. Lowering the bore/stroke ratio has several additional benefits for downsized/boosted engines. It yields a lower surface-to-volume ratio in the combustion chamber and therefore improves thermal efficiency via reduced heat losses. A smaller bore is less prone to knocking—the ultimate constraint on boosted engines—owing to the shorter flame travel distance. Higher piston speeds can enhance charge turbulence and combustion speeds. Furthermore, the lower operating speeds of downsized/boosted engines reduce the frictional penalty associated with a longer stroke. This same engine design trend is observed in newer naturally aspirated 4-cylinder engines that focus on efficiency, including Atkinson and hybrid applications. Reduced displacement engines may benefit from reduction in cylinder count. As an engine moves toward a lower displacement on the same configuration (e.g., 2.0 L to 1.5 L 4-cylinder), the mechanical friction does not necessarily scale proportionately, and friction mean effective pressure can become a higher percentage of total work on the smaller engine. There are also efficiency losses from the individual cylinder displacement getting smaller (with approximately 500 cc being optimum). To counter these effects and better address the needs for smaller engines, a number of 3-cylinder engines are being introduced in displacements up to 1.5 L, such as in the 2020 Ford Escape.
4.1.3 2025–2035 Downsized/Boosted ICE Pathways
The 2025–2035 period will see further opportunities to improve the efficiency of downsized/boosted engines. Technology evaluations presented in the 2015 NRC report and previous National Highway Traffic Safety Administration (NHTSA) and U.S. Environmental Protection Agency (EPA) studies focused primarily on additional engine downsizing opportunities enabled through higher engine operating pressures (and torque) utilizing exhaust
gas recirculation (EGR) to control knock. The improvements evaluated were two technology bundles that further downsized a baseline engine beyond the Level 1 turbocharging system described above that is likely to be common in the 2025 fleet:
- Level 2: 24 bar brake mean effective pressure (BMEP)/50% downsize utilizing variable geometry turbocharger with and without cooled EGR.
- Level 3: 27 bar BMEP/56% downsize utilizing two-stage turbocharging with low and high pressure cooled EGR.
Concerns for implementations of Level 2 and Level 3 downsized/boosted engines discussed in the NRC and NHTSA/EPA evaluations were the ability of EGR to control knock at full load and thereby enable BMEP levels higher than 25 bar, and low-speed preignition, especially on U.S. conventional fuel, which is relatively low octane. These remain significant issues for implementation of highly downsized engines. Furthermore, the dual loop EGR system with supporting two-stage boosting as described in Level 3 is extremely complex and expensive. The resulting reductions in fuel consumption would be limited since they derive primarily from incremental pumping loss reductions and are possibly offset by CR reduction owing to the concerns noted above. An extremely downsized engine operating at very high BMEP levels will be forced to retard combustion to avoid knock and to enrich the air-to-fuel ratio to protect hardware from excessive exhaust gas temperatures at high loads, which will increase emissions.
The benefits of further downsizing, as well as the corresponding constraints, depend largely on the octane level of the dominant fuel in use. In the United States, regular fuel has a research octane number (RON) of 91, also reported at the pump as 87 anti-knock index. Automakers have been proposing for some time to increase the octane level of regular fuel in the United States, which could be achieved via the ongoing increase in ethanol blend levels associated with the Renewable Fuel Standard. U.S. consumers have historically been unwilling to comply with premium fuel requirements, so that is not a viable option. An increase in nominal octane rating of U.S. fuel similar to that in Europe (95 RON) might allow for an increase of approximately 1 CR, which is a common adjustment between otherwise similar North American and European engine offerings. That might translate to an approximate 2% efficiency opportunity (NRC, 2015, Fig 2.12). However, those benefits would largely only apply to new models and could not be design implemented until the fuel is widely available. Additionally, even in Europe where higher octane is standard, engine developments do not indicate a trend toward aggressive further downsizing. This likely stems from a shift to emphasize real-world driving fuel economy and emissions, and test cycle performance on the new worldwide harmonized light-duty test procedure and real driving emissions cycles, which are more heavily loaded. Since there appears to be no activity to change U.S. octane levels going forward, the technology look-ahead in this report will concentrate on the current EPA Tier 3 fuel with 91 RON and low sulfur.
While there does not appear to be a trend toward more aggressive engine downsizing, there have been significant improvements made to the engine offerings in this category. Ongoing evolutionary developments in boosting, fuel delivery systems, and combustion control have allowed for better knock avoidance and improved efficiency. In addition to the basic engine architectural optimizations described above, manufacturers have incorporated numerous features to lower engine friction, such as variable capacity oil pumps and piston/bore coatings. Most new gasoline turbocharged direct injection (GTDI) engines incorporate exhaust manifolds that are cast integrally with the cylinder head and can therefore be cooled. In order to reduce friction as well as enable variable lift technologies and cylinder deactivation, valve train architectures have migrated from direct acting mechanical bucket type (low cost, high-rev capable) to roller finger follower type. Numerous engine entries now use so-called dual fuel injection systems employing a combination of port and direct injection. These systems offer combustion advantages and lower cold start particulate matter emissions in the face of future stringent particulate matter emissions standards.
To evaluate the potential for further improvements to downsized/turbocharged engines in 2025–2035, the numerous newer engine offerings in this category were canvassed along with the technologies and design approaches being applied to them (see below). The fundamentals behind the technologies and how they might combine going forward are discussed. A recent EPA benchmarking evaluation of a 2016 Honda 1.5 L L15B7 GTDI engine is an example of a downsized/boosted engine that showed significant improvement over previously benchmarked engines of this type. The engine demonstrated brake thermal efficiency levels of 37%–38%, consistent
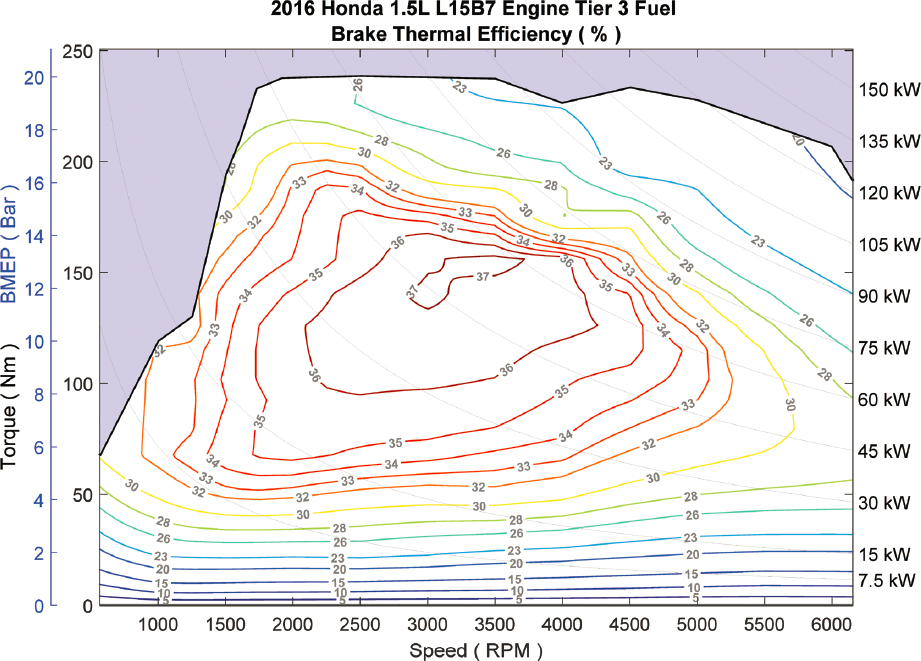
SOURCE: EPA (2020e).
with Honda’s published results with a relatively nominal set of technologies (Figure 4.1). As previously described, these engines operate in the more efficient areas of the engine speed/load map to derive their benefit. However, the absolute levels of best brake-specific fuel consumption (BSFC) can be worse than naturally aspirated engines, primarily owing to their lower CR to prevent knock. Level 1 downsized/boosted engines tend to have CRs in the 10.0–10.5:1 range, lower than those in modern naturally aspirated engines with gasoline direct injection, which are typically at least 12:1. Based on data from Heywood (1988), this sort of CR gap could account for roughly a 3% reduction in BSFC (Heywood, 1988; NRC, 2015). Therefore, the greatest improvement opportunity for downsized/boosted engines will come from improvements in thermal efficiency as opposed to further downsizing at extremely high load operation, with CR as an area of focus.
Low-pressure loop-cooled exhaust gas recirculation (LP-EGR) has also been studied extensively as a technology with the ability to enhance the efficiency of a GTDI engine in numerous ways. EGR lowers peak combustion temperatures, thereby lowering heat losses to the coolant. It also improves thermal efficiency by increasing the specific heat ratio of the working fluid, less effectively than lean operation, but without the same emission constraints. Cooled EGR can also serve as an effective knock mitigant, potentially enabling a higher CR. Last, it can provide some incremental pumping loss improvement in lightly loaded conditions. LP-EGR systems place higher demands on the range of authority of the boosting system and initially required costly two-stage turbochargers. However, the recent development of variable nozzle type turbochargers for gasoline applications offers a more cost effective solution.
A 2018 EPA study (Conway et al., 2018) investigated the effects of LP-EGR on a 1.6 L GTDI engine to determine whether cooled EGR alone could enable an increase in CR from the nominal 10.5:1 up to 12.0:1. This bench-based study met the additional boosting requirements with a surrogate secondary device (electric supercharger)
and increased ignition system energy to ignite the more dilute mixtures. In this case, under idealized boosting conditions and without accounting for the incremental energy to power the supercharger, the LP-EGR improved BSFC roughly 4.5% over much of the speed-load map and was especially effective at higher loads owing to knock mitigation. This result is consistent with other studies showing that cooled EGR can offer BSFC improvements of at least 3%.
Beyond LP-EGR as a technology to improve efficiency of GTDI engines, Stuhldreher and colleagues (2018) identify and describe several technologies for boosted engines, as illustrated in Figure 4.2.
Conway et al. (2018) also examined whether a 1.6 L GTDI engine could effectively utilize a 12:1 CR leveraging the knock mitigation benefits of EGR alone. The results showed the expected benefits of higher CR at lighter loads including most fuel economy drive cycles, but the study concluded that the trade-off losses in BSFC were
NOTE: SPCCI = Spark Controlled Compression Ignition; TAR = Technical Assessment Report; VGT = Variable-geometry turbochargers; VNT = variable-nozzle turbines.
SOURCE: Republished with permission of SAE International, from Stuhldreher et al., 2018, Benchmarking a 2016 Honda Civic 1.5-Liter L15B7 turbocharged engine and evaluating the future efficiency potential of turbocharged engines, SAE International Journal of Engines 11(6); permission conveyed through Copyright Clearance Center, Inc.
TABLE 4.1 Examples of Advanced Downsized, Boosted Engine Technologies Available in the MY 2020 Fleet
| Manufacturer/Engine Design | Technology Approach | Models Incorporating Technology |
|---|---|---|
| Audi 2.0 L TFSI | Miller-like cycle enabled by an extremely short intake cam duration with intake phase and two position lift control (using both early and late intake valve control depending on engine operating conditions) and dual fuel (port and direct injection). | Audi TT, TT S, S1, S3, A3, A4, A5, A6, Q2, Q3, Q5; SEAT León Cupra, Alhambra, Ateca, Cupra Ateca; Škoda Superb, Kodiaq; Volkswagen Golf GTi, Polo GTi, T-Roc, Atlas, Passat, Arteon, CC, Beetle, Tiguan, Sharan. |
| Nissan 2.0 L VC-Turbo | Fully variable CR engine (ranging from 8.0–14.0:1) that also includes a “wide range” turbocharger with electric waste gate for boost control capability, electric control of intake cam phaser, and dual port and direct injection. | INFINITI QX50 crossover, Altima SR and Platinum front-wheel drive grades. |
| Volkswagen 1.5 L TSI evo (96 KW version) | Process based on Miller cycle with 12.5:1 geometric CR, in which an electrically variable geometry turbocharger provides the expanded boost requirements of this approach. The engine also uses a higher pressure direct injection fuel system (350 bar) and employs cylinder deactivation. | Golf and Golf Variant in Comfortline, Highline, and SOUND specifications in Europe. Not currently available in the United States. |
NOTE: TFSI = turbo fuel stratified injection; TSI = turbocharged stratified injected; VC = variable compression.
SOURCE: Committee generated using information from Green Car Congress (2017), Lisle (2019), and Sessions (2018).
significant and unacceptable at higher loads. Therefore, the paper recommended further study of the potential for higher CR employing Miller cycle operation. The multiple engine offerings now in the market and considerable research activity utilizing this concept suggest that industry has reached the same conclusion.
The Miller cycle increases geometric CR to take advantage of the efficiency benefits of increased expansion while limiting compression (and knock). This is accomplished via adjustments to the timing of intake valve closing (typically late but can also be early). Manufacturers and engine developers are working on methods to aggressively leverage the benefits of the Miller cycle by using various complementary engine technologies to augment or manage trade-offs. Some of those technologies are listed in Table 4.1.
In summary, applying the Miller cycle concept in various ways to improve thermal efficiency of downsized/boosted engines seems to be a significant focus going forward into 2025–2035. The resulting benefits and corresponding costs will depend on the extent of technologies incorporated and the system-level effectiveness. Those enabling technologies already included in various applications are electric intake cam phasing, variable intake lift control, variable geometry turbocharging, cooled EGR, ignition and fuel system enhancements (also for particulate control), and variable CR. Because the Miller cycle can impose some constraints on performance, these implementations to date have occurred on engines of somewhat higher displacements (2.0 L) or, in the case of the Volkswagen (VW) 1.5 L EVO, on a power de-rated version in comparison to the non-Miller variant.
A focus on thermal efficiency and real-world emissions will constrain more aggressive engine downsizing. However, several technology approaches are being applied to further reduce throttling losses and allow these already downsized engines to operate in more efficient regions of the speed-load map. These include variable intake valve lift technologies (both two position and fully variable), cylinder deactivation, transmissions with additional discrete gear steps, and continuously variable transmissions (CVT). For example, Hyundai has recently introduced an all-new 1.5 L GTDI engine that features a first ever continuously variable valve duration technology. Cylinder deactivation can yield improved fuel economy in this engine category on 4-cylinder variants, and even the aforementioned Ford Dragon 1.5 L 3-cylinder engine deactivates 1 cylinder under certain conditions to operate on 2 cylinders. Additionally, the development of transmissions with additional discrete gear steps (8, 9, 10 speeds) or CVT can also enable the engine to operate closer to its peak efficiency regions; for instance, the subject Honda 1.5 L L15B7 is mated to a CVT.
Downsized/boosted engines utilizing the added expansion ratio of Miller cycle (geometric CR of 12:1 or greater) combined with aggressive use of cooled EGR and the necessary supporting technologies as listed have the potential to achieve brake thermal efficiency levels of 40% while meeting all other driving and emissions requirements (see Table 4.2). Much of the current development activity to further improve the efficiency of these
TABLE 4.2 Six Example Miller Cycle Packages for Downsized/Boosted ICE Vehicles in MY 2025–2035, with Associated Technology Cost Projections and Effectiveness Values
| Baseline Engine | Example FE Technology Advance Above Baseline | Technology Costa | Technology Effectiveness (Fuel Consumption Reduction Relative to Baseline Engine for the Technology as Part of the Described Bundle) | ||
|---|---|---|---|---|---|
| MY 2025 | MY 2030 | MY 2035 | |||
|
Example: Honda L15B7 1.5 L GTDI
|
Cooled Low-Pressure EGR (CEGR1) | $250 | $230 | $230 | 2%–3% |
| Variable Geometry Turbocharging (VGT) | $55 | $50 | $50 | None, enabler for technology bundle | |
| Miller Cycle Implementation including 12:1 CRb | $0 w/ enabling technology present | $0 w/ enabling technology present | $0 w/ enabling technology present | 2%–3% | |
|
Example: Hyundai-Kia Smartstream 1.5 L Turbo GDI Engine
|
|||||
| VGT | $55 | $50 | $50 | None, enabler for technology bundle | |
| Miller Cycleb | $0 w/ enabling technology present | $0 w/ enabling technology present | $0 w/ enabling technology present | 2%–3% | |
|
Example: VW EA211 EVO 1.5 L GTDI Engine
|
|||||
| CEGR1 | $250 | $230 | $230 | 2%–3% | |
| Variable Valve Lift (VVL) | $210 | $205 | $200 | 1%–2% | |
|
Example: Ford 1.5 L 3-Cylinder GTDI Engine
|
VVLc | $125 | $125 | $125 | 1%–2% |
| CEGR1 | $250 | $230 | $230 | 2%–3% | |
| Miller Cycleb | $0 w/ enabling technology present | $0 w/ enabling technology present | $0 w/ enabling technology present | 2%–3% | |
Example: Audi 2.0 L TFSI GTDI Engine
|
|||||
| CEGR1 | $250 | $230 | $230 | 2%–3% | |
| VGT | $55 | $50 | $50 | None, enabler for technology bundle | |
Example: Nissan 2.0 L VC-Turbo Engine (Variable Compression Ratio)
|
|||||
| CEGR1 | $250 | $230 | $230 | 2%–3% | |
| VGT | $55 | $50 | $50 | None, enabler for technology bundle | |
aAll costs are for I4 engines in 2018$; projections use learning curves from NHTSA/EPA (2020); costs rounded to the nearest $5.
bMiller cycle engine with 12:1 CR is covered in the associated technology packages; cost is function of the building blocks. NHTSA/EPA (2020); Stuhldreher et al. (2018).
cCosts adjusted for deletion of DEAC.
NOTE: The baseline engines represent advanced downsized/boosted engines in 2020, which may represent typical downsized/boosted engines in 2025. The example fuel economy technology advancement above the baseline illustrates some “next step” technologies that could be implemented in 2025–2035. Technology cost and effectiveness are for the individual added technologies, as they contribute to the efficiency of the technology bundle.
engines and manage their challenges involves leveraging the capabilities of electrified assistance via hybridization of various levels, which is discussed in Section 4.4.
FINDING 4.1: Downsized/boosted engines continue to increase market penetration and, along with improved efficiency naturally aspirated engines, have become the common engine types in 2020, as previously predicted for this time period. Manufacturers have also further optimized new engine designs to complement these technology trends, including the emergence of 3-cylinder engines.
FINDING 4.2: Efficiency improvements to current downsized/boosted engines through the application of additional technology is possible and ongoing. Many of the technologies that will contribute to the next generation of downsized/boosted engines are already present in various forms in the 2020 fleet. These include, for example, the application of Miller cycle (or Atkinson cycle in the naturally aspirated case) to allow for higher expansion ratios and therefore greater thermal efficiency, cooled EGR, friction reduction technologies, and the application of cylinder deactivation to already downsized 4- and even 3-cylinder engines.
FINDING 4.3: By 2025, non-electrified internal combustion engines could implement technologies such as currently represented in 2020 by the advanced downsized/boosted engines described in Tables 4.1 and 4.2, which would offer improvements in efficiency of up to 5% over a current baseline downsized/boosted engine. For the period of 2025–2035, those same non-electrified engines could deploy additional technologies as outlined in Table 4.2 for a potential further efficiency improvement of up to 5%. Improvements beyond these levels for 2025–2035 will likely require some degree of hybridization.
4.2 NATURALLY ASPIRATED ICE PATHWAY
Naturally aspirated ICEs do not employ any sort of air pressure charging to assist performance. The multiple approaches of synergizing these engines with electric hybridization will be covered under that dedicated pathway (Section 4.4). In the current U.S. market, this type of engine typically falls into two very different vehicle and customer usage categories, which will be discussed separately to better assess and prioritize applicable FE technologies. The first are larger displacement engines, that is, V8s, that also need to provide performance—load carrying, towing, and so on—and fall primarily in the full-size sport utility vehicle (SUV) and pickup truck vehicle classes. The second category comprises I4 engines with significant fuel economy technology, which are positioned as an alternative to downsized/boosted engine systems.
Larger displacement naturally aspirated engines, mostly V8s with 5.0 L–5.7 L displacement, continue to play a significant role in the U.S. market, primarily in the large SUV and pickup truck vehicle classes. Typically, these engines are optional offerings to provide additional performance in the vehicles, which are utilized for load carrying, towing, and so on. Engines in this category are therefore oversized and highly throttled on more lightly loaded duty cycles, including fuel economy test cycles. Compared to other engine types, they will derive greater benefit from technologies that reduce pumping losses, such as cylinder deactivation. Offerings from General Motors (GM) and Fiat Chrysler are 2 valve per cylinder overhead valve (single cam in block) configurations, which allow for cost effective application of cylinder deactivation and also employ dual equal camshaft phasing for fuel efficiency. GM has also added “Dynamic Skip Fire,” a control strategy developed by Tula Technologies that further expands the capability and benefits of cylinder deactivation. The GM 5.3 L engine has also incorporated gasoline direct injection and stop-start, and the CR with direct injection is 11.0:1. Ford’s 5.0 L engine in the F150 is a 32 V dual overhead camshaft configuration, and utilizes dual cam phasing and dual fuel injection (direct and port fuel injection points) with stop start. Fiat Chrysler offers a 48 V mild hybrid option as their Ram pickup truck fuel economy leader. All of these vehicles are now also migrating 8-, 9-, and 10-speed transmissions into their offerings. Looking to the future, these large, performance-oriented V8 engines will likely be limited in volume, and/or hybridized, or replaced by smaller, boosted alternatives to achieve more power with less displacement.
In the midsize car and crossover segments, some manufacturers continue to offer larger naturally aspirated 4-cylinder engines in the 2.5 L displacement range. Several of the best fuel economy performing MY 2020 midsize and crossover vehicles identified in Chapter 3 (Toyota Camry, Nissan Altima, Toyota RAV4) fall into this category.
Engine technologies commonly utilized in this pathway include dual variable cam phasing, homogeneous gasoline direct injection, and stop-start. In this pathway, gasoline direct injection is primarily used to improve thermal efficiency via increased CR, and there are examples in the U.S. market of up to 13:1 CR on 91 RON fuel. The engine architectural benefits described in the downsized/boosted pathway (e.g., lower bore/stroke; see Section 4.1.3) offer similar efficiency benefits in naturally aspirated engines. Being sized to meet peak performance requirements, naturally aspirated engines are more throttled than downsized/boosted engines on lighter duty test cycles and can therefore derive greater benefit from technologies that reduce pumping loss. There are various applications utilizing cylinder deactivation, cam profile switching, and variable valve lift in this category. The Toyota 2.5 L Toyota New Global Architecture engine used in the MY 2020 Camry and RAV4 is one example of a naturally aspirated large I4 that has achieved high levels of efficiency (Figure 4.3 and Table 4.3). With a low bore/stroke ratio and corresponding high tumble combustion system with direct and port fuel injection, the engine achieves a CR of 13:1 (14:1 in Atkinson cycle form for hybrid applications). It reaches a peak thermal efficiency of 40% by using EGR (cooled internal to the cylinder head) along with a suite of actions to lower friction.
Similar to downsized/boosted systems, transmission technology can be complementary in naturally aspirated powertrains and allow the engine to operate closer to peak efficiency. The MY 2020 Toyota Camry and Nissan Altima referenced previously use 8-speed and CVT transmissions, respectively. Naturally aspirated engines will be constrained in comparison to boosted engines in both specific performance potential and their ability to incorporate the benefits of dilute combustion via EGR. Many strong hybrid powertrains currently use highly efficient naturally aspirated engines utilizing the Atkinson cycle made possible by hybrid electric synergies described in Section 4.5.2. Implementation will likely continue as these engines are lower in cost than boosted variants so can help defray hybridization cost. Therefore, as hybrid penetration grows, so will these engine types.
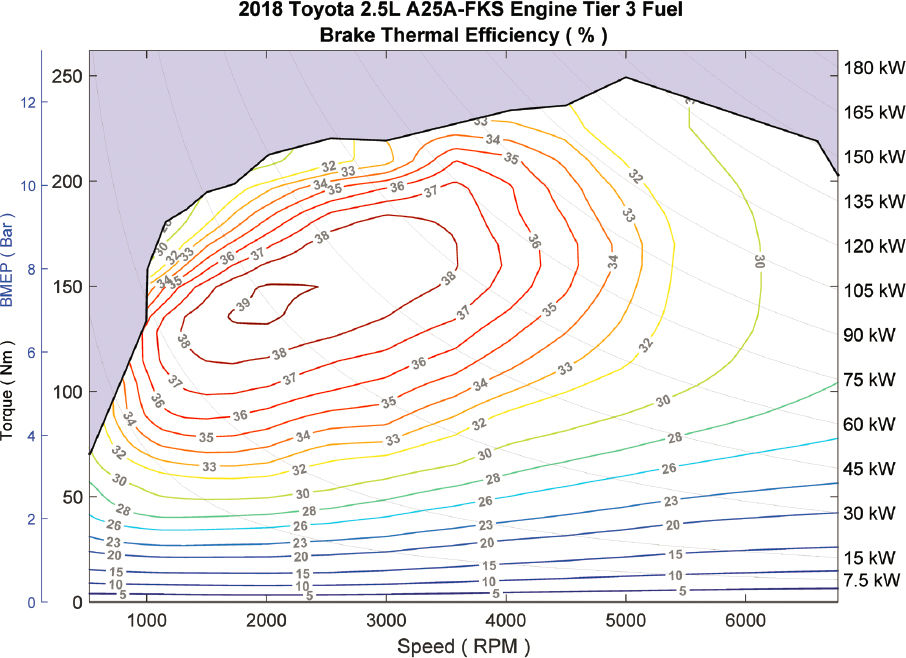
SOURCE: EPA (2020b).
TABLE 4.3 One Example Package for Naturally Aspirated, Unhybridized ICE Vehicles in MY 2025–2035, with Associated Technology Cost Projections and Effectiveness Values
| Baseline Engine | Example FE Technology Advance Above Baseline | Technology Costa | Technology Effectiveness (Fuel Consumption Reduction for the Technology as Part of the Bundle) | ||
|---|---|---|---|---|---|
| MY 2025 | MY 2030 | MY 2035 | |||
Example: Toyota 2.5 L New Global Architecture Naturally Aspirated Engine
|
Cylinder Deactivation (DEAC) | $110 | $105 | $100 | 2%–4% |
a All costs for I4 engine in 2018$; costs reduced by 1%/year from MY 2020 value reported in NRC (2015) and rounded to the nearest $5.
NOTE: The baseline engine represents an advanced naturally aspirated, unhybridized engine in 2020, which may represent typical naturally aspirated engines in 2025. The example fuel economy technology advancement above the baseline illustrates a “next step” technology that could be implemented in 2025–2035. Technology cost and effectiveness are for the individual added technologies above the baseline engine, as they contribute to the efficiency of the technology package.
4.3 COMPRESSION IGNITION DIESEL ENGINES
No fuel economy assessment of ICE technologies would be complete without consideration of the diesel engine, given that it has the highest thermodynamic cycle efficiency of any light-duty engine type (NRC, 2015). The 2015 NRC report dedicated an entire chapter to diesel technologies, including cost and effectiveness projections relative to spark ignition engines. The technical content in that report is largely still applicable—including the fundamentals behind diesel’s fuel efficiency advantage, the potential of future diesel technologies, and perhaps most importantly the challenges and cost associated with meeting Tier 3 criteria emission standards. However, since the time of that publication, the penetration outlook for diesel engines, especially in the U.S. market, has been affected by several very significant developments. This section provides a brief review of the technology, a qualitative update on the cost and effectiveness relative to current and future spark ignition engines, and rationale for why diesel engines will not be included as a significant contributor to the efficiency of the LDV fleet in 2025–2035.
The diesel engine’s efficiency advantage over a spark ignition gasoline engine stems from three factors:
- The higher CR of compression ignition engines relative to spark ignition engines, which as previously discussed provides a thermodynamic expansion advantage;
- The operation of diesel engines on an overall lean mixture (excess air), which is more thermodynamically efficient based on a higher ratio of specific heats; and
- The ability, based on that lean operation, to control torque with the amount of fuel injected and therefore operate without throttling and corresponding losses.
In addition, diesel fuel has a higher energy content than gasoline, giving another roughly 11% fuel economy advantage incremental to gasoline when measured on a volumetric basis (miles/gallon). At the same time, however, diesel fuel has a higher carbon density so has greater carbon dioxide (CO2) emissions per gallon of fuel burned.
Thus, shifting the regulatory focus from fuel consumption to greenhouse gas (GHG) emissions would mitigate some of the advantage of the diesel pathway.
The technical challenge for the diesel engine is the ability to meet stringent criteria emission standards, especially nitrogen oxides (NOx) and particulates, and to manage the cost associated with that challenge while maintaining a compelling fuel efficiency advantage versus improving spark ignition engines. This is particularly true as it relates to California Low-Emission Vehicle (LEV) III and U.S. Federal Tier 3 criteria emissions standards. Lean air-to-fuel ratio operation precludes the use of the three-way catalysts to control tailpipe NOx. The technologies already deployed on modern diesel engines to control emissions at the engine feed gas level include the following: higher fuel injection pressures (in some cases with in-cylinder combustion pressure sensing), high levels of cooled EGR to limit NOx forming peak combustion temperatures, and two-stage and variable turbine geometry (VTG) boosting systems to maintain performance while supplying the required EGR with the associated cooling systems. In the emissions aftertreatment system, technology options include diesel particulate filter, diesel oxidation catalysts for carbon monoxide and hydrocarbons, NOx storage catalyst and selective catalytic reduction (requiring the consumer to maintain an additive, typically urea), and the corresponding onboard diagnostic system and sensor set. While used individually or in combinations in 2020, in 2025–2035 virtually all of these countermeasures would likely be necessary to achieve the aforementioned U.S. standards. Another strategy to address criteria emissions is to actively limit the fuel economy and performance advantage of the diesel engine in order to control emissions, especially off-cycle emissions.
For modeling purposes, NHTSA has characterized the potential of future improvements in diesel efficiency as a single technology bundle labeled “Advanced Diesel” (EPA/NHTSA, 2012), which includes benefits from engine downsizing and downspeeding, friction reduction, and combustion improvements. Downsizing with corresponding high BMEP operation is not likely to occur owing to real-world and off-cycle emissions concerns. Downspeeding, which per the 2015 NRC report requires additional transmission ratio span, is likely still viable given the penetration of 8-, 9-, and 10-speed transmissions. Friction reduction is also credible given that diesel CRs are trending downward as a result of increasingly stringent emissions standards. Combustion improvements, such as low temperature combustion concepts, could potentially be more emissions driven. In the meantime, while the cost of diesel technology will remain relatively high, the fuel efficiency advantage relative to spark ignition engines will erode as those engines incorporate technologies to approach diesel-like efficiencies. As outlined in Section 4.6 below, these include reduced throttling technologies such as downsizing with boosting, higher CR with direct fuel injection, Miller/Atkinson cycle application, and dilute mixtures using EGR in lieu of lean. Combined with the current and likely future higher price of diesel fuel relative to gasoline, a consumer payback equation based on fuel cost savings will be difficult.
By far the biggest impact on diesel as a future technology pathway has come from the aftermath of a U.S. diesel emissions cheating scandal (EPA, 2015), which shifted automaker priorities, negatively affected consumer views of diesel, and virtually eliminated the light-duty U.S. market. Another diesel emissions scandal recently came to light (EPA, 2020c) and may have related consequences. In addition, the broader scrutiny brought to diesel worldwide with regard to off-cycle and real-world emission effects both at a policy maker and consumer level has led to significant diesel share erosion, even in Europe where diesel represented roughly 50% of light-duty markets in some countries. This loss of diesel contribution has had a negative effect on the EU CO2 compliance progress and driven incremental recovery actions. EPA and NHTSA did not include diesel in their possible cost-effective compliance path for the original 2017–2025 corporate average fuel economy (CAFE) rule for 2025 (EPA/NHTSA, 2012) even prior to these events, so the 2025 starting point for this study is not affected.
Despite their limited expected penetration in the U.S. light-duty fleet, diesel engines will continue to play a significant role in the U.S. commercial truck segment. They also still represent a large global share of engines such that the technologies required to meet the aforementioned challenges will continue to be developed. Diesel can offer high fuel efficiency at heavy load conditions (e.g., towing) relative to other technologies, along with compelling performance. These properties could make them attractive into the future to some customers of full-size pickup trucks and large SUVs focused on those attributes and willing to pay for them. However, consistent with feedback from manufacturers, diesel will be considered a specialty niche and will not be developed as a significant pathway to U.S. fuel economy improvement for the purposes of this 2025–2035 report.
4.4 TRANSMISSION PATHWAY
Manufacturers have continued to develop automatic transmissions and CVTs for the U.S. market to improve their efficiency and customer performance as well as to complement the technology trends of ICEs described in this chapter. Manual transmissions have all but left the U.S. light-duty market except in sports performance categories and therefore will not be discussed. The 2015 NRC report provides a still applicable description of transmission fundamentals and a comparison of the various types of automatic transmissions, along with the fuel efficiency elements by which they can provide improvements. In fact, the findings from that report with respect to transmissions are still largely applicable today. Herein, the focus will be on developments since 2015, including updates on previously forecasted trends and a look to the future for 2025–2035.
As of MY 2016, 54.9% of the U.S. market comprised 6-speed planetary automatics, which at that point had undergone about 10 years of refinement since their first widespread deployment in the mid-2000s (EPA, 2020a). Evolutionary improvements to planetary automatic transmissions between their introduction and current implementations included internal efficiency actions, such as variable displacement pumps, lower friction fluids, clutch materials, bearings, and seals. Improved automatic transmissions controls can allow for more fuel efficient aggressive transmission shift schedules and torque convertor lock-up strategies. However, they must be managed to avoid customer concerns with drivability; performance; and noise, vibration, and harshness (NVH). The trend toward downsized/boosted engines with fewer cylinders and consequent higher torque amplitudes at lower frequencies present additional potential NVH concerns that limit lugging and/or require enhanced torque convertor damping.
Eight-, nine-, and ten-speed planetary automatic transmissions have continued a steady rollout in replacement of six-speeds and, as of MY 2019, have achieved a U.S. market penetration of 44% (EPA, 2020a). As stated in the 2015 NRC report, upgrading to those higher transmission speeds offers fuel economy improvements in the 2%–3% range, depending on the maturity of the 6-speed (or in some cases > 6 speeds) in the reference case (NRC, 2015). (It should be noted, however, that NHTSA provided higher estimates at that time.) In addition to providing high-value fuel economy improvement based on the understood cost, an increase in the number of transmission speeds can also be a marketable customer feature. The additional ratio span with the potential for lower “launch” gears can be synergistic with the trend toward engine downsizing to support low-speed performance (turbo lag zones). Furthermore, with more steps, the planetary automatics can approach the ability of a CVT to allow the engine to operate in regions of best fuel consumption. However, the incorporation of engine technologies that greatly expand the speed-load regions of low brake specific fuel consumption can minimize the benefits of higher transmission speeds. Many research efforts aim to develop new transmission architectures to deliver these benefits and maintain or improve the transmission spin losses, while incorporating additional gears, clutches, and so on.
The penetration of CVT transmissions is also increasing in the United States, primarily owing to implementation in high-volume offerings from Japanese manufacturers (e.g., Nissan, Honda, Toyota, and Subaru). Additionally, Toyota and Ford Powersplit (PS) hybrid models utilize CVT-type technology. As described in the 2015 NRC report, CVTs derive their fuel economy benefit by allowing the engine to operate at its most efficient speed and load for a given power demand; however, they have higher losses than a conventional automatic. To decrease these losses, the CVTs in today’s market have taken several actions. Since major power losses occur with the hydraulic pump and belt, the pumps can be variable displacement or even an on-demand electric pump employed by Toyota to enable stop-start functionality. The Toyota CVT has incorporated a launch gear to initially accelerate the vehicle and provide an overall increase in ratio span while reducing the CVT pulley ratio. CVTs have historically experienced customer acceptance concerns associated with the NVH associated with their typically higher engine speeds and “droning” sound as well as absence of traditional shifting sensations. Manufacturers have addressed these concerns with control strategies that program in fixed-ratio set points and even offer paddle shifters to provide U.S. customers the aesthetic of a traditional automatic. CVTs will be particularly effective in a powertrain system using a high efficiency or Atkinson cycle naturally aspirated engine of higher displacement by keeping the engine in its most efficient operating points, reducing the benefit of additional engine technologies such as cylinder deactivation.
Dual clutch transmissions (DCTs) have one clutch for the odd gears and one for the even gears and can operate manually or automatically, depending on configuration. Having two clutches allows the vehicle to maintain torque from engine to the wheels while the next gear is being set up. DCTs have a higher fuel efficiency potential relative to a planetary automatic owing to the lower spin losses of their layshaft (manual transmission) architecture and, in the case of a dry clutch DCT, no hydraulic losses. Despite its avoidance of hydraulic losses, dry clutch is torque limited and
more difficult to manage. On the other hand, wet clutch versions require a pump and, if needing excessive clutch slip to address customer concerns, may achieve less than the theoretical FE. Additionally, while lower in cost on a teardown basis, the actual cost of sophisticated clutch and controls at relatively low volume make them cost more than a conventional clutch and controls. DCTs originally developed in Europe, where the transmission manufacturing infrastructure was based on manual transmissions and importantly so was the customer expectation. In the early to mid-2000s, EPA, NHTSA, and automakers thought DCTs would develop into a significant trend in the U.S. market. However, attempts by some automakers to introduce this technology to the U.S. market were met with significant customer acceptance issues—for instance, customers accustomed to a torque convertor-based automatic transmission performance seem to have concerns with a start-up clutch, mostly at lower speeds. Therefore, some automakers have since transitioned away from DCT, and other automakers scrapped introduction plans prior to launch. Even some European luxury brands that did not experience the same problems are moving back toward conventional automatics. Beyond the consumer concerns, the appeal of the DCT for fuel economy has also diminished. As described above, the planetary automatics evolving to 8-, 9-, and 10-speeds have improved so as to close the gap without the same level of risk. By 2020, DCTs are anticipated to make up only less than 5% of the U.S. market and are not expected to grow measurably. The 2015 NRC report recommended that NHTSA and EPA reflect this lowered expectation in their analyses.
In summary, automatic transmissions, most notably 8-, 9-, and 10-speed planetary systems have continued to expand in the U.S. market and offer fuel economy improvements of about 2–3%, incremental to an advanced 6-speed. Further improvements are possible but will likely be of diminishing value. The various transmission types will continue, as the differences between them do not indicate any clear winning technology, and they continue to become more similar in terms of fuel economy benefit and cost. Their fuel economy benefits can also be interdependent with engine technology, and therefore the engine and transmission must be viewed as a system. Historically, automatic transmissions have shown potential for customer dissatisfaction, and any push to improve their efficiency must be managed with this risk. Perhaps the most significant future trend in transmission development will be the integration of electrification. In addition to the PS CVT hybrid transmission, numerous parallel (P2) strong and mild hybrid configurations incorporate the electric motor into the transmission. There are also examples of hybrids utilizing planetary automatics, such as the Ford rear-wheel drive (RWD) 10-speed, and notably some utilizing DCTs, which is a potential pathway for those transmissions to grow.
FINDING 4.4: Transmission technology continues to play a role in improving fuel efficiency. The U.S. fleet is in the midst of a transition from advanced 6-speed planetary automatic transmissions to 8-, 9-, or 10-speeds, which will likely expand to much of the fleet while some manufacturers will continue to develop advanced continuously variable transmissions. Transmission contributions to vehicle level efficiency are highly interdependent with engine technology. While further gains from additional gear steps beyond 10-speed are not seen as likely, the future development of transmissions may well focus on the integration of electrification.
4.5 HYBRIDIZED POWERTRAIN PATHWAY
Hybrid powertrain systems are forms of electrified powertrains that contain ICEs and electrical machines and can operate on liquid fuel only or, for plug-in hybrid vehicles, with the added option of operating on electric energy charged from the power grid. The extent of electrification of the powertrain varies, as does the resulting capability for efficiency improvements. As described later in this section, the incorporation of electrification to liquid-fueled vehicles represents the greatest opportunity for improvements in fuel efficiency and reduction in CO2 emissions. Hybrid electric vehicles (HEVs) derive their primary benefit from the capability of the electrical machine, along with sufficient storage capacity of the battery, to capture and store energy under deceleration (regenerative braking). In addition, they can allow for reduced idling time and a more efficient and/or downsized ICE, taking advantage of the available electric motor propulsion assistance. Chapter 4 of the 2015 NRC report provided descriptions, terminology, architectural definitions, and a still applicable primer on how hybrid powertrains work. Table 4.4 gives a summary of levels of hybridization in LDVs, noting typical technologies, system voltage, and efficiency capabilities.
By far, the most fuel-efficient gasoline-only vehicles in the U.S. fleet are strong hybrids. There are offerings from numerous manufacturers in every segment under study. Despite wide availability of models, current sales volumes remain relatively low nationwide. The low sales can be attributed in part to the added cost to the manufacturer
TABLE 4.4 Description and Energy Improvement Aspects of Different Levels of Hybridization
| Hybridization Level | Illustrative Technology Description | System Voltage (V) | % Idling Reduced | % Brake Energy Recovered | % Fuel Consumption Reduction Relative to a Conventional Vehicle | Electric Assist or Electric Operation Capability? |
|---|---|---|---|---|---|---|
| Stop-Start | Robust starter Controls for customer comfort and NVH | 12 | ~100% | 0% | 2%–3%a | Assist? No. Operation? No. |
| Mild Hybrid, BISG architecture | BISG Motor, 10–15 kW 0.5–1.0 kWh battery Optimized ICE | 48 | 50%b | 6%–10%c | Assist? Yes. Operation? Some implementations allow short, low power driving on electric motor. | |
| Strong Hybrid | ≥ 1 motor, 30–90 kW Parallel P2, Powersplit, or Series architectures 1.0–.08 kWh battery Optimized ICE | 200–300 | 70%–80%b | ~20%–35%d | Assist? Yes. Operation? PS: In low load operation. P2: In low load operation. Series: Yes. | |
| PHEV | ≥ 1 motor, 60–100 kW Power- or energy-optimized battery, depending on EV range Charger for fueling with grid electricity Optimized ICE | 400 | 70%–80% | Varies by the ratio of miles traveled fueled with electricity or gasoline. Fueling with gasoline is similar efficiency to a hybrid; fueling with electricity is similar to a BEV. | Assist? Yes. Operation? Yes, supplemented with ICE drive in some applications. |
a As reported in EPA/NHTSA (2012), NRC (2015), and NHTSA/EPA (2020); relative to baseline engine.
c Relative to conventional vehicle.
d Relative to conventional vehicle of same model. Varies with hybrid architecture and vehicle class.
NOTE: BISG = belt integrated starter generator; PHEV = plug-in hybrid electric vehicle. Percent of idling reduced and brake energy recovered are illustrative, as the amount varies by hybrid implementation and under different use conditions.
associated with hybridization, particularly for strong hybrids. In the past, there has also been a strong correlation between hybrid sales and fuel prices, and fuel prices have been low relative to historic standards.
Strong hybrids represent the greatest potential to improve the fuel efficiency of gasoline-only powered vehicles. Even some of the 2020 vehicles that were previously mentioned as high performers in their base ICE form (Toyota Camry, RAV4, Ford Escape) offer strong hybrid options that further improve FE ratings by at least 33%. In seeking to improve vehicle efficiency, fuel economy, and GHG emissions, HEVs will have several advantages and disadvantages relative to conventional ICEs and BEVs/fuel cell electric vehicles (FCEVs). In using electrification to improve efficiency, hybrid powertrains currently have lower absolute cost relative to BEVs and FCEVs, but also a lower ultimate fuel efficiency or CO2 reduction potential. Hybrid powertrains require less battery energy capacity than BEVs or plug-in hybrid electric vehicles (PHEVs), and do not require a fuel cell and hydrogen storage system like FCEVs. Unlike BEVs and FCEVs, HEVs do not depend on enhancements in the electric or hydrogen fueling infrastructure and will not require any modification to existing consumer behavior. As the costs of batteries come down, BEVs will reduce in cost such that they become less expensive for the manufacturer to produce than HEVs. HEV potential in the market will depend on customer requirements and manufacturer responses to fuel economy regulations as applied to non-zero-emission vehicles.
4.5.1 Hybrid Architectures
This section will cover 48 V mild hybrid electric vehicles (MHEVs) and 200 V or greater strong hybrids as they pertain to the U.S. market. While both mild and strong hybrids appear in numerous configurations, there does not seem to be any ongoing trend toward intermediate voltage levels. Stop-start systems operating at 12 V (micro hybrid) have become common in ICE vehicles and will not be discussed in depth. However, some manufacturers
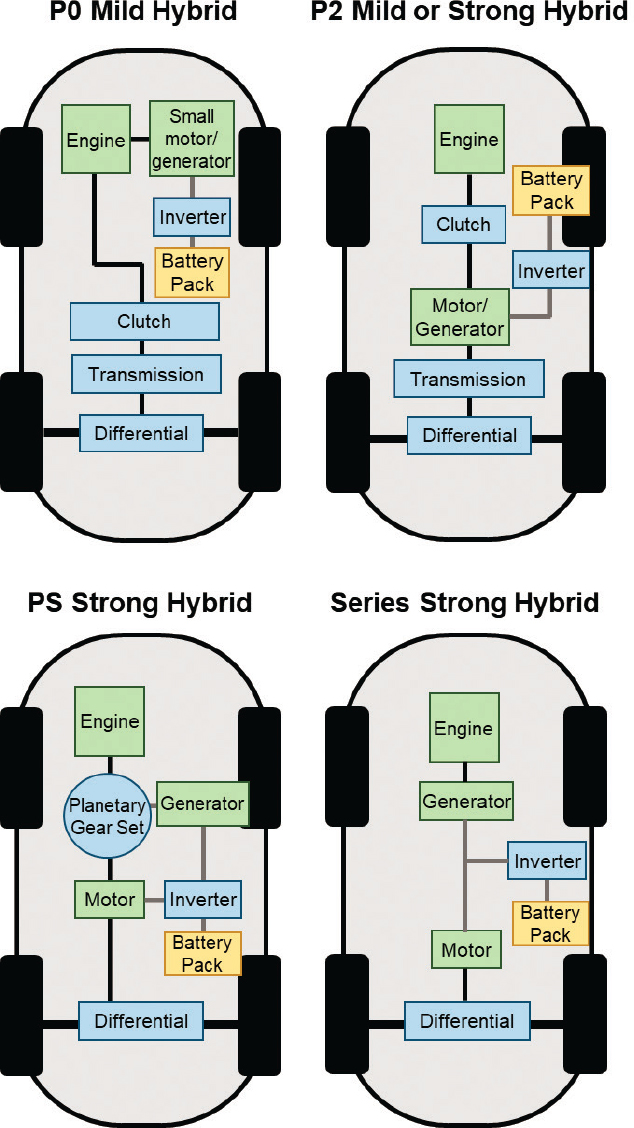
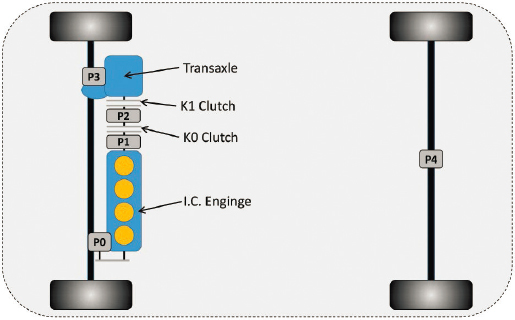
have shared customer satisfaction concerns with stop-start implementations, which can often be ameliorated by higher voltage electrical starting assistance provided by hybrids. Mild and strong hybrids contain a larger battery, electronics capable of operating above 12 V, and one or more electric machines, such as motors and generators, amongst other components required to utilize electric energy in storing braking energy and assisting or providing propulsion. Schematic diagrams of P0 mild hybrid, P2 mild or strong hybrid, PS strong hybrid, and series strong hybrid architectures are shown in Figure 4.4. The position of the electrical machine is often important to
SOURCE: Committee generated, adapted from Phillips (2018) and NRC (2015).
SOURCE: Lee et al. (2018).
the efficiency and performance aspects of the hybrid architecture, and is described using P0 for a belt-integrated electrical machine, P2 for a machine between the engine and the transmission, and P3 and P4 for machines associated with the front and rear axles respectively. P2, P3, and P4 machines are decoupled from the engine. A diagram of the P0–P4 locations of the electrical machine is shown in Figure 4.5.
4.5.1.1 48 V MHEV
Like all hybrids, the 48 V MHEV derives its benefit from the ability to regenerate braking energy, augment engine performance with electrical driving assistance, and enhance stop-start functionality. The 48 V MHEV can offer a significant improvement in fuel efficiency at a relatively low absolute cost compared to strong HEV or BEV and can also be fairly straightforward to implement, with most current versions using a belt driven starter-generator incorporated into the engine’s accessory drive. Along with their lower absolute costs than strong hybrids, 48 V MHEVs have relatively limited benefits. Since most applications to date use a belt-driven machine in a P0 configuration, the belt transfer capability limits the maximum motor and braking torque. The motors also have regeneration constraints at low speed. Additionally, all torque transferred between the motor and the wheels, whether driving or braking, is exposed to the ICE’s frictional losses. The realized benefits of 48 V MHEVs depend on the application, driving cycle, battery state of charge, and motor and battery sizing, among other factors. Analytical studies have shown that P0 configurations, such as a belt integrated starter generator (BISG) require a motor size of at least 10 kW and offer no further benefit above 20 kW, with FE savings in the 6%–10% range. The corresponding optimal battery sizing is in the 0.5–1.0 kWh range. Other layouts such as P2, in which the motor is mounted directly to the output side of the crankshaft, can provide greater FE savings than P0 configurations; however, these layouts have higher integration costs. The Mercedes-Benz CLK 450 is the only current U.S. model of this configuration with a 16 kW motor and 1 kWh battery capable of limited electric-only cruising. Other possible combination layouts have been studied and shown to offer even greater benefits. For example, a P0 + P4 layout with an additional motor at the rear axle can potentially double the fuel consumption savings, delivering > 10% reduction in fuel consumption by maximizing 48 V regenerative braking capability and also providing an electric all-wheel drive (AWD) function. However, this layout comes with the cost of the additional motor and added battery capacity requirement. The 48 V MHEV provides a sufficient degree of electrification to enable the additional ICE efficiency actions described in Section 4.2 of this report.
BISG 48 V MHEVs are, as of 2020, still fairly limited in offerings in the United States in comparison to strong hybrid models. It is a customer-chosen option on V6 and V8 Ram full-size pickups and is also available in models from Mercedes-Benz, Audi, and Volvo. There appears to be significant interest in 48 V MHEVs in the European market, particularly for premium models, as automakers attempt to quickly recover from the fleetwide CO2 deterioration resulting from erosion of the diesel market share and shift from sedans toward crossover utility
vehicles (CUVs)/SUVs. The MHEV is also effective when added to a diesel powertrain, which is a larger share in global markets. By taking advantage of the 48 V electrical architecture, manufacturers can incorporate additional customer features, such as improved comfort and driver assist technologies. Those companies extensively implementing 48 V in Europe will likely utilize the technology in their U.S. market, as is being seen in current models. When automakers report corporate electrification goals, the 48 V mild hybrid is often part of the percent of vehicles electrified in corporate messaging. Similar to stop-start systems, 48 V BISG hybridization could represent an evolutionary step in ICE powertrains because, while not capable of delivering the fuel efficiency benefit of strong hybridization, it can be “added-on” relatively simply and at lower cost.
4.5.1.2 Strong Hybrid
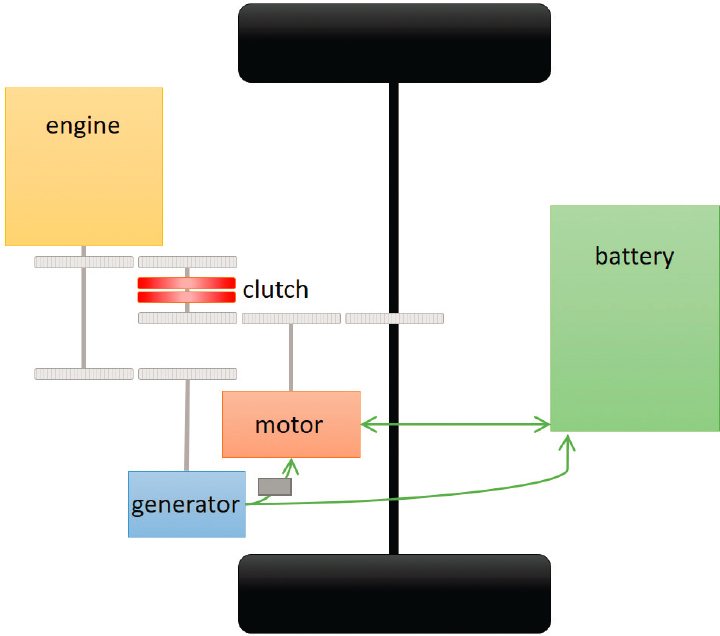
Strong hybrids use a larger motor/generator and battery at higher voltage levels than mild hybrids and, as a result, can achieve much greater levels of braking regeneration and engine support, often including some degree of electric-only driving. Strong hybrids are much more expensive to implement than mild hybrids but in turn provide a far greater fuel economy improvement (see Table 4.4). The three primary strong hybrid architectures, PS, P2, and series, are shown in Figure 4.4. PS hybrids incorporate a planetary gear set that connects the motor, generator, and engine. Power from the engine is transferred to both the battery (via the generator) and the wheels, with the exact ratio of the split optimized to achieve maximal efficiency. P2 hybrids add a motor and battery in P2 to a conventional vehicle architecture, which includes a clutch between the motor/generator and engine. In this configuration, the engine and battery both provide power to the wheels. Both PS and P2 hybrids recover energy during braking with the motor operating as a generator. To implement a series hybrid architecture, the motor and power battery must be sized to provide all of the vehicle propulsion, as there is no combined driving assist directly from the ICE to the wheels, as in the P2 and PS hybrids. All power delivered to the wheels comes from the electric motor, and therefore the vehicle has the instant torque performance characteristic of a BEV. Given its limited operating requirements as a generator only, the ICE can therefore be made to be extremely efficient and/or low cost. Advantages and disadvantages of the various hybrid architectures are discussed below in the context of specific vehicle offerings.
Despite a relatively challenging market demand, manufacturers have continued to expand the number of strong hybrid offerings across more vehicle segments in recent years. The types of hybrid architectures in the market have also proliferated to adapt to different customer needs in larger vehicle classes and to allow for performance orientations, AWD, towing, and so on. Manufacturers with a legacy in strong hybrid continue to be bullish about their role in 2025–2035. Other manufacturers state that they will focus strictly on BEVs as the end game. In either case, strong hybrid represents the ultimate efficiency potential of vehicles relying on petroleum fuel as the sole source of energy. As described in Section 4.4.2 below, future developments in ICE efficiency often focus on the synergies of the engine operating in a hybrid powertrain system. However, given that strong hybrids already enjoy a significant FE advantage over base ICE vehicles, manufacturers may not be compelled to add significant technology to their engines to achieve further efficiency improvements.
An overview of the current U.S. market can provide a look at the diversity of hybrid choices, in both the various technical approaches used by different manufacturers as well as their FE potential. In the small car segment alone, there are offerings from Hyundai (Ioniq), Toyota (Prius), and Honda (Insight) that all achieve greater than 50 miles per gallon (MPG) in label fuel economy and greater than 70 MPG in compliance fuel economy. Three distinct hybrid configurations are common: P2 integrated into a DCT, PS, and Honda 2-motor (Figure 4.6). Also important to consider is whether strong hybrids still provide a compelling fuel economy improvement when compared to an unhybridized vehicle that has taken advantage of many of the available FE technologies in that category. Chapter 3 highlighted several high performing MY 2020 vehicles that approach the original 2025 CO2 standards (with off-cycle credits) by incorporating extensive FE technology. Two of those, the Toyota Camry and Ford Escape, also offer hybrid variants that provide a roughly 40% improvement in FE even above the highly performing conventional model (Table 4.5). With strong hybridization making its way into luxury and larger SUV and crossover vehicle classes, manufacturers may configure those powertrains to enhance performance as well as FE, which can provide a different marketing position for those products. Table 4.5 shows comparisons of hybrid and non-hybrid vehicles in the same carline.
The predominant hybrid architecture in the U.S. market to date has been the PS used by Toyota and Ford and built on volume success of the Prius. PS hybrids typically have higher efficiency and slightly lower cost than
SOURCE: Committee generated, adapted from Sherman (2013) and Wheel Network (2018).
P2 hybrids; however, the PS architecture has some known disadvantages in off-cycle driving modes, torque capacity, high power operation (e.g., towing), AWD compatibility, and reverse (Kapadia et al., 2017). P2 variants have historically experienced more success in Europe, due in part to the orientation of the transmission manufacturing infrastructure toward manual transmissions like DCTs, which can be easily integrated into the P2 architecture. However, in order to support the demands of larger vehicles and trucks, more P2 variants are coming to the U.S. market offering improved capabilities, for example AWD and RWD architecture useful for towing, and still showing significant FE improvements over conventional ICE vehicles. One example is the Ford Explorer 10-speed, which provides a RWD hybrid architecture that could also apply to trucks. Another is the Acura MDX, which combines a 3.0 L V6 engine with a 47 hp motor integrated into a 7-speed DCT and two 36 hp motors in the rear axle for AWD and torque vectoring. Offerings of series hybrids are more limited. Nissan’s ePower hybrid architecture will be the first pure series HEV in the U.S. market and is being offered based on its success in the Japanese market. In the ePower hybrid configuration, all vehicle energy is produced by the engine acting as a generator, charging the battery, which in turn drives the electric motor. However, since all engine energy is exposed to double conversion before reaching the wheels, this hybrid configuration has an efficiency disadvantage compared to other architectures.
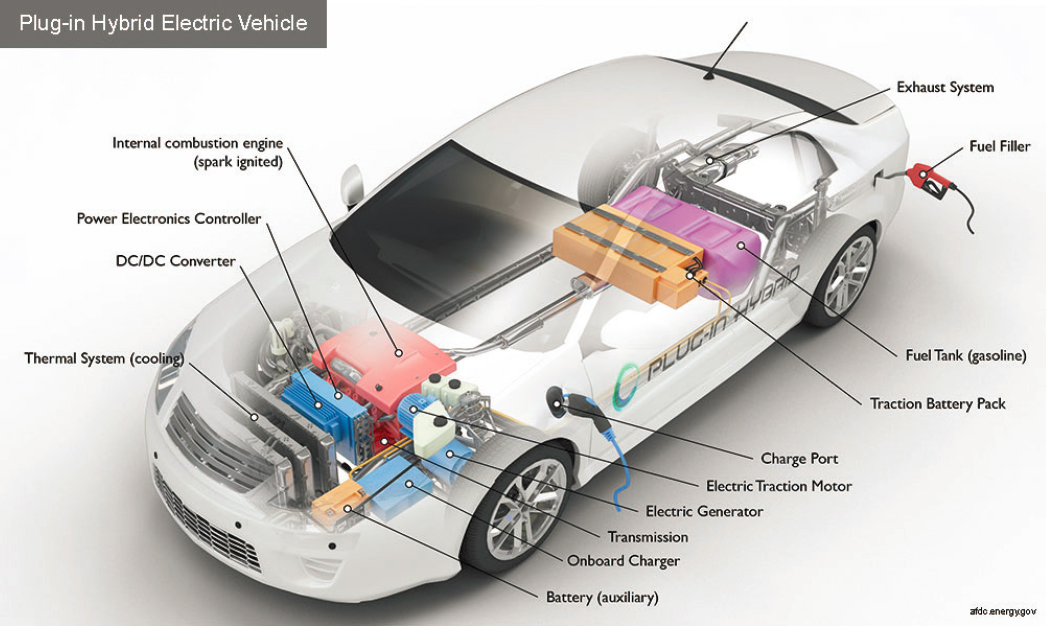
Alongside the proliferation of HEV offerings, automakers are offering configurations of many strong hybrid powertrains as plug-in hybrids with the addition of an onboard charger and an energy-type battery1 offering varying levels of electric-only range. Depending on the all-electric range of the PHEV, the battery and motor may be sized more like an HEV (shorter electric range, fewer operating conditions) or more like a BEV (longer electric
___________________
1 The distinction between energy-type and power-type batteries is described later in this report in Section 5.3.3.9.
TABLE 4.5 Select Light-Duty Passenger Vehicle Models with Hybrid and Non-Hybridized Options, Demonstrating Fuel Economy Improvements from Hybridization
| Class | Year, Vehicle, Engine Details | Valve Info | Fuel Injection | Power (hp) | Curb Weight (lb) | Footprint (ft2) | MY 2019 Sales Volume | FE (MPG) | % FE Improvement (Hybrid Versus Conventional) | % Change in Fuel Consumption (Hybrid Versus Conventional) |
|---|---|---|---|---|---|---|---|---|---|---|
| Crossover | 2020 ESCAPE FWD 1.5 L TC | Intake/Exhaust, Hydraulic Actuated VCT | GDI | 181 | 3298 | 46.01 | Conventional: 241,387 | 41.166 | 42% | –30% |
| 2020 ESCAPE FWD 2.5 L NA HEV | Hydraulic Actuated VCT | MFI | 200 | 3534 | 2020 is the first MY of the Escape Hybrid | 58.344 | ||||
| 2020 ESCAPE AWD 1.5 L TC | Intake/Exhaust, Hydraulic Actuated VCT | GDI | 181 | 3474 | 39.431 | 45% | –31% | |||
| 2020 ESCAPE AWD 2.5 L NA HEV | Hydraulic Actuated VCT | MFI | 200 | 3668 | 57.042 | |||||
| Medium car | 2020 CAMRY LE FWD 2.5 L NA | Intake and exhaust | GDI | 203 | 3296 | 48.46 | Conventional: 336,978 | 43.451 | 65% | –39% |
| 2020 CAMRY LE FWD 2.5 L NA HEV | 208 | 3472 | Hybrid: 26,043 | 71.781 | ||||||
| 2020 CAMRY XLE FWD 2.5 L NA | 203 | 3391 | 42.669 | 47% | –32% | |||||
| 2020 CAMRY XLE FWD 2.5 L NA HEV | 208 | 3572 | 62.929 |
NOTE: FWD = front-wheel drive; MFI = multipoint fuel injection; NA = naturally aspirated; TC = turbocharged. Switching to the hybrid version can also mean changes in valves, fuel injection, horsepower, weight, and footprint of the vehicle, all of which affect its final fuel economy.
SOURCE: Committee generated using information from EPA (2020d), Ford (2020), Toyota (2020a), Toyota (2020b), Toyota Newsroom (2020), and Tulumba (2020).
SOURCE: DOE Alternative Fuels Data Center (n.d.).
range, greater operating conditions). Figure 4.7 depicts a generic plug-in hybrid architecture. Manufacturers have differing views on the role of PHEVs in the future, which are influenced by the treatment of policy in the global markets they participate in.
4.5.2 Efficiency Opportunities for the ICE Implemented in Hybrid Architectures
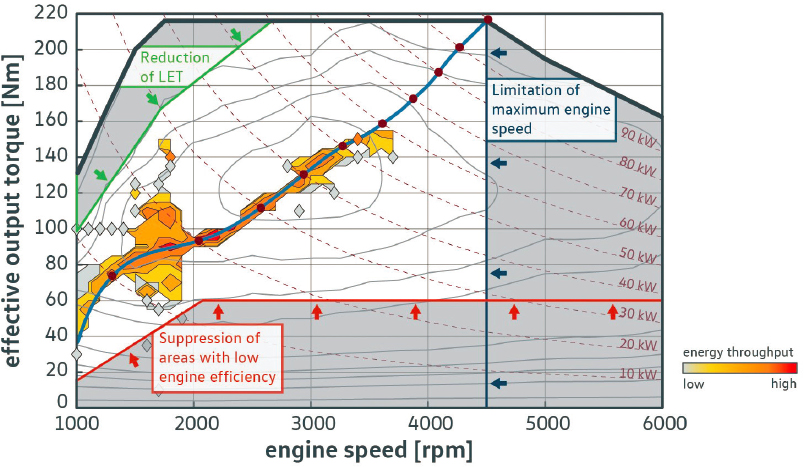
This section addresses the potential to improve the efficiency of the ICE in the context of a hybrid powertrain system. Beyond the aforementioned regenerative braking, the available electric power can complement the ICE in a strong hybrid propulsion system in several ways. First, in addition to the alternator/generator function, accessories such as water pump and air conditioning can be electrified, thereby eliminating the need to power a belt-driven accessory drive using the engine. Electrifying these accessories also reduces the requirement of the ICE to provide high torque at low engine speeds where the engine is most prone to knocking, thus opening a wider range of CRs. Second, depending on the level of electric assistance available, modifications to the ICE, such as downsizing and/or improving efficiency while optimizing cost, can help meet efficiency and performance goals while offsetting the cost of the hybrid electric components. The hybrid propulsion system also can augment peak vehicle power needs reducing the engine’s high-speed horsepower requirement. Additionally, lightly loaded operating areas of low engine efficiency with high throttling losses can be minimized through electric-only driving or load leveling (to charge battery under these modes). Figure 4.8 illustrates these opportunities with a modified engine map that indicates regions where the motor can replace or supplement the engine.
To date, automakers have offered the required engine performance of hybrids through the use of relatively low cost, naturally aspirated engines that achieve high efficiency by aggressively utilizing the Atkinson cycle with geometric CR up to 14:1. However, looking ahead, there are still significant opportunities to improve the overall powertrain system efficiency by further improving the ICE in a hybrid context. For example, turbocharging in
SOURCE: Brannys (2019).
combination with hybridization can allow for engine downsizing and potentially enable the use of new 3-cylinder engines with displacements as low as 1.0 L. Significantly, however, the future boosted ICE in a hybrid is being approached differently than strictly enabling downsizing. As described in Section 4.1, the Miller cycle provides opportunities for significant improvements in thermal efficiency. In a hybrid with its limited engine speed/load topology requirement, the Miller cycle can be implemented at lower cost than for an unhybridized ICE, or the technologies can be tailored to achieve even lower BSFC given the more limited operating regime. The ultimate expression of the implementation of Miller cycle engines in HEVs is in a series hybrid, where the engine, with no mechanical coupling to the wheels, can operate strictly at its peak efficiency for any given power requirement. The PS hybrid architecture can approach this level with its CVT-like functionality. An engine operating in a series hybrid application that demonstrated up to 10% improvement in BSFC over a state-of-the-art downsized/boosted Miller cycle engine meeting all conventional application requirements was reported by VW (Brannys, 2019). The paper notes, however, that the technical enablers employed in this engine concept (15:1 CR, external cooled EGR to suppress knock, reoptimized VTG turbocharger based on EGR flow requirements, reduced intake cam lift, and a passive prechamber ignition required to ignite the dilute mixture, and more) can only work to this dramatic extent in a series hybrid context. Numerous studies by engine developers have described the ultimate potential of the ICE to occur as a so-called dedicated hybrid engine with brake thermal efficiency potential approaching 45%. However, there still is room for significant improvement through optimization of the total engine and hybrid systems. Some of technology possibilities include the following:
- Boosting systems (which can include electrically assisted devices) do not have the same low-end torque and peak power requirements. They can therefore be cost-optimized and/or designed for peak efficiency over a limited operating range. They can also be focused to support flow of EGR where applicable.
- Cooled low-pressure EGR systems can be optimized to improve fuel efficiency in the dominant speed/load regions (as opposed to being used for high load knock mitigation).
- Engine designs that do not have the same peak power requirements can be designed for lower speed (lower friction) with lower intake cam lifts and optimized combustion systems (high charge motion).
ICE improvements are also possible at the lower voltage end of the hybrid architecture spectrum. As described in the overview to Section 4.5, the 48 V MHEV provides its primary fuel efficiency improvement through its capacity to regenerate braking energy. It can also improve the functionality of idle stop-start systems. The added electrical launch assistance of 10–15 kW in 48 V MHEVs could allow for some modest engine downsizing. In some demonstrations, an electric supercharger made viable at 48 V has been shown to help overcome the vehicle launch/turbo lag concerns of a much smaller boosted engine in an MHEV application. For instance, Volvo has recently introduced a new mild hybrid engine architecture including a family of 4-cylinder gasoline and diesel engines that integrate a 48 V BISG. The gasoline 48 V BISG versions are turbocharged with external low pressure cooled EGR, utilize cylinder deactivation, and utilize the aforementioned E-charger in a performance variant. This is just one example of the technologies covered in the “conventional” engine space now starting to integrate with “electrification.” Others include diesel, high compression, and downsized/boosted engine technologies.
4.5.3 Technology Cost and Effectiveness for Hybrid Vehicles
Tables 4.6 and 4.7 below report estimated and projected cost and effectiveness values for representative PS and P2 strong hybrids of example vehicle classes. Cost estimates are provided for key components in 2025, 2030, and 2035. The engine and transmission component and system changes are those employed in the studied examples to convert to the respective hybrid systems. Engine and transmission component costs were estimated for the hybrid relative to the ICE from NHTSA/EPA values in the Safer Affordable Fuel Efficient (SAFE) rule with reductions for learning of 1%/year. The motor, generator, and power electronics systems were scoped based on component power, torque, and weight to establish a 2020 baseline technology. Costs were estimated using baseline component costs estimates for 2020 from suppliers, automakers, industry consultants, and literature. Cost reductions for 2025–2035 are projected based on the introduction, scale up, and learning of new technologies like cerium rare earth magnets in motors and gallium nitride in power electronics and amount to about 20% for motor/generator and 35%–45% for power electronics. Motor, generator, and power electronic assumptions are detailed in the footnotes of Tables 4.6 and 4.7. Battery technology was scoped based on Li-ion power-type batteries and 2020 values for battery capacity. Battery costs were estimated based on the assumed battery chemistry and were reduced over time using a learning rate of 5%/year. Beyond the aforementioned motor, generator, power electronics, and battery, other necessary components for electrification/hybridization may include an electronic control unit upgrade; a high-voltage harness; regenerative brakes;2 alternating current (AC) modifications; a direct current (DC)/DC converter; and battery monitoring, safety, and thermal management systems. These costs were estimated using data from a presentation to the committee on hybrid costs (Duleep, 2020), with cost reductions based on a learning rate of 1%/year. Hybrid costs have significant associated uncertainty, in part owing to differences in how different automakers implement their hybrid systems. While Tables 4.6 and 4.7 report single cost estimates for each year for an example conversion of an ICE vehicle to an HEV, in reality there will be a range of costs, given uncertainties in future technology penetration and differences in costs and technology implementation for various automakers. For example, using input from suppliers and automakers, as well as the committee’s own expertise, the total cost to convert a conventional midsize car or CUV to a P2 or PS hybrid ranges from about $2,000–$3,000 in MY 2020. Notably, these costs are significantly lower than the costs of hybridization reported in the 2020 SAFE Rule, which are approximately $3,500–$6,700 for MY 2020 and $2,900–$5,700 in MY 2025 for small cars to medium-size SUVs depending on hybrid architecture (NHTSA/EPA, 2020).3
___________________
2 The regenerative braking function is added to capture vehicle energy during braking and convert it to useful electric power. In hybrid vehicles, where an electric motor exists in some fashion to provide partial propulsion power, the motor can be controlled in a generation mode during braking to capture part of the vehicle energy during braking. Required equipment for regenerative braking includes added controls and sensors, and a vacuum pump for the existing hydraulic system.
3 Approximate range from summing the costs in the SAFE rule for battery, transmission, and non-battery electrification components of P2 and PS hybrids and learning the costs from MY 2017 to MY 2020 or MY 2025. Battery costs for P2 not provided in SAFE Rule but assumed to be the same as PS battery costs for a given vehicle class. Reported range is small car P2 to medium SUV PS and includes both performance and non-performance vehicles.
TABLE 4.6 Projected Costs and Effectiveness of Representative PS Hybrid Technology Packages, 2025–2035
| Example Vehicle | Components | Technology Cost (2018$)a | Technology Effectiveness (Percent Change in Fuel Consumption)b | ||
|---|---|---|---|---|---|
| MY 2025 | MY 2030 | MY 2035 | |||
| Medium Car Naturally Aspirated to PS Hybrid | Engine Modificationsc | Total: $55 | Total: $50 | Total: $50 | Medium Car Hybridization Effectiveness Average: –42% Range: –32% to –47% |
|
$55 | $50 | $50 | ||
|
No change | No change | No change | ||
| 8-speed AT to eCVTd | –$435 | –$410 | –$390 | ||
| Motore | $320 | $290 | $260 | ||
| Generatore | $140 | $125 | $115 | ||
| Battery (1.0 kWh, Li-ion)f | $550 | $425 | $330 | ||
| Inverter/power electronicsg | $490 | $440 | $310 | ||
| Battery Monitoring, Safety, and Thermal Management Systemsh | $330 | $315 | $300 | ||
| ECU Upgradeh | $45 | $40 | $40 | ||
| High-Voltage Harnessh | $130 | $125 | $120 | ||
| Regenerative Brakesh | $170 | $165 | $155 | ||
| AC Modificationsh | $170 | $165 | $155 | ||
| DC/DC converter (1.1 kWh) i | $90 | $90 | $90 | ||
| Total | $2,055 | $1,820 | $1,535 | ||
| CUV Turbocharged, Downsized (TCDS) to PS Hybrid | Engine Modificationsc | Total: –$340 | Total: –$325 | Total: –$305 | CUV/SUV Hybridization Effectiveness Average: –34% Range: –26% to –39% |
|
$95 | $90 | $85 | ||
|
–$165 | –$155 | –$145 | ||
|
–$295 | –$280 | –$265 | ||
|
–$30 | –$30 | –$30 | ||
|
$55 | $50 | $50 | ||
| 8-speed AT to eCVTd | –$435 | –$410 | –$390 | ||
| Motore | $375 | $340 | $305 | ||
| Generatore | $100 | $90 | $80 | ||
| Battery (1.1 kWh, Li-ion) f | $605 | $470 | $360 | ||
| Inverter/PEg | $515 | $470 | $330 | ||
| Battery Monitoring, Safety, and Thermal Management Systemsh | $330 | $315 | $300 | ||
| ECU Upgradeh | $45 | $40 | $40 | ||
| High-Voltage Harnessh | $130 | $125 | $120 | ||
| Regenerative Brakesh | $170 | $165 | $155 | ||
| AC Modificationsh | $170 | $165 | $155 | ||
| DC-DC converter (1.1 kWh)i | $90 | $90 | $90 | ||
| Total | $1,755 | $1,535 | $1,240 | ||
a Vehicle specifications and costs are general estimates for the vehicle class and do not represent specific vehicles; all costs rounded to the nearest $5.
b Effectiveness calculated using combined, unadjusted fuel economy values for MY 2020 vehicles from DOE/EPA Fuel Economy Guide Dataset (EPA, 2020d).
c Costs based on MY 2020 values reported in NRC (2015), updated to 2018$ and reduced 1%/year.
d Cost of eCVT (Duleep, 2020) with savings for removing 8-speed automatic transmission (Duleep, 2020; NRC, 2015). All costs in 2018$ and reduced 1%/year from base year (MY 2011 for eCVT and removing 6-speed AT; MY 2025 for going from 8-speed AT to 6-speed AT) through 2035.
e Assumes motor component cost reductions of 10% every 5 years, starting from MY 2020. Assumes introduction of cerium rare earth magnets in 2030.
f Assumes $550/kWh 2025 cost, with 5%/year cost reductions through 2035.
g Inverter cost assumptions in 2025: uses silicon carbide switches, 25% cost reduction from 2020; in 2030: uses gallium nitride on silicon devices, 10% cost reduction from 2025, reduction in device losses decreases cooling costs by 10%; in 2035: uses gallium nitride on silicon devices at high switching frequencies, reduces filtering and cooling needs by 75% compared to low frequency switching. Controller costs decrease by 25% from 2020 to 2025 and 2025 to 2030, based on normal electronic cost reductions.
h 1%/year cost reduction from 2011 estimate obtained from Duleep (2020).
i Cost estimate from Duleep (2020); assumes $80/kW.
NOTE: AT = automatic transmission; DCP = dual cam phasing; ECU = engine control unit; MPI = multipoint injection.
TABLE 4.7 Projected Costs and Effectiveness of Representative P2 Hybrid Technology Packages, 2025–2035
| Example Vehicle | Components | Technology Cost (2018$)a | Technology Effectiveness (Percent Change in Fuel Consumption)b | ||
|---|---|---|---|---|---|
| MY 2025 | MY 2030 | MY 2035 | |||
| Medium Car Naturally Aspirated to P2 Hybrid | Engine Modificationsc | Total: $55 | Total: $50 | Total: $50 | Medium Car Hybridization Effectiveness Average: –39% Range: –33% to –44% |
|
May be possible | May be possible | May be possible | ||
|
$55 | $50 | $50 | ||
| Transmission Modifications | Total: –$5 | Total: –$5 | Total: –$5 | ||
| 8-speed AT to 6-speed ATd | –$55 | –$50 | –$50 | ||
| Electric transmission pumpe | $50 | $45 | $45 | ||
| Motorf | $240 | $215 | $195 | ||
| Battery (1.5 kWh, Li-ion)g | $825 | $640 | $495 | ||
| Inverter/power electronicsh | $315 | $280 | $175 | ||
| Battery Monitoring, Safety, and Thermal Management Systemsi | $330 | $315 | $300 | ||
| ECU Upgradei | $45 | $40 | $40 | ||
| High-Voltage Harnessi | $130 | $125 | $120 | ||
| Regenerative Brakesi | $170 | $165 | $155 | ||
| AC Modificationsi | $170 | $165 | $155 | ||
| DC-DC converter (1.1 kWh) j | $90 | $90 | $90 | ||
| Total | $2,365 | $2,080 | $1,770 | ||
| SUV Turbocharged, Downsized (TCDS) to P2 Hybrid | Engine Modificationsc | Total: $370 | Total: $350 | Total: $335 | SUV Hybridization Effectiveness Average: –10% Range: –6.5% to –14% |
|
$470 | $445 | $425 | ||
|
$40 | $40 | $35 | ||
|
$100 | $95 | $90 | ||
|
–$295 | –$280 | –$265 | ||
|
$55 | $50 | $50 | ||
| Transmission Modifications | Total: $50 | Total: $45 | Total: $45 | ||
| 10-speed AT | No change | No change | No change | ||
| Electric transmission pumpe | $50 | $45 | $45 | ||
| Motorf | $485 | $435 | $390 | ||
| Battery (1.5 kWh, Li-ion)g | $825 | $640 | $495 | ||
| Inverter/PEh | $300 | $265 | $165 | ||
| Battery Monitoring, Safety, and Thermal Management Systemsi | $330 | $315 | $300 | ||
| ECU Upgradei | $45 | $40 | $40 | ||
| High-Voltage Harnessi | $130 | $125 | $120 | ||
| Regenerative Brakesi | $170 | $165 | $155 | ||
| AC Modificationsi | $170 | $165 | $155 | ||
| DC-DC converter (1.1 kWh) j | $90 | $90 | $90 | ||
| Total | $2-965 | $2,635 | $2,290 | ||
a Vehicle specifications and costs are general estimates for the vehicle class and do not represent specific vehicles; all costs rounded to the nearest $5.
b Effectiveness calculated using combined, unadjusted fuel economy values for MY 2020 vehicles from DOE/EPA Fuel Economy Guide Dataset (EPA, 2020d).
c Costs based on MY 2020 values reported in NRC (2015), updated to 2018$ and reduced 1%/year.
d MY 2020 costs from NRC (2015), updated to 2018$ and reduced by 1%/year.
e Estimated at $50 in MY 2025 and reduced 1%/year through 2035.
f Motor component cost reductions of 10% every 5 years, starting from MY 2020. Assumes introduction of cerium rare earth magnets in 2030.
g Assumes $550/kWh 2025 cost, with 5%/year cost reductions through 2035.
h Inverter cost assumptions in 2025: uses silicon carbide switches, 25% cost reduction from 2020; in 2030: uses gallium nitride on silicon devices, 10% cost reduction from 2025, reduction in device losses decreases cooling costs by 10%; in 2035: uses gallium nitride on silicon devices at high switching frequencies, reduces filtering and cooling needs by 75% compared to low frequency switching. Controller costs decrease by 25% from 2020 to 2025 and 2025 to 2030, based on normal electronic cost reductions.
i 1%/year cost reduction from 2011 estimate obtained from Duleep (2020).
j Cost estimate from Duleep (2020); assumes $80/kW.
Fuel economy improvements provided by strong hybrids appear to be similar within a given vehicle class and hybrid architecture. The effectiveness values reported in Tables 4.6 and 4.7 are the range and average fuel consumption reduction for 2020 vehicles of the given class where both hybrid and conventional models are produced. In 2025–2035, the effectiveness of PS and P2 hybrids with respect to their ICE counterpart will likely remain constant, or could improve slightly if engine efficiency improvements are increasingly targeted to engines in hybrid systems, as discussed above.
FINDING 4.5: Strong hybrids represent the maximum fuel efficiency possible in vehicles powered only by gasoline, both in the current fleet and into the future. This is owing to their ability to maximize braking energy recuperation and to augment the operation of the engine. Strong hybrid offerings in the U.S. market span all vehicle classes and average 35%–40% reduction in fuel consumption in midsize and crossover vehicles compared to similar conventional powertrain vehicles. More cost information is needed, but the committee estimates that midsize and crossover strong hybrids have an incremental cost of around $2,000–$3,000 above a conventional vehicle in 2020, with expected decreases in the cost increments in 2025–2035. Many of the future developments of the internal combustion engine itself are focusing on the added efficiency potential of the engine when integrated into a hybrid system.
FINDING 4.6: Mild hybrids, defined here as 48 V, represent a viable pathway to realize some of the same CO2 reduction benefits of hybridization described for strong hybrids, but at a lower overall cost. Most current production mild hybrid vehicles have employed a belt driven machine in the P0 location, as it is the lowest cost and most straightforward to implement, but has some inherent efficiency limitations. Other mild hybrid architectures such as 48 V P2 can achieve greater efficiency gains but at a higher implementation cost than the belt driven P0 architecture. Analytical studies have shown the maximum efficiency potential of mild hybrid vehicles from multiple motor architectures such as P0+P3 or P0+P4, but more cost data are needed.
RECOMMENDATION 4.1: The National Highway Traffic Safety Administration should update its teardown and full system simulation for mild hybrid, and both PS and P2 strong hybrid vehicles, which are now and will continue to be the highest efficiency vehicles containing an internal combustion engine.
4.6 ADVANCED COMBUSTION TECHNOLOGIES
For many years, the industry has endeavored to bridge the thermal efficiency gap between spark ignition and compression ignition engines that results from the diesel engine’s higher CR and higher ratio of specific heats (dilute mixtures from excess air and/or EGR). Spark ignition engines are constrained to operate at a stoichiometric air to fuel ratio to accommodate the functional requirements of the three-way catalyst necessary to meet emissions standards. Recirculated exhaust gas has therefore been commonly used in this manner, but it is not as effective as air owing to its lower specific heat ratio. Homogeneous charge compression ignition (HCCI) has long been recognized as the ultimate solution to this challenge. In this combustion concept, a premixed (homogeneous) charge of fuel and air is compressed until it auto-ignites throughout the chamber volume rather than through a traveling flame front. The theoretical advantages of the HCCI concept with respect to improved efficiency are as follows:
- Higher CR than conventional spark-ignition engines (to promote auto-ignition).
- Lean or dilute operation with air providing a higher specific heat ratio for improved thermal efficiency.
- Low temperature combustion and rapid heat release that reduce heat losses. The low peak combustion temperatures also dramatically reduce the production of NOx feedgas emissions, mitigating dependence on the three-way catalyst.
- Lower pumping losses owing to dilute operation relative to a throttled spark-ignition engine.
Finding 2.7 of the 2015 NRC report stated that while lean HCCI had the potential to improve fuel consumption by up to 5%, many challenges remained before it could be implemented. Highlighted were issues associated with
limited engine load range for operation (making it somewhat incompatible with the trend toward downsizing) and difficulty controlling mode switching. The finding also cited a DOE-funded project indicating that the constraint of super ultra-low emissions vehicle emissions would eliminate the fuel consumption benefits of HCCI. The finding concluded that HCCI technology would not likely have an impact by 2025 but with further development may contribute by 2030, or after the full benefits of downsized/turbocharged engines had been realized.
In the development of this report, manufacturers were asked again about the potential of lean operation and, if anything, were more skeptical than in 2015. This skepticism can largely be attributed to the even more stringent criteria emission constraints and focus on real-world emissions looking ahead, as well as the added cost associated with enabling hardware, lean NOx aftertreatment, and so on. Nonetheless, there are ongoing developments to maximize the efficiency of the ICE, particularly in the context of downsized, turbocharged engines. Much of that work seems to focus on Lambda=1 operation using Miller cycle and high levels of EGR as the diluent. Some of these efforts include the development of advanced ignition systems and/or the utilization of prechamber combustion (both active and passive) to ignite the dilute mixtures. There is also significant work focused on developing engines in hybrid applications (including series hybrid) where the engine’s function and operating requirements can be more oriented toward efficiency.
One exception to this is Mazda’s recent introduction of their SkyActiv-X technology applied to a 2.0 L engine in Japan and Europe. This technology represents the first production application of gasoline compression ignition, in this case using assistance from a spark event, dubbed spark-controlled compression ignition (SPCCI). Over the years, multiple concepts have been developed as compromise positions between spark ignition, compression ignition, and pure HCCI as described above, with SPCCI being one of them. In the Mazda 2.0 L SkyActiv-X, three distinct combustion modes are utilized: lean air to fuel ratio SPCCI at light to moderate loads, lean exhaust gas to fuel ratio using cooled EGR at higher loads, and conventional spark ignition at full load. The technology is offered only in combination with Mazda’s mild hybrid system. It employs an extremely high CR (16.3:1) to optimize compression ignition, along with swirl control valves, high pressure fuel injection, in-cylinder pressure transducers (to provide combustion feedback control), and a supercharger (to supply needed excess air) in support of the lean SPCCI system. An external cooled EGR system is also included for the lean ratio of EGR gas plus air to fuel combustion mode region. While the SkyActiv-X technology was originally announced for U.S. introduction, recent reports indicate a deferral, based on Mazda’s assessment that the U.S. customer is currently not willing to trade off performance or pay a premium for fuel economy technology.
FINDING 4.7: It is reasonable to assume that if compelled by regulation and/or competition, manufacturers will continue to deploy more of the fuel-efficient technologies utilized in 2020 high fuel economy internal combustion engine vehicle models. However, these technologies are not equally applicable or affordable across all vehicle segments. For example, small cars may be more cost constrained or some vehicles will place higher customer priority on other attributes such as performance and towing. In addition, while there is certainly further internal combustion engine improvement potential, the cumulative gains can become costly in terms of benefit to cost and challenging in terms of emission constraints or other attribute trade-offs. Therefore, some manufacturers may choose to transition to alternative pathways such as electrification.
4.7 REFERENCES
Brannys, S. 2019. “Maximum Efficiency Concept of a 1.5l TSI evo for Future Hybrid Powertrains.” Volkswagen AG, New Gasoline Engines II, Aachen Colloquium.
Conway, G., D. Robertson, C. Chadwell, J. McDonald, J. Kargul, D. Barba, and M. Stuhldreher. 2018. “Evaluation of Emerging Technologies on a 1.6 L Turbocharged GDI Engine.” SAE Technical Paper 2018-01-1423. https://doi.org/10.4271/2018-01-1423.
DOE (U.S. Department of Energy) Alternative Fuels Data Center. n.d. “Alternative Fuels Data Center: How Do Plug-In Hybrid Electric Cars Work?” https://afdc.energy.gov/vehicles/how-do-plug-in-hybrid-electric-cars-work.
Duleep, G. 2020. “Cost and Benefit of Power-Split Hybrid Designs.” Presentation to the Committee on Assessment of Technologies for Improving Fuel Economy of Light-Duty Vehicles—Phase 3. October 30.
EPA (U.S. Environmental Protection Agency). 2015. “VW Notice of Violation, Clean Air Act,” September 18. https://www.epa.gov/sites/production/files/2015-10/documents/vw-nov-caa-09-18-15.pdf.
EPA. 2020a. 2019 EPA Automotive Trends Report. EPA-420-R-20-006. March. Washington, DC. https://www.epa.gov/sites/production/files/2020-03/documents/420r20006.pdf.
EPA. 2020b. 2018 Toyota 2.5L A25A-FKS Engine Tier 3 Fuel—ALPHA Map Package. Version 2020-07. Ann Arbor, MI: US EPA, National Vehicle and Fuel Emissions Laboratory, National Center for Advanced Technology.
EPA. 2020c. “Tampered Diesel Pickup Trucks: A Review of Aggregated Evidence from EPA Civil Enforcement Investigations.” November 20. https://www.epa.gov/sites/production/files/2021-01/documents/epaaedletterreportontampereddieselpickups.pdf.
EPA. 2020d. 2020 Fuel Economy Guide—2020 Datafile. August 21. https://www.fueleconomy.gov/feg/download.shtml.
EPA. 2020e. 2016 Honda 1.5L L15B7 Engine Tier 3 Fuel—ALPHA map Package. Version 2018-05. Ann Arbor MI: US EPA National Vehicle and Fuel Emissions Laboratory, National Center for Advanced Technology.
EPA/NHTSA (U.S. Environmental Protection Agency and National Highway Traffic Safety Administration). 2012. Joint Technical Support Document: Final Rulemaking for the 2017–2025 Light-Duty Vehicle Greenhouse Gas Emission Standards and Corporate Average Fuel Economy Standards. EPA-420-R-12-901. http://www.epa.gov/otaq/climate/documents/420r12901.pdf.
Ford. 2020. “2020 Escape.” Ford. https://www.ford.com/suvs-crossovers/escape/models/escape-se/.
Green Car Congress. 2017. “VW Offering New Variant of Millerized 1.5 TSI on Golf and Golf Variant with Coasting Function.” August 11. https://www.greencarcongress.com/2017/08/20170811-vw.html.
Heywood, J.B. 1988. Internal Combustion Engine Fundamentals. McGraw-Hill Series in Mechanical Engineering. New York: McGraw-Hill.
Kapadia, J., D. Kok, M. Jennings, M. Kuang, B. Masterson, R. Isaacs, and A. Dona. 2017. Powersplit or parallel—selecting the right hybrid architecture. SAE International Journal of Alternative Powertrains 6(1):68–76. https://doi.org/10.4271/2017-01-1154.
Lee, S., J. Cherry, M. Safoutin, A. Neam, J. McDonald, and K. Newman. 2018. “Modeling and Controls Development of 48 V Mild Hybrid Electric Vehicles.” SAE Technical Paper 2018-01-0413. doi:10.4271/2018-01-0413.
Lisle, G. 2019. “‘International Engine of the Year’ Awards: Audi’s 2.0 TFSI Engine Wins in Its Class.” Audi MediaCenter. May 22. https://www.audi-mediacenter.com/en/press-releases/international-engine-of-the-year-awards-audis-20-tfsiengine-wins-in-its-class-11682.
NHTSA/EPA (National Highway Traffic Safety Administration and U.S. Environmental Protection Agency). 2020. Final Regulatory Impact Analysis: The Safer Affordable Fuel-Efficient (SAFE) Vehicles Rule for 2021–2026 Passenger Cars and Light Trucks. March. https://www.nhtsa.gov/sites/nhtsa.dot.gov/files/documents/final_safe_fria_web_version_200330.pdf.
NRC (National Research Council). 2015. Cost, Effectiveness, and Deployment of Fuel Economy Technologies for Light-Duty Vehicles. Washington, DC: The National Academies Press.
Phillips, J. 2018. “Hybrid Vehicles: The WORST of Both Worlds?” ElectronicDesign. June 12. https://www.electronicdesign.com/markets/automotive/article/21806623/hybrid-vehicles-the-worst-of-both-worlds.
Sessions, R. 2018. “Nissan’s New VCR Engine: Worth the Effort?” SAE Automotive Engineering. https://www.sae.org/news/2018/05/2019-infiniti-qx-50-w-vc-turbo-review.
Sherman, D. 2013. “Explaining the Honda Accord’s Shrewdly Designed New Hybrid System.” Car and Driver. October 1. https://www.caranddriver.com/features/a15114066/explaining-the-honda-accords-shrewdly-designed-new-hybridsystem-tech-dept.
Stuhldreher, M., J. Kargul, D. Barba, J. McDonald, S. Bohac, P. Dekraker, and A. Moskalik. 2018. Benchmarking a 2016 Honda Civic 1.5-Liter L15B7 turbocharged engine and evaluating the future efficiency potential of turbocharged engines. SAE International Journal of Engines 11(6):1273–1305. https://doi.org/10.4271/2018-01-0319.
Toyota. 2020a. “2020 Camry Full Specs.” Toyota. https://www.toyota.com/camry/2020/features/mpg/2532/2540/2514.
Toyota. 2020b. “2020 Camry Hybrid Full Specs.” Toyota. https://www.toyota.com/camry/2020/features/mpg/2559/2561/2560.
Toyota Newsroom. 2020. “Toyota Motor North America Reports December 2019, Year-End Sales.” January 3. https://pressroom.toyota.com/toyota-motor-north-america-reports-december-2019-year-end-sales/.
Tulumba, C. 2020. “2019 US Vehicle Sales Figures by Model.” GoodCarBadCar. https://www.goodcarbadcar.net/2019-us-vehicle-sales-figures-by-model/.
Wheel Network. 2018. 2019 Honda Insight Two-Motor Hybrid Explained. Youtube Video. June 27. https://www.youtube.com/watch?v=IeV9EHmxOM8.


