
6
Fuel Cell Electric Vehicles
6.1 BACKGROUND
Fuel cell electric vehicles (FCEVs) offer high efficiency, petroleum-free transportation, and zero tailpipe emissions just like battery electric vehicles (BEVs). Several automakers are planning to offer FCEVs and BEVs as complementary zero-emission vehicle (ZEV) technologies to fulfill different customer needs, with BEVs typically in smaller vehicle size classes with shorter driving ranges, and FCEVs in larger vehicle size classes with longer daily driving ranges and shorter refueling times.
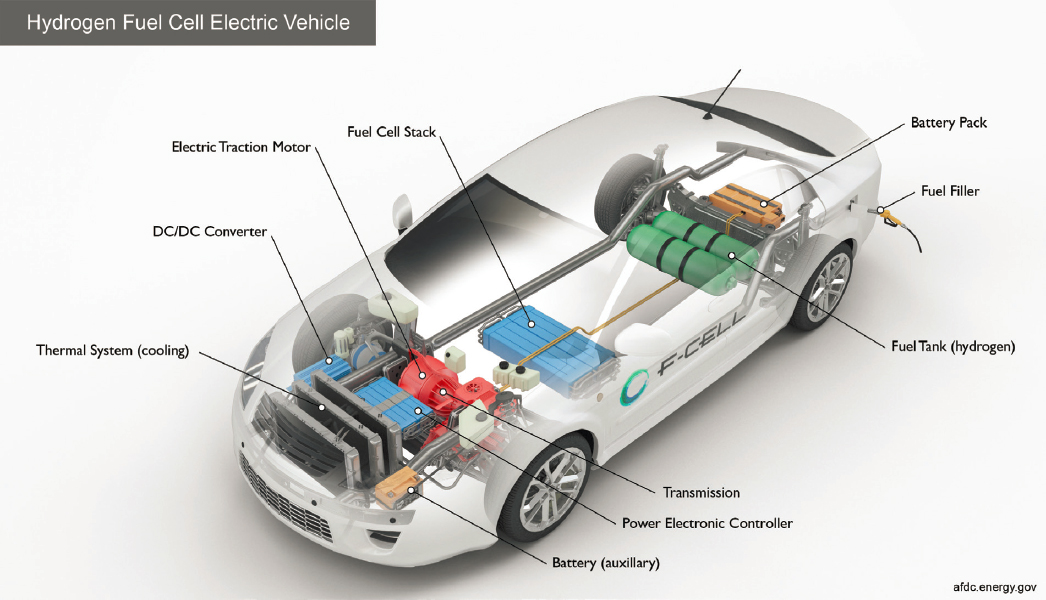
FCEVs have an architecture similar to series hybrids, as shown in Figure 6.1, with the engine and generator replaced by a fuel cell. Most FCEVs use a hydrogen-powered fuel cell combined with a battery that stores energy generated from regenerative braking and provides supplemental power to the electric traction motor. The fuel cell and battery are sized to provide the most efficient combination of constant and peak power.
Although FCEVs are not in mass production currently, automakers have sold or leased more than 8,000 in the United States, mostly in California, where they are refueled at more than 40 hydrogen stations (CaFCP, 2020). In 2014, some automakers announced plans to introduce FCEVs in the Northeast United States beginning in 2016 (Toyota USA Newsroom, 2014); however, those plans have been delayed largely owing to the prohibition of hydrogen-powered vehicles in tunnels and on the lower deck of two-tier bridges in that region. Several studies conducted over the past 4 years have addressed the risks and implications of potential traffic incidents involving FCEVs in tunnels; these will be summarized later in this chapter.
The most significant hurdle to FCEV deployment is the lack of an extensive hydrogen infrastructure. The U.S. Department of Energy (DOE) recently launched the “H2@Scale” initiative to address the challenges associated with hydrogen infrastructure, and some industry-led efforts are also in place. Government-industry programs on FCEV deployment and hydrogen infrastructure development are generally much stronger in Asia and Europe, particularly in Japan and Germany, than in the United States. A key driver for these efforts is the potential use of hydrogen as a storage sink for the renewable energy system with versatile applications in transportation, heat for buildings, and feedstock for industry.
All automakers engaged in FCEV development are adding a focus on medium- and heavy-duty vehicle (MHDV) applications for fuel cell powertrains, while some are shifting their short-term fuel cell focus to MHDVs entirely and emphasizing BEVs for light-duty vehicle (LDV) applications. Fuel cells offer an alternative to batteries in difficult-to-electrify applications such as vehicles with heavy payloads or high vehicle miles traveled (VMT) that need lighter weight powertrains, longer driving ranges, and/or quicker refueling times. FCEVs are also well-suited for medium-duty applications such as delivery trucks, municipal vehicles, and other tethered fleets
SOURCE: AFDC (n.d.a).
that require fewer refueling locations or one centrally located refueling station. Fuel cells are also being tested as range extenders for BEVs in fleet applications.
Research and development (R&D) efforts, led by both government and industry worldwide, continue to drive down fuel cell technology costs and improve performance. This chapter provides basic information about fuel cells and today’s commercial FCEVs, and describes the status of automotive fuel cell technology and current R&D activities aimed at improving the technology. A number of studies are described that estimate the current cost of automotive fuel cell systems based on state-of-the-art technology (not yet commercial) projected to high-volume production levels, as well as the cost of fuel cell technology in current commercial vehicles at today’s manufacturing volumes. Studies are also presented that attempt to predict the future cost of hydrogen and fuel cell technologies based on technology improvements and the economies of scale anticipated through increased demand. The results of these studies, some of which are more optimistic than others, depend on the scenarios and assumptions used, of course, and key assumptions are identified. Several scenarios assume a significantly increased role for hydrogen as a zero-emission energy carrier in a carbon-constrained future; as such, there is a relatively high level of uncertainty in the projected time frames. In some cases, FCEVs are compared to BEVs to note similarities or differences in vehicle attributes and applications, cost and performance status, or projected timelines for development and deployment. This chapter also provides information on the status of hydrogen refueling infrastructure, plans to accelerate infrastructure development, and R&D efforts to improve hydrogen technologies. The chapter ends with findings and recommendations for automotive fuel cells and hydrogen refueling infrastructure.
6.2 FUEL CELL BASICS
Like batteries, fuel cells are composed of an anode, a cathode, and an electrolyte. Unlike batteries, fuel cells do not need to be periodically recharged—instead, they need to be refueled with hydrogen. While there are
SOURCE: Mattuci (2015).
several types of fuel cells, the proton exchange membrane (PEM)—also sometimes called a polymer electrolyte membrane—is the fuel cell technology of choice for transportation applications owing to its low operational temperature, quick start-up, and high power density.
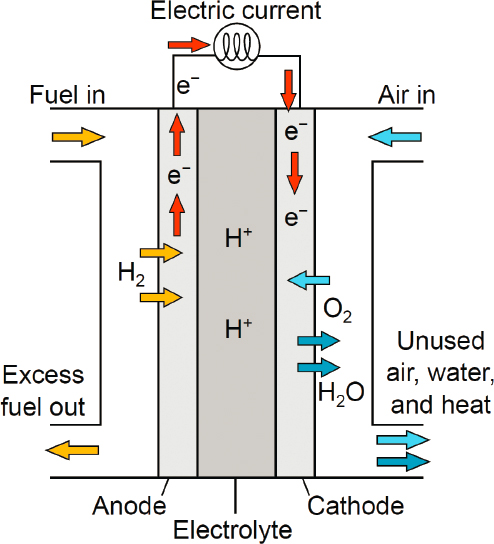
As shown in Figure 6.2, the PEM fuel cell works by passing hydrogen through the anode and oxygen (from air) through the cathode. At the anode site, hydrogen molecules are split into electrons and protons. The protons pass through the electrolyte membrane, while the electrons are forced through a circuit, generating an electric current and heat. At the cathode, the protons, electrons, and oxygen combine to produce water. In addition to electricity, hydrogen fuel cells produce only water and heat.
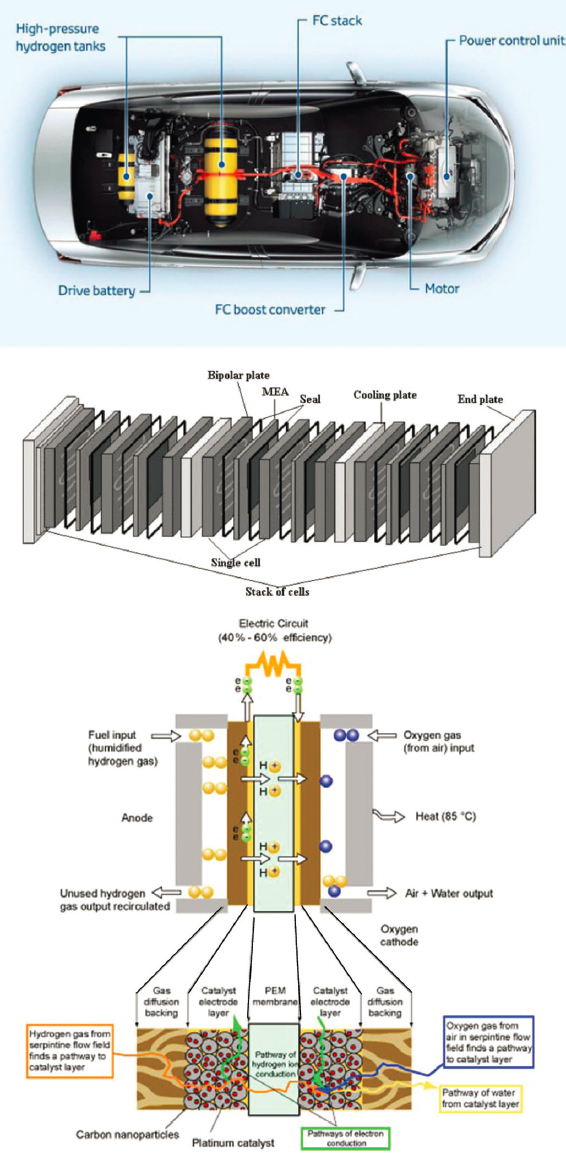
The maximum theoretical voltage of a single hydrogen/air fuel cell is 1.16 V (Thomas and Zalbowitz, 1999). However, in practice, the cell usually generates about 0.6 V to 0.9 V. The cells are stacked, or placed in series, to generate sufficient voltage to meet vehicle requirements. The key components of the PEM fuel cell stack (shown in Figure 6.3) are as follows:
- Membrane-electrode assembly (MEA), the “heart” of the fuel cell, comprised of catalyst/electrode and electrolyte/membrane (sometimes called the catalyst coated membrane or CCM), and gas diffusion layer (GDL). Platinum or platinum alloys are the catalysts typically used today,1 and perfluorosulfonic acid (PFSA) ionomers, such as Nafion®, are commonly employed as the electrolyte.
- Other stack hardware required for electrical connections and/or insulation and the flow of fuel and air are current collectors and bipolar plates (BPs, or separator plates) with channels to distribute fuel and air. A variety of materials can be used for BPs, including metals, coated metals, graphite, or carbon composites.
The fuel cell stack is supported by balance-of-plant (BOP) components—pumps, sensors, heat exchanger, gaskets, compressor, and blower or humidifier—that manage the ancillary functions of injection and recirculation
___________________
1 Automakers are working toward the same level of platinum as used in internal combustion engine catalytic converters.
SOURCE: (top) Reprinted under CC BY-NC-ND 4.0 from M. Kendall, 2018, Fuel cell development for new energy vehicles (NEVs) and clean air in China, Progress in Natural Science: Materials International 28(2):113–120, https://doi.org/10.1016/j.pnsc.2018.03.001; (middle) Reprinted by permission from Springer Nature Customer Service Centre GmbH: [Springer Nature] PEM Fuel Cell Fundamentals by Yuan and Wang, in PEM Fuel Cell Electrocatalysts and Catalyst Layers, J. Zhang (ed.), © 2008; (bottom) Reprinted under CC BY 4.0 from X. Ren, X. Zhang, T. Teng, and C. Li, 2020, Research on estimation method of fuel cell health state based on lumped parameter model, Energies 13(23):6425, https://doi.org/10.3390/en13236425.
SOURCE: James et al. (2018).
of hydrogen, air supply, and thermal and water management. The fuel cell stack together with the BOP components comprise the fuel cell system.
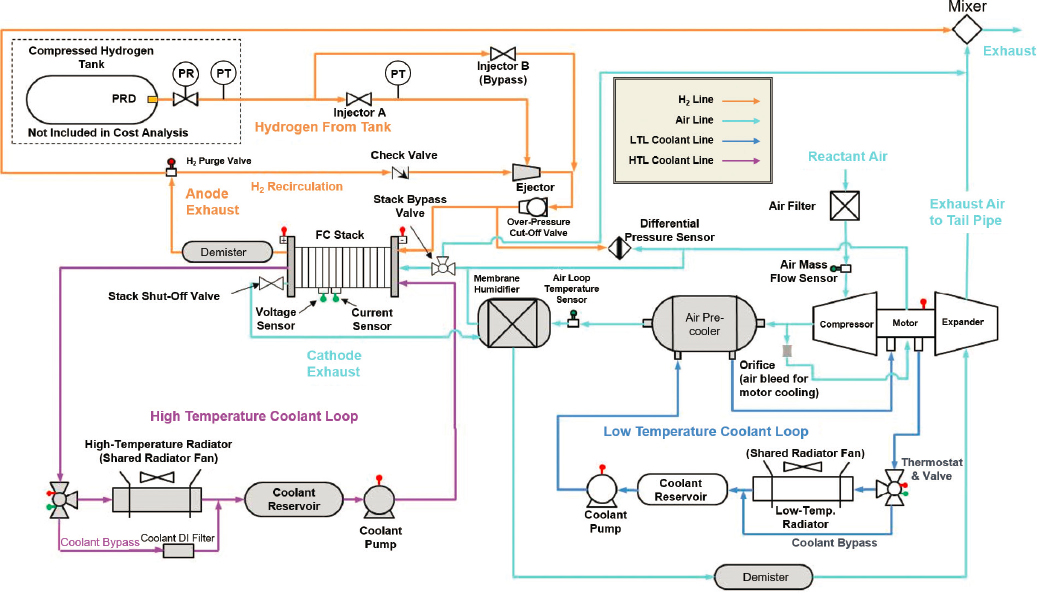
Other vehicle components that support the fuel cell system include the battery, electric motor, and power electronics (see Chapter 5), and the onboard hydrogen storage system. A generic flow schematic showing the basic components of an automotive fuel cell power system is shown in Figure 6.4. Automakers continue working on design improvements to simplify the system, improve performance, and reduce costs. For example, Toyota eliminated the external humidifier in its Mirai FCEV by modifying the fuel cell stack structure and operating conditions to use water generated at the cathode to humidify the anode MEA—a so-called self-humidifying stack design (Green Car Congress, 2016).
6.3 FCEV CURRENT STATUS AND PLANNED DEVELOPMENTS
6.3.1 FCEVs Today
While some automakers have shifted their fuel cell development efforts entirely to MHDV applications for the near term,2 both automakers and hydrogen suppliers have expressed that increased focus on MHDV FCEVs will help build up a refueling infrastructure that will make hydrogen more available and less costly, facilitating more widespread deployment of light-duty FCEVs in the future. Three automakers—Honda, Hyundai, and Toyota—have introduced light-duty FCEVs for sale or lease in places where government-industry partnerships are building a network of hydrogen refueling stations, namely California, parts of Europe, South Korea, and Japan. In some
___________________
2 For example, Daimler recently announced it will end light-duty FCEV development and phase out production of its F-Cell vehicle (Automotive News Europe, 2020) to focus on MHDVs (Daimler Truck AG, 2020).
TABLE 6.1 A Summary of Commercial Light-Duty FCEVs in the United States
 |
 |
 |
||||||||||
|---|---|---|---|---|---|---|---|---|---|---|---|---|
| Honda Clarity | Hyundai Nexo Limited | Hyundai Nexo Blue | Toyota Mirai | |||||||||
| Vehicle Information | ||||||||||||
| Model Year | 2020 | 2020 | 2020 | 2020 | ||||||||
| Vehicle Class | Medium | CUV | Small SUV | Medium | ||||||||
| Horsepower | 174 | 161 | 161 | 151 | ||||||||
| 0–60 (sec) | 8 | 8 | 8 | 9 | ||||||||
| Range (miles) | 360 | 354 | 380 | 312 | ||||||||
| Fuel Economy (mi per kg H2) comb/city/hwy | 66 | 67 | 66 | 56 | 53 | 58 | 60 | 64 | 66 | 66 | 65 | 66 |
| Fuel Economy (MPGE) comb/city/hwy | 68 | 68 | 67 | 57 | 59 | 54 | 61 | 65 | 58 | 67 | 67 | 67 |
| Cost | $379/mo lease | $62,185 MSRP | $58,735 MSRP | $58,550 MSRP | ||||||||
| Fuel Cell System Warranty | 8 yrs/100,000 mi | 10 yrs/100,000 mi | 10 yrs/100,000 mi | 8 yrs/100,000 mi | ||||||||
| Incentives | 3 yrs/$15,000 complimentary fuel | 3 yrs/$13,000 complimentary fuel | 3 yrs/$13,000 complimentary fuel | 3 yrs/$15,000 complimentary fuel | ||||||||
| U.S. Availability | California (lease only) | California | California | California and Hawaii | ||||||||
| Powertrain Components | ||||||||||||
| Fuel Cell System Max Power | 103 kW | 95 kW | 95 kW | 114 kW | ||||||||
| Battery | 346 V Li Ion | 240 V Li Ion | 240 V Li Ion | 245 V NiMH | ||||||||
| Motor | 130 kW Permanent | 120 kW Permanent | 120 kW Permanent | 112 kW Permanent | ||||||||
| Magnet AC | Magnet AC | Magnet AC | Magnet AC | |||||||||
| Synchronous | Synchronous | Synchronous | Synchronous | |||||||||
NOTE: CUV: crossover utility vehicles; SUV: sport utility vehicle.
SOURCE: Photos are from FCHEA (n.d.). Data are from fueleconomy.gov and automaker/vehicle websites.
cases, the automakers themselves, in addition to energy companies and gas suppliers, have invested in hydrogen refueling stations to support the introduction of FCEVs.
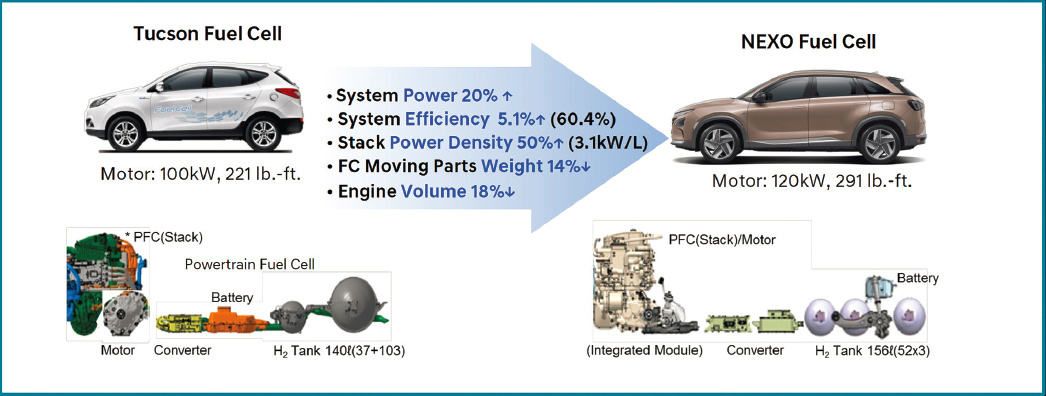
Table 6.1 provides information on the powertrain components and other characteristics of the 2020 FCEVs currently available—Honda Clarity, Hyundai Nexo, and Toyota Mirai. These vehicles demonstrate several improvements over first-generation FCEVs: increased efficiency and power density, reduced size, and increased driving range. Figure 6.5 provides an example of fuel cell powertrain improvements, showing data for Hyundai’s Nexo over its predecessor, the lease-only Tucson (Seredynski, 2018). In addition to improving the fuel cell stack materials and design, Toyota was able to reduce the size and weight of the fuel cell system from its previous FCEV model by employing a direct current (DC)-DC boost converter to step up the voltage from the fuel cell and increase the voltage of the motor (Green Car Congress, 2015). Many automakers that are focusing on MHDV applications are working on a variety of designs, including delivery trucks, municipal vehicles, and long-haul trucks.3 Rather than
___________________
3 DHL (Plug Power, 2019), FedEx (Galbach, 2020), and UPS are testing fuel cells to extend the range of their battery-electric delivery vans and/or trucks (Luth, 2019). The UPS trucks use a 45 kWh battery with a 32 kW fuel cell that continuously charges the battery, extending the vehicle’s range from around 60 miles to 125 miles (UPS, 2017). Toyota is demonstrating fuel cells in heavy-duty freight handling trucks at the Port of Los Angeles and Long Beach (Toyota USA Newsroom, 2019a). Hyundai has announced plans to begin testing fuel cell trucks in Switzerland in September 2020. The truck is powered by a 190 kW fuel cell drive system using two 95 kW stacks; seven onboard compressed hydrogen tanks will provide enough fuel for an estimated 400 km (~ 248 mile) range (Hampel, 2020).
SOURCE: Republished with permission of SAE International, from P. Seredynski, 2018, 2019 Hyundai Nexo: Fuel-Cell Refinement, SUV Luxury, SAE International Online, November 13; permission conveyed through Copyright Clearance Center, Inc.
curtailment of wind and solar in times of resource excess, electrolysis can take advantage of excess electricity supply and make green hydrogen a cost-effective form of energy storage.4
6.3.1.1 FCEV Performance and Cost
Consumer Reports, Car and Driver, and MotorTrend describe driving performance and road handling in the Clarity, Mirai, and Nexo as similar to that of a BEV and typical of front-wheel drive vehicles—smooth, quiet, and responsive, although with a lower acceleration of 0 to 60 mph in 8–9 seconds (Consumer Reports, n.d.; MotorTrend, 2017; Car and Driver, 2019). Toyota’s move to rear-wheel drive in the 2021 model, together with aerodynamic enhancements, is expected to improve the Mirai’s acceleration, road handling, and range (Toyota USA Newsroom, 2019b).
Improvements in FCEV fuel economy and cost depend on technology progress, particularly reducing the size and weight of the fuel cell and hydrogen storage systems and increasing the efficiency of the fuel cell system. Technology progress is being driven by the automakers and the fuel cell industry as well as other R&D efforts conducted largely in the United States, Europe, Japan, Korea, and China. Through U.S. DRIVE,5 the DOE has set technical and cost targets in collaboration with industry, periodically updating and revising the targets and their time frames based on technology progress and available R&D funding. For example, vehicle simulation studies conducted by Argonne National Laboratory (ANL) (using the Autonomie model6) project that, while improvements in batteries, energy management, and lightweighting will help, fuel cell system improvements are needed to significantly increase vehicle fuel efficiency, and that achieving DOE fuel cell targets can lead to fuel savings of about 40% by 2030 on the U.S. Environmental Protection Agency (EPA) combined driving cycle (Kim et al., 2016) when compared to the 2015 reference case technology (model year [MY] 2020 FCEV). Materials and com-
___________________
4 The start-up company Nikola has announced its plans to build fuel cell pickup trucks and semi-trucks, including a fleet for Anheuser Busch to be delivered by 2025, and plans to build renewable hydrogen refueling stations to support the delivery fleet (O’Dell, 2018). The company plans to use excess wind and solar energy that would otherwise be curtailed to make hydrogen via electrolysis.
5 U.S. DRIVE (Driving Research and Innovation for Vehicle efficiency and Energy sustainability) is a voluntary, non-binding, and nonlegal partnership among DOE; USCAR, representing Chrysler Group LLC, Ford Motor Company, and General Motors; Tesla Motors; five energy companies—BP America, Chevron Corporation, Phillips 66 Company, ExxonMobil Corporation, and Shell Oil Products US; two utilities—Southern California Edison and DTE Energy; and the Electric Power Research Institute.
NOTE: Today’s commercial vehicles have even higher fuel economies. For comparison, EPA combined fuel economy ratings for today’s production FCEVs are considerably higher: 68, 61, and 67 mi/kg for the Clarity, Nexo, and Mirai, respectively.
SOURCE: NREL (2016).
ponent R&D efforts focused on reducing fuel cell system size, weight, and cost will also drive increases in fuel cell efficiency. Improvements in fuel cell materials may enable modifications to BOP and other vehicle components, leading to reduced vehicle size and weight. For example, a more efficient fuel cell stack may require less cooling and a smaller radiator, leading to less drag and greater fuel economy.
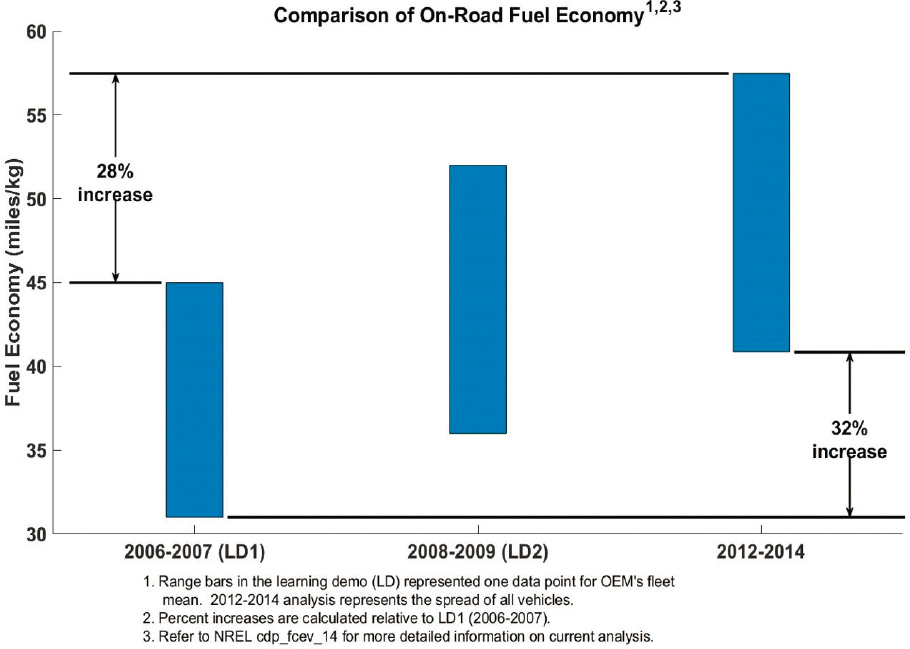
Figure 6.6 shows on-road fuel economy trends for a precommercial FCEV fleet monitored through the National Renewable Energy Laboratory (NREL) FCEV Learning Demonstration (Wipke et al., 2012). It does not include commercial FCEVs on the road today. The data indicated an approximately 30% increase in average on-road fuel economy, calculated from on-road fuel cell stack current, for the Learning Demonstration fleet from 2006 through 2014 vehicles, ranging from 31–45 miles per kilogram (mi/kg) hydrogen for Gen 1 vehicles and 36–52 mi/kg hydrogen for Gen 2. Today’s EPA combined fuel economy ratings for FCEVs are considerably higher: 68, 61, and 67 mi/kg for the Clarity, Nexo, and Mirai, respectively (EPA, 2019).
ANL Autonomie vehicle simulation studies, also based on fuel cell technologies meeting established targets, project that by 2030 the FCEV total cost of ownership (TCO) will decrease to 43 cents per mile, comparable to conventional internal combustion engine (ICE) vehicles (Vijayagopal et al., 2017). Deloitte China has revealed similar TCO trajectories for U.S., European, and Chinese markets (Deloitte China, 2020). Another study using Autonomie looked at the TCO of BEVs and FCEVs in different LDV classes from 2020 through 2040, and the fraction of vehicle owners in those classes, to project potential market sizes (Morrison et al., 2018). The study, which assumed that an affordable hydrogen refueling infrastructure will be available, projected that FCEVs may have a cost advantage over BEVs for larger vehicles like passenger vans and sport utility vehicles (SUVs), while BEVs may have a cost advantage for smaller vehicles like compacts and midsize sedans. A key factor in the Morrison et al. (2018) study is mass compounding—as the capacity of the powertrain increases, the mass of the glider and other vehicle components
increases, such that a greater fraction of that capacity is eventually used to move the mass of the powertrain rather than the mass of vehicle, passengers, and cargo, leading to a nonlinear relationship between vehicle cost and range. Mass compounding in FCEVs has less of an impact than in BEVs, especially in heavier vehicles, because the fuel cell powertrain has a higher energy density.
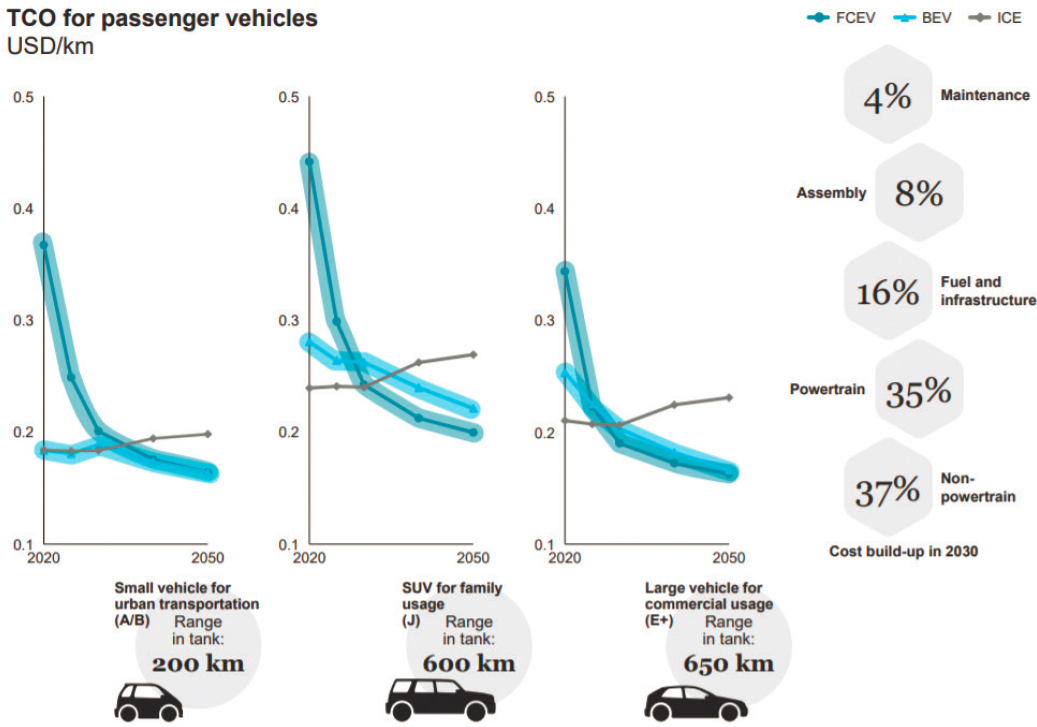
Another recent analysis by the McKinsey Center for Future Mobility for the Hydrogen Council also suggests that FCEVs will likely be the lower cost option for decarbonization of heavy-duty trucks, long-distance buses, and large passenger vehicles with long ranges, achieving cost parity with BEVs in those applications in the 2030 time frame (Hydrogen Council, 2020). The analysis for passenger vehicles shown in Figure 6.7 suggests that FCEVs will be more cost competitive in vehicles with heavier use and longer-range requirements, such as large passenger cars, SUVs, and taxi fleets. The study also points out that some drivers of smaller vehicles may be willing to pay for the increased flexibility provided by the longer range and quicker refueling of the FCEVs.
Other studies are less optimistic about FCEVs achieving cost parity in the 2030 time frame. To assess the status and expected future cost and performance of automotive PEM fuel cells, in 2017 Carnegie Mellon University (CMU) led an expert elicitation assessment of fuel cell system cost, stack durability, and stack power density under DOE’s high-volume production scenario of 500,000 units per year (Whiston et al., 2019). The study included 39 experts from academia, government, and industry, who assessed the median 2017 automotive cost to be $75 per kilowatt (kW), stack durability to be 4,000 hours, and stack power density to be 2.5 kilowatts per liter (kW/L). For comparison, DOE cited the 2017 status to be $53/kW, 3,900 hours, and 3.0 kW/L, respectively. (It should be noted that Toyota and Honda reported a stack power density of 3.1 kW/L, more in line with the DOE status.) The experts
SOURCE: Hydrogen Council (2020).
in the CMU study ranged widely in their assessments—from $40 to $500/kW for cost, from 1,200 to 12,000 hours for durability, and from 0.5 to 4 kW/L for power density—demonstrating the difficulty in assessing performance and cost of technologies still under development. When asked to project into the future, many experts expected that DOE’s ultimate targets of $30/kW and 8,000 hours durability would be achieved by 2050, and 3 kW/L power density by 2035. The study identified high platinum group metal (PGM) loading as the most significant barrier to reducing fuel cell cost, followed by membranes and BPs. The experts also noted the uncertainty of reaching production volumes of 500,000 units/year in the near term, citing the learning required to manufacture at that scale. As described later in this chapter, DOE’s fuel cell R&D activities are heavily focused on reducing or eliminating PGM content and developing improved membranes. DOE supports BP R&D to a lesser extent, and support for fuel cell manufacturing R&D has been relatively low or nonexistent.
As FCEVs advance, and high-volume manufacturing capability is developed, the availability of real-world data will enable more certainty in the status and projections for fuel cell technology. To that end, Hyundai announced in February 2020 that it will provide DOE with five Nexo FCEVs (Hyundai Motor Group Newsroom, 2020), enabling DOE to collect, analyze, and publish data regarding fuel cell performance, durability, and reliability.
6.3.1.2 FCEV Energy Management
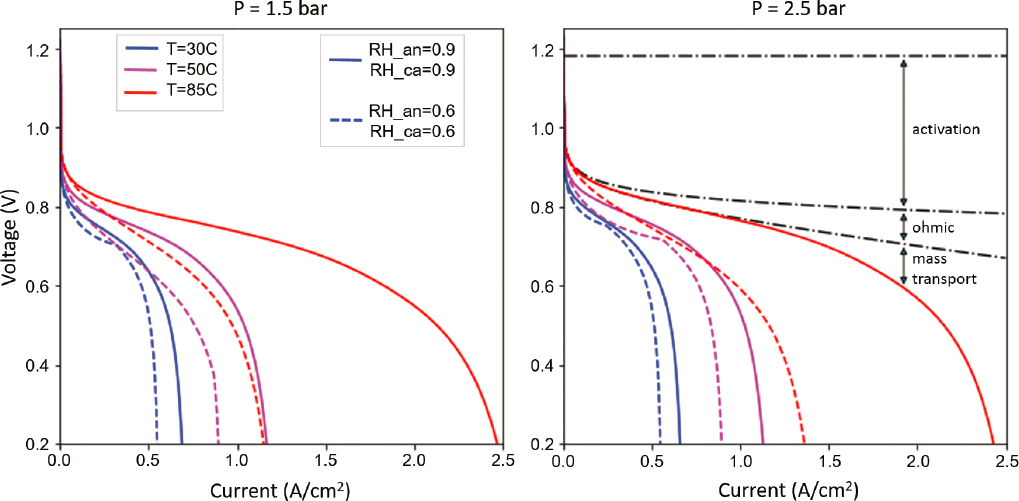
Fuel cell voltage is dependent on operating conditions such as temperature, pressure, applied load, and fuel/oxidant flow rates. The standard measure of performance for a fuel cell is the polarization curve (Figure 6.8), which indicates the cell voltage behavior as a function of current density (load).
The actual open circuit voltage of a fuel cell is lower than the theoretical value owing to fuel crossover through the electrolyte and internal currents. Other types of losses that cause voltage drops are as follows:
- Activation polarization, which dominates at low current densities, is owing to the voltage overpotential (typically, 0.1–0.2 V) required to overcome the activation energy of the electrochemical reaction on the catalyst surface and is largely driven by the slow kinetics of the oxygen reduction reaction (ORR).
SOURCE: Reprinted by permission from Springer Nature Customer Service Centre GmbH: Springer London, Encyclopedia of Systems and Control (Fuel Cell Vehicle Optimization and Control, Figueroa-Santos and Stefanopoulou), 2021.
- Ohmic polarization, which dominates at moderate power densities, is owing to ionic and electronic resistance in the fuel cell components—electrolyte, electrodes, and so on.
- Mass transport losses (also known as concentration polarization), which dominates at high current densities, is owing to mass transport losses from the decrease in reactant concentration at the surface of the electrodes as fuel is used.
As shown in Figure 6.8, decreases in fuel cell voltage depend on cell temperature, pressure, and relative humidity (RH) (Figueroa-Santos and Stefanopoulou, 2021). Within a three fuel cell system, these operating conditions are managed by BOP or auxiliary components—that is, compressor (or blower), humidifier, heat exchanger, and so on.
The total voltage of a fuel cell stack (Vst) is the product of the single cell voltage (Vfc) and the number of cells (Nfc) in series in the stack (Vst = VfcNfc). Fuel cell stack power (Pst) is the product of the fuel cell voltage (Vfc), fuel cell current (Ifc), and the number of cells (Nfc) in series in the stack (Pst = NfcVfcIfc). The net power of the fuel cell system (Pfc, net) is the stack power (Pst) minus the power required to operate the BOP components (Paux). Fuel cell stack efficiency (η) is the net power of the fuel cell stack (Pfc, net) divided by the energy value of hydrogen (EH2) consumed (η = Pfc, net/EH2). Thus, minimizing BOP power requirements and hydrogen consumption increases the efficiency of the fuel cell system. As described later in this chapter, R&D activities are focused on new materials to enable fuel cell system operation at lower RH, higher temperature, and lower pressure, with the aim of simplifying BOP requirements, increasing fuel cell system efficiency, and reducing costs. At the vehicle level, control strategies are critical to managing BOP operation to optimize fuel cell vehicle performance and minimize fuel cell and battery degradation (Figueroa-Santos and Stefanopoulou, 2021).
FCEV control strategies must manage several trade-offs to minimize voltage losses and optimize performance, while also keeping manufacturing and operating costs affordable. Hydrogen and air must be maintained at a certain stoichiometric ratio to ensure fuel cell efficiency. High hydrogen and air flow rates provide higher stack power density and efficiency but lower net power from the fuel cell system owing to the higher power consumption of the BOP components. High reactant flow control, if not fully humidified, may cause dehydration and subsequent degradation of the MEA. The fuel cell generates water at the cathode that helps self-humidify the MEA at the end of the cathode channel, but cannot support the dry channel entry unless there is external air flow humidification. The anode self-humidification is achieved via water diffusion to the anode side through the membrane and cross-flow configuration. The temperature of the fuel cell also needs to be controlled, typically 60°C–80°C—too high can cause MEA dehydration, shrinkage, pinholes, and cracks. The humidity of the reactants needs to be controlled to keep the membrane hydrated and enable water distribution that avoids dehydration or flooding, both of which increase ohmic voltage losses.
Fuel cell power is regulated using DC/DC converters, as the voltage changes in response to the load. A converter controls the power split and can be used to avoid abrupt transients or changes in fuel cell power demand to avoid fuel cell degradation. To obtain the highest energy efficiency (and minimize hydrogen consumption), the fuel cell system under dynamic load must be operated close to the maximum efficiency point during most of the fuel cell operation. This is typically accomplished by using full-fuel-cell system optimization or an extremum-seeking controller (Bizon, 2017; Zhou et al., 2017). PEM fuel cell efficiency increases to a maximum around 60% in the low to medium range of fuel cell power (typically, near 20% of peak power)—that is, at part load where most driving takes place—and then drops in the high-power region of fuel cell operation.
Fuel cells operate most effectively at constant load. When the load (current) on a fuel cell is changed, the heat and water balance change and it takes time for the fuel cell to reach a new equilibrium point. These changes can lead to catalyst and MEA degradation and reduced fuel cell durability. Hence, FCEVs are typically hybridized with a battery to improve the system durability and powertrain lifetime by reducing the fuel cell’s exposure to transients and high current spikes and to repeated startup and shutdown cycles.
FCEV energy management strategies are important to provide the performance characteristics that drivers demand and also to optimize the durability of the fuel cell system and hybrid battery. Over the past 10 years, original equipment manufacturers (OEMs) and others have ramped up studies on the effects of transients and stop-start sequences on fuel cell performance and durability, examining stack failure modes owing to mechanical and chemical membrane degradation, voltage loss during operation, and corrosion of catalysts and support materials, with the
aim of developing control strategies to mitigate these effects (Eberle et al., 2012). For example, in its HydroGen4 demonstration fuel cell vehicle, General Motors observed that dynamic loads caused humidity transients from 10% RH to greater than 100% (liquid water), leading to significant expansion and contraction of the membrane. Such repeated membrane structural changes create mechanical stresses that can cause microscopic cracks and lead to crossover of reactants, deteriorating performance, and eventually failure of the fuel cell system. Studies also show that voltage cycling leads to a loss of the electrochemically active surface area (ECSA) of the platinum catalyst, which is correlated to an increase in activation overpotential (Ahluwalia et al., 2020a). The ECSA loss increases exponentially at the upper potential limit and with temperature, and linearly with humidity and dwell time at the upper potential limit (Kneer, 2019). Degradation mechanisms and failure modes occurring during idle and stop-start cycles have also been examined (Eberle et al., 2012).
The results of fuel cell transient studies are used to design operating strategies to minimize catalyst and membrane degradation and increase fuel cell lifetime under load cycling, and during idle, start-up, and shutdown. Fuel cell and battery operations can be controlled to limit high potentials on the fuel cell, with the fuel cell system serving primarily as a low dynamic power source and the battery (or ultracapacitor) providing quick response needs. However, the power split must also consider the battery state of charge to prevent overdischarging or overcharging the battery. FCEV batteries must be capable of accommodating increased current and storing energy generated by the fuel cell. Control strategies that provide the optimal power split between the fuel cell and battery are needed to enable optimized performance and reliability in FCEVs, and to minimize cost.
Several review articles have surveyed many different FCEV control strategies that have been proposed, and described their pros and cons. Assessments address characteristics such as ease of implementation, computational complexity/cost, and responsiveness to real-time driving conditions (Yue et al., 2019). Dijoux et al. (2017) describe the state of the art in fault-tolerant control strategies, in which fault diagnostics are used to trigger corrective control actions. Hames et al. (2018) identified the most common control strategies to be peaking power source strategy, operating mode control strategy, fuzzy logic control strategy, and equivalent consumption minimization strategy (ECMS), stating a preference for ECMS owing to its simplicity and its ability to minimize hydrogen consumption and enable high-level FCEV performance (Hames et al., 2018; Kaya and Hames, 2019). In addition to ECMS, Figueroa-Santos and Stefanopoulou (2021) include descriptions of rule-based control strategies, dynamic programming, Pontryagin’s minimum principle, model predictive control, and machine learning. Song et al. (2018) point out that a single energy management strategy cannot adequately address the complexity of real-world driving conditions and propose a multimode control strategy, including one based on pattern recognition.
Control strategies used in today’s commercial FCEVs are proprietary; therefore, it is unclear which of the strategies is most common. General Motors described the successful implementation of individual control actions that significantly improved fuel cell stack durability in its precommercial HydroGen4, including standby mode (i.e., turning off the fuel cell system), voltage-suppression and oxygen-depletion, hydrogen injection during long off-times, and an automated stack recovery procedure (Eberle and von Helmolt, 2010). Toyota has also described control methods such as reducing air compressor power at low loads to increase fuel economy in the 2017 Mirai (Hasegawa et al., 2016). To better understand FCEV operation and assist development of energy management strategies, ANL performed a technology assessment of the 2017 Toyota Mirai (see Figure 6.9), correlating fuel cell system parameters and operation to outputs on varying drive cycles and over a wide range of temperatures (Lohse-Busch et al., 2018).
In collaboration with General Motors, ANL’s modeling and analysis efforts are also providing input for design of FCEV control strategies by examining thermal and water management issues, design-point and part-load operation, efficiencies, and fuel economies (Ahluwalia et al., 2020b). Their recent efforts have identified compressor-expander operating conditions and coolant exit temperatures that will limit ECSA loss to levels that enable the U.S. DRIVE LDV fuel cell electrode durability of 8,000 hours to be achieved. The fact that many automakers are adding a focus on development of medium- and heavy-duty FCEVs, which have a durability target of 30,000 hours (Adams, 2020), suggests confidence in developing energy management strategies to enable significant improvements in fuel cell durability for mobile applications in 2025–2035.
To decrease the cost of FCEVs, the sizing and selection of the BOP components will need to be considered along with mitigating fuel cell degradation and reducing auxiliary losses (Wu et al., 2020). Additional cost savings will come from sizing the fuel cell, hydrogen storage tank, and battery for various drive cycles (Sundström and
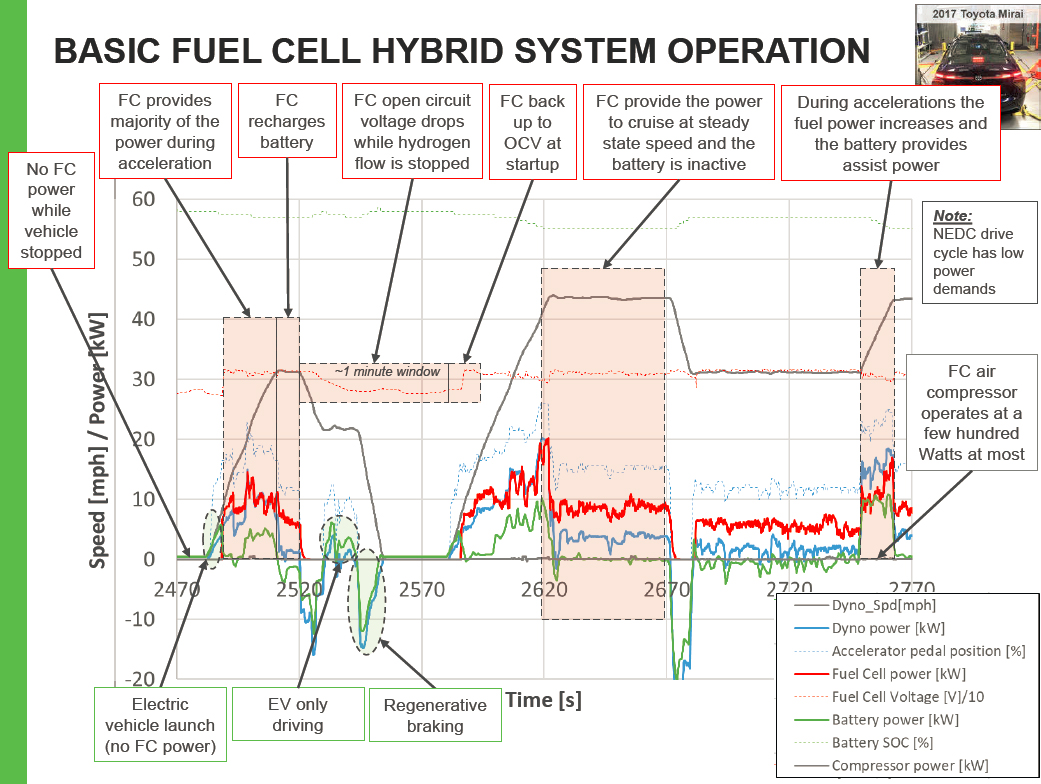
NOTE: OCV is open circuit voltage—a figure of merit for fuel cells, defined as the maximum operating voltage of the fuel cell, which occurs when no current is flowing (i.e., when no load is applied).
SOURCE: Lohse-Busch et al. (2018).
Stefanopoulou, 2007; Jiang et al., 2019). Current studies on optimizing components to minimize cost of ownership for fuel cell-powered trucks offer insights as well (Sim et al., 2019). Connectivity and automation will allow even higher efficiency gains for these advanced powertrains (Kim et al., 2020).
Plug-In Fuel Cell Vehicles
Plug-in fuel cell vehicles (PFCVs) have been explored as an approach to combine the best features of BEVs and FCEVs and mitigate the shortcomings. PFCVs have a moderately sized battery to provide some all-electric range, and a hydrogen fuel cell system (including hydrogen tank) smaller than that in a pure FCEV to extend the vehicle’s driving range and enable quick refueling. PFCVs can recharge with electricity from the grid and/or refuel with hydrogen from a refueling station. The advantages over a gasoline plug-in hybrid electric vehicle (PHEV) are increased efficiency and zero tailpipe emissions. Studies suggest that a combination of low power fuel cells and high energy batteries is optimal in terms of manufacturing cost and environmental benefits (Fox et al., 2012; Lane et al., 2017). A 2017 case study based in California determined that PFCVs would require significantly fewer hydrogen refueling stations than FCEVs and put less strain on the electric grid than BEVs (Lane, 2017). The study
determined that PFCVs with 40 miles electric-only range provided the highest efficiency of any alternative vehicle, the lowest well-to-wheels (WTW) GHG emissions, and the lowest infrastructure costs if limited to Level 1 charging.
There are no PFCVs commercially available today. Ford developed one of the first in 2008, the HySeries PFCV, which had a fuel cell system that was about 60% of full size (Ford Edge HySeries—Ford, 2008). In 2014, Audi announced its sporty A7 h-tron quattro concept car, powered by a hydrogen fuel cell and an 8.8 kWh Li-ion battery pack—the same pack used in the Audi A3 Sportback e-tron plug-in hybrid (Edelstein, 2014; Rügheimer, 2014). The battery, which could be recharged from the grid or through regenerative braking, provided up to 31 miles of electric-only range, and four hydrogen storage tanks provided 310 miles of vehicle range. Audi recently announced that it was increasing investment in FCEVs, with pilot production planned in 2021 and larger scale production in the late 2020s; however, the company provided no details on the types of vehicles (Goodwin, 2019).
Daimler developed the Mercedes-Benz GLC F-CELL in 2013—a PFCV with a 13.5 kWh battery (9.3 kWh net) and a fuel cell stack that was about 30% smaller than that in the Mercedes B Class F-CELL, their pure FCEV (Green Car Congress, 2018a,b). A 7.2 kW onboard charger enabled full recharging from a standard, residential power socket in around 1.5 hours. Several GLC F-CELL vehicles were sold for promotional purposes; however, Daimler canceled plans to begin leasing the F-CELL when it shifted focus to fuel cells for MHDVs in 2020. In fact, using fuel cells as range extenders in battery-powered MHDVs has gained significant traction (Sturgess, 2017). Toyota, UPS, FedEx, and others are currently testing fuel cell as range extenders in drayage and delivery trucks, for example (Hanlin, 2019). Swedish company myFC is developing scalable, modular systems that combine batteries, hydrogen fuel cells, and “power balancing technology” for plug-in hybrid applications (Lawrence, 2020).
A 2013 study suggests that PFCVs could be particularly competitive during the near term when hydrogen availability and, to some extent, recharging availability are low by providing drivers with two options for refueling their vehicles: extended range relative to BEVs, and reduced energy costs compared to pure FCEVs (less hydrogen is required) and ICE PHEVs (due primarily to increased vehicle efficiency and partly to the hydrogen subsidy) (Lin et al., 2013). As discussed in FCEV energy management strategies, optimizing the sizing of the fuel cell, hydrogen storage tank, and battery is key to maximizing PFCV performance and durability, and minimizing cost of ownership.
6.3.1.3 FCEV Safety
Safety concerns around FCEVs are related to the use of hydrogen generally, and high-pressure hydrogen in particular, especially in the event of a collision. In the United States, FCEVs are required to pass the same Federal Motor Vehicle Safety Standards (FMVSS) crash tests as ICE vehicles. Global Technical Regulation (GTR) No. 13, an agreement among Japan, Europe, and North America, sets the safety requirements for the integrity of onboard compressed and liquid hydrogen storage systems, including tests for pressure cycling, burst, permeation, and bonfire that are more stringent than the FMVSS No. 304 requirements for compressed natural gas tanks. In fact, the Hyundai Nexo FCEV earned a Top Safety Pick+ award from the Insurance Institute for Highway Safety (IIHS-HLDI, 2019).
Phase I of GTR 13, established in 2013, specifies that each participating country will use its existing national crash tests (GlobalAutoRegs, n.d.). GTR 13 Phase II, expected to be finalized by the end of 2020, will harmonize FCEV crash test requirements internationally with the goal of creating global standards (United Nations Economic and Social Council, 2017).
As mentioned previously, some automakers and hydrogen suppliers had announced plans to introduce FCEVs and hydrogen stations in Northeast states in 2016. However, as of this writing FCEVs remain prohibited from the tunnels and lower tier of double-deck bridges in Massachusetts, New York, and New Jersey (Port Authority of NY and NJ, 2016; State of New Jersey, 2019; Massachusetts Department of Transportation, 2019).7 In 2017, Sandia National Laboratories completed an FCEV tunnel safety study to address a lack of data on this topic and to
___________________
7 An alternative fuel vehicle powered by propane or natural gas may use Port Authority of NY and NJ tunnels and the lower level of the George Washington Bridge if the vehicle conforms to applicable federal regulations and industry standards, displays required markings to identify its alternative fuel system, and has a fuel capacity that does not exceed 150 pounds (AFDC, n.d.b.).
determine the risks and implications of traffic incidents in tunnels involving hydrogen fuel cell vehicles (La Fleur et al., 2017). The study included a risk analysis that examined a number of different tunnel configurations and crash scenarios and determined that hydrogen-fueled FCEVs are unlikely to pose additional hazards relative to other LDVs. In most scenarios examined, hydrogen is not released or does not ignite. The study determined that, in scenarios where hydrogen does ignite, the most likely result is a jet flame from the release of hydrogen through the thermally activated pressure relief device owing to the heat from an accident-related hydrocarbon fire. Where assumptions had to be made, the most conservative assumptions were used to ensure that the worst cases were analyzed. For example, a six-fold overestimate of hydrogen release was used in the models to increase the heat released by the jet flame and the height of the flame; hence, the study noted, observed temperatures should be lower than those predicted by the models. The analysis determined that the jet flame could cause localized concrete spalling where it hits the tunnel ceiling, which is not expected to occur with ventilation. With or without ventilation, the structural epoxy and steel structure of the tunnel would not be compromised.
To address follow-up questions regarding FCEV safety in tunnels and to assist highway tunnel officials, Sandia National Laboratories recently published two additional safety reports—one providing a comprehensive overview of studies related to the safety of alternative fuel vehicles (AFVs) within tunnels (La Fleur et al., 2020), and one providing the same for FCEVs (Glover et al., 2020). The reports also identify knowledge gaps to guide future safety research efforts and to enable a complete hazard analysis and recommendations for the safe use of AFVs in tunnels. The European Union’s HyTunnel-CS project is expected to address some of the research gaps for FCEVs in tunnels and confined spaces, with the goal of enabling hydrogen vehicles entering underground environments to present no more risk than fossil-fueled vehicles. One task in the HyTunnel-CS project will develop engineering solutions to prevent and mitigate accidents involving hydrogen releases (HyTunnel-CS, 2019).
In 2019, the American Institute of Chemical Engineers, in collaboration with DOE, launched the Center for Hydrogen Safety (CHS) to promote hydrogen safety and best practices worldwide. The CHS provides information and tools on the safety aspects of hydrogen and fuel cell technologies and resources to those designing, approving, or using hydrogen systems and facilities, or responding to hydrogen incidents.
6.3.2 FCEV Plans
Hyundai and Toyota have been the most active in the commercialization of light-duty FCEVs, with both automakers recently stating their plans to ramp up production. Hyundai has announced plans to add production capacity for 500,000 FCEVs per year by 2030 (Hyundai USA, n.d.). Toyota recently announced that it is increasing FCEV production capacity to 30,000 vehicles per year for worldwide sales (Eisenstein, 2020). In 2019, the company announced that it will release its second generation Mirai for MY 2021, stating that the vehicle will have 30% more driving range (∼400 miles) owing to increased hydrogen storage capacity and enhanced fuel cell performance (Toyota USA Newsroom, 2019b). For the 2021 Mirai, Toyota is switching from a front-wheel drive platform to rear-wheel drive and introducing a sleeker design for improved aerodynamics. In 2019, Toyota released almost 24,000 patents, royalty-free, to help accelerate the deployment of FCEVs (Toyota USA Newsroom, 2019a).
Other automakers are planning later FCEV deployments. BMW, for example, announced that it is looking to 2025–2030 for introducing commercial FCEVs, basing the decision on projections from other automakers that fuel cell cost will be equivalent to that of conventional technology in that time frame (Crosse, 2020). At the 2019 Frankfurt Motor Show, BMW unveiled its i Hydrogen NEXT SUV, which uses a Toyota-based fuel cell powertrain, and announced that the SUV will enter limited production in 2022, with 2025 the earliest target year for offering the vehicle to customers (BMW Group, 2019).
Figure 6.10 provides estimated commercialization timelines for FCEVs and other hydrogen applications based on a survey conducted by McKinsey and Company and analyses conducted by the Hydrogen Council.8 As discussed throughout this chapter, improvements in the cost and performance of fuel cell and hydrogen technologies are needed for widespread commercialization.
___________________
8 The Hydrogen Council is a group of chief executive officers leading global businesses in energy, transportation, and related industries with significant investments in the development of hydrogen and fuel cell systems and markets.
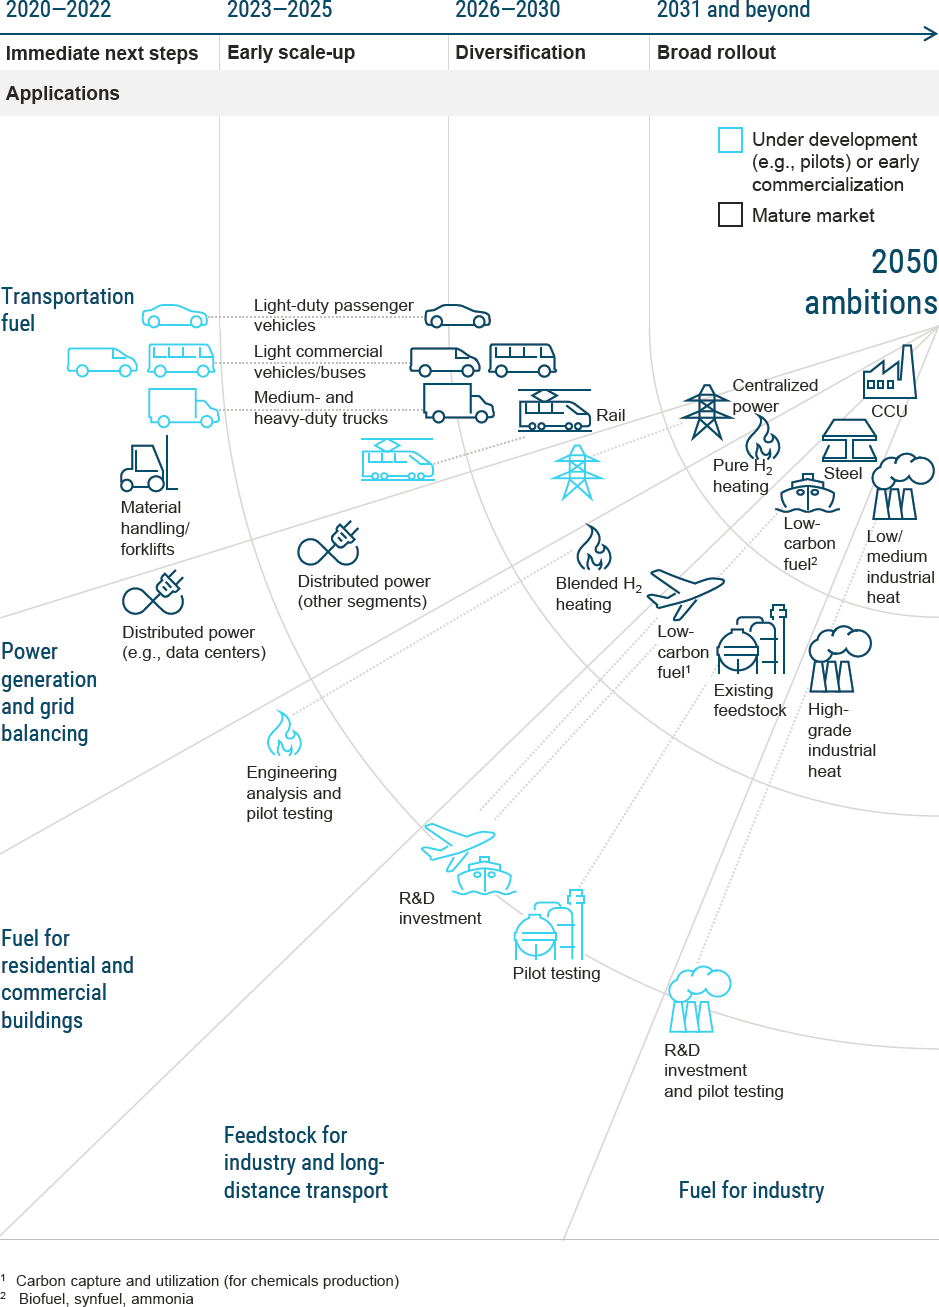
SOURCE: FCHEA (2020).
SOURCE: Padgett and Kleen (2020).
6.4 FCEV TECHNOLOGY R&D
For widespread deployment of FCEVs, further reductions in the costs of fuel cell and hydrogen storage systems are needed, while increasing fuel cell durability and maintaining or improving system performance. Key metrics for automotive fuel cell systems include energy efficiency, power density (volumetric) and specific power (gravimetric), durability, and cost. High specific power and power density are important for transportation applications, to minimize the weight and volume of the power system, respectively, as well as the cost. There is significant worldwide investment in fuel cell and hydrogen R&D, most notably in the United States, Europe (Germany in particular), Japan, Korea, and China. In many cases, researchers look to the U.S. DOE technology targets, established in collaboration with industry, to guide development efforts (U.S. DRIVE, 2017a).
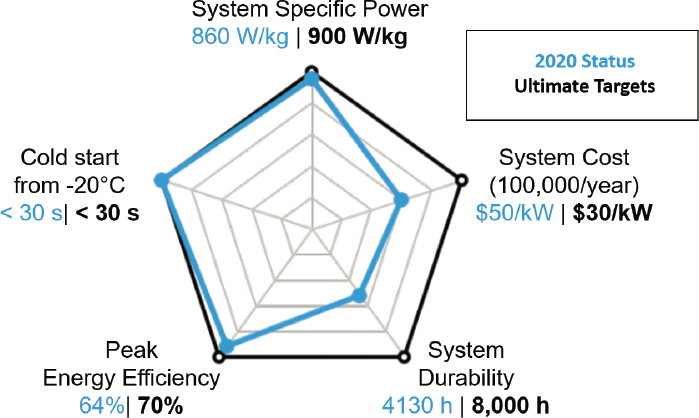
The status of automotive fuel cell systems relative to the ultimate DOE targets is shown in the spider chart in Figure 6.11. As indicated, improvements are needed in fuel cell system peak efficiency and power density, and particularly in cost and durability (U.S. DRIVE, 2017a).
Cost.
The DOE cost target for automotive fuel cell systems is $30 per kWnet at an annual production capacity of 500,000 units. In a design for manufacture and assembly (DFMA) analysis conducted for DOE, the modeled cost of an 80 kWnet power automotive PEM fuel cell system based on next-generation laboratory technology is projected to be $45 per kWnet at a volume of 500,000 units per year (James et al., 2018). This projected cost is based on an analysis of state-of-the-art components that have been developed and demonstrated at a laboratory scale through the DOE Hydrogen and Fuel Cell Technologies Office,9 and reflects a 67% decrease since 2006 (see Figure 6.12). The latest cost reductions have come primarily from (1) use of a platinum-cobalt catalyst on high surface area carbon that led to increased power density, (2) reduction in platinum loading on the cathode, and (3) an improved BP stamping process.
This DFMA cost analysis is meant to provide a benchmark for informing early-stage R&D efforts focused on reducing fuel cell materials and manufacturing costs. Because long-term durability data for automotive fuel cells is lacking, this cost analysis is for a model system meeting beginning-of-life performance requirements. These cost estimates are also for technologies in the pipeline but not yet commercial; therefore, they do not take into account
___________________
9 The DOE Fuel Cell Technologies Office recently changed its name to the Hydrogen and Fuel Cells Technologies Office.
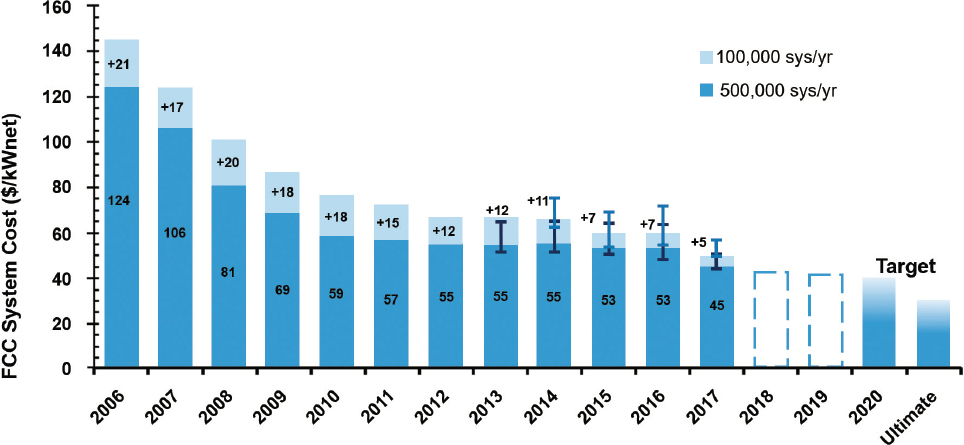
SOURCE: James et al. (2018).
some of the strategies used by automakers to ensure sufficient fuel cell durability to meet powertrain warranties in commercial FCEVs today. This will be discussed in more detail in the next section on durability.
A breakdown of PEM fuel cell stack cost, shown in Figure 6.13, indicates that the catalyst is the largest cost component at both low and high volumes. This drives the continued focus on reducing or eliminating the use of platinum catalysts. For PGM-based catalysts, research is focused on both decreasing PGM loading and increasing
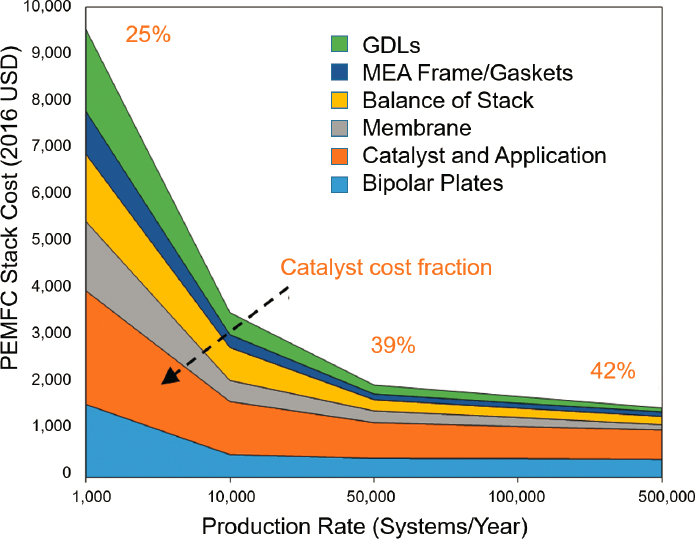
SOURCE: Papageorgopoulos (2019).
MEA power density to reduce material costs. Current state-of-the-art MEAs with very low PGM loadings experience a reduction in performance when operating at high power. Commercial fuel cells are expected to use PGM-based catalysts in 2025–2035; however, some experts believe that a transition to PGM-free catalysts is needed for FCEV cost competitiveness in the longer term.
The balance of plant (BOP) system is projected to represent more than 60% of the cost of a 2025 automotive fuel cell system at a production rate of 500,000 systems per year, with the air loop responsible for 50% of the BOP cost. This is largely owing to the cost of the compressor-expander-motor (CEM) unit, as current automotive fuel cell systems operate at around 2.5 bar. With current fuel cell materials, operation above 2 bar is necessary to achieve high fuel cell stack efficiency and high power density, and to manage membrane humidification requirements. BOP issues and alternative membrane materials will be discussed later in this chapter.
According to the aforementioned DFMA analysis conducted for DOE, expected advances in materials, design, and manufacturing could reduce projected fuel cell system costs to approximately $42 per kWnet in 2020 and $37 per kWnet in 2025, when manufactured at a volume of 500,000 units per year. The projected economies-of-scale impact for a 2025 automotive fuel cell system ranges from approximately $155 per kWnet to $65 per kWnet to $35 per kWnet for annual production rates of 1,000, 10,000, and 1 million, respectively.
Durability and its impact on cost.
DOE originally set a target of 5,000 hours durability for automotive fuel cell systems, which corresponds to an expected lifetime of 150,000 miles driven within a particular range of speeds. In 2016, based on industry feedback, the ultimate durability target was increased to 8,000 hours to enable 150,000 miles for typical drivers on lower average speed drive cycles, such as city driving (Wilson et al., 2016). There is no publicly available fuel cell durability data from automakers, and it is extremely difficult to obtain long-term durability data from laboratory fuel systems. Therefore, DOE relies on precommercial vehicles being tested in NREL’s demonstration program. The maximum number of operating hours recorded for a single FCEV in an NREL demonstration was 5,600 hours, recorded in 2015 (Kurtz et al., 2016; Kurtz et al., 2017). The warranty period currently provided by automakers for the fuel cell components in commercial FCEVs for MY 2020 is 100,000 miles (Table 6.1).
Fuel cell durability more than doubled versus precommercial FCEVs over the 9-year period from 2006 to 2015. While the interim target of 5,000 hours durability seems within reach, another doubling of current durability is required to reach the 8,000-hour target. In today’s commercial FCEVs, automakers employ approaches to ensure that fuel cell durability is sufficient to enable competitive powertrain warranties, such as high loadings of PGM catalysts, corrosion-resistant BP materials, and system control strategies that reduce fuel cell degradation—all of which add cost to the fuel cell system. Therefore, the cost of fuel cell systems in commercial vehicles today is higher than the DFMA-modeled cost estimates for state-of-the-art laboratory systems described in the preceding section.10 To address this issue, DOE used publicly available data for the Toyota Mirai to estimate the cost of fuel cell technology in today’s commercial FCEVs at current commercial production volumes. The DFMA analysis estimated the Mirai’s fuel cell system cost to be $165 per kWnet at a manufacturing volume of 3,000 systems per year. Using materials and performance data for state-of-the-art laboratory fuel cell systems in the DFMA cost analysis yields an estimate of $113 per kWnet for the model system at a production volume of 3,000 per year—a difference of $52 per kWnet, almost 50%. The higher cost estimate for the Mirai fuel cell system is attributed to higher platimum loading, use of titanium rather than stainless steel BPs, additional balance of stack components, and higher cost components for its larger size—allowing for improved system durability and end-of-life performance.
DOE subseqently developed a durability-adjusted cost estimate for its model fuel cell system produced at higher manufacturing volumes. The current durability-adjusted cost estimate is $68 per kWnet at a manufacturing volume of 500,000 sytems per year, compared to $46 per kWnet for the model laboratory system (Kleen and Padgett, 2021). Use of the publicly available Mirai data has enabled the DOE baseline system design and DFMA cost model to be validated against a commercial system design, and provided an approach to account for fuel cell durabilities below the target value. Realizing the DOE model system cost estimate is dependent on scaling today’s
___________________
10 The cost estimate is also lower owing to the delay between laboratory demonstration and commercial deployment of state-of-the-art technology.
laboratory materials and components, successfully incorporating them into vehicles, and achieving the fuel cell durability target.
While durability requirements are greater for MHDVs, particularly those that carry heavy loads, these vehicles can tolerate higher costs than LDVs, which allows for durability-enhancing approaches such as higher PGM loadings and oversized fuel cell stacks. System control strategies will also be employed to minimize fuel cell degradation, while longer-term R&D is focused on MEAs with improved durability. Much has been learned from fuel cell buses, which have routinely exceeded 20,000 hours of operation in the United States, and close to 30,000 hours in some cases, without major repairs or replacement of the fuel cell stack (Eudy and Post, 2018).
6.4.1 Fuel Cell Materials and Component Development
The two major technical challenges for automotive fuel cells—cost and durability—are strongly interrelated. PEM fuel cells with higher platinum loadings on the electrodes have longer lifetimes but higher cost than those with lower loadings. Reducing a membrane’s thickness decreases MEA cost but also makes it more prone to mechanical degradation (e.g., cracks, pinholes, fatigue). Replacing state-of-the-art materials with alternatives—PGM-free catalysts and membranes other than PFSA—often results in poor performance and reduced lifetimes under the harsh conditions of the PEM fuel cell. A significant amount of research is devoted to understanding fuel cell degradation to guide materials development and system design. Research directed at durability improvements is intertwined with research aimed at improving performance and lowering cost of catalysts, electrodes, membranes, and MEA fabrication.
Within the United States, DOE supports several R&D efforts aimed at reducing the cost of PEM fuel cells while increasing durability and maintaining or improving performance. These include two consortia led by DOE national laboratories:11
- Fuel Cell Consortium for Performance and Durability (FC-PAD) focuses on improving performance and durability, while simultaneously reducing cost.
- Electrocatalysis Consortium (ElectroCat) focuses on development of PGM-free catalysts.
The following sections summarize these and other efforts to develop improved materials and components for automotive fuel cells.
6.4.1.1 Electrodes
Today’s automotive fuel cells use platinum-based catalysts, primarily owing to their relatively high activity for the hydrogen oxidation reaction (HOR) on the anode and for the ORR on the cathode. Despite a 50% reduction in the platinum content of PEM fuel cells over the past decade (U.S. DRIVE, 2017a), platinum-based catalysts remain the single highest cost contributor to the fuel cell stack (Thompson and Papageorgopoulos, 2019). Information on platinum loadings in commercial FCEVs is not publicly available. However, James et al. (2018) estimate the 2017 Toyota Mirai to have a total platinum (Pt) loading of 0.365 milligrams per centimeter squared (mg/cm2), which for a 114 kW stack is estimated at 40 g Pt per FCEV, or 0.350 grams per kilowatt (g/kW). The U.S. DRIVE target, which is thought to be loosely based on the amount of platinum in today’s internal combustion engine vehicle (ICEV) catalytic converters, is <0.1 g/kW, or <10g Pt for a 100-kW fuel cell system. State-of-the-art laboratory MEAs have demonstrated Pt loadings of 0.125 g/kW (Kongkanand, 2017). To achieve the cost reduction projected for DOE’s 2025 fuel cell system ($37 per kWnet), a total platinum loading of 0.088 g/kW was used in the cost model. For comparison, the U.S. DRIVE/DOE 2025 target is <0.10 g/kW. For an 80 kWnet fuel cell system, the reduction from 0.125 g/kW Pt in state-of-the-art laboratory MEAs to 0.088 g/kW corresponds to a reduction in stack platinum cost of $551 to $334, or $6.80 per kW to $4.18 per kW. R&D efforts continue to focus on further reducing PGM content by designing catalysts with high and stable platinum dispersion and modifying electrode structures to prevent the performance losses that occur at ultra-low platinum loadings (Kongkanand and Mathias, 2016).
___________________
11 See https://www.energy.gov/eere/fuelcells/hydrogen-and-fuel-cell-technologies-office-consortia.
The kinetics of the HOR on the Pt anode are very fast; even low Pt loadings have little negative impact on anode performance (Holton and Stevenson, 2013). Studies indicate that a Pt loading as low as 0.025 mg/cm2 is possible without losing performance from HOR kinetics, consistent with the DOE 2020 anode Pt target (Banham and Ye, 2017). The ORR at the cathode has much slower kinetics owing to its more complicated mechanism and therefore requires higher Pt loading (DOE’s 2020 target is <0.10 mg/cm2). The cathode also operates in a more corrosive environment and is subject to flooding from the water produced there, making catalyst stability as important as catalyst activity. Incomplete oxygen reduction at the cathode can produce significant amounts of hydrogen peroxide, which causes oxidative degradation of the membrane. Thus, there is significantly more research focused on cathode improvements to lower the cost of PEM fuel cells and increase their power density, efficiency, and durability. Essential catalyst characteristics for high-performance PEM fuel cell electrodes include the following (Holton and Stevenson, 2013):
- High activity: The ability to adsorb the reactant strongly enough to facilitate the reaction but not so strongly that the catalyst becomes obstructed by the reactant or products.
- High selectivity: The ability to make the desired product and minimize the production of undesirable intermediates or side products.
- Good stability: The ability to perform and endure in the operating environment of the fuel cell—acidic conditions; oxidants; reactive radicals; temperature, pressure, and voltage changes.
- Tolerance to impurities: The ability to resist poisoning by impurities in the air/fuel stream or materials.
Current ORR research is focused on platinum alloy and non-PGM catalysts that have slightly lower oxygen binding energies than pure Pt—strong enough to drive cleavage of the O=O bond but weak enough to release reaction intermediates and products (Wang et al., 2019). The most common approaches used to improve Pt activity are alloying with one or more other metals, layering Pt on or just below the surface of another metal, the core-shell method in which a “core” of lower cost metal is coated with Pt, and alloying Pt followed by dealloying to produce a Pt lattice structure that retains some of the properties of the alloy structure (Holton and Stevenson, 2013).
Platinum alloy catalysts that show promise include ordered PtM intermetallics, with M=Co being the most promising first row transition metal. Some PtM catalysts have been incorporated into MEAs exceeding the DOE 2020 activity target of 0.44 amps per milligram Pt and demonstrating encouraging durability (< 40 mV voltage loss after 30,000 cycles at 0.6–0.95 V) (Gröger et al., 2015; Wang et al., 2019). Research is also focused on advanced carbon supports that enable increased dispersion of PtM nanoparticles and stronger metal-support interactions to prevent particle migration, reduce carbon corrosion, and increase durability. Other approaches include putting ionomers in the catalyst layers to improve catalyst utilization, using thinner GDLs (~100–150 microns) and larger-pore microporous layers to improve water and gas transport, and improving electrode flow-field structures (Shinozaki et al., 2011; Nakagaki, 2015). Further advances in both catalysts and electrodes are needed to achieve high power density at ultra-low Pt loading.
One indication of the complex nature of catalyst development is seen in the trade-off between selectivity and stability. While binary and ternary Pt alloys supported on high surface area carbon have higher selectivity toward hydrogen peroxide formation in the ORR reaction than unalloyed Pt, they generally do not lead to membrane degradation (Sethuraman et al., 2009). This is owing to their increased stability, which limits migration of Pt ions into the membrane.
PGM-free ORR catalysts that demonstrate equivalent performance and durability to platinum-based catalysts are considered to be the longer-term (beyond 2035) and higher-risk approach. All non-PGM catalysts under development need significant improvements in both activity and stability to be viable in automotive fuel cells. To design improved catalysts and electrodes, research is focused on developing a greater understanding of the role of different metals in promoting catalytic activity, as well as the role of the surrounding ligand structure and morphology. Approaches include macrocyclic compounds Co-N4 (e.g., CoTMPP, TMPP = tetramethoxyphenyl porphyrin) and Fe-N4 (e.g., FeTPP, TPP = tetraphenyl porphyrin), heat-treated macrocyclic compounds, heat-treated transition metal-nitrogen-carbon (M-N-C), and atomically dispersed and nitrogen coordinated metal sites (Fe, Co, Mn) (Wang et al., 2019).
It is difficult to project timelines for successful development of new PEM fuel cell catalysts capable of meeting the demands of automotive drive cycles. In addition to the materials development challenges, maintaining performance of catalysts and electrodes when incorporated into MEAs presents an additional challenge for both
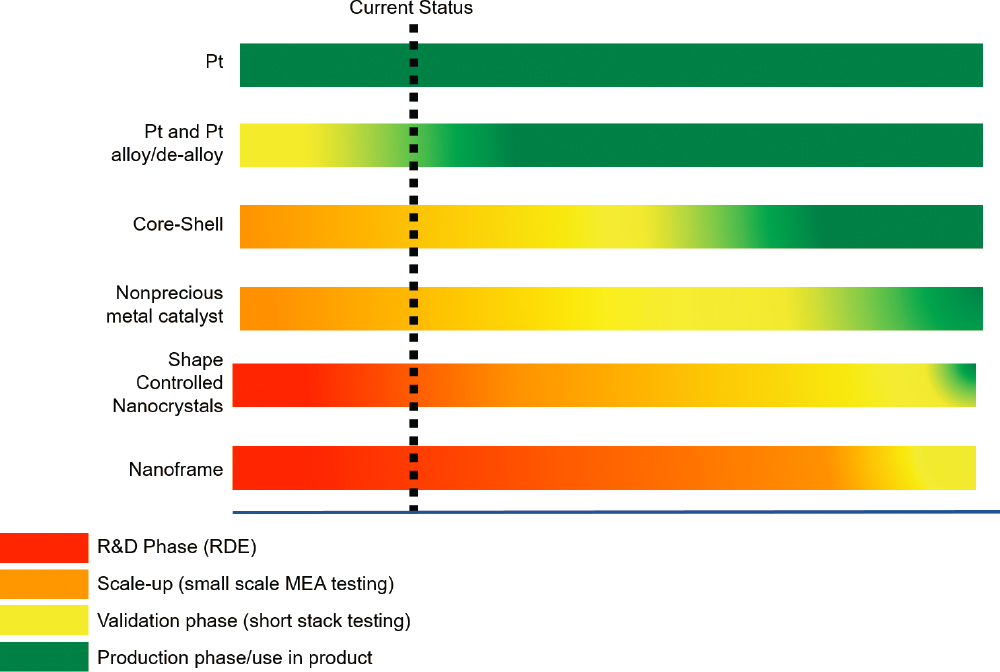
SOURCE: Reprinted with permission from D. Banham and S. Ye, 2017, Current status and future development of catalyst materials and catalyst layers for proton exchange membrane fuel cells: an industrial perspective, ACS Energy Letters 2(3):629–638, © 2017 American Chemical Society.
low- and no-PGM materials as membrane-electrode interface interactions come into play. Figure 6.14 presents a relative timeline for ORR in six categories: (1) Pt/C, (2) Pt and Pt alloy/dealloy, (3) core-shell, (4) nonprecious metal catalysts (PGM-free), (5) shape-controlled nanocrystals, and (6) nanoframes (Banham and Ye, 2017).
Some PGM-free catalysts have demonstrated sufficient performance for use in backup power and/or portable power fuel cell applications. The first commercial PGM-free fuel cell, a 30 W stack for emergency or backup power, was announced in 2017 (Fuel Cells Bulletin, 2017; Banham et al., 2019). However, these applications have considerably lower performance and durability requirements than automotive applications. In 2025–2035, automotive fuel cells are likely to see a gradual lowering of Pt content, leading to reduced FCEV cost; however, current PGM-free catalysts are far from meeting automotive performance targets. PGM-free catalysts are unlikely to be in commercial FCEVs in that time frame, and their success beyond that is uncertain.
6.4.1.2 Membranes
Traditional PEM fuel cells use perfluorinated polyethylene membranes that when hydrated swell and form hydrophilic (water-filled) proton-conducting channels and hydrophobic backbones that allow for proton transport. Nafion®, which was developed by DuPont in the 1960s, is still the state-of-the-art membrane. It demonstrates high proton conductivity and good mechanical and chemical stability when operated below 90°C and at RH greater than 40%. Operating pressure is typically around 2.5 bar, as this simplifies humidification and water management in addition to enabling higher power density.
At temperatures higher than 90°C, the membrane can become dehydrated, which leads to decreased proton conductivity. Higher temperatures can also cause irreversible membrane degradation owing to Nafion’s relatively
low glass transition temperatures (110°C–135°C). However, if these issues could be resolved, higher-temperature fuel cells would benefit from improved reaction kinetics and decreased sensitivity to fuel impurities (e.g., CO), both of which enable reduced platinum catalyst loadings and higher efficiency owing to the production of useful waste heat and/or the elimination of BOP components currently needed for water management.
A variety of strategies are being pursued to develop membranes that can operate at low RH and temperatures up to 120°C. These strategies typically fall into two general categories: (1) those that still require water for conduction but reduce the water needed by controlling the membrane microstructure and/or increase water retention using hydrophilic additives, and (2) those that do not require water but provide conduction through an alternative mechanism. A recent review article by Sun et al. (2019) describes the following approaches:
- Nafion-based composite membranes: Adding hygroscopic inorganic or other fillers to Nafion® is designed to increase water retention, reduce reactant crossover, enhance proton mobility, and improve mechanical stability.
- PBI-based composite membranes: Thermoplastic polymers such as polybenzimidazole (PBI) have good chemical resistance, high oxidative stability, and good thermal and mechanical properties above 80°C. Phosphoric acid-doped PBI type membranes have shown the most promise for operation up to 200°C at ambient pressure and have been the most extensively studied.
- PEEK-based composite membranes: Sulfonated polyether ether ketone (SPEEK) is an attractive alternative to Nafion® because it is commercially available at low cost and has microstructure and morphology that enable superior water uptake and high protonic conductivities when filled with metal oxides, solid acids, metal-organic frameworks (MOFs), or carbon nanotubes.
- Mixed electron-proton conducting composite membranes: An alternative approach to the traditional fabrication of membrane-electrode assemblies is to mix or replace Nafion in the catalyst ink with an electron-conducting polymer such as polypyrrole or polyaniline, thus introducing electronic conductivity in parallel with protonic conductivity.
While some promising results have been achieved, a membrane that meets all of the U.S. DRIVE targets has not yet been developed. The primary challenge is developing a membrane that has sufficient conductivity at 120°C and lower RH while maintaining mechanical stability and durability during fuel cell operation. Other challenges include making an electrocatalytic layer that is compatible with both the membrane and the catalyst, and meeting the established cost target. It is unclear if successful high-temperature fuel cell membranes will be in commercial FCEVs in 2025–2035.
Anion Exchange Membranes
Another, longer-term approach to enabling higher temperature operation is to replace PEMs with anion exchange membranes (AEMs). AEMs, also called alkaline anion exchange membranes (AAEMs), conduct hydroxide anions (OH−) rather than protons (H+).
Both proton exchange membrane fuel cells (PEMFCs) and anion exchange membrane fuel cells (AEMFCs) produce water as a by-product. However, in contrast to PEMFC technology, in an AEMFC the hydroxide anion is transported from the cathode to the anode, opposite to the proton conduction direction in a PEMFC, and water is generated at the anode, while at the same time water is a reactant at the cathode. This distinctive water transport scenario, together with the alkaline medium, represent a unique feature of AEMFCs (You et al., 2019). Figure 6.15 shows a schematic drawing of transport in an AEMFC (Dekel, 2018).
The alkaline environment in AEM fuel cells provides several advantages over the acidic environment in PEM fuel cells, including the following:
- Enabling the use of lower cost non-PGM oxygen reduction catalysts owing to their improved stability in alkaline environments, and less expensive metal hardware.
- Enabling a wider selection of fuels for the fuel cell, as the electro-oxidation kinetics for many liquid fuels are improved in an alkaline environment. Liquid fuels like methanol or hydrazine could be used directly in the fuel cell, for example, or dimethyl ether (DME), a potentially carbon-neutral liquid fuel that can be produced from renewably sourced hydrogen and carbon dioxide (CO2), and is non-toxic and easy to liquefy.
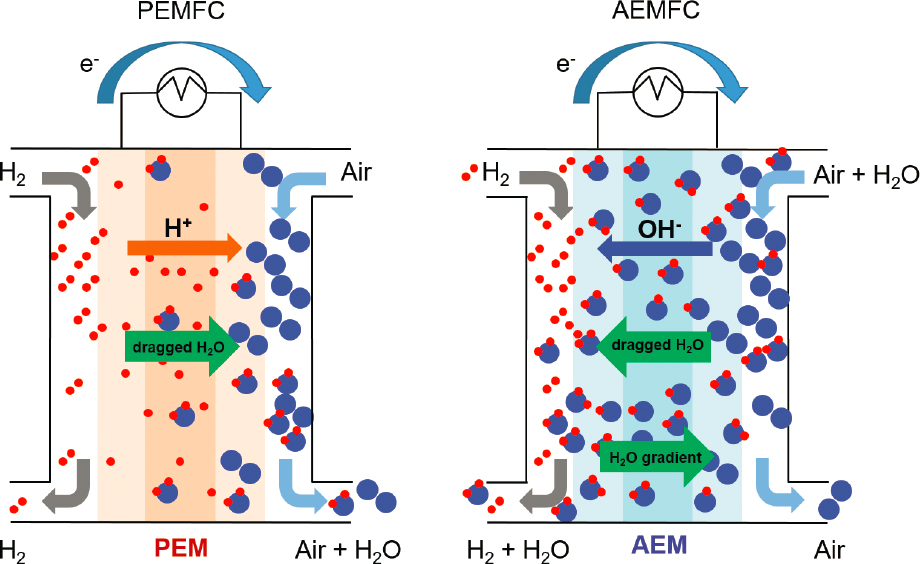
SOURCE: Dekel (2018).
While much progress has been made, AEMFCs remain a significantly less mature technology than PEMFCs. Further development of alkaline membranes is needed, as well as integration of catalysts and membranes into high-performance MEAs. Current R&D efforts are focused on developing Pt-free AEMFCs, and understanding, enabling, and validating their long-term stability in fuel cell operation at high temperatures and with low water content. In 2018, reported performance data indicated that stable AEMFC operation was limited to less than 1,000 hours. Researchers cite chemical degradation of the cationic functional groups at low water content as the primary reason for durability limitations (Dekel et al., 2019). AEMFCs are also susceptible to carbonization from CO2 in the air (Ul Hassan et al., 2020). Pathways are needed to minimize the impact of CO2 on cell operation, including material, operational, and engineering solutions. Significant advances are needed before AEMFCs can be considered a viable alternative to PEMFCs; thus, it is unlikely that they will be in commercial FCEVs in 2025–2035.
6.4.1.3 Gas Diffusion Layers
The GDL in the PEM fuel cell is used for optimal distribution of reactants to the catalyst layer and for water management within the MEA (Tomas et al., 2017). The GDL can consist of a single layer or a double layer (GDL plus a microporous layer, MPL). The most commonly used GDL materials are carbon cloth and carbon paper. The GDL keeps the membrane humidified while also preventing flooding of the cathode by “wet-proofing” the GDL with hydrophobic poly(tetrafluoroethylene) (PTFE) to facilitate transport of water away from the active catalyst layer and to prevent the pores in the carbon cloth or paper from becoming clogged with water (see Figure 6.16). The MPL, which consists of carbon or graphite particles mixed with PTFE binder, provides improved electrical contact and facilitates water transport in and out of the diffusion layer, and enhances the chemical and mechanical stability of the catalyst layer and membrane. The GDL must have good electrical conductivity, high permeability for gases and liquids, and high chemical stability, and must be able to withstand the temperatures and compression forces of the fuel cell stack (Spiegel, 2018).
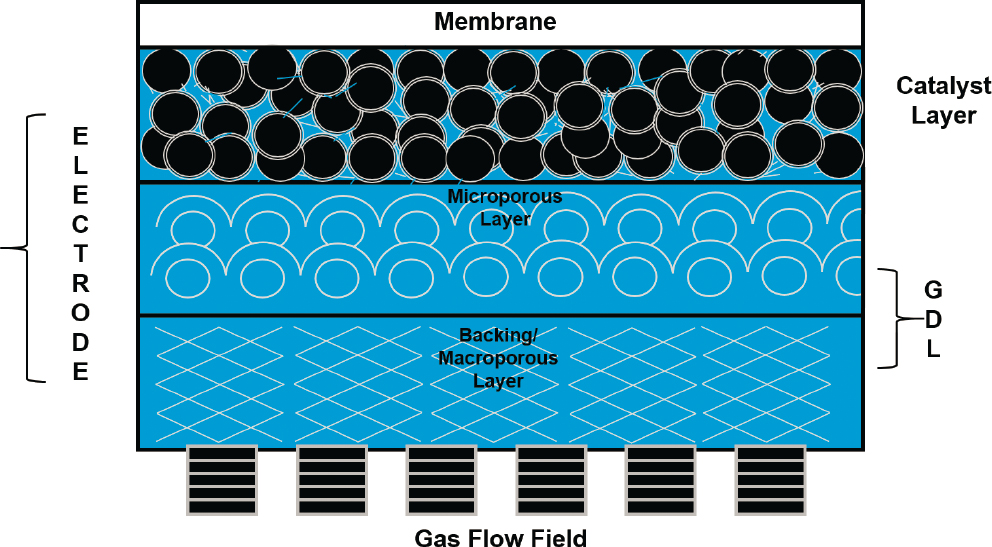
SOURCE: Jayakumar et al. (2017).
Current GDL materials have long-term durability issues and complex manufacturing processes, which impact their cost. Research is focused on improving current materials and developing alternative materials and fabrication processes. Approaches include the following (Borup et al., 2019):
- Using lower cost carbon fibers (CFs);
- Using lower carbonization temperatures to reduce processing costs;
- Developing low-cost gas phase surface treatments to replace PTFE treatments;
- Developing super-hydrophobicity coatings to prevent water flooding and transport losses;
- Incorporating hydrophilic pathways separate from hydrophobic domains to provide pathways for water removal, including through laser patterning; and
- Incorporating porous metals—for example, sintered metal powders or fibers.
6.4.1.4 Bipolar Plates
BPs are a key component in PEM fuel cells, performing several essential functions. They connect each cell electrically, supply the reactant gases—hydrogen and oxygen (from air)—through flow channels, and remove heat and reaction by-products (water) from the cell. These functions require that BP materials have high electrical conductivity, high gas impermeability, good mechanical strength, and high corrosion resistance (Taherian, 2014). FCEVs contains hundreds of BPs (James et al., 2018).
Traditionally, BPs were fabricated from high-density graphite due its superior corrosion resistance, chemical stability, high thermal conductivity, and availability. However, graphite plates are costly to produce, bulky, and have mechanical properties that may make them unsuitable for fuel cell applications that require good structural durability against shock and vibration. For these reasons, many fuel cell manufacturers have moved away from graphite plates and use metal or composite plates instead.
Metal plates have higher electrical conductivity and lower gas permeability than composite plates, as well as higher strength, better shock resistance, and better high-volume manufacturability owing to their stampability (for flow fields).
Metal plates can be made thinner than composite plates—as thin as 1 mm—enabling smaller and lighter fuel cell stacks, and some, like stainless steel, are currently lower in cost. The downside to metal BPs is that they are more susceptible to corrosion than carbon plates, particularly in the acidic environment of the PEM fuel cell, which results in leaching of metal ions into the fuel cell membrane. This has been addressed by applying corrosion-resistant coatings to the metal surface, such as conductive polymer films, metal nitride/carbide films, noble metal films, or carbon. However, these additional processing steps increase the cost of these metal plate options.
Because of their robustness, metal BPs are the current choice of FCEV manufacturers (typically 316 stainless steel or titanium). Hyundai moved from carbon plates in its precommercial FCEV to unspecified metal plates in its first commercial FCEV, the Tucson, which the company began leasing to customers in 2014. Hyundai continues to use metal plates in its current commercial FCEV, the Nexo (Castillo, 2017). The Toyota Mirai fuel cell stack uses titanium BPs, which are more costly than stainless steel.
There is still some debate among fuel cell developers about whether carbon or metal BPs are the better choice for transportation fuel cell systems. Despite their shortcomings, fuel cell manufacturer Ballard Power Systems believes that polymer-based carbon composite plates are a better choice because of their higher corrosion resistance, higher durability, easier formability (which enables fabrication of thin plates and greater design flexibility), and the elimination of coating and welding (which enables lower cost manufacture) (Bach, 2019). It is unknown if coated metal plates will have the durability needed for vehicular applications (8,000 hours is the current U.S. DRIVE target for LDVs), and especially heavy-duty vehicles such as buses and trucks, which require lifetimes more than 20,000 hours. According to the U.S. DRIVE Fuel Cell Technical Team Roadmap, automotive fuel cell systems containing stainless steel BPs have demonstrated 4,130 hours durability (U.S. DRIVE, 2017a). According to Ballard, carbon plates used in fuel cell transit buses have reached more than 30,000 hours of operation without issues, and in material handling vehicles (forklifts) beyond 10,000 hours.
Aluminum is another BP material being explored for automotive fuel cell applications because it is relatively lightweight and inexpensive, conductive, high strength, and formable. The downside is aluminum’s low corrosion and oxidation resistance. Current R&D efforts are aimed at aluminum-coated BPs fabricated through solid phase processing, which has been used to improve performance and lower cost in other applications (Ross, 2019).
The current cost of PEMFC BPs is well above the U.S. DRIVE 2025 cost target of $2/kW for the finished plate at a production volume of 500,000 fuel cell stacks per year. DFMA analysis of the current cost of coated 316 stainless steel fabricated by progressive stamping is $5.40/kW, excluding welding, for production volumes of 500,000 stacks/year (Huya-Kouadio et al., 2018). The cost of the plate material alone was estimated to be $2.90/kW. Less expensive materials are needed as well as less expensive manufacturing processes (James, 2017). A comparison of the cost of metallic, carbon composite, and expanded graphite plate materials suggested that metal plates may be the lowest cost pathway, and that achieving the DOE 2020 target may be possible by using lower cost plate material, improving the manufacturing process, and increasing the power density of the fuel cell stack. However, a recent analysis of the cost to manufacture embossed flexible graphite BPs for LDV systems showed that they can be lower cost than metal plates and also meet the DOE 2020 target of $3/kW for finished plates (James, 2019). The U.S. DRIVE 2025 cost target of $2/kW will be a significant challenge with current commercial bipolar materials and processes.
6.4.1.5 BOP Components
The BOP in a PEM fuel cell system includes components associated with the air loop; humidifier and water recovery loop; coolant loops; fuel loop (excluding fuel storage); system controller; sensors; and miscellaneous items such as mounting frames, belly pan, and wiring and piping (James et al., 2018). As mentioned earlier, the BOP system is projected to represent more than 60% of the cost of 2025 automotive fuel cell systems at a production rate of 500,000 systems per year. In addition, parasitic power demands of BOP components result in a lower net system efficiency, largely owing to the air compression system, which typically consists of an integrated air compressor, exhaust gas expander, and an electronic CEM unit. The CEM unit is the highest cost component in the BOP system, projected to account for about 50% of the total BOP cost in 2025 automotive fuel cell systems. Current R&D efforts are focused on new and improved materials with potential to simplify system design, improve system efficiency, and reduce BOP cost.
Today’s off-the-shelf air compressors were not designed for the operational characteristics of automotive fuel cell systems, which require compressors that are oil free, high pressure with low flow rate, high efficiency, and low weight and volume (Yu et al., 2015). Automakers have tested several types of compressors in FCEVs, including scroll and screw compressors, centrifugal turbocompressors, and Roots compressors (Kerviel et al., 2018). All have trade-offs. Centrifugal and Roots compressors are smaller and lower cost than screw and scroll compressors. The Toyota Mirai uses a Roots compressor, which has a higher power density than the centrifugal compressor but lower efficiency and pressure ratio, and pulsation characteristics that require a larger sound absorber (Fumihiro et al., 2015). Therefore, many FCEV manufacturers, including Honda, have adopted centrifugal compressors for FCEVs.
Current CEM R&D efforts are focused on different controller designs to increase CEM efficiencies from current levels of ~80% to >90%. Successful development of higher temperature, lower humidity membrane electrode assemblies is expected to lead to lower pressure fuel cell systems, simplifying air compression requirements and reducing cost in the longer term.
6.4.1.6 Fuel Cell Manufacturing R&D
The high cost of automotive fuel cell systems today is primarily owing to low production volumes. Current production processes are slow, expensive, and labor intensive; higher levels of automation are needed. High-volume manufacturing methods for fuel cell stack components are still evolving, and fuel cell stacks are assembled mostly in a manual process (Gurau et al., 2018). To achieve economies of scale, emerging fuel cell manufacturing processes must be optimized and scaled up to factory production volumes. However, as noted later in this chapter, the lack of a hydrogen fueling infrastructure has limited deployment of and demand for automotive fuel cell systems. Today’s low demand, as well as uncertainty about future market volume, has limited industry investments in fuel cell manufacturing development (DOE HTAC MSC, 2014; Mayyas and Mann, 2019).
High-volume MEA manufacturers have implemented automation via continuous roll-to-roll processes, replacing the traditional spray coating process used for catalyst deposition in low-volume production. Roll-to-roll processes enable higher throughput, more uniform catalyst layers, and the ability to include infrared or optical systems for quality control. DOE-supported work at NREL has focused on improving inspection methods for inline quality control using techniques such as infrared thermography. A Manufacturing Demonstration Facility at Oak Ridge National Laboratory is focused on additive manufacturing and low-cost CF.
Input from fuel cell manufacturers identified the following overarching needs for low-cost automated fuel cell stack assembly: simplifying component design of each component, reducing parts, and replacing materials not compatible with rapid serial production. Figure 6.17 shows an example of reducing parts by combining the GDL with the CCM. Gurau et al. (2018) reported that the most significant technological challenges to automated stack assembly are (1) the difficulty in aligning fuel cell components (BPs, MEAs, and gaskets) in the stack to avoid leaks of reactant gases, and (2) the diversity of fuel cell components that need to be handled by the robotic arm.
DOE has supported fuel cell manufacturing R&D at varying and relatively low levels of funding over the past decade (DOE, 2017). Efforts have been largely focused on fuel cell MEAs, BPs, and CFs/composites for hydrogen storage tanks. Moving forward, increased manufacturing R&D will be critical to achieving the economies of scale needed to reduce the cost of fuel cell and hydrogen technologies.
6.4.1.7 Onboard Hydrogen Storage
Because of the size and weight constraints of LDVs, high volumetric and gravimetric energy densities are important characteristics for LDV fuels. To be comparable to conventional gasoline vehicles, automakers have targeted driving ranges of 300 to 500 miles and vehicle refueling times of 3 to 5 minutes for FCEVs. Hydrogen’s high gravimetric energy density (33 kilowatt-hour per kilogram [kWh/kg] based on lower heating value) provides an advantage over other fuels; however, hydrogen’s very low volumetric energy density (~1 kilowatt-hour per liter [kWh/L] at 700 bar) is a distinct disadvantage.12 See Figure 6.18 for a comparison of energy content in various fuels.
___________________
12 For comparison, lower heating values for gasoline are 12 kWh/kg and 9 kWh/L.
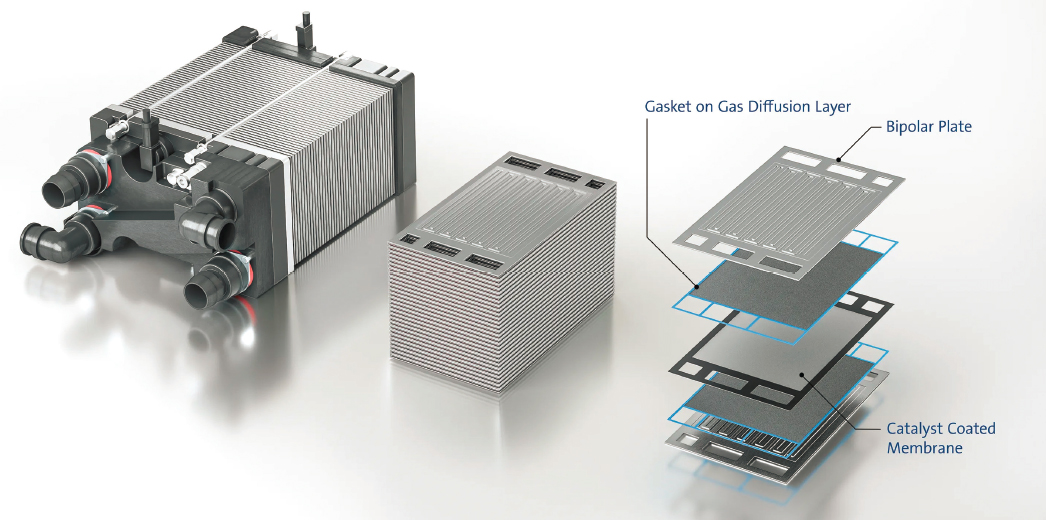
SOURCE: Freudenberg Sealing Technologies (2018).
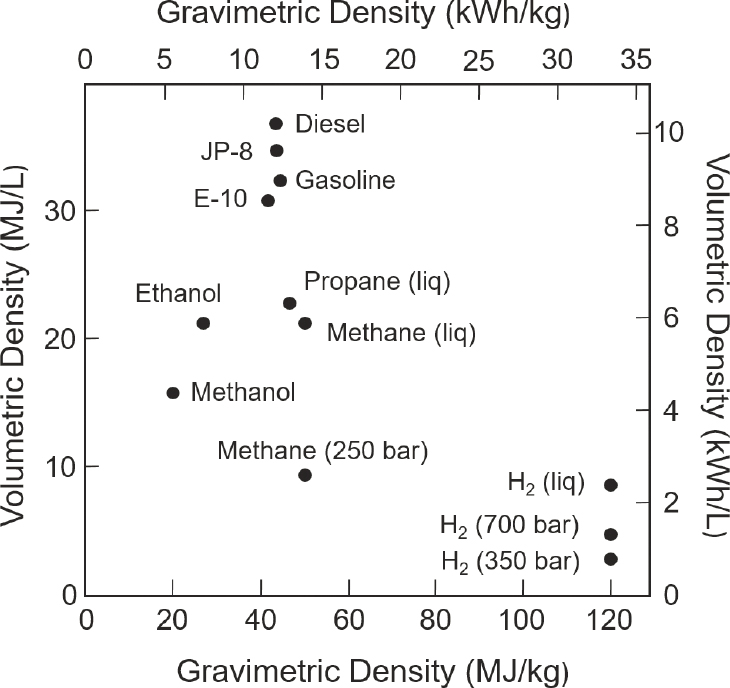
SOURCE: U.S. DRIVE (2017c).
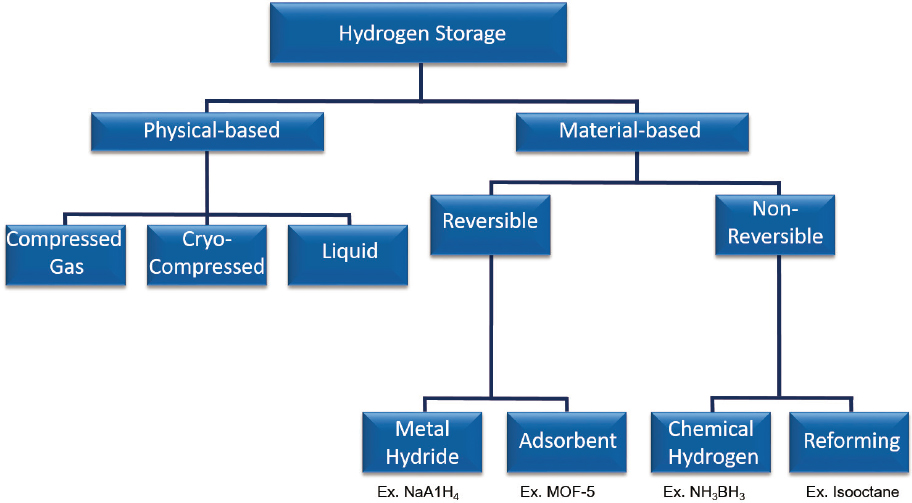
SOURCE: U.S. DRIVE (2017c).
Conventional hydrogen storage methods, particularly high-pressure gas cylinders, are a well-established technology and the current method of choice for FCEVs; however, the tanks are bulky and expensive. Therefore, R&D activities are under way to lower the cost and reduce the volume of compressed hydrogen tanks, and to develop alternative methods of hydrogen storage to enable affordable, lightweight, and compact hydrogen storage systems for FCEVs. Alternative approaches include liquid, cryo-, or cold-compressed hydrogen; physisorption of hydrogen on materials with a high specific surface area; hydrogen intercalation in metals and hydrides; and chemical hydrogen storage methods.
Hydrogen storage approaches can be broadly characterized in two categories (see Figure 6.19):
- Physical-based storage technologies, in which elemental hydrogen is stored as compressed hydrogen gas, cold- or cryo-compressed hydrogen, or liquid hydrogen. These storage technologies will dominate in 2025–2035, particularly gaseous and liquid storage.
- Material-based (or solid-state) storage technologies, in which hydrogen is bound to other elements within materials—adsorbents, metal hydrides, or chemical hydrogen storage materials. These approaches are not likely to be in commercial FCEVs in 2025–2035.
The different hydrogen storage approaches and their volumetric densities are shown in Figure 6.20.
Besides energy density and cost, important performance characteristics for onboard hydrogen storage systems include the following:
- Operating pressure—pressure vessels must be reinforced with high-strength containment materials that impact system weight, volume, and cost.
- Operating temperature—temperature-dependent materials and systems require heat management equipment, which adds complexity and cost.
- The rate at which the system can release and curtail hydrogen upon demand in response to the vehicle’s acceleration and braking.
The U.S. DRIVE Partnership has established technology-neutral targets for energy capacity, charging/discharging rates, durability/operability, dormancy, and cost of onboard hydrogen storage systems. Systems must also meet
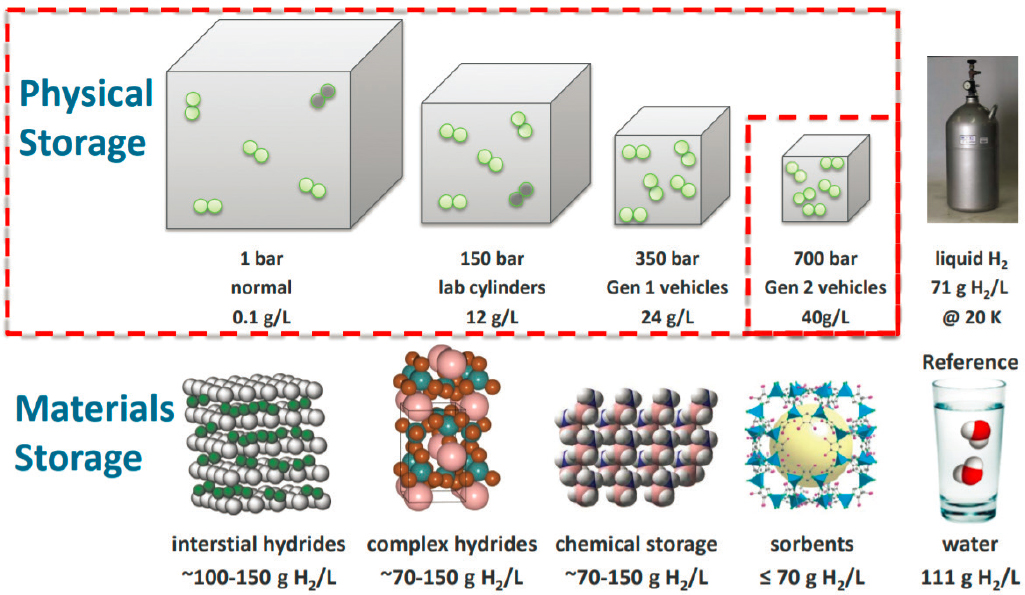
SOURCE: Stetson (2015).
established standards for fuel quality (SAE J2719) and environmental health and safety (SAE J2579) (U.S. DRIVE, 2017b). Gravimetric and volumetric energy capacity targets for 2025 are as follows: 1.8 kWh/kg (5.5 wt%) and 1.3 kWh/L, respectively, at a cost of $9/kWh (U.S. DRIVE, 2017b). The ultimate targets are 2.2 kWh/kg (6.5 wt%), 1.7 kWh/L, and $8/kWh. Targets are for a complete system, including tank, material, valves, regulators, piping, mounting brackets, insulation, added cooling capacity, and all other BOP components. These targets are designed to enable greater than 300-mile range across the majority of the current LDV fleet. To that end, the targets exclude “unusable” energy—that is, any hydrogen left in the tank below minimum fuel cell system pressure, flow, and temperature requirements—and any energy/fuel used to extract the hydrogen from the storage medium. The latter may be the case for material-based storage approaches—for example, heating a metal hydride to release hydrogen (U.S. DRIVE, 2017b).
Table 6.2 provides a summary of different hydrogen storage methods. The following sections provide information on hydrogen storage systems in commercial FCEVs and other storage approaches under development.
Physical-Based Hydrogen Storage
Compressed hydrogen gas. Compressed hydrogen tanks are used in commercial FCEVs today and are likely to be the hydrogen storage technology used in 2025–2035 FCEVs. State-of-the-art tanks contain hydrogen gas at 350 or 700 bar in composite overwrapped pressure vessels (COPVs), which are constructed using CF reinforced polymers that are wrapped around metallic (Type-III) or polymeric (Type-IV) liners (typically, high-density polyethylene) (Gangloff, 2017); see Figure 6.21. Today’s commercial FCEVs typically use 700-bar Type IV pressure vessels for onboard hydrogen storage (Yamashita et al., 2015).
Compressed gas has several advantages over other hydrogen storage approaches. The kinetics of compressed hydrogen are well-suited for mobile applications. Hydrogen flow is responsive to vehicle driving demands, increasing or decreasing in response to acceleration, and deceleration and braking. The materials involved—typically CF and nylon-6—are not toxic or environmentally harmful. The onboard hydrogen supply system
TABLE 6.2 Basic Hydrogen Storage Methods
| Storage Method | ρm [mass%] |
ρv [kg H2 m−3] |
T [°C] |
p [bar] |
Phenomena and Remarks |
|---|---|---|---|---|---|
| High-pressure gas cylinders | 13 | < 40 | RT | 800 | Compressed gas (molecular H2) in light weight composite cylinders (tensile strength of the material is 2000 MPa) |
| Liquid hydrogen in cryogenic tanks | size dependent | 70.8 | –252 | 1 | Liquid hydrogen (molecular H2) continuous loss of a few % per day of hydrogen at RT |
| Adsorbed hydrogen | ≈ 2 | 20 | –80 | 100 | Physiosorption (molecular H2) on materials, e.g., carbon with a very large specific surface area, fully reversible |
| Absorbed on interstitial sites in a host metal | ≈ 2 | 150 | RT | 1 | Hydrogen (atomic H) intercalation in host metals, metallic hydrides working at RT are fully reversible |
| Complex compounds | < 18 | 150 | > 100 | 1 | Complex compounds ([AlH4]− or [BH4]−), desorption at elevated temperature, adsorption at high pressures |
| Metals and complexes together with waters | < 40 | > 150 | RT | 1 | Chemical oxidation of metals with water and liberation of hydrogen, not directly reversible? |
NOTE: The gravimetric density ρm, the volumetric density ρv, the working temperature T, and the pressure p are listed. RT stands for room temperature (25°C).
SOURCE: Züttel (2003).
operates at ambient temperature, so there is no need for thermal management equipment to store or release hydrogen onboard the vehicle.
The disadvantages of compressed hydrogen tanks are the large volume required and the high cost of the tank, primarily owing to the cost of CF. From an infrastructure standpoint, FCEV drivers, used to a liquid refueling infrastructure, will need to adapt to gaseous refueling equipment and processes, which may vary from station to station. Automakers are providing hydrogen refueling tips and other resources for early adopters.13 Another consideration is the energy associated with compressing hydrogen and delivering it to the vehicle. Like other gases, hydrogen releases heat when compressed. To avoid overheating the tank during refueling, compressed hydrogen is cooled to −20°C to −40°C beforehand. The energy required for precooling, as well as that required to compress hydrogen, reduce the WTW energy efficiency of FCEVs and, depending on the energy source, can result in upstream CO2 emissions.
DOE has reported a gravimetric energy density of 1.48 kWh/kg (~4.5 wt%) and a volumetric energy density of 0.83 kWh/L for today’s 700 bar compressed hydrogen storage systems. For comparison, Toyota has reported a gravimetric capacity of 5.7% for the Mirai hydrogen storage system; however, it is unclear if this includes the weight of the entire hydrogen storage system or just the tanks. The DFMA cost analysis conducted for DOE projects a system cost at high-volume production (500,000 systems per year) of $14.2/kWh, based on a single-tank configuration with a net usable hydrogen capacity of 5.6 kilograms in LDV applications; using the lower heating value of 33.3 kWh/kg of hydrogen, that translates to a tank cost of approximately $2,650. This analysis, in 2016$, is based on a tank design that uses aluminum BOP components (valves, regulators, piping, mounting brackets, insulation, etc.), a hoop-intensive winding pattern that reduces CF composite mass, and Toray T700S CF at a cost of $26/kg at volume. As indicated in the system cost breakdown shown in Figure 6.22, CF accounts for more than 50% of the system cost.
R&D efforts have led to a steady decrease in cost. Analysis of compressed hydrogen systems projected to annual manufacturing volumes of 100,000 and 500,000 (Ordaz et al., 2015; Adams et al., 2019), shown in
___________________
13 One example is the webpage for the Toyota Mirai: https://www.toyota.com/mirai/Mirai_Fueling.pdf.
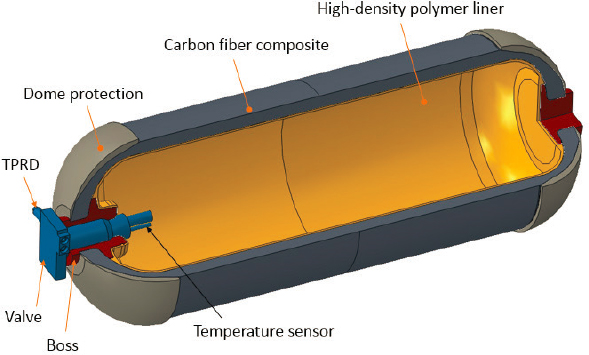
SOURCE: Process Modeling Group, Nuclear Engineering Division, ANL; reprinted from FCTO (2017).
Figure 6.23, indicates more than a 20% cost reduction since 2013. This is primarily owing to the development of lower-cost CF and resin, improved CF usage, and integrated balance of plant components (Houchins, 2019).
System design and architecture also have significant impact on cost. Automakers are storing hydrogen in two or three onboard tanks in today’s commercial FCEVs. In both the Toyota Mirai and the Honda Clarity, the front hydrogen tank sits beneath the rear passenger seat, while the rear tank is behind the rear passenger seat. The Hyundai Nexo uses similar placement of its three-tank vehicle design. Table 6.3 shows the modeled cost of single- and two-tank configurations at production rates of 100,000 and 500,000 systems per year. The analysis
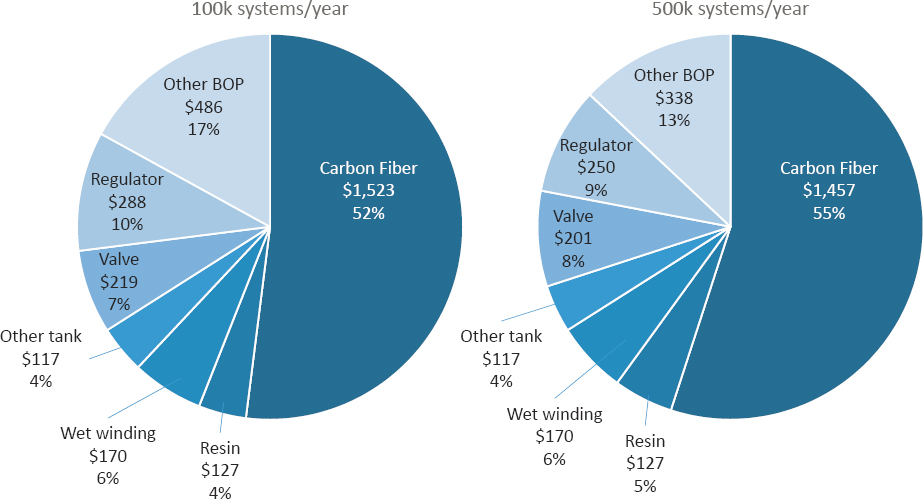
SOURCE: Adams et al. (2019).
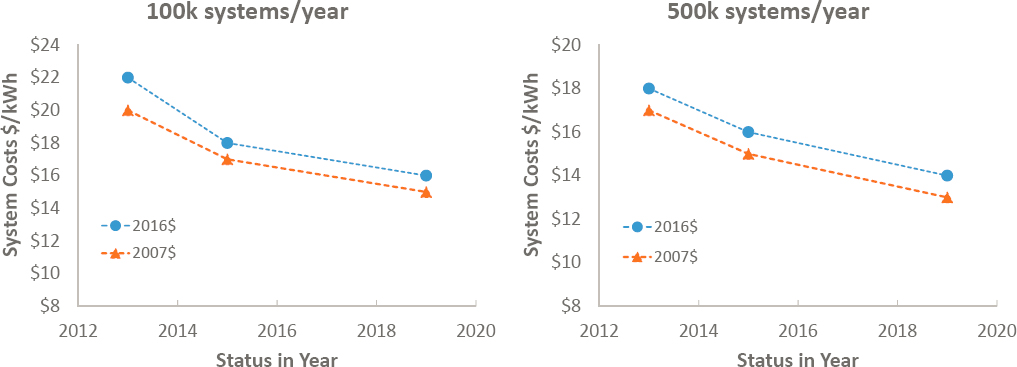
SOURCE: Adams et al. (2019).
indicates that two-tank storage systems are more expensive than single-tank systems primarily owing to a second set of in-tank valves required for the two-tank design. This accounts for the higher BOP costs in the two-tank design. The cost of the two-tank system also depends on the tank aspect ratios, which impact the hoop intensive winding pattern, and therefore, the mass of the tank. As shown in the table, the mixed-aspect design is projected to be lower cost.
DOE has ramped up R&D of compressed tanks, including initiating several new projects in July 2020, focused primarily on reducing the CF cost. High strength CF is almost exclusively produced from polyacrylonitrile (PAN) precursor fibers in a solution spinning process that requires significant capital expenditures (Das et al., 2016; Warren, 2016). The conversion of PAN precursor fiber to CF includes several moderate- to high-temperature processing steps that result in only 50% mass yield. Thus, R&D is focused on reducing cost of both the precursor and conversion processes, including the following (Miller and Stetson, 2019):
- Alternative CF precursors to lower fiber processing costs:
- PAN-based fibers formulated with co-monomers and additives to enable lower cost melt spinning rather than conventional solution spinning and/or higher yield conversion of PAN-fiber to carbon;
- Polyolefin-based fibers; and
- Novel materials as precursor fibers.
- Fibers other than high-cost carbon, such as ultra-high strength fiber glass.
- Alternative resins with high strength and low weight—for example, vinyl ester and epoxy resin composites rather than high-cost epoxies. Alternative COPV manufacturing methods to reduce CF content, such as vacuum-assisted composite processing.
TABLE 6.3 Comparison of Tank Configurations Storing 5.6 kg Usable H2 Showing Cost Impact of Single- versus Two-Tank Designs and Mixed versus Identical Aspect Ratio Two-Tank Configurations
| Configuration | System Cost at 100,000 per Year | System Cost at 500,000 per Year |
|---|---|---|
| Single tank | $15.7/kWh | $14.2/kWh |
| Two-tank (identical aspect ratio: L/D = 2.8) | $20.0/kWh | $17.9/kWh |
| Two-tank (mixed aspect ratio: L/D = 2.8, 1.7) | $18.5/kWh | $16.4/kWh |
SOURCE: Adams et al. (2019).
While the U.S. DRIVE 2025 target for gravimetric energy capacity for onboard hydrogen storage systems is within reach, achieving the volume and cost targets will be a challenge. The price for Toray T700S in 2019 ranged from $26 to $30/kg. Since the CF cost accounts for around 50% of total system cost, meeting the U.S. DRIVE system target of $8/kWh requires CF at a cost of $13–$15/kg. Reducing cost while also reducing the weight and volume of the tanks presents a significant challenge. Nonetheless, other onboard storage options also face significant challenges and are earlier in their development. Compressed hydrogen tanks are likely to be the method of choice for FCEVs over the next 10–15 years.
Cold/cryo-compressed hydrogen.
A potential alternative to 700 bar compressed hydrogen tanks is cold- or cryo-compressed hydrogen tanks, in which the hydrogen is stored at cryogenic temperatures—typically 70 K–200 K—and pressures of 100–700 bar. Interest in cryo-compressed hydrogen storage is driven by its potential for higher energy density, enabling a smaller tank size than 700 bar compressed hydrogen tanks; a lower cost than full liquefaction and a longer dormancy period than liquid hydrogen; and in some cases, a lower cost than 700 bar compressed hydrogen. For a 500 bar cold-compressed hydrogen system, one study estimated a 30% cost reduction and 38% mass reduction from a 700 bar system through material improvements, composite layup design and cold gas operation, even when the required onboard insulation for cold gas storage is included (Simmons, 2014). Onboard cold/cryo-compressed storage systems require vacuum insulation to reduce or eliminate hydrogen boil-off and achieve the dormancy target of 14 days.14 R&D projects under way at a number of DOE national laboratories, some in collaboration with industry, are developing tank materials and BOP components, conducting burst tests, and modeling system designs to develop the technology further. Currently, there is more interest in these approaches for hydrogen storage at refueling stations and on board heavy-duty FCEVs than on board light-duty FCEVs.
Liquid hydrogen.
Liquid hydrogen storage is a mature technology used for storing and delivering hydrogen in the industrial sector. The advantage of liquid hydrogen is its high energy density. While liquid hydrogen tanks do not require high pressure, at −253°C they do require double-walled tanks with multilayered vacuum insulation to minimize hydrogen boil-off, adding to the system weight, volume, and cost. Thus, there is more interest in liquid hydrogen for large bulk stationary storage rather than on board FCEVs.
Material-Based Hydrogen Storage
Longer-term hydrogen storage approaches are focused on developing chemical and solid-state materials with the potential to store hydrogen at near-ambient temperature, low-to-moderate pressures, and at energy densities greater than liquid or compressed hydrogen (Zacharia and Rather, 2015). Like physical-based hydrogen approaches, material-based methods—adsorbents, reversible metal hydrides, and chemical hydrogen storage materials—all have advantages and disadvantages. In adsorbents, the hydrogen molecule is weakly bound (physisorbed) to the surface of high-surface area, porous materials. The weak binding in adsorbents enables the hydrogen to release from and readsorb to the surface relatively easily compared to other materials-based storage systems; however, this weak binding interaction leads to lower storage capacities relative to metal hydrides and chemical hydrogen storage materials. Theoretically, the density of hydrogen physisorbed on the surface of materials can approach the density of liquid hydrogen at very low temperatures and relatively low pressures. Metal hydrides and chemical hydrogen storage materials, in which hydrogen is chemisorbed or chemically bound, have higher hydrogen binding energies, enabling hydrogen densities twice that of liquid hydrogen at ambient temperatures and low pressures. However, these stronger binding interactions lead to slower charge–discharge kinetics and poorer reversibility. In all cases, the hydrogen capacities of the materials must be sufficiently high to achieve the fully packaged and engineered system-level targets. There are currently no material-based hydrogen storage
___________________
14 U.S. DRIVE dormancy time target is minimum 14 days for first release from initial 95% usable capacity. Boil-off target is 10% maximum reduction from initial 95% usable capacity after 30 days.
materials that meet all automotive requirements, and these approaches are not likely to be implemented in commercial FCEVs in 2025–2035.
Adsorbents.
Adsorbent hydrogen storage materials include carbon-based materials (activated carbons, carbon nanotubes, nanofibers, and fullerenes), zeolites, MOFs, covalent organic frameworks, templated carbons, boron nitride materials, and porous polymers. Adsorbents have lower hydrogen capacities than other storage systems.
One of the approaches being explored to increase the hydrogen capacity of adsorbent materials is to incorporate a metal catalyst to lengthen the hydrogen bond and enable a stronger interaction between the hydrogen molecules and the metal catalyst. Referred to as the Kubas interaction (Boateng and Chen, 2020 and references therein), this approach has met with some success, in one case demonstrating reversible hydrogen adsorption of 10.5 wt% in a porous manganese hydride at 120 bar and ambient temperature (Morris et al., 2019).
Spillover techniques, in which a species adsorbed or formed on a surface migrates onto another surface, is another approach to increasing the hydrogen storage capacity of adsorbents. In this approach, hydrogen atoms migrate from a hydrogen-rich metal surface to a hydrogen-poor surface and, in some cases, into the bulk material. Hydrogen storage in carbon materials and MOFs has been significantly enhanced by spillover techniques. Functionalization of adsorbent materials, with heteroatom dopants such as boron, nitrogen, and phosphorus, is also being investigated to mitigate metal aggregation and enable more uniform metal dispersion.
These and other novel synthetic methods are improving the hydrogen storage properties of adsorption. For example, a vanadium MOF recently demonstrated a binding enthalpy in the range predicted to enable substantial ambient-temperature hydrogen adsorption (15–25 kilojoules per mole) (Stetson, 2020). Other methods are being developed to increase the surface area of adsorbents and control pore size. For example, zeolite-templated carbons are prepared by carbonizing an organic precursor in the nanospace of a zeolite (inorganic template), followed by dissolving the template to free the resulting carbon network (Masika and Mokaya, 2013). The goal is to make materials with narrow pore size distribution and high surface area and pore volume. MOFs are also being investigated as templates.
Reversible metal hydrides.
In reversible metal hydrides, monatomic hydrogen is bound to other elements, usually metals or metalloids, within a solid. Metal hydrides are used in a variety of applications, including batteries and heat pumps, and although they have been well-studied,15 none has the entire suite of properties needed to efficiently and affordably fuel an FCEV. Light metal hydrides, such as magnesium hydride (MgH2) and aluminum hydride (also alane, or AlH3), have high gravimetric capacities: 7.6 wt% and 10.1 wt%, respectively. However, these light metal hydrides require unsuitably high temperatures and/or high pressures to operate onboard a vehicle.
Two other types of metal hydrides have shown promise for hydrogen storage: (1) intermetallic metal hydrides, in which the hydrogen atoms occupy interstitial sites within an alloy, sometimes referred to as “solid solutions”; and (2) complex hydrides, in which the hydrogen is covalently bound to another atom to form a complex anion balanced by the presence of a cation. Like adsorbents, metal hydrides release hydrogen through reversible temperature-pressure equilibrium processes, enabling the dehydrogenated material to be rehydrogenated onboard the vehicle by applying pressurized hydrogen. Basic intermetallic metal hydride systems are categorized as AB5 (e.g., LaNi5), AB (e.g., FeTi), A2B (e.g., Mg2Ni), and AB2 (e.g., ZrV2), all with varying degrees of chemical interaction with hydrogen. Substitutions in material composition can influence hydrogen absorption and desorption, and R&D efforts in this area are still under way.
Complex hydrides usually consist of alkali or alkaline earth elements ionically bonded to a complex anion. The anions typically contain hydrogen bound to a transition, main-group metal or metalloid (e.g., Fe, Ni, B, Al), or nitrogen. Examples are alanates—NaAlH4, LiAlH4, MgAlH4; borohydrides—NaBH4, LiBH4; and alloyed combinations of them. Complex hydrides have very high hydrogen capacities; metal borohydrides, for example,
___________________
15 A comprehensive database of published hydrogen alloys with properties relevant to hydrogen storage has been compiled by Sandia National Laboratories, and the resulting Hydride Information Center (Hydpark) has been incorporated into the U.S. DOE Hydrogen Storage Materials Database.
have gravimetric and volumetric energy densities that range from 14.9 wt% to 18.5 wt%, and from 2.72 kWh/L to 4.89 kWh/L, respectively (Rivard et al., 2019). Lithium borohydride (LiBH4) has been widely studied; its current drawbacks for FCEV applications include high dehydrogenation temperatures, slow kinetics, and poor reversibility. One approach to addressing these shortcomings is lowering the high dehydrogenation enthalpy with additives that form new alloy or compound phases upon dehydrogenation, effectively destabilizing the component hydrides. To date, Li-N-H systems appear to have the most potential to meet DOE 2025 targets. Specifically, the reaction Li3N + 2 H2 ⇌ Li2NH + LiH + H2 ⇌ LiNH2 + 2LiH has a total hydrogen capacity of about 10.5 wt%, and researchers have demonstrated 6.1 wt% reversibility at 250°C and 100 bar (Allendorf and Gennett, 2020). Other systems being investigated include TiN/MgH2 and TiOx/Mg(BH4)2, which have potential for light-activated hydrogen desorption at ambient temperature (Stetson, 2020).
To be suitable for FCEV applications, significant improvements are needed in metal hydride systems. R&D efforts are focused on increasing the reversible hydrogen storage capacity by modifying the composition of known materials or designing new alloys and improving the kinetics of hydrogen absorption and desorption.
Chemical hydrogen storage.
Chemical hydrogen storage materials having potential for FCEV applications are typically solid or liquid molecules in which hydrogen is covalently bound to another element and released through a chemical reaction. They usually have the highest hydrogen storage capacities. However, because hydrogen is more strongly bound in chemical storage materials, it is released through non-equilibrium processes, which are more difficult to carry out onboard the vehicle. Examples of producing hydrogen via hydrolysis include lithium hydride (LiH), lithium aluminum hydride (LiAlH4), and sodium borohydride (NaBH4), which exothermically generate hydrogen gas when reacted with water. Chemical hydrogen storage systems, therefore, are generally not reversible onboard the vehicle and would be “recharged” offboard. Because of the exothermic nature of these reactions, systems must be designed to manage the heat that is generated. In addition, these chemical hydrides are costly and must be stored under an inert gas or liquid to protect them from water.
Endothermic chemical hydrogen materials release hydrogen when heated. Examples include the following:
- Decalin-to-naphthalene reaction: C10H18 → C10H8 + 5H2, which can generate 7.3 wt% hydrogen at 210°C.
- Ammonia borane decomposition: NH3BH3 → NH2BH2 + H2 → NHBH + H2, which generates 6.1 wt% hydrogen at 120°C.
These hydrides eliminate the need for water and other equipment to manage heat. Research is currently directed at lowering dehydrogenation temperatures and improving reaction kinetics.
Another type of chemical hydrogen storage is liquid organic carriers—for example, N-ethylcarbazole and methyl-cyclopentane—which would enable a liquid refueling infrastructure. However, one of the drawbacks of current liquid hydrogen carriers is the tendency for the dehydrogenated product to solidify, which can make handling of the spent materials more difficult during removal from the vehicle and recharging. New liquid carrier materials currently being investigated include solutions of furans and pyrroles containing magnesium borane, and a system based on ammonium formate and captured CO2. More details on novel liquid fuels can be found in Chapter 10.
In addition to the complex logistics of charging and recharging, chemical storage systems tend to be more costly than others, a challenge that will have to be addressed before developing a supporting infrastructure. The cost of building and operating regeneration plants to convert the spent material back to its fully loaded hydride form must also be considered.
Chemical and solid-state materials have the potential to meet vehicular hydrogen storage system requirements in the long term. The significant technical and economic challenges that must be overcome for their practical application in FCEVs make it unlikely they will be used in commercial LDVs before 2035.
In the United States, some hydrogen storage R&D is currently supported through DOE’s HyMARC initiative—Hydrogen Materials Advanced Research Consortium, which shares its data through a public data hub (HyMARC Data Hub, 2020). DOE’s 2020 Annual Merit Review site documents the latest developments through HyMARC. Progress in the development of hydrogen storage systems has been stymied by large fluctuations in applied research
funding over the past 15 years, from a peak in 2007 to significant reductions in 2014 and beyond (Peterson and Farmer, 2017). These fluctuations have resulted in a loss of momentum and delays in advancement of vehicular hydrogen storage technologies.
6.5 HYDROGEN REFUELING INFRASTRUCTURE FOR FCEVS
A number of obstacles have limited the development of hydrogen fueling infrastructure for FCEVs. The cost of producing and delivering hydrogen to refueling stations is currently high, primarily owing to low volume demand (CaFCP, 2015; Connelly et al., 2019). Natural gas reforming is the source for most of the hydrogen produced today because it is less costly than producing hydrogen from renewable energy; this discourages some policy makers, who are increasingly focusing on decarbonization priorities, from supporting investments in hydrogen infrastructure. Although projections indicate that infrastructure costs per mile for FCEVs and BEVs could be comparable in the 2025 time frame (Melaina et al., 2014), the cost of building a hydrogen fueling station today is much higher than the cost of installing a BEV charging station, making investments in the latter seem more practical. However, hydrogen refueling of light- and medium-duty FCEVs takes minutes, while even fast-charging of BEVs takes hours. Therefore, an order of magnitude more FCEVs can be refueled at a hydrogen station. Given that the driving range of FCEVs is longer than that of BEVs, the total miles possible per day per fueling station for FCEVs allows the higher cost of the hydrogen station to be spread across a much larger number of vehicle miles driven.
Despite their complementary nature as ZEVs, FCEVs and BEVs are often cited as competing technologies and BEV/infrastructure investments and developments have outpaced those for FCEVs over the past 10 years. As a result, there is limited political awareness of and support for FCEVs and hydrogen infrastructure relative to BEVs and charging infrastructure, less public familiarity, a lower level of advocacy, and in some cases, disproportionate policy support (Trencher, 2020). California has overcome these obstacles to some extent and provides an important case study and resource for identifying and overcoming the challenges faced in building an early hydrogen infrastructure (Trencher, 2020).
6.5.1 Hydrogen Infrastructure Cost
A 2019 analysis by McKinsey and Company for Europe’s Fuel Cells and Hydrogen Joint Undertaking puts the current infrastructure costs for FCEVs and BEVs at €4,000 ($4,524)16 and €2,000 ($2,262) per vehicle, respectively (FCH JU, 2019). The hydrogen refueling infrastructure cost includes the cost of hydrogen production and distribution, and the hydrogen station. The analysis notes that, because FCEVs refuel in 5 minutes or less, one hydrogen station can serve 10 to 15 times more FCEVs than one BEV fast-charger, and projects that the hydrogen infrastructure will become less costly on a per vehicle basis compared to the charging infrastructure as the size of the FCEV fleet increases. Figure 6.24 describes projections for a phased deployment in which FCEV infrastructure cost decreases to an estimated €3,500 ($3,958) per vehicle after the initial hydrogen station network is built and station utilization increases, with additional economies of scale decreasing cost to €2,500 ($2,827) per vehicle or below. The analysis projects that grid upgrades for BEV charging, particularly an expanding fast-charging infrastructure, increase the BEV infrastructure cost to an estimated €2,500 per vehicle.
6.5.2 Hydrogen Infrastructure Development
In places where hydrogen refueling is available—primarily Japan, Germany, South Korea, and California—the markets for FCEVs are growing (Isenstadt and Lutsey, 2017). A significant driver for the hydrogen infrastructure in those regions is the availability of state or federal government subsidies for construction of hydrogen stations (Scheffler, 2019). Japan has 109 stations in operation and another 51 planned by the end of 2020; Japan’s roadmap targets 320 stations in 2025 and 900 in 2030. Germany has 84 hydrogen refueling stations in operation (FuelCellsWorks, 2020). The goal of Germany’s public-private partnership is 400 stations by the end of 2023 and
___________________
16 Based on 1 Euro = 1.1310 U.S. dollar, Business Insider Currency Converter, July 6, 2020.
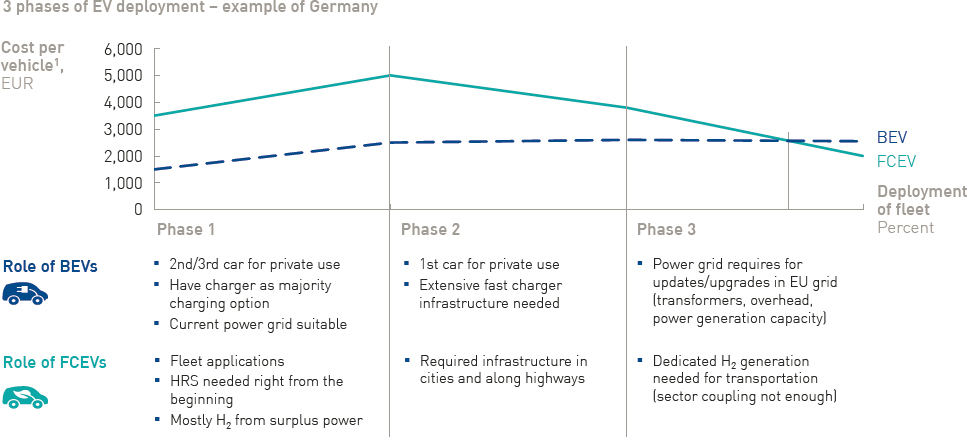
SOURCE: FCH JU (2019).
900 by 2030. Throughout the rest of Europe, 31 stations are operational with an additional 21 scheduled to come online soon. South Korea had 14 stations in operation in 2018 with plans to open a total of 100 by 2022. China has 15 operating stations with another 33 in planning phase (Scheffler, 2019).
Using H2 Tools as a source (PNNL, n.d.), Greene et al. (2020) identified seven countries that account for more than 80% of hydrogen stations worldwide (Figure 6.25), including stations planned to be opened by the end of 2020. Of the stations indicated in Figure 6.25, 80% are open to the public while others are used by fuel cell bus companies or for other purposes (Greene et al., 2020).
In the United States, California is taking the lead. Through its Assembly Bill (AB) 8 program, the State committed $20 million per year over 10 years (2013–2023) to support the construction of 100 hydrogen stations, and to help support the stations’ operations and maintenance (O&M) during the early stages of the infrastructure build-out (AB 8, 2013). The stations are projected to service up to 30,000 FCEVs sold to consumers by Toyota, Honda, and Hyundai.
California has more than 40 retail hydrogen stations in operation today, providing more than 11,800 kilograms per day (kg/day) and supporting more than 6,000 registered FCEVs (Baronas and Achtelik, 2019; Reed et al., 2020). With more than 20 additional stations under construction, this network is projected to provide 24,500 kg/day by the end of 2020. Average station capacity utilization (ratio of dispensed hydrogen to station capacity) during 2019 was around 34% (Baronas and Achtelik, 2019). According to industry experts, utilizations of 70%–80% are needed for profitability. The California Air Resources Board (CARB) and the California Energy Commission are developing a methodology to determine the cost and timeline to enable the California hydrogen fueling station network to be financially self-sufficient. The analysis will examine the cash flow and financial performance of the stations, including an assessment of the station installation and O&M costs, capacities and utilizations, and so on needed for profitability (CARB, 2019).
California’s Low Carbon Fuel Standard Hydrogen Refueling Infrastructure credit program, launched in 2019, has encouraged hydrogen station operators to increase the renewable hydrogen content of their fuel and earn more credits. CARB reported that 39% of the hydrogen dispensed by the station network will come from renewable
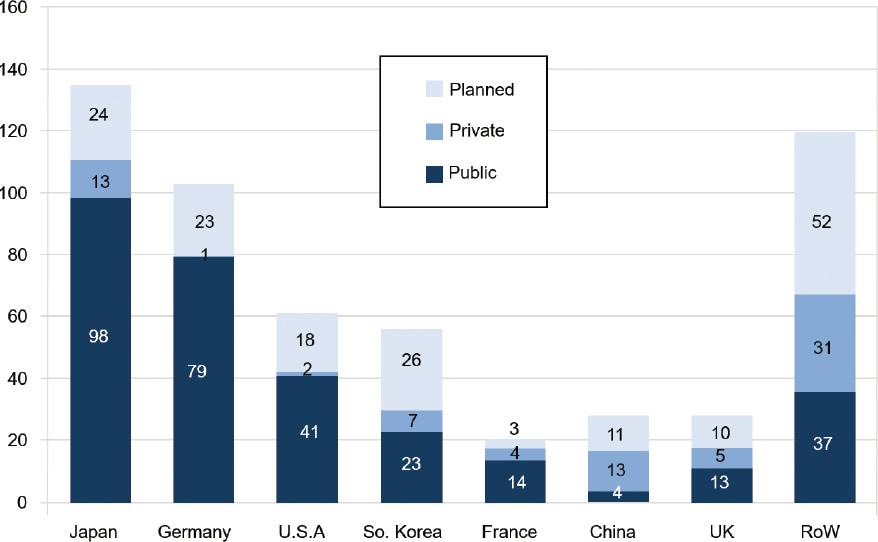
SOURCE: Originally published in eTransportation, 6, Greene et al., Challenges in the Designing, Planning and Deployment of Hydrogen Refueling Infrastructure for Fuel Cell Electric Vehicles, © Elsevier (2020).
sources and that some station operators have identified new hydrogen feedstock sources that will provide 100% renewable hydrogen (Baronas and Achtelik, 2019). California’s Executive Order B-48-18 targets 200 hydrogen stations by 2025 (State of California, 2018). CARB coordinates with stakeholders through the public-private California Fuel Cell Partnership (CaFCP), which envisions 1 million FCEVs and 1,000 hydrogen fueling stations in California by 2030 (CaFCP, 2018).
Using its Hydrogen Financial Analysis Scenario Tool, H2FAST, NREL conducted financial assessments of California’s hydrogen stations (Baronas and Achtelik, 2019, Appendix E; NREL, n.d.). It reported an average cost of $2.4 million for 180 kg/day stations supplied by delivered gaseous hydrogen, and $2.8 million for 350 kg/day stations supplied by delivered liquid hydrogen. These installed costs are all-inclusive—including equipment, design, permitting, engineering, construction, project management, and overhead. For comparison, a recent International Council on Clean Transportation (ICCT) study projects that single-dispenser H2 stations having capacities of 1,100–1,700 kg/day for long-haul tractor trailers, drayage trucks, and delivery trucks will cost $2.0–$2.9 million in 2030, or less than $2,000 per kg of H2 delivered (Hall and Lutsey, 2019).
For a $2 million, 180 kg/day California LDV station, costs are typically around $1.6 million for equipment and materials, and around $400,000 for permitting, site engineering, construction, commissioning, and general overhead (Baronas and Achtelik, 2019). To support O&M costs, CARB provided grants averaging $100,000 per year for up to 3 years for each station. A survey of the California hydrogen station owners indicated operating costs as high as $200,000 per year.
While installed costs are higher for larger, higher capacity stations than for smaller stations, the cost per kg of hydrogen delivered is typically lower for larger stations. Figure 6.26 shows installed station costs per kg of hydrogen delivered as a function of the station’s daily capacity for California’s stations (CARB, 2019). Costs ranged from about $5,000 per kg for a 500 kg/day station to roughly $25,000 per kg for a 180 kg/day station.
An analysis of station capital costs for various capacities over time is shown in Figure 6.27. The projected station costs are based on NREL’s Hydrogen Station Capital Cost Calculator, which estimates cost reductions based on both economies of scale and the experience gained as more stations are built (Melaina and Penev, 2013).
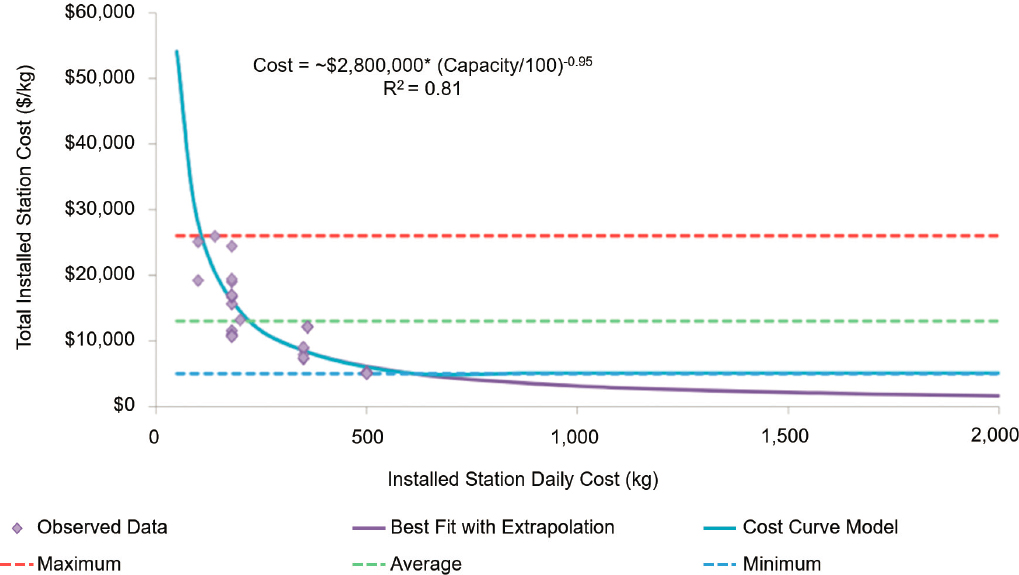
SOURCE: CARB (2019).
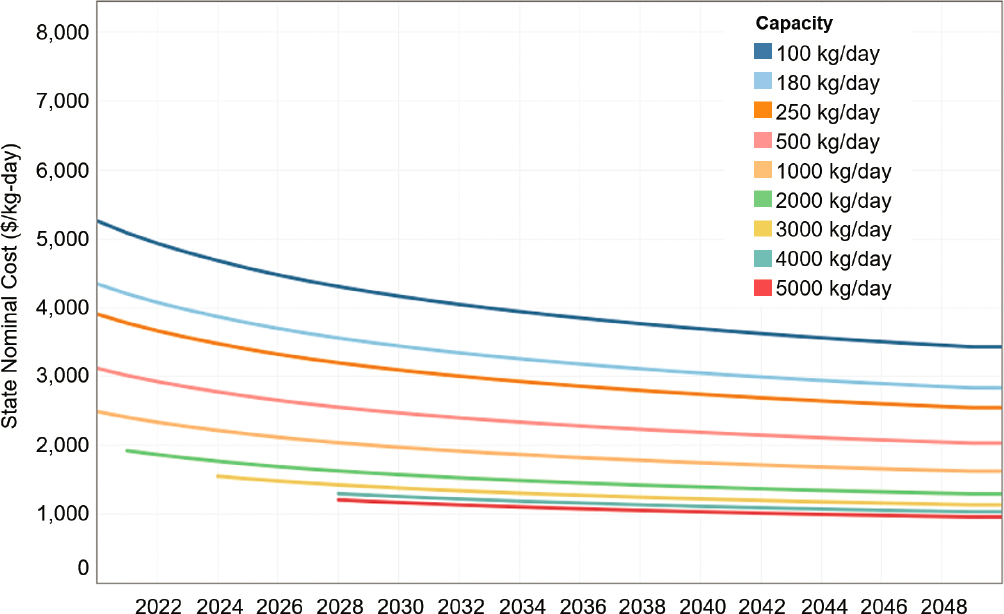
SOURCE: Bush et al. (2019).
The number, size, and locations of the stations were estimated using NREL’s Scenario Evaluation and Regionalization Analysis (SERA) Model and are based on meeting hydrogen demand from increasing deployment of FCEVs and providing the required hydrogen supply—production and delivery—to meet that demand (Bush et al., 2019).
Automakers and hydrogen suppliers have stated their intent to make the Northeast states the next market for FCEVs and refueling stations. Driven by the Multi-State Zero-Emission Vehicles (ZEVs) Programs Memorandum of Understanding, a collaboration of nine northeastern states and California, the Multi-State Zero-Emission Vehicle Action Plan was drafted to work toward the collective deployment of 3.3 million ZEVs, including FCEVs, by 2025, and the establishment of sufficient fueling infrastructure to enable this scale. Toyota and Air Liquide are collaborating to bring stations and vehicles to the Northeast; 12 stations are planned (Nied, 2015; Air Liquide, 2016a, 2016b). However, as mentioned previously, the prohibition of hydrogen-powered vehicles in tunnels and on the lower deck of two-tier bridges in the Northeast has delayed the introduction of FCEVs in that region (Port Authority of NY and NJ, 2016; State of New Jersey, 2019; Massachusetts Department of Transportation, 2019). (See above Section 6.3.1.2 for additional information on this topic.)
Table 6.4 summarizes three scenarios for FCEV adoption and infrastructure buildout in 2050 based on coordinated rollout of vehicles and stations that enables continued FCEV market growth in California and subsequent expansion into other regions (Bush et al., 2019; Melaina et al., 2017). Assumptions include various levels of consumer demand, policy drivers, and local and regional planning and coordination efforts. Recent review articles provide summaries of worldwide efforts to develop hydrogen refueling infrastructure for FCEVs, assessments of the challenges faced, and strategies to overcome the challenges, including the need for stronger and more consistent policy support (Greene et al., 2020; Trencher, 2020).
The buildout of hydrogen infrastructure is expected to benefit from development of fuel cells for MHDV applications and from fleet vehicles that need constant operation, quick refueling, and/or high daily VMT. The cost of hydrogen for all transport applications is expected to decrease in the next decade as existing hydrogen technologies are scaled up and hydrogen equipment and supply chain costs are reduced (Ogden, 2018). Current research is focused on reducing the costs of producing hydrogen from low-carbon sources and delivering hydrogen to the station and the vehicle.
TABLE 6.4 FCEV Adoption and Hydrogen Refueling Infrastructure Buildout Scenarios for 2050
| Market Trend | Urban Markets | State Success | National Expansion |
|---|---|---|---|
| Dominant policy drivers | Support at local and municipal levels combines with strong early adopter demand. | ZEV mandate and other support policies. | Combination of strong local state and national policies. |
| Coordination and planning | Investments focused on most promising metropolitan markets. | Strong coordination across ZEV mandate states. | Strong coordination and planning across all regions. |
| Consumer adoption | High concentrations of early adopters guide market development. | FCEV adoption primarily driven by ZEV mandate. | Adoption moves quickly from concentrated early adopters and ZEV mandate states to broad megaregion markets. |
| HRS network expansion | Gradual expansion from promising urban markets to nearby cities. | Focus on ZEV mandate states, with gradual expansion into additional markets. | Strong policy drivers and coordination reduce investment risks, allowing rapid network expansion. |
| FCEV Sales per Year (millions) and Market Share (%) of Total Sales in Urban Areas in 2050a | |||
| United States | 3.1 million (23%) | 5.0 million (35%) | 8.9 million (59%) |
| California | 1.0 million (49%) | 1.3 million (64%) | 1.7 million (84%) |
| Other ZEV states | 0.9 million (26%) | 1.9 million (56%) | 1.9 million (57%) |
| Rest of country | 1.2 million (10%) | 1.9 million (14%) | 5.3 million (41%) |
a Total sales are based on EIA (2017). Future vehicle sales projections are taken from EIA Annual Energy Outlook. Within each census division, sales are allocated to different urban areas based on the proportion of current vehicle stock, from IHS automotive data. For example, if Arvin, California, has 1% of the current vehicles in the Pacific census division, it is assumed that 1% of the new vehicle sales in that division will occur in Arvin, California.
SOURCE: Bush et al. (2019).
6.5.3 Hydrogen Delivery
For FCEVs to be competitive with gasoline vehicles on a cost-per-mile basis in the LDV market, U.S. DRIVE has set a target of < $4/kg, untaxed and dispensed at the pump. CaFCP has reported that the average retail price of hydrogen at California stations from Q4 2018 through Q3 2019 was $16.51/kg (Baronas and Achtelik, 2019). Cost reductions are needed for low-carbon hydrogen production pathways and for delivering hydrogen, including the costs of compression, storage, and dispensing. For more information on hydrogen supply and future costs of H2 production via PEM electrolysis see Chapter 10 (Section 10.2).
Hydrogen is commonly transported as a liquid by cryogenic tank truck or as a compressed gas by tube trailer (typically 180 bar) or by pipeline. Two additional approaches are being explored for the longer term: (1) transport in solid or liquid carrier form, using a material that chemically binds or physisorbs hydrogen; and (2) transport as a cryogenic gas at temperatures of around 80 K.
Roughly 75% of California’s retail hydrogen stations are supplied by compressed H2 delivery; the remainder use liquid H2 or pipeline delivery, or generate hydrogen onsite using steam-methane reforming or electrolysis (Saur et al., 2019). Current delivery and dispensing costs (excluding production) for tube-trailer gaseous stations are projected to be $9.50/kg and $8/kg at 450 kg/day and 1,000 kg/day stations, respectively (2016$). For liquid tanker-based stations, delivery costs are estimated to be $11/kg at 450 kg/day and $8/kg at 1,000 kg/day stations.17 R&D efforts currently under way could enable a reduction in hydrogen delivery and dispensing costs to $5/kg in 2025 at stations supplied by liquid hydrogen tanker trucks. To achieve a hydrogen cost of $4/kg at the pump, delivery costs of around $2/kg will be needed.
For hydrogen stations of 1,000 kg/day capacity, which are anticipated by 2025, liquid tanker delivery has been identified as the most viable approach (Martinez and Achtelik, 2017). For higher demand scenarios—hydrogen stations at 3,000 kg/day capacity—technoeconomic analyses suggest that pipelines are a relatively low-cost option for hydrogen delivery (Rustagi et al., 2018). More than 1,600 miles of hydrogen pipelines are in operation in the United States today, typically at 70 bar maximum pressure (U.S. DRIVE, 2017d). Higher pressure operation may be needed for economic distribution of hydrogen for refueling stations. Improvements in pipeline materials are expected to enable an operating pressure of 100 bar in the United States (Fekete et al., 2015). Higher pressure pipelines could also reduce the space and cost required by compression and storage equipment at the refueling station. A pipeline with a design pressure of 1,000 bar has been operating in a Germany industrial park since 2006; it currently delivers hydrogen directly to 350 and 700 bar dispensers at a hydrogen vehicle refueling station (Penev et al., 2019). Currently, only one hydrogen station in the United States is supplied via pipeline. In operation since 2011, the 55 bar pipeline delivers hydrogen to a station in Torrance, California (Air Products, 2016).
Improving the durability and reliability of station equipment is key to reducing hydrogen delivery costs (Rustagi, 2018). An assessment of equipment maintenance events from 2016 through 2018, 67% of which were unscheduled, indicated that hydrogen dispensers account for more than half (57%) of the required maintenance, followed by compressors (25%) and chillers (12%) (Saur et al., 2019). The assessment also showed that maintenance costs per kilogram decreased significantly during that time frame as more hydrogen was dispensed and as stations matured. Figure 6.28 shows that, in addition to increasing station capacity, improvements in compression, liquefaction, and dispenser technologies, and pipeline and storage materials, are needed to make hydrogen fuel cost-competitive in the marketplace (FCHEA, 2020).
Several OEMs and hydrogen providers have noted that deployment of fuel cells in heavy-duty transportation applications—drayage and long-haul trucks, buses, marine vessels, and large mining vehicles—will exponentially increase demand and drive down the cost of hydrogen production and distribution. More information on hydrogen production and its associated emissions can be found in Chapter 10. Figure 6.29 shows potential hydrogen cost reduction pathways for both LDV and heavy-duty vehicle (HDV) scenarios. DOE’s Hydrogen at Scale program, summarized in Box 6.1, aims to reduce hydrogen cost by pursuing opportunities based on cross-sector synergies.
___________________
17 Hydrogen Delivery Scenario Analysis Model (HDSAM) based on operational data from California stations; documented in Koleva and Rustagi (2020).
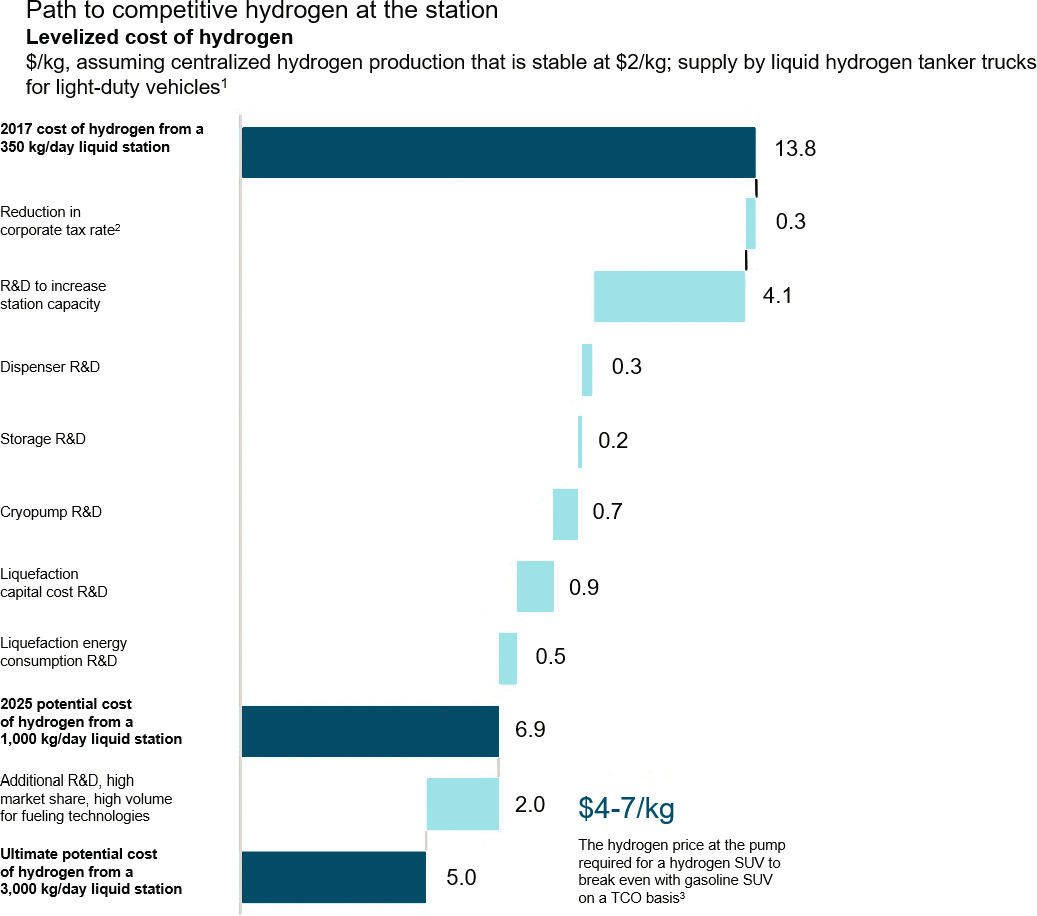
SOURCE: FCHEA (2020).
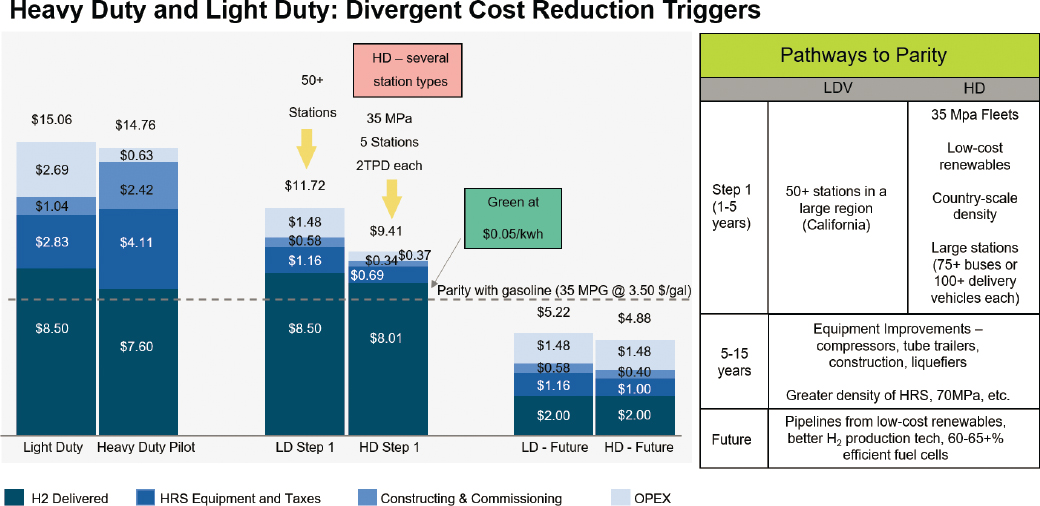
SOURCE: Munster (2019).
6.6 SUMMARY OF FUEL CELL VEHICLE COSTS
Continued technology advancements will lead to improved performance and reduced costs for FCEVs and hydrogen refueling stations in 2025–2035. Cost and effectiveness estimates for different components of the fuel cell system are outlined in Table 6.5.18 Economies of scale will also bring down costs, and synergies with the renewable energy sector and industrial uses of hydrogen could also be an important factor. A recent analysis suggests that FCEVs could reach TCO parity with ICE SUVs in 2025–2030 at a hydrogen price of $4 to $7/kg at the pump (FCHEA, 2020). At current hydrogen prices, $4/kg by 2030 seems optimistic, especially for renewable hydrogen, which is likely to be required in a carbon-constrained world. A recent study from the ICCT projects a median price of $7.37/kg and a minimum price of $4.95/kg in 2030 for hydrogen produced by a grid-connected electrolyzer operating on renewable electricity only—and these prices exclude the cost of delivering the hydrogen to the station. However, as shown in Figure 6.28, pathways to $7/kg hydrogen in that time frame have been identified. On the vehicle side, a recent FCEV market study projects that more than 25 FCEV models could be available globally by 2030, accounting for 1%–1.5% of global passenger vehicle sales (or about 1.17–1.75 million cars; Wagner, 2020) (Research and Markets, 2020). The Fuel Cell Hydrogen and Energy Association projects sales of 1.2 million FCEVs in the United States by the end of 2030 and 4,300 hydrogen stations (FCHEA, 2020). However, for more widespread deployment in the United States, market expansion to urban areas outside California is needed, supported by policies that incentivize FCEV purchases and assist industry in building a hydrogen refueling network until stations become profitable. Three automakers have reiterated plans to continue development of fuel cell technology for the LDV market in the near term. While the shift by some automakers to a short-term focus on MHDV applications for fuel cells introduces uncertainties regarding widespread LDV deployment, the increased focus on those applications will enable continued fuel cell cost reductions, durability improvements, and hydrogen infrastructure build-out. While it is unlikely that FCEVs will have a significant impact on 2025–2030 CAFE standards, it is possible they will be a factor in 2035 and beyond.
Numbers for FCEV Cost and Effectiveness, shown in Table 6.5, were generated using ANL’s Autonomie model,19 a vehicle simulation tool used to evaluate a wide range of vehicle applications, powertrain configurations, and component technologies for different time frames. The tool estimates costs and projects potential future petroleum displacement. Table 6.5 reports simulation results for the “high technology progress” case, based on meeting DOE R&D targets established through U.S. DRIVE.
The simulations were performed for the following:
- Five powertrain configurations: ICEVs, hybrid electric vehicles, PHEVs, BEVs, and FCEVs;
- Five vehicle classes: compact car, midsize car, small SUV, midsize SUV, and pickup truck;
- Two performance categories: base (non-performance) and premium (performance);
- Different fuels: gasoline, diesel, hydrogen, and battery electricity; and
- Five different time frames: laboratory years 2015 (reference case), 2020, 2025, 2030, and 2045. The study assumes a 5-year delay between laboratory year and model year (the year the vehicle is first produced).
The results in Table 6.5 are from ANL’s fifth revision of its Benefits and Scenario Analysis (Islam et al., 2020). The study used technical targets and other input from subject matter experts (technology development managers) in the DOE Vehicle Technologies Office and Hydrogen and Fuel Cell Technologies Office, and evaluated the impact of technology improvements on vehicle component sizes (i.e., power, energy, weight), fuel and electricity consumption, and manufacturing cost.
___________________
18 These cost projections are based on DFMA analysis of modeled state-of-the-art fuel cell systems and assume that DOE cost and durability targets are met. They do not include the durability-adjusted cost estimates discussed in Section 6.4.
19 Autonomie is a state-of-the-art vehicle system simulation tool used to assess the energy consumption, performance, and cost of multiple advanced vehicle technologies. Autonomie is packaged with a complete set of vehicle models for a wide range of vehicle classes, powertrain configurations, and component technologies, including vehicle level and component level controls. These controls were developed and calibrated using dynamometer test data.
TABLE 6.5 FCEV Cost and Effectiveness 2025 and 2035 Model Years (ANL’s Autonomie)
| FCEV Package Technologies | Technology Details by Vehicle Class (2025 MY) | Technology Cost by Class | Technology Effectiveness by Class (MPG combined cycle, effficiency, and kg usable H2) | Technology Details by Vehicle Class (2035 MY) | Technology Cost by Class | Technology Effectiveness by Class (MPG combined cycle) |
|---|---|---|---|---|---|---|
| Total Package | Small, 436/425 mi range | 74.7 MPG | Small, 441/433 mi range | 92.9 MPG | ||
| Fuel Cell System | Midsize, 427/430 | 69.1 MPG | Midsize, 434/437 | 89.5 MPG | ||
| Battery | Small SUV, 434/418 | 59.4 MPG | Small SUV, 439/425 | 74.7 MPG | ||
| Motor | Midsize SUV, 439/411 | 55.2 MPG | Midsize SUV, 444/418 | 69.6 MPG | ||
| H2 Storage System | Pickup, 441/418 | 44.2 MPG | Pickup, 447/422 | 56.3 MPG | ||
| Fuel Cell System | Small (67 kW max) | $3,383 | 63% efficiency | Small (60 kW max) | $2,246 | 68% efficiency |
| Fuel Cell Stack | Midsize (81 kW) | $4,094 | Midsize (69 kW) | $2,565 | ||
| Balance of Plant | Small SUV (90 kW) | $4,502 | Small SUV (79 kW) | $2,935 | ||
| Midsize SUV (89 kW) | $4,455 | Midsize SUV (77 kW) | $2,885 | |||
| Pickup (143 kW) | $7,172 | Pickup (122 kW) | $4,545 | |||
| Battery | Small (29 kW/1.2 kWh) | $491 | Small (28 kW/1.2 kWh) | $430 | ||
| Li-ion | Midsize (36 kW/1.5 kWh) | $601 | Midsize (28 kW/1.2 kWh) | $430 | ||
| Small SUV (36 kW/1.5 kWh) | $601 | Small SUV (31 kW/1.4 kWh) | $478 | |||
| Midsize SUV (39 kW/1.6 kWh) | $655 | Midsize SUV (31 kW/1.4 kWh) | $478 | |||
| Pickup (46 kW/1.9 kWh) | $764 | Pickup (37 kW/1.6 kWh) | $573 | |||
| Motor | Small (73 kW) | $736 | Small (67 kW) | $335 | ||
| Induction Primary | Midsize (90 kW) | $903 | Midsize (76 kW) | $383 | ||
| Small SUV (100 kW) | $1,003 | Small SUV (88 kW) | $444 | |||
| Midsize SUV (98 kW) | $982 | Midsize SUV (86 kW) | $430 | |||
| Pickup (162 kW) | $1,626 | Pickup (139 kW) | $695 | |||
| H2 Storage Tank | Small (4.1 kg H2) | $2,159 | 4.1 kg usable H2 | Small (3.3 kg H2) | $1,259 | 3.3 kg usable H2 |
| Midsize (4.4 kg) | $2,256 | 4.4 kg | Midsize (3.4 kg) | $1,275 | 3.4 | |
| Small SUV (5.1 kg) | $2,475 | 5.1 kg | Small SUV (4.1 kg) | $1,369 | 4.1 | |
| Midsize SUV (5.4 kg) | $2,596 | 5.4 kg | Midsize SUV (4.4 kg) | $1,410 | 4.4 | |
| Pickup (6.9 kg) | $3,051 | 6.9 kg | Pickup (5.4 kg) | $1,564 | 5.4 |
SOURCE: Islam et al., 2020.
Uncertainties were addressed for both technology performance and cost by simulating two cases:
- Low uncertainty case: assumed slow technology progress and was based on DOE technology manager estimates of OEM improvements driven by regulations and business as usual; and
- High uncertainty case: assumed aggressive technology advancements based on achieving DOE R&D targets.
The costs in Table 6.5 are based on the best-case scenario—the high uncertainty case. Fuel cell power density was assumed to increase from 650 W/kg in the reference case (2015 laboratory year) to 900 W/kg in 2030 (MY 2035).20 Fuel cell peak efficiency was assumed to increase from 61% in 2015 to 68% in 2030 (MY 2035). The simulation also projected decreases in fuel cell system peak power in 2025 and 2035 MY FCEVs owing to improved component efficiencies and vehicle lightweighting, which also led to reductions in FCEV fuel consumption. Manufacturing cost was assumed to decrease as a result of technology improvement as well.
Fuel cell estimates in the ANL study were based on the best available data in 2018 for fuel cells at high volume manufacturing (500,000 units per year). Since the conclusion of the study, more recent estimates of fuel cell technology performance and cost have been published by DOE, and some technical targets have been updated (Kongkanand, 2020). Cost reductions are dependent on several factors, including continued momentum in fuel cell R&D for LDVs, adequate R&D funding levels, and market opportunities for light-duty FCEVs to enable economies of scale.
6.7 FINDINGS AND RECOMMENDATIONS FOR FCEVs
FINDING 6.1: Limited volumes of fuel cell electric vehicles (FCEVs) have been introduced in California by Honda, Hyundai, and Toyota. Plans to introduce FCEVs in the Northeast United States have been delayed, largely owing to the prohibition of hydrogen-powered vehicles in tunnels and on the lower deck of two-tier bridges in that region. Recent studies of FCEV safety in tunnels have provided data responding to concerns of local officials. FCEVs will have minimal impact on the 2025–2030 Corporate Average Fuel Economy standards but are likely to become more important in a longer time frame. Focus on FCEV deployment is generally much stronger in Asia, particularly Japan, and in Germany, than in the United States.
FINDING 6.2: The lack of hydrogen fueling infrastructure is a significant obstacle to fuel cell electric vehicle (FCEV) deployment. The high cost of building hydrogen stations is often cited as a concern; however, there is a lack of up-to-date, detailed analyses on the cost of hydrogen infrastructure build-out, particularly in terms of cost per vehicle and cost per mile driven. Within the United States, hydrogen stations are mostly limited to California, driven by station subsidies provided by the State government and a coordinated rollout of FCEVs and stations. Plans to introduce hydrogen stations in the Northeast United States have been delayed owing to the delay in introduction of FCEVs there.
FINDING 6.3: While most automakers are continuing to develop fuel cell technology for light duty vehicles (LDVs), some automakers have shifted their short-term focus from LDV applications to medium- and heavy-duty vehicle (MHDV) applications. Fuel cells currently provide a lighter-weight electric propulsion system than batteries in MHDV applications as well as longer driving range between refueling and faster refueling times. MHDV fleets are expected to create early demand for hydrogen and facilitate development of the hydrogen refueling infrastructure.
FINDING 6.4: Materials and design and engineering improvements continue to lower the cost and improve the performance of fuel cell systems, hydrogen storage tanks, fuel cell electric vehicles, and hydrogen stations. The proton-exchange membrane fuel cell, containing platinum and platinum-alloy catalysts and perfluorosulfonic acid type membranes, is expected to be the automakers’ technology of choice for 2025–2035 vehicles.
___________________
20 For comparison, under the low uncertainty scenario, power density and peak efficiency increased to 675 W/kg and 65%, respectively, in 2030 (MY 2035), which the industry has already exceeded or is close to achieving.
FINDING 6.5: Current research and development efforts are focused on reducing cost and improving durability of fuel cell and hydrogen systems by (1) lowering fuel cell platinum content, (2) developing non-precious metal fuel cell catalysts, (3) developing higher temperature membranes to simplify fuel cell system design and engineering, (4) increasing the efficiency and reducing the capital cost of electrolyzers for producing renewable hydrogen, (5) developing lower cost carbon fiber manufacturing processes for compressed hydrogen storage tanks, and (6) developing lower cost hydrogen compression technologies.
FINDING 6.6: Economies of scale are critical to reducing cost of fuel cell electric vehicle (FCEV) and hydrogen technologies, yet manufacturing R&D efforts have been limited. Development of low-cost, high-throughput manufacturing processes for electrolyzers, fuel cells, and hydrogen storage tanks for all FCEV classes is needed to achieve economies of scale.
FINDING 6.7: Hydrogen R&D efforts are focused on producing renewable hydrogen and exploring synergies between hydrogen for transportation applications and hydrogen production and use in other industries and applications to lower cost and facilitate development of a hydrogen fuel infrastructure. These include efforts in developing renewable hydrogen as a feedstock for carbon-neutral synthetic liquid fuels such as methanol and dimethyl ether, and as a means of storing energy for the electric grid from intermittent wind and solar resources.
RECOMMENDATION 6.1: In addition to funding research and development (R&D) on hydrogen and fuel cell technologies for medium- and heavy-duty vehicle applications, the U.S. Department of Energy should continue funding R&D to reduce cost and improve performance of hydrogen and fuel cell technologies for light-duty vehicle applications. Funding for manufacturing R&D should be increased to enable reduced cost through economies of scale.
RECOMMENDATION 6.2: Coordinated state, regional, and national plans should be developed to enable successful, high-volume fuel cell electric vehicle and hydrogen station deployment through public-private partnerships. Data and analysis needs responding to concerns of state and local officials should be identified and addressed, particularly up-to-date information on the cost of hydrogen infrastructure build-out, cost of infrastructure per vehicle and per miles traveled, policy options to support initial infrastructure build-out, and safety concerns. The U.S. Department of Energy and U.S. Department of Transportation should coordinate with state governments to facilitate regional planning and provide independent, fact-based data to help guide local policy decisions.
6.8 REFERENCES
AB 8, Chapter 401, Statutes of 2013. Alternative fuel and vehicle technologies: Funding programs. (2013–2014). https://leginfo.legislature.ca.gov/faces/billNavClient.xhtml?bill_id=201320140AB8.
ABB. 2020. “ABB Brings Fuel Cell Technology a Step Closer to Powering Large Ships.” ABB Group Release. April 8. https://new.abb.com/news/detail/60096/abb-brings-fuel-cell-technology-a-step-closer-to-powering-large-ships.
Adams, J. 2020. “DOE H2 Heavy Duty Truck Targets.” Presented at the Compressed Gas Storage for Medium and Heavy Duty Transportation Workshop. January 21.
Adams, J., C. Houchins, and R. Ahluwalia. 2019. “Onboard Type IV Compressed Hydrogen Storage System—Cost and Performance Status.” 19008. DOE Hydrogen and Fuel Cells Program Record. Department of Energy. https://www.hydrogen.energy.gov/pdfs/19008_onboard_storage_cost_performance_status.pdf.
AFDC (Alternative Fuels Data Center). n.d.a. “How Do Fuel Cell Electric Vehicles Work Using Hydrogen?” Alternative Fuels Data Center. https://afdc.energy.gov/vehicles/how-do-fuel-cell-electric-cars-work.
AFDC. n.d.b. “Natural Gas Laws and Incentives in New York.” Department of Energy, Office of Energy Efficiency and Renewable Energy. https://afdc.energy.gov/fuels/laws/NG?state=NY.
Ahluwalia, R., X. Wang, and J-K Peng. 2020a. “Performance and Durability of Advanced Automotive Fuel Cell Stacks and Systems with State-of-the-Art d-PtCo/C Cathode Catalyst in Membrane Electrode Assemblies.” FY2019 Annual Progress Report. Argonne, IL: Argonne National Laboratory.
Ahluwalia, R., X. Wang, and J-K Peng. 2020b. “Fuel Cell System Modeling and Analysis.” Presented at the U.S. DOE Hydrogen and Fuel Cells Program 2020 Annual Merit Review and Peer Evaluation Meeting, Washington, DC, May 19.
Air Liquide. 2016a. “Air Liquide Announces Locations of Several Hydrogen Stations in Northeast U.S.A.” April 7. https://energies.airliquide.com/air-liquide-announces-locations-several-hydrogen-stations-northeast-usa.
Air Liquide. 2016b. “Air Liquide Celebrates Completion of New Hydrogen Fueling Stations in California and U.S. Northeast.” October 8. https://energies.airliquide.com/new-hydrogen-fueling-stations.
Air Products. 2016. “Air Products Selected for Technology Upgrade at Shell Hydrogen Fueling Station in Torrance, California.” Press Release. November 15. http://www.airproducts.com/Company/news-center/2016/11/1115-air-products-selected-fortechnology-upgrade-at-shell-hydrogen-fueling-station.aspx.
Allendorf, M., and T. Gennett. 2020. “HyMARC: A Consortium for Advancing Hydrogen Storage Materials.” Presented at the DOE Hydrogen Program: 2020 Annual Merit Review. https://www.hydrogen.energy.gov/pdfs/review20/st127_allendorf_gennett_2020_o.pdf.
Automotive News Europe. 2020. “Daimler Will End Development of Fuel Cell Cars.” Automotive News Europe. April 22. https://europe.autonews.com/automakers/daimler-will-end-development-fuel-cell-cars.
Bach, P. 2019. “Bipolar Plates: Carbon or Metal for PEM Fuel Cells? [Infographic].” May 30. https://blog.ballard.com/bipolar-plates.
Banham, D., and S. Ye. 2017. Current status and future development of catalyst materials and catalyst layers for proton exchange membrane fuel cells: An industrial perspective. ACS Energy Letters 2(3):629–638. https://doi.org/10.1021/acsenergylett.6b00644.
Banham, D., J. Choi, T. Kishimoto, and S. Ye. 2019. Integrating PGM-free catalysts into catalyst layers and proton exchange membrane fuel cell devices. Advanced Materials 31(31):1804846. https://doi.org/10.1002/adma.201804846.
Baronas, J., and G. Achtelik. 2019. Joint Agency Staff Report on Assembly Bill 8: 2019 Annual Assessment of Time and Cost Needed to Attain 100 Hydrogen Refueling Stations in California. California Energy Commission and California Air Resources Board. Publication Number: CEC-600-2019-039.
Bizon, N. 2017. Energy optimization of fuel cell system by using global extremum seeking algorithm. Applied Energy 206(November):458–474. https://doi.org/10.1016/j.apenergy.2017.08.097.
BMW Group. 2019. “The BMW i Hydrogen NEXT. Our Fuel Cell Development Vehicle.” September 10. https://www.bmwgroup.com/en/news/2019/bmw-i-hydrogen-next.html.
Boateng, E., and A. Chen. 2020 Recent advances in nanomaterial-based solid-state hydrogen storage. Materials Today Advances 6(June 1):100022. https://doi.org/10.1016/j.mtadv.2019.100022.
Borup, R., D. Leonard, K.C. Neyerlin, S. Kabir, and D. Cullen. 2019. “Low Cost Gas Diffusion Layer Materials and Treatments for Durable High Performance PEM Fuel Cells.” Presented at the 2019 Annual Merit Review, Department of Energy. https://www.hydrogen.energy.gov/pdfs/review19/fc319_borup_2019_p.pdf.
Bush, B., M. Muratori, C. Hunter, J. Zuboy, and M. Melaina. 2019. Scenario Evaluation and Regionalization Analysis (SERA) Model: Demand Side and Refueling Infrastructure Buildout. Golden, CO: National Renewable Energy Laboratory. NREL/TP-5400-70090. https://www.nrel.gov/docs/fy19osti/70090.pdf.
CaFCP (California Fuel Cell Partnership). 2015. “Cost to Refill.” https://cafcp.org/content/cost-refill.
CaFCP. 2018. The California Fuel Cell Revolution: A Vision for Advancing Economic, Social, and Environmental Priorities. July. https://cafcp.org/sites/default/files/CAFCR.pdf.
CaFCP. 2020. “H2 Station List.” https://cafcp.org/sites/default/files/h2_station_list.pdf.
Car and Driver. 2019. “2020 Toyota Mirai Review, Pricing, and Specs.” Car and Driver. December 3. https://www.caranddriver.com/toyota/mirai-2020.
CARB (California Air Resources Board). 2019. 2019 Annual Evaluation of Fuel Cell Electric Vehicle Deployment and Hydrogen Fuel Station Network Development. July.
Castillo, G. 2017. “Hyundai Fuel Cell: NEXO Introduction.” January. https://cafcp.org/sites/default/files/Hyundai%20%2-%20Gil%20Castillo%20-%20January%2023.pdf.
Connelly, E., A. Elgowainy, and M. Ruth. 2019. “Current Hydrogen Market Size: Domestic and Global.” DOE Hydrogen and Fuel Cells Program Record, October 1. https://www.hydrogen.energy.gov/pdfs/19002-hydrogen-market-domestic-global.pdf.
Consumer Reports. n.d. “Toyota Mirai 2016–2020 Quick Drive.” Consumer Reports Video. http://www.consumerreports.org/video/view/cars/auto-test-track/4179139813001/toyota-mirai-2016-2020-quick-drive/.
Crosse, J. 2020. “Fuel Cell Powertrains ‘Could Be as Cheap as Petrol in Five Years,’ Says BMW’s Hydrogen VP.” The Telegraph, January 25. https://www.telegraph.co.uk/cars/news/fuel-cell-powertrains-could-cheap-petrol-five-years-says-bmws/.
Daimler Truck AG. 2020. “The Volvo Group and Daimler Truck AG to Lead the Development of Sustainable Transportation by Forming Joint Venture for Large-Scale Production of Fuel Cells.” Daimler Truck AG. April 21. https://media.daimler.com/marsMediaSite/en/instance/ko/The-Volvo-Group-and-Daimler-Truck-AG-to-lead-the-development-of-sustainable-transportation-by-forming-joint-venture-for-large-scale-production-of-fuel-cells.xhtml?oid=46192201.
Das, S., J. Warren, D. West, and S.M. Schexnayder. 2016. “Global Carbon Fiber Composites Supply Chain Competitiveness Analysis.” NREL/TP-6A50-66071; ORNL/SR-2016/100. Golden, CO: National Renewable Energy Laboratory. https://doi.org/10.2172/1260138.
Dekel, D.R. 2018. Review of cell performance in anion exchange membrane fuel cells. Journal of Power Sources 375(January):158–169. https://doi.org/10.1016/j.jpowsour.2017.07.117.
Dekel, D.R., I.G. Rasin, and S. Brandon. 2019. Predicting performance stability of anion exchange membrane fuel cells. Journal of Power Sources 420(April):118–123. https://doi.org/10.1016/j.jpowsour.2019.02.069.
Deloitte China. 2020. “Fueling the Future of Mobility: Hydrogen and Fuel Cell Solutions for Transportation.” Vol. 1. Deloitte China. https://www2.deloitte.com/content/dam/Deloitte/cn/Documents/finance/deloitte-cn-fueling-the-future-of-mobility-en-200101.pdf.
Dijoux, E., N.Y. Steiner, M. Benne, M. Péra, and B.G. Pérez. 2017. A review of fault tolerant control strategies applied to proton exchange membrane fuel cell systems. Journal of Power Sources 359(August):119–133. https://doi.org/10.1016/j.jpowsour.2017.05.058.
DOE (U.S. Department of Energy). 2017. “3.5 Manufacturing R&D.” In Fuel Cell Technologies Office Multi-Year Research, Development, and Demonstration Plan. https://www.energy.gov/sites/prod/files/2015/06/f22/fcto_myrdd_manufacturing.pdf.
DOE. 2020. “H2@Scale.” Department of Energy, H2@Scale. https://www.energy.gov/eere/fuelcells/h2scale.
DOE HTAC MSC. 2014. “Advanced Manufacturing Status and Opportunities to Accelerate Growth in Fuel Cell and Hydrogen Products.” Manufacturing Subcommittee (MSC) Report to Hydrogen and Fuel Cell Technical Advisory Committee (HTAC). Department of Energy. https://www.hydrogen.energy.gov/pdfs/htac_msc_report_12-14.pdf.
Eberle, U., and R. von Helmolt. 2010. “CHAPTER NINE—Fuel Cell Electric Vehicles, Battery Electric Vehicles, and Their Impact on Energy Storage Technologies: An Overview.” In Electric and Hybrid Vehicles, edited by Gianfranco Pistoia, 227–245. Amsterdam: Elsevier. https://doi.org/10.1016/B978-0-444-53565-8.00009-9.
Eberle, U., B. Müller, and R. von Helmolt. 2012. Fuel cell electric vehicles and hydrogen infrastructure: Status 2012. Energy and Environmental Science 5(10):8780. https://doi.org/10.1039/c2ee22596d.
Edelstein, S. 2014. “Audi A7 H-Tron Quattro ‘Performance’ Fuel-Cell Plug-In Car Unveiled At 2014 LA Auto Show.” Green Car Reports. November 19. https://www.greencarreports.com/news/1095557_audi-a7-h-tron-quattro-performance-fuel-cell-plug-in-car-unveiled-at-2014-la-auto-show.
EIA (U.S. Energy Information Administration). 2017. Annual Energy Outlook 2017 with Projections to 2050. Washington, DC: U.S. Energy Information Administration.
EIA. 2019. “Today in Energy, U.S. Gulf Coast Refinery Demand for Hydrogen Increasingly Met by Merchant Suppliers.” March 15. https://www.eia.gov/todayinenergy/detail.php?id=38712.
Eisenstein, P.A. 2020. “Q&A: Toyota’s Hydrogen Chief Jackie Birdsall.” Detroit Bureau. May 4. https://www.thedetroitbureau.com/2020/05/qa-toyotas-hydrogen-chief-jackie-birdsall/.
EPA. 2019. “2019 Fuel Economy Guide for DOE.” fueleconomy.gov. https://www.fueleconomy.gov/feg/download.shtml.
Eudy, L. and M. Post. 2018. Fuel Cell Buses in U.S. Transit Fleets: Current Status 2018. NREL/TP-5400-72208 December. https://www.nrel.gov/docs/fy19osti/72208.pdf.
FCHEA (Fuel Cell and Hydrogen Energy Association). n.d. “Transportation.” Fuel Cell and Hydrogen Energy Association. http://www.fchea.org/transportation.
FCHEA. 2020. Road Map to a US Hydrogen Economy. March. http://www.fchea.org/us-hydrogen-study.
FCH JU (Fuel Cells and Hydrogen Joint Undertaking). 2019. Hydrogen Roadmap Europe. Publications Office of the European Union, Luxembourg. https://www.fch.europa.eu/sites/default/files/Hydrogen%20Roadmap%20Europe_Report.pdf.
FCTO (Fuel Cells Technology Office). 2017. “Hydrogen Storage.” Department of Energy. https://www.energy.gov/sites/prod/files/2017/03/f34/fcto-h2-storage-fact-sheet.pdf.
Fekete, J.R., J.W. Sowards, and R.L. Amaro. 2015. Economic impact of applying high strength steels in hydrogen gas pipelines. International Journal of Hydrogen Energy 40 (33). https://doi.org/10.1016/j.ijhydene.2015.06.090.
Figueroa-Santos, M.A., and A.G. Stefanopoulou. 2021. Fuel Cell Vehicle Optimization and Control. In: J. Baillieul and T. Samad (eds.), Encyclopedia of Systems and Control. London: Springer. https://doi.org/10.1007/978-1-4471-5102-9_100145-1.
Ford Edge HySeries—Ford. 2008. “World’s First Drivable Fuel Cell Hybrid-electric Plug-in Vehicle.” http://ophelia.sdsu.edu:8080/ford/10-21-2008/innovation/environmentally-friendly/hydrogen/ford-edge-hyseries/edge-fuel-cell-hybrid-346p.html.
Fox, M., B. Geller, T. Bradley, F. Kalhammer, B. Kopf, and F. Panik. 2012. Plug-in fuel cell vehicle technology and value analysis. World Electric Vehicle Journal 5(1):217–226. https://doi.org/10.3390/wevj5010217.
Freudenberg Sealing Technologies. 2018. “Seals for Compact Fuel Cells.” https://www.fst.com/corporate/newsroom/press-releases/2018/freudenberg-gdl-press/.
Fuel Cells Bulletin. 2017. Ballard plans world’s first PEMFC product with low-vost Nisshinbo non-precious metal catalyst. Fuel Cells Bulletin 2017(9):1. https://doi.org/10.1016/S1464-2859(17)30338-3.
FuelCellsWorks. 2020. “Germany—H2 Mobility Opens Hydrogen (H2) Station in Dortmund.” May 7. https://fuelcellsworks.com/news/germany-h2-mobility-opens-hydrogen-h2-station-in-dortmund/.
Fumihiro, S., N. Yoshiyuki, S. Katsutoshi, S. Noriyuki, and S. Masato. 2015. “Development of Air Compressor for FCV.” 豊田自動織機技報 66:8–13.
Galbach, P.C. 2020. “FedEx Express Hydrogen Fuel Cell Extended-Range Battery Electric Vehicles.” DOE-FEDEX-06522, 1581967. https://doi.org/10.2172/1581967.
Gangloff, J.J. 2017. “Carbon Fiber Composite Material Cost Challenges for Compressed Hydrogen Storage Onboard Fuel Cell Electric Vehicles.” Presented at the Fuel Cells Technology Office Webinar.Washington, DC. July 25. https://www.energy.gov/sites/prod/files/2017/07/f35/fcto_webinarslides_carbon_fiber_composite_challenges_072517.pdf.
GlobalAutoRegs. n.d. “Global Technical Regulation No. 13: Global Technical Regulation on Hydrogen and Fuel Cell Vehicles.” https://globalautoregs.com/revisions?rule_id=141.
Glover, A.M., A.R. Baird, and C.B. LaFleur. 2020. Hydrogen Fuel Cell Vehicles in Tunnels. Sandia National Laboratories. SAND2020-4507 R.
Goodwin, A. 2019. “Audi Hasn’t Forgotten About Fuel Cells.” Roadshow. March 5. https://www.cnet.com/roadshow/news/audi-increasing-investment-in-hydrogen-fuel-cell/.
Green Car Congress. 2015. “Toyota Pops the Hood on the Technology of the Fuel Cell Mirai at SAE World Congress.” Green Car Congress. April 29. https://www.greencarcongress.com/2015/04/20150429-mirai.html.
Green Car Congress. 2016. “Toyota Details Design of Fuel Cell System in Mirai: Work on Electrode Catalysts.” Green Car Congress. April 19. https://www.greencarcongress.com/2016/04/20160419-toyota.html.
Green Car Congress. 2018a. “Producing the Mercedes-Benz GLC F-CELL Fuel-Cell SUV.” Green Car Congress. March 21. https://www.greencarcongress.com/2018/03/20180321-glcfcell.html.
Green Car Congress. 2018b. “Mercedes-Benz Fuel Cell SUV PHEV in Production; First Units of GLC F-CELL to Be Delivered by End of October.” Green Car Congress. October 10. https://www.greencarcongress.com/2018/10/20181010-glcfcell.html.
Greene, D.L., J.M. Ogden, and Z. Lin. 2020. Challenges in the designing, planning and deployment of hydrogen refueling infrastructure for fuel cell electric vehicles. ETransportation 6(November):100086. https://doi.org/10.1016/j.etran.2020.100086.
Gröger, O., H.A. Gasteiger, and J. Suchsland. 2015. Review—electromobility: Batteries or fuel cells? Journal of the Electrochemical Society 162(14):A2605. https://doi.org/10.1149/2.0211514jes.
Gurau, V., D. Fowler, D. Cox, and T. Taner. 2018. “Robotic Technologies for Proton Exchange Membrane Fuel Cell Assembly.” In Proton Exchange Membrane Fuel Cell. InTech. https://doi.org/10.5772/intechopen.71470.
Hall, D., and N. Lutsey. 2019. Estimating the infrastructure needs and costs for the launch of zero-emission trucks. International Council on Clean Transportation. https://theicct.org/publications/zero-emission-truck-infrastructure.
Hames, Y., K. Kaya, E. Baltacioglu, and A. Turksoy. 2018. Analysis of the control strategies for fuel saving in the hydrogen fuel cell vehicles. International Journal of Hydrogen Energy 43(23):10810–10821. https://doi.org/10.1016/j.ijhydene.2017.12.150.
Hampel, C. 2020. “Hyundai Delivers the First H2 Trucks in Switzerland.” electrive.com. July 6. https://www.electrive.com/2020/07/06/hyundai-delivers-the-first-h2-trucks-in-switzerland/.
Hanlin, J. 2019. “Fuel Cell Hybrid Electric Delivery Van Project.” Presented at the 2019 DOE Annual Merit Review, Washington, DC, May 1. https://www.hydrogen.energy.gov/pdfs/review19/ta016_hanlin_2019_o.pdf.
Hasegawa, T., H. Imanishi, M. Nada, and Y. Ikogi. 2016. “Development of the Fuel Cell System in the Mirai FCV.” SAE 2016 World Congress and Exhibition, 2016-01-1185. https://doi.org/10.4271/2016-01-1185.
Holton, O.T., and J.W. Stevenson. 2013. The role of platinum in proton exchange membrane fuel cells. Platinum Metals Review 57(4):259–271. https://doi.org/10.1595/147106713X671222.
Houchins, C. 2019. “Hydrogen Storage Cost Analysis (ST100).” Presented at the 2019 DOE Hydrogen and Fuel Cells Program Review, May 1. https://www.hydrogen.energy.gov/pdfs/review19/st100_james_2019_o.pdf.
Huya-Kouadio, J.M., B.D. James, and C. Houchins. 2018. Meeting cost and manufacturing expectations for automotive fuel cell bipolar plates. ECS Transactions 83(1):93–109. https://doi.org/10.1149/08301.0093ecst.
Hydrogen Council. 2017. “Hydrogen Scaling Up.” November 13. https://hydrogencouncil.com/wp-content/uploads/2017/11/Hydrogen-Scaling-up_Hydrogen-Council_2017.compressed.pdf.
Hydrogen Council. 2020. “Path to Hydrogen Competitiveness: A Cost Perspective.” Hydrogen Council. https://hydrogencouncil.com/wp-content/uploads/2020/01/Path-to-Hydrogen-Competitiveness_Full-Study-1.pdf.
HyMARC Data Hub. 2020. “Hydrogen Storage Materials Database.” June 30. https://datahub.hymarc.org/dataset/hydrogen-storage-materials-db.
HyTunnel-CS. 2019. “About HyTunnel-CS.” HyTunnel-CS. https://hytunnel.net/?page_id=31.
Hyundai Motor Group Newsroom. 2020. “Hyundai Motor Expands Partnership with U.S. Government to Support Further Exploration of Hydrogen Fuel Cell Technologies.” Hyundai Motor Group Newsroom. February 10. https://www.hyundainews.com/en-us/releases/2980.
Hyundai USA. n.d. “The Hydrogen Economy Is Moving the World. Where Does Your Country Rank?” Bloomberg. https://sponsored.bloomberg.com/news/sponsors/features/hyundai/h2-economy-today/?adv=16713&prx_t=aXwFAAAAAAZ6MQA&prx_ro=s.
IIHS-HLDI (Insurance Institute for Highway Safety-Highway Loss Data Institute). 2019. “Hyundai’s New Fuel Cell Vehicle Earns Safety Accolade.” IIHS-HLDI Crash Testing and Highway Safety. August 8. https://www.iihs.org/news/detail/hyundais-new-fuel-cell-vehicle-earns-safety-accolade.
Isenstadt, A., and N. Lutsey. 2017. Developing hydrogen fueling infrastructure for fuel cell vehicles: A status update. International Council on Clean Transportation Briefing. October.
Islam, E., N. Kim, A. Moawad, and A. Rousseau. 2020. “Energy Consumption and Cost Reduction of Future Light-Duty Vehicles through Advanced Vehicle Technologies: A Modeling Simulation Study Through 2050.” Report to the US Department of Energy, Contract ANL/ESD-19/10. June. https://www.autonomie.net/publications/fuel_economy_report.html.
James, B. 2017. “Bipolar Plate Cost and Issues at High Product on Rate.” In ANL Report 17/12, 2017 Bipolar Plate Workshop Report. https://www.energy.gov/sites/prod/files/2017/11/f46/fcto_biploar_plates_wkshp_report.pdf.
James, B.D., J.M. Huya-Kouadio, C. Houchins, D.A. DeSantis, and Strategic Analysis. 2018. “Mass Production Cost Estimation of Direct H2 PEM Fuel Cell Systems for Transportation Applications: 2018 Update.” December. 355.
James, B.D. 2019. “Fuel Cell Systems Analysis.” Project ID# FC163. Presented at the 2019 DOE Hydrogen and Fuel Cells Program Review Presentation. May 1. https://www.hydrogen.energy.gov/pdfs/review19/fc163_james_2019_o.pdf.
Jayakumar, A., S. Singamneni, M. Ramos, A. Al-Jumaily, and S. Pethaiah. 2017. Manufacturing the gas diffusion layer for PEM fuel cell using a novel 3D printing technique and critical assessment of the challenges encountered. Materials 10(7):796. https://doi.org/10.3390/ma10070796.
Jiang, H., L. Xu, J. Li, Z. Hu, and M. Ouyang. 2019. Energy management and component sizing for a fuel cell/battery/supercapacitor hybrid powertrain based on two-dimensional optimization algorithms. Energy 177(June):386–396. https://doi.org/10.1016/j.energy.2019.04.110.
Kaya, K., and Y. Hames. 2019. Two new control strategies: For hydrogen fuel saving and extend the life cycle in the hydrogen fuel cell vehicles. International Journal of Hydrogen Energy 44(34):18967–18980. https://doi.org/10.1016/j.ijhydene.2018.12.111.
Kendall, M. 2018. Fuel cell development for new energy vehicles (NEVs) and clean air in China. Progress in Natural Science: Materials International 28 (2): 113–120. https://doi.org/10.1016/j.pnsc.2018.03.001.
Kerviel, A., A. Pesyridis, A. Mohammed, and D. Chalet. 2018. An evaluation of turbocharging and supercharging options for high-efficiency fuel cell electric vehicles. Applied Sciences 8(12):2474. https://doi.org/10.3390/app8122474.
Kim, A., A. Moawad, R. Vijayagopal, and A. Rousseau. 2016. Impact of fuel cell and storage system improvement on fuel consumption and cost. World Electric Vehicle Journal 8(1):305–314. https://doi.org/10.3390/wevj8010305.
Kim, Y., M. Figueroa-Santos, N. Prakash, S. Baek, J.B. Siegel, and D.M. Rizzo. 2020. Co-optimization of speed trajectory and power management for a fuel-cell/battery electric vehicle. Applied Energy 260:114254. https://doi.org/10.1016/j.apenergy.2019.114254.
Kleen, G., and E. Padgett. 2021. Durability-Adjusted Fuel Cell System Cost, DOE HFTO Program Record. January. https://www.hydrogen.energy.gov/pdfs/21001-durability-adjusted-fcs-cost.pdf.
Kneer, A.P. 2019. “The Effect of Voltage Cycling on Catalyst Degradation in Automotive PEM Fuel Cells.” Dissertation, Universität Ulm. https://doi.org/10.18725/OPARU-13598.
Koleva, M., and N. Rustagi. 2020. “Hydrogen Delivery and Dispensing Cost.” 20007. DOE Hydrogen and Fuel Cells Program Record. https://www.hydrogen.energy.gov/pdfs/20007-hydrogen-delivery-dispensing-cost.pdf.
Kongkanand, A. 2017. Highly-Accessible Catalysts for Durable High-Power Performance. 2017 Annual Merit Review and Peer Evaluation Meeting. Washington, DC. https://www.hydrogen.energy.gov/pdfs/review17/fc144_kongkanand_2017_o.pdf.
Kongkanand, A. 2020. “Highly-Accessible Catalysts for Durable High-Power Performance.” Presented at the 2020 DOE Hydrogen and Fuel Cells Program Annual Merit Review. May 30. https://www.hydrogen.energy.gov/pdfs/review20/fc144_kongkanand_2020_p.pdf.
Kongkanand, A., and M. Mathias. 2016. The priority and challenge of high-power performance of low-platinum proton-exchange membrane fuel cells. The Journal of Physical Chemistry Letters. 7:1127–1137. doi: 10.1021/acs.jpclett.6b00216.
Kurtz, J., S. Sprik, C. Ainscough, and G. Saur. 2017. “VII.A.1 Fuel Cell Electric Vehicle Evaluation.” 2016 DOE Hydrogen and Fuel Cells Program Annual Progress Report. February.
Kurtz, J., S. Sprik, C. Ainscough, G. Saur, and M. Jeffers. 2016. “Spring 2016 FCEV Evaluation Results.” Golden, CO: National Renewable Energy Laboratory. May.
La Fleur, C., G. Bran-Anleu, A.B. Muna, B.D. Ehrhart, M. Blaylock, and W.G. Houf. 2017. “Hydrogen Fuel Cell Electric Vehicle Tunnel Safety Study.” SAND2017-11157. Sandia National Laboratories.
La Fleur, C.B., A.M. Glover, A.R. Baird, C.J. Jordan, and B.D. Ehrhart. 2020. Alternative Fuel Vehicles in Tunnels. Sandia National Laboratories, SAND2020-5466. May.
Lane, B. 2017. “Plug-in Fuel Cell Electric Vehicles: A Vehicle and Infrastructure Analysis and Comparison with Alternative Vehicle Types.” Dissertation, University of California, Irvine. https://escholarship.org/uc/item/57h0j2sv#main.
Lane, B., B. Shaffer, and G.S. Samuelsen. 2017. Plug-in fuel cell electric vehicles: A California case study. International Journal of Hydrogen Energy 42(20):14294–14300. https://doi.org/10.1016/j.ijhydene.2017.03.035.
Lawrence, C. 2020. “Can Hydrogen Fuel Cells Solve the Pain Points of Electric Vehicles?” Intelligent Mobility Xperience. July 7. https://www.intelligent-mobility-xperience.com/can-hydrogen-fuel-cells-solve-the-pain-points-of-electric-vehiclesa-946358/?cmp=go-ta-art-trf-IMX_DSA-20200217&gclid=Cj0KCQjw59n8BRD2ARIsAAmgPmKMUJDFM1ZUpiweA9wJ7kToQpTrvl91o3irjGPAoae6S3yle3IamHMaAv6qEALw_wcB.
Lin, Z., J. Dong, and D.L. Greene. 2013. Hydrogen vehicles: Impacts of DOE technical targets on market acceptance and societal benefits. International Journal of Hydrogen Energy 38(19):7973–7985. https://doi.org/10.1016/j.ijhydene.2013.04.120.
Lohse-Busch, H., K. Stutenberg, M. Duoba, S. Iliev, M. Kern, B. Richards, M. Christenson, and A. Loiselle-Lapointe. 2018. “Technology Assessment of a Fuel Cell Vehicle: 2017 Toyota Mirai.” Argonne, IL: Argonne National Laboratory. January 1. https://doi.org/10.2172/1463251.
Luth, M. 2019. “Fuel Cell Customers—Medium and Heavy-Duty Transportation.” Fuel Cell and Hydrogen Energy Association. November 2. http://www.fchea.org/in-transition/2019/9/2/fuel-cell-customers-medium-and-heavy-duty-transportation.
Martinez, A., and G. Achtelik. 2017. “California’s Hydrogen Fueling Network Progress and Growth Towards H2@SCALE.” California Air Resources Board.
Masika, E., and R. Mokaya. 2013. Preparation of ultrahigh surface area porous carbons templated using Zeolite 13X for enhanced hydrogen storage. Progress in Natural Science: Materials International 23(3):308–316. https://doi.org/10.1016/j.pnsc.2013.04.007.
Massachusetts Department of Transportation. 2019. 700 CMR 7.00: Use of the Massachusetts Turnpike and the Metropolitan Highway System.
Mattuci. 2015. “Diagram of a PEM Fuel Cell.” Diagram. Wikimedia Commons. https://en.wikipedia.org/wiki/Proton-exchange_membrane_fuel_cell#/media/File:Proton_Exchange_Fuel_Cell_Diagram.svg.
Mayyas, A., and M. Mann. 2019. Emerging manufacturing technologies for fuel cells and electrolyzers. Procedia Manufacturing 33:508–515. https://doi.org/10.1016/j.promfg.2019.04.063.
McWhorter, S., G. Ordaz. 2013. “Onboard Type IV Compressed Hydrogen Storage Systems—Current Performance and Cost.” 13013. DOE Hydrogen and Fuel Cells Program Record. http://hydrogen.energy.gov/pdfs/13010_onboard_storage_performance_cost.pdf.
Melaina, M., and M. Penev. 2013. Hydrogen Station Cost Estimates: Comparing Hydrogen Station Cost Calculator Results with Other Recent Estimates. NREL/TP-5400-56412. Golden, CO: National Renewable Energy Laboratory. https://www.nrel.gov/docs/fy13osti/56412.pdf.
Melaina, M., M. Muratori, J. McLaren, and P. Schwabe. 2017. “Investing in Alternative Fuel Infrastructure: Insights for California from Stakeholder Interviews.” TRB 96th Annual Meeting Compendium of Papers: 17-05279.
Melaina, M.W., Y. Sun, and B. Bush. 2014. “Retail Infrastructure Costs Comparison for Hydrogen and Electricity for Light-Duty Vehicles.” In SAE 2014 World Congress and Exhibition, 2014-01-1969. https://doi.org/10.4271/2014-01-1969.
Miller, E., and N. Stetson. 2019. “Hydrogen Fuel R&D Subprogram Overview.” DOE Hydrogen and Fuel Cells Program. FY 2018 Annual Progress Report. Department of Energy. https://www.hydrogen.energy.gov/pdfs/progress18/h2f_overview_2018.pdf.
Morris, L., J.J. Hales, M.L. Trudeau, P. Georgiev, J.P. Embs, J. Eckert, N. Kaltsoyannis, and D.M. Antonelli. 2019. A manganese hydride molecular sieve for practical hydrogen storage under ambient conditions. Energy & Environmental Science 12:1580e1591.
Morrison, G., J. Stevens, and F. Joseck. 2018. Relative economic competitiveness of light-duty battery electric and fuel cell electric vehicles. Transportation Research Part C: Emerging Technologies 87:183–196. https://doi.org/10.1016/j.trc.2018.01.005.
MotorTrend. 2017. “2016 Toyota Mirai Long-Term Verdict: Pulling Off the Hydrogen Highway.” MotorTrend. September 9. https://www.motortrend.com/cars/toyota/mirai/2016/2016-toyota-mirai-review-long-term-verdict/.
Munster, J. 2019. “Hydrogen for Transport: Infrastructure Pathway to Parity and Below.” Presented at the Hydrogen Fueling Infrastructure Webinar to Committee on Assessment of Technologies for Improving Fuel Economy of Light-Duty Vehicles—Phase 3. June 26. https://www.nationalacademies.org/event/06-26-2019/hydrogen-fueling-infrastructure-webinar.
Nakagaki, N. 2015. “The Newly Developed Components for the Fuel Cell Vehicle, Mirai.” SAE Technical Paper 2015-01-1174. Warrendale, PA: SAE International. https://doi.org/10.4271/2015-01-1174.
Nied, D. 2015. “Hydrogen Fuel Cell Timeline.” Toyota Today. January/February. https://www.toyotatoday.com/news/hydrogen-fuel-cell-timeline.htm.
NREL (National Renewable Energy Laboratory). n.d. Hydrogen Financial Analysis Scenario Tool (H2FAST). http://www.nrel.gov/hydrogen/h2fast/.
NREL. 2016. “Comparison of On-Road Fuel Economy | Fuel Cell Electric Vehicle Composite Data Products.” National Renewable Energy Laboratory, Hydrogen and Fuel Cells. April 28. https://www.nrel.gov/hydrogen/assets/images/cdp_fcev_32.jpg.
O’Dell, J. 2018. “Anheuser-Busch Makes Record Order of 800 Nikola Fuel Cell Trucks.” Trucks.Com. May 3. https://www.trucks.com/2018/05/03/anheuser-busch-nikola-truck-order/.
Ogden, J.M. 2018. “Prospects for Hydrogen in the Future Energy System.” Davis, CA: Institute of Transportation Studies—University of California, Davis, March.
Ordaz, G., C. Houchins, and T. Hua. 2015. “Onboard Type IV Compressed Hydrogen Storage System—Cost and Performance Status 2015.” 15013. DOE Hydrogen and Fuel Cells Program Record. Department of Energy. https://www.hydrogen.energy.gov/pdfs/15013_onboard_storage_performance_cost.pdf.
Padgett, E., and G. Kleen. 2020. “Automotive Fuel Cell Targets and Status.” 20005. DOE Hydrogen and Fuel Cells Program Record.
Papageorgopoulos, D. 2019. “Fuel Cell R&D Overview.” Presented at the 2019 Annual Merit Review and Peer Evaluation Meeting. April 29. https://www.hydrogen.energy.gov/pdfs/review19/plenary_fuel_cell_papageorgopoulos_2019.pdf.
Penev, M., J. Zuboy, and C. Hunter. 2019. Economic analysis of a high-pressure urban pipeline concept (HyLine) for delivering hydrogen to retail fueling stations. Transportation Research Part D: Transport and Environment 77: 92–105. https://doi.org/10.1016/j.trd.2019.10.005.
Peterson, D., and R. Farmer. 2017. “Historical Fuel Cell and Hydrogen Budgets.” 17006. DOE Hydrogen and Fuel Cells Program Record. https://www.hydrogen.energy.gov/pdfs/17006_historical_fuel_cell_h2_budgets.pdf.
Plug Power. 2019. “Plug Power Signs Deal to Power StreetScooter Delivery Vans with ProGen Hydrogen Fuel Cell Engines.” Plug Power, Inc. May 28. https://www.ir.plugpower.com/Press-Releases/Press-Release-Details/2019/Plug-Power-Signs-Deal-to-Power-StreetScooter-Delivery-Vans-with-ProGen-Hydrogen-Fuel-Cell-Engines/default.aspx.
PNNL (Pacific Northwest National Laboratory). n.d. “H2 Tools: International Hydrogen Fueling Stations.” Available at h2tools.org, accessed March 30, 2021.
Port Authority of NY and NJ. 2016. Traffic Rules and Regulations for the Holland Tunnel, Lincoln Tunnel, George Washington Bridge, Bayonne Bridge, Goethals Bridge, Outerbridge Crossing. September.
Reed, J., E. Dailey, B. Shaffer, B. Lane, R. Flores, A. Fong, and G.S. Samuelsen. 2020. Roadmap for the Deployment and Buildout of Renewable Hydrogen Production Plants in California. CEC. Publication Number: CEC-600-2020-002.
Ren, X., X. Zhang, T. Teng, and C. Li. 2020. Research on estimation method of fuel cell health state based on lumped parameter model. Energies 13 (23): 6425. https://doi.org/10.3390/en13236425.
Research and Markets. 2020. “Global Fuel Cell Vehicles Market 2020–2030: Analysis of the Current and Future Scenarios of FCEV Sales, Stations, Hydrogen Fuel, and the Push from Governments.” PRNewswire. October 19. https://www.prnewswire.com/news-releases/global-fuel-cell-vehicles-market-2020-2030-analysis-of-the-current-and-future-scenarios-of-fcev-sales-stations-hydrogen-fuel-and-the-push-from-governments-301154685.html.
Rivard, E., M. Trudeau, and K. Zaghib. 2019. Hydrogen storage for mobility: A review. Materials 12(12):1973. https://doi.org/10.3390/ma12121973.
Robinius, M., J. Linßen, T. Grube, M. Reuß, P. Stenzel, K. Syranidis, P. Kuckertz, and D. Stolten. 2018. Comparative analysis of infrastructures: Hydrogen fueling and electric charging of vehicles. Energie and Umwelt / Energy and Environment 408.
Ross, K. 2019. “Solid Phase Processing for Reduced Cost and Improved Efficiency of Bipolar Plates.” Presented at the 2019 Annual Merit Review. Department of Energy. https://www.hydrogen.energy.gov/pdfs/review19/fc321_ross_2019_p.pdf.
Ruf, Y., T. Zorn, P. Akcayoz De Neve, P. Andrae, S. Erofeeva, F. Garrison, and A. Schwilling. 2019. Study on the Use of Fuel Cells and Hydrogen in the Railway Environment. Roland Berger for Shift2Rail Joint Undertaking and Fuel Cells and Hydrogen Joint Undertaking. https://shift2rail.org/wp-content/uploads/2019/05/Study-on-the-use-of-fuel-cells-and-hydrogen-in-the-railway-environment_final.pdf.
Rügheimer, U. 2014. “The Audi A7 Sportback H-Tron Quattro.” Audi MediaCenter. November 19. https://www.audi-mediacenter.com:443/en/press-releases/the-audi-a7-sportback-h-tron-quattro-438.
Rustagi, N. 2018. “Overview of Status of Hydrogen Fueling Infrastructure in U.S.” DOE FCTO International Hydrogen Infrastructure Workshop. September 11.
Rustagi, N., A. Elgowainy, and J. Vickers. 2018. Current Status of Hydrogen Delivery and Dispensing Costs and Pathways to Future Cost Reduction. DOE Hydrogen and Fuel Cells Program Record. December 17. https://www.hydrogen.energy.gov/pdfs/18003_current_status_hydrogen_delivery_dispensing_costs.pdf.
Satyapal, S. 2019. 2019 Annual Merit Review, Hydrogen and Fuel Cell Program Overview. April 28. https://www.hydrogen.energy.gov/pdfs/review19/plenary_overview_satyapal_2019.pdf.
Saur, G., S. Sprik, J. Kurtz, S. Onorato, S. Gilleon, and E. Winkler. 2019. NREL Hydrogen Station Data Collection and Analysis. DOE Hydrogen and Fuel Cells Program, 2019 Annual Merit Review and Peer Evaluation Meeting. https://www.hydrogen.energy.gov/pdfs/review19/ta014_sprik_2019_o.pdf.
Scheffler, R. 2019. “Costs Check Growth of Fuel-Cell Infrastructure.” Ward’s Auto. August 22. https://www.wardsauto.com/technology/costs-check-growth-fuel-cell-infrastructure.
Seredynski, P. 2018. “2019 Hyundai Nexo: Fuel-Cell Refinement, SUV Luxury.” SAE International. November 13. https://www.sae.org/news/2018/11/2019-hyundai-nexo-fuel-cell-launch.
Sethuraman, V.A., J.W. Weidner, A.T. Haug, M. Pemberton, and L.V. Protsailo. 2009. Importance of catalyst stability vis-àvis hydrogen peroxide formation rates in PEM fuel cell electrodes. Electrochimica Acta 54(23):5571–5582. https://doi.org/10.1016/j.electacta.2009.04.062.
Shinozaki, K., H. Yamada, and Y. Morimoto. 2011. Relative humidity dependence of Pt utilization in polymer electrolyte fuel cell electrodes: Effects of electrode thickness, ionomer-to-carbon ratio, ionomer equivalent weight, and carbon support. Journal of the Electrochemical Society 158(5):B467. https://doi.org/10.1149/1.3556906.
Sim, K., R. Vijayagopal, N. Kim, and A. Rousseau. 2019. Optimization of component sizing for a fuel cell-powered truck to minimize ownership cost. Energies 12(6):1125. https://doi.org/10.3390/en12061125.
Simmons, K.L. 2014. “IV.F.3 Synergistically Enhanced Materials and Design Parameters for Reducing the Cost of Hydrogen Storage Tanks.” FY 2014 Annual Progress Report. https://www.hydrogen.energy.gov/pdfs/progress14/iv_f_3_simmons_2014.pdf.
Song, K., F. Li, X. Hu, L. He, W. Niu, S. Lu, and T. Zhang. 2018. Multi-mode energy management strategy for fuel cell electric vehicles based on driving pattern identification using learning vector quantization neural network algorithm. Journal of Power Sources 389(June):230–239. https://doi.org/10.1016/j.jpowsour.2018.04.024.
Spiegel, C. 2018. “Gas Diffusion Layer: Characteristics and Modeling.” FuelCellStore. https://www.fuelcellstore.com/blog-section/gas-diffusion-layer-characteristics-and-modeling.
State of California. 2018. Executive Order B-48-18. https://www.ca.gov/archive/gov39/2018/01/26/governor-brown-takes-action-to-increase-zero-emission-vehicles-fund-new-climate-investments/index.html.
State of New Jersey. 2019. 2019 New Jersey Energy Master Plan—Pathway to 2050. https://www.nj.gov/emp/docs/pdf/2020_NJBPU_EMP.pdf.
Stetson, N. 2015. Cold/Cryogenic Composites for Hydrogen Storage Applications in FCEVs, DOE Workshop. Dallas, TX. October 29. https://www.energy.gov/sites/prod/files/2015/11/f27/fcto_cold_cryo_h2_storage_wkshp_1_doe.pdf.
Stetson, N. 2020. “Hydrogen Fuel R&D Subprogram Overview.” DOE Hydrogen and Fuel Cells Program. FY 2019 Annual Progress Report. U.S. Department of Energy. https://www.hydrogen.energy.gov/pdfs/progress19/h2f_overview_2019.pdf.
Sturgess, S. 2017. “Fuel Cells Gain Momentum as Range Extenders for Electric Trucks.” Transport Topics. November 27. https://www.ttnews.com/articles/fuel-cells-gain-momentum-range-extenders-electric-trucks.
Sun, X., S.C. Simonsen, T. Norby, and A. Chatzitakis. 2019. Composite membranes for high temperature PEM fuel cells and electrolysers: A critical review. Membranes 9(7):83. https://doi.org/10.3390/membranes9070083.
Sundström, O., and A. Stefanopoulou. 2007. Optimum battery size for fuel cell hybrid electric vehicle with transient loading consideration—part II. Journal of Fuel Cell Science and Technology 4(2):176–184. https://doi.org/10.1115/1.2713779.
Taherian, R. 2014. A review of composite and metallic bipolar plates in proton exchange membrane fuel cell: Materials, fabrication, and material selection. Journal of Power Sources 265:370–390. https://doi.org/10.1016/j.jpowsour.2014.04.081.
Thomas, S., and M. Zalbowitz. 1999. “Fuel Cells—Green Power.” Los Alamos National Laboratory. http://www.dartmouth.edu/∼cushman/courses/engs171/FuelCells-article.pdf.
Thompson, S.T., and D. Papageorgopoulos. 2019. Platinum group metal-free catalysts boost cost competitiveness of fuel cell vehicles. Nature Catalysis 2:558–561. July. doi: 10.1038/s41929-019-0291-x.
Tomas, M., I.S. Biswas, P. Gazdzicki, L. Kullova, and M. Schulze. 2017. Modification of gas diffusion layers properties to improve water management. Materials for Renewable and Sustainable Energy 6(4):20. https://doi.org/10.1007/s40243-017-0104-6.
Toyota USA Newsroom. 2014. “The Future Has Arrived, and It’s Called Mirai.” Toyota USA Newsroom. November 17. https://pressroom.toyota.com/toyota-names-fuel-cell-vehicle-mirai/.
Toyota USA Newsroom. 2019a. “The Future of Zero-Emission Trucking Takes Another Leap Forward.” Toyota USA Newsroom. April 22. https://pressroom.toyota.com/the-future-of-zero-emission-trucking-takes-another-leap-forward/.
Toyota USA Newsroom. 2019b. “Coupe-Inspired Design Modernizes All-New 2021 Toyota Mirai Sedan Concept.” Toyota USA Newsroom. October 10. https://pressroom.toyota.com/coupe-inspired-design-modernizes-all-new-2021-toyota-mirai-sedan/.
Trencher, G. 2020. Strategies to accelerate the production and diffusion of fuel cell electric vehicles: Experiences from California. Energy Reports 6:2503–2519. https://doi.org/10.1016/j.egyr.2020.09.008.
Ul Hassan, N., M. Mandal, G. Huang, H.A. Firouzjaie, P.A. Kohl, and W.E. Mustain. 2020. Achieving high-performance and 2000 h stability in anion exchange membrane fuel cells by manipulating ionomer properties and electrode optimization. Advanced Energy Materials 10(40):2001986. https://doi.org/10.1002/aenm.202001986.
United Nations Economic and Social Council. 2017. “Draft Programme of Work (PoW) Under the 1998 Agreement.” ECE/TRANS/WP.29/2017/144. United Nations. https://www.unece.org/fileadmin/DAM/trans/doc/2017/wp29/ECE-TRANSWP29-2017-144e.pdf.
UPS. 2017. “UPS Unveils First Extended Range Fuel Cell Electric Delivery Vehicle.” Automotive World. May 2. https://www.automotiveworld.com/news-releases/ups-unveils-first-extended-range-fuel-cell-electric-delivery-vehicle/.
U.S. DRIVE. 2017a. “Fuel Cell Technical Team Roadmap.” United States Driving Research and Innovation for Vehicle Efficiency and Energy Sustainability (U.S. DRIVE) Partnership. https://www.energy.gov/sites/prod/files/2017/11/f46/FCTT_Roadmap_Nov_2017_FINAL.pdf.
U.S. DRIVE. 2017b. “Target Explanation Document: Onboard Hydrogen Storage for Light-Duty Fuel Cell Vehicles.” United States Driving Research and Innovation for Vehicle Efficiency and Energy Sustainability (U.S. DRIVE) Partnership. https://www.energy.gov/sites/prod/files/2017/05/f34/fcto_targets_onboard_hydro_storage_explanation.pdf.
U.S. DRIVE. 2017c. “Hydrogen Storage Tech Team Roadmap.” United States Driving Research and Innovation for Vehicle Efficiency and Energy Sustainability (U.S. DRIVE) Partnership. July. https://www.energy.gov/sites/prod/files/2017/08/f36/hstt_roadmap_July2017.pdf.
U.S. DRIVE. 2017d. “Hydrogen Production Tech Team Roadmap.” November. https://www.energy.gov/sites/prod/files/2017/11/f46/HPTT%20Roadmap%20FY17%20Final_Nov%202017.pdf.
Vijayagopal, R., N. Kim, and A. Rousseau. 2017. “Fuel Cell Powered Vehicles: An Analysis of How Technology Progress Affects the Technical and Economic Feasibility.” ANL-17/07. Argonne, IL: Argonne National Laboratory. https://www.autonomie.net/pdfs/ANL%2017_07%20Fuel%20Cell%20Powered%20Vehicles%20Analysis%20Report.pdf.
Wagner, I. 2020. “Global Vehicle Production Forecast Between 2025 and 2030.” Statista. April 20. https://www.statista.com/statistics/266813/growth-of-the-global-vehicle-production-since-2009/.
Wang, X.X., M.T. Swihart, and G. Wu. 2019. Achievements, challenges and perspectives on cathode catalysts in proton exchange membrane fuel cells for transportation. Nature Catalysis 2(7):578–589. https://doi.org/10.1038/s41929-019-0304-9.
Warren, C.D. 2016. “Carbon Fiber Precursors and Conversion.” Presented at the Department of Energy Physical-Based Storage Workshop: Identifying Potential Pathways for Lower Cost 700 Bar Storage Vessels. August 24. https://www.energy.gov/sites/prod/files/2016/09/f33/fcto_h2_storage_700bar_workshop_3_warren.pdf.
Whiston, M.M., I.L. Azevedo, S. Litster, K.S. Whitefoot, C. Samaras, and J.F. Whitacre. 2019. Expert assessments of the cost and expected future performance of proton exchange membrane fuel cells for vehicles. Proceedings of the National Academy of Sciences 116(11):4899–4904. https://doi.org/10.1073/pnas.1804221116.
Wilson, A.R., J. Marcinkoski, and D. Papageorgopoulos. 2016. “On-Road Fuel Cell Stack Durability—2016.” 16019. DOE Hydrogen and Fuel Cell Technologies Program Record.
Wipke, K., S. Sprik, J. Kurtz, T. Ramsden, C. Ainscough, and G. Saur. 2012. “National Fuel Cell Electric Vehicle Learning Demonstration Final Report.” Technical Report NREL/TP-5600-54860. National Renewable Energy Laboratory.
Wu, D., C. Peng, C. Yin, and H. Tang. 2020. Review of system integration and control of proton exchange membrane fuel cells. Electrochemical Energy Reviews 3(3):466–505. https://doi.org/10.1007/s41918-020-00068-1.
Yamashita, A., M. Kondo, S. Goto, and N. Ogami. 2015. “Development of High-Pressure Hydrogen Storage System for the Toyota ‘Mirai.’” In SAE 2015 World Congress and Exhibition. 2015-01-1169. https://doi.org/10.4271/2015-01-1169.
You, W., E. Padgett, S.N. MacMillan, D.A. Muller, and G.W. Coates. 2019. Highly conductive and chemically stable alkaline anion exchange membranes via ROMP of trans-cyclooctene derivatives. Proceedings of the National Academy of Sciences 116(20):9729–9734. https://doi.org/10.1073/pnas.1900988116.
Yu, W., X. Sichuan, and H. Ni. 2015. Air compressors for fuel cell vehicles: A systematic review. SAE International Journal of Alternative Powertrains 4(1):115–122. https://doi.org/10.4271/2015-01-1172.
Yuan, W. 2008. “PEM Fuel Cell Fundamentals” in PEM Fuel Cell Electrocatalysts and Catalyst Layers, J. Zhang (ed.). Springer Nature.
Yue, M., S. Jemei, R. Gouriveau, and N. Zerhouni. 2019. Review on health-conscious energy management strategies for fuel cell hybrid electric vehicles: Degradation models and strategies. International Journal of Hydrogen Energy 44(13):6844–6861. https://doi.org/10.1016/j.ijhydene.2019.01.190.
Zacharia, R., and S. Rather. 2015. Review of solid state hydrogen storage methods adopting different kinds of novel materials. Journal of Nanomaterials 2015:1–18. https://doi.org/10.1155/2015/914845.
Zhou, D., A. Ravey, A. Al-Durra, and F. Gao. 2017. A comparative study of extremum seeking methods applied to online energy management strategy of fuel cell hybrid electric vehicles. Energy Conversion and Management 151:778–790. https://doi.org/10.1016/j.enconman.2017.08.079.
Züttel, A. 2003. Materials for hydrogen storage. Materials Today 6(9):24–33. https://doi.org/10.1016/S1369-7021(03)00922-2.


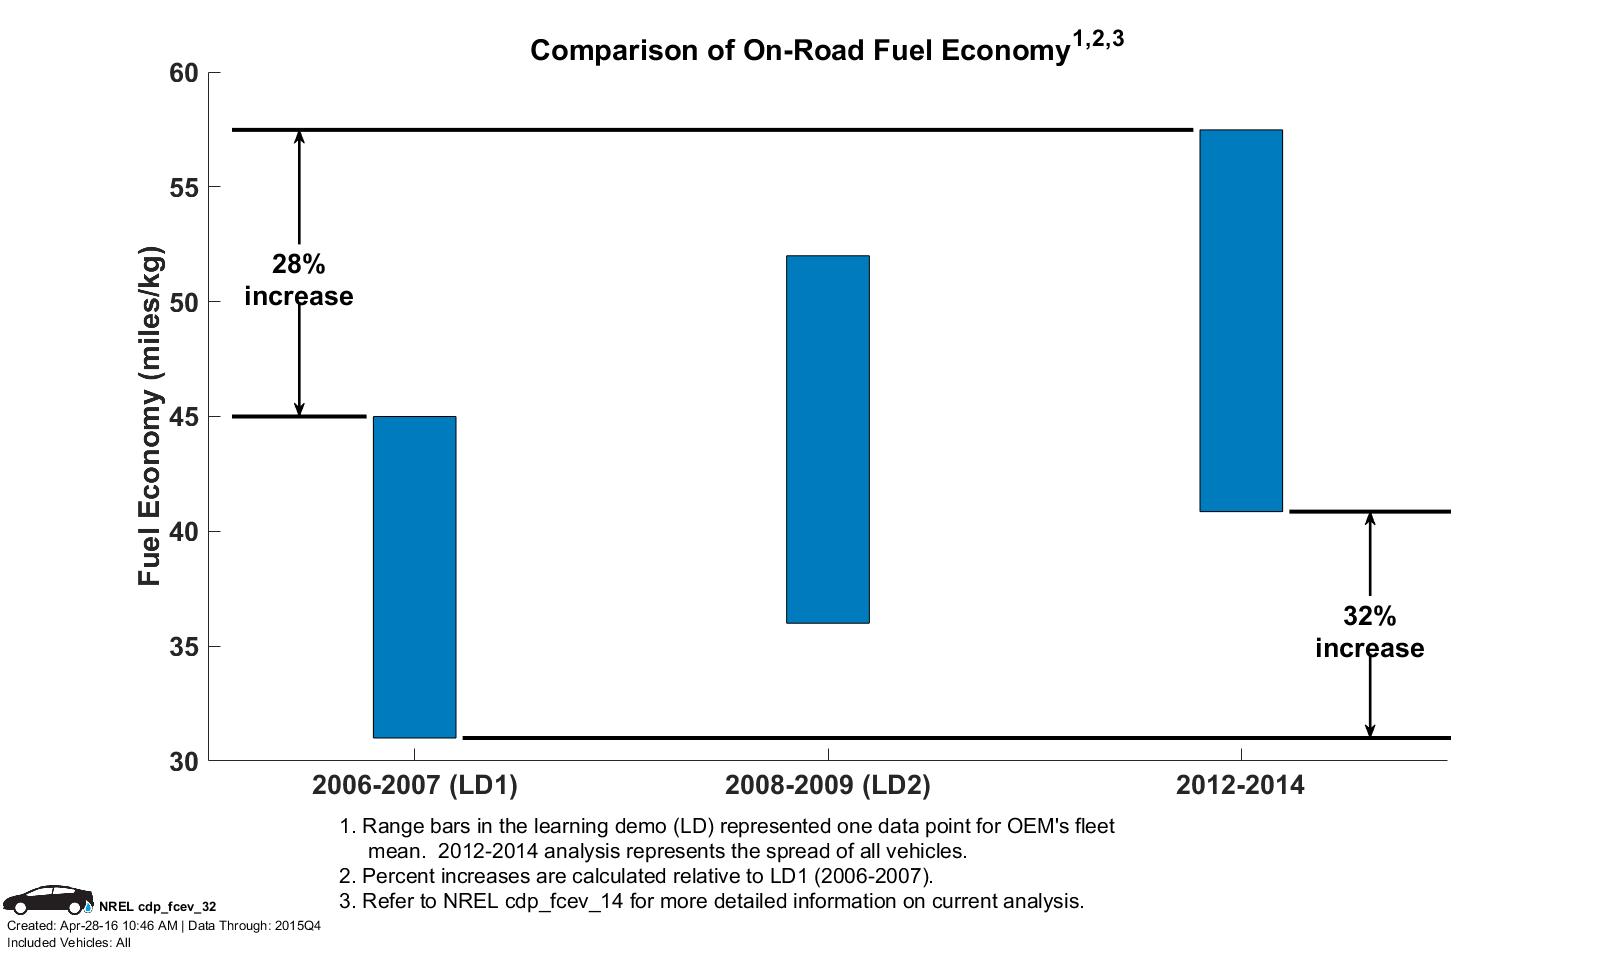