
Appendix C
Case Study: Hanrahan et al. (1984), Human Sensory Irritation
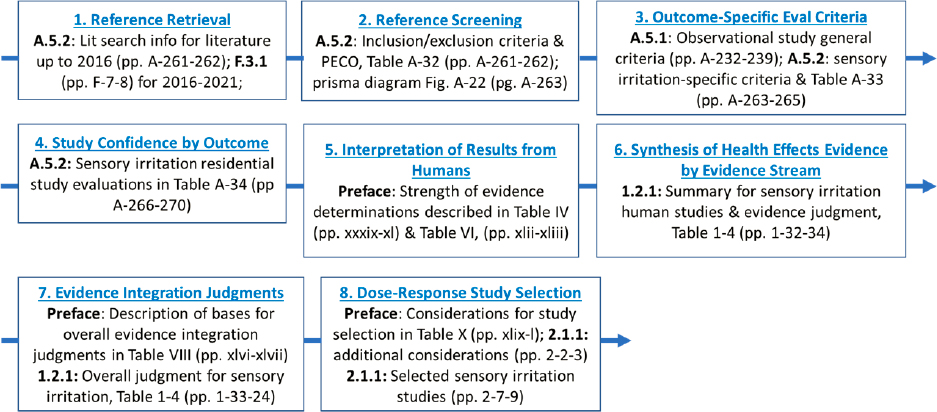
As noted in Chapter 2 of this report, the committee considers that sufficiently transparent and detailed methods would support replication by us and others. To test whether we could identify and follow the steps described in the 2022 Draft Assessment (EPA, 2022a), we focused on a key study by Hanrahan and colleagues (1984), used by EPA to assess a health outcome (human sensory irritation) and to calculate a candidate reference concentration. We followed EPA’s eight-step process (shown in Figure C-1) for identification of studies, outcome evaluation, evidence synthesis and integration, and dose-response study selection. The goal of this case study is to explore whether the 2022 Draft Assessment’s methods are adequately described so that they can be utilized by others—a key characteristic of transparent documentation. The case study was not carried out to provide an independent assessment of formaldehyde by the committee.

NOTES: ADME = absorption, distribution, metabolism, and excretion; PECO = participants, exposure, comparator, and outcome(s).
SOURCE: EPA’s 2022 Draft Formaldehyde Assessment.
IDENTIFICATION OF CASE STUDY INFORMATION
The first step in the committee’s evaluation was to locate information pertaining to human sensory irritation and the study by Hanrahan and colleagues specifically. The descriptions of EPA approaches used in the 2022 Draft Assessment are located in multiple places, requiring that we collate the methods from three EPA documents. The resulting map of information is shown in Figure C-2.
NOTE: Committee-generated by review of EPA’s 2022 Draft Formaldehyde Assessment.
STEPS 1 AND 2: REFERENCE RETRIEVAL AND SCREENING
In Appendix A.5.2, EPA described the literature search strategy for studies published up to 2016, the inclusion and exclusion criteria, the PECO (participants, exposure, comparator, and outcome[s]) statement along with a PRISMA (preferred reporting items for systematic reviews and meta-analyses) diagram documenting the search and article screening. Appendix F.3.1 describes the literature search for studies published from 2016 to 2021 and the evaluation of potentially impactful studies.
Overall, the literature search terms, inclusion and exclusion criteria, and PECO statement are appropriately inclusive of relevant studies for assessing human sensory irritation.
STEP 3: OUTCOME-SPECIFIC EVALUATION CRITERIA
EPA provided outcome evaluation criteria for human observational and animal/human experimental studies in Appendix A.5.1, with sensory irritation–specific criteria in Appendix A.5.2. The information in A.5.2 includes descriptions about particular criteria relevant to the endpoint, as well as a table (Table A-33) that provides information about the exposure and design characteristics of studies, which are assigned quality labels of high, medium, low, or not informative. These descriptions include some of the quality characteristics listed in Appendix A.5.1 and in the text of A.5.2, but not others. For example, none of the criteria in the Selection Bias domain (recruitment, selection into study, participation independent of exposure) are included in Table A-33. In addition, the specific study characteristics are included in some but not all of the quality determination descriptions, such as the use of a validated data collection instrument, which is included in the high
and medium descriptions, but not those for low. The descriptions of these characteristics also sometimes include vague terms, such as “limited exposure assessment” or “less well described,” to characterize data collection instruments. This table (A-33) is the first time that sample size is introduced as a study quality characteristic, but without discussion to inform when the sample size would be considered “large,” “small,” or “may be a limitation.”
Table C-1 lists the study quality criteria described by EPA in Appendix A.5.1 and A.5.2.
TABLE C-1 The U.S. Environmental Protection Agency’s (EPA’s) Study Quality Criteria and Bases for Confidence Ratings for Human Sensory Irritation Studies
| Study Quality Criteria | Locations for Criteria in Appendix | Description of Confidence Rating from Table A-33 (approximate matching to appropriate criteria) | ||
|---|---|---|---|---|
| General Criteria Text of A.5.1 | Exposure Criteria Text of A.5.1 | Sensory Irritation Table A-33 | ||
| Selection Bias | ||||
| Recruitment, selection into study, participation independent of exposure | X | N/A | X | NI: Selection bias away from null |
| Sufficient reporting detail about subject identification and selection | X | N/A | NI: Methods description too sparse for evaluationa | |
| Information Bias | ||||
| Exposure assessment timing appropriate for outcome observation | X | N/A | X | High: Exposure assessment timing appropriate for outcome observation; Med: Uncertainty in timing between exposure and outcome assessment |
| Reporting of distribution and range of exposure | X | X | ||
| Adequate contrast between high and low exposure | X | X | NI: Exposure range <0.1 mg/m3 | |
| Exposure measurement duration and frequency | X | |||
| Consideration of temp, RH, quality control | X | |||
| For <1 day exposure measurement, details of measurement protocol and influence of sources of exposure should be included | X | X | Low: <1 day exposure measure without protocol discussion and quality control | |
| LOD and percent < LOD | X | |||
| Conc. measure captures mean individual exposure | X | High: Exposure assessment designed to characterize mean exposures Med: More limited exposure assessment |
||
| Validated data collection instrument used and described | X | N/A | X | High: Validated data collection instrument used and described Med: instrument less well described |
| Outcome ascertainment independent of exposure knowledge | X | N/A | X | High and Med: Outcome ascertainment independent of exposure knowledge |
| Study Quality Criteria | Locations for Criteria in Appendix | Description of Confidence Rating from Table A-33 (approximate matching to appropriate criteria) | ||
|---|---|---|---|---|
| General Criteria Text of A.5.1 | Exposure Criteria Text of A.5.1 | Sensory Irritation Table A-33 | ||
| Timing of outcome assessment with exposure assessment | N/A | X | High and Med: Symptom assessment concurrent with exposure assessment | |
| Potential for Confounding | ||||
| Important confounders addressed in study design or analysis | X | N/A | X | High: confounding considered and addressed in design or analysis |
| Confounding by coexposures addressed | X | N/A | X | Med: Confounding considered and addressed in design or analysis, but questions remain about correlation between formaldehyde and coexposures Low: High likelihood of confounding preventing differentiation of formaldehyde effect from that of other exposures |
| Analysis | ||||
| Appropriate analytical approach used | X | N/A | X | High: Analytic approach for dose-response appropriate for data type Med: Analytic approach more limited Low: Limited or inappropriate data analysis |
| Consider alternate explanations for findings | X | N/A | ||
| Quantitative results presented | X | N/A | X | High: Quantitative results provided |
| Other considerations not otherwise evaluated | ||||
| Sensitivity (exposure levels, exposure contrast, duration of follow-up, outcome ascertainment) | X | N/A | ||
| Sample size | N/A | X | High: Large sample size Med: sample size may be a limitation Low: small sample size |
|
NOTES: a For the not informative category, “methods description too sparse for evaluation” could apply to any of the study evaluation domains.
X denotes the location where the criteria are described in the 2022 Draft Assessment. The final column provides EPA’s confidence rating information provided, matched with the corresponding study quality criteria (as determined by the committee, because EPA did not provide the specific domains when describing the characteristics of high, medium, low, and not informative studies). LOD = limit of detection; NI = not informative; RH = relative humidity.
EPA’s evaluation of the Hanrahan study is found in Table A-34 of A.5.2, which provides details for each of the confidence domains. Deficiencies are noted in two domains: Exposure (limited sampling period), and Outcome (no description of self-report questionnaire). The overall confidence in this study is medium, and the overall confidence figure shows a central mark in the information bias column only (see Figure C-3).
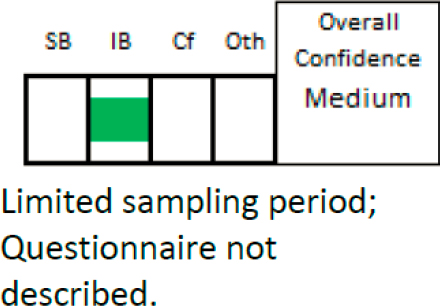
NOTES: Cf = confounding; IB = Information Bias; Oth = Other; SB = selection bias.
SOURCE: Table A-34 of A.5.2, Appendix A of EPA’s 2022 Draft Formaldehyde Assessment.
Table C-2 shows a comparison of the study quality criteria and descriptions provided by EPA for sensory irritation, with the findings reported for Hanrahan et al. (1984) in Table A-34, as well as notes from the committee about how the study quality criteria were applied.
TABLE C-2 Application of the US Environmental Protection Agency’s (EPA’s) Study Quality Criteria and Confidence Ratings to the Hanrahan et al.(1984) Study
| Study Quality Criteria | Description of Confidence Rating from Table A-33 | Findings Reported by EPA in Table A-34 | EPA Rating and Comments in Table A-34 | Committee Notes |
|---|---|---|---|---|
| Selection Bias | No Issues Noted in Summary Diagram | |||
| Recruitment, selection into study, participation independent of exposure | NI: selection bias away from null | Randomly selected from list of mobile homes; 31% of respondents from homes with exposure measures returned health questionnaires; participation independent of exposure | Less concern about low response rate because formaldehyde concentrations, age, and gender of participants were comparable to nonrespondents, and participants blinded to formaldehyde concentration | |
| Sufficient reporting detail about subject identification and selection | NI: Methods description too sparse for evaluation | [No information noted] | ||
| Information Bias | Some Issues Noted in Summary Diagram | |||
| Exposure assessment timing appropriate for outcome observation | High: Exposure assessment timing appropriate for outcome observation; Med: uncertainty in timing between exposure and outcome assessment |
[No information noted] | Exposure assessed at single time point, symptoms reported for any time since moving into the home; noted as a concern in Section 2.1.1 for Hanrahan dose-response assessment | |
| Study Quality Criteria | Description of Confidence Rating from Table A-33 | Findings Reported by EPA in Table A-34 | EPA Rating and Comments in Table A-34 | Committee Notes |
|---|---|---|---|---|
| Reporting of distribution and range of exposure | Median 0.2 mg/m3, range < 0.12–0.98 mg/m3 | |||
| Adequate contrast between high and low exposure | NI: Exposure range < 0.1 mg/m3 | [No information noted] | ||
| Exposure measurement duration and frequency | Average of 1-hr samples from two rooms | |||
| Consideration of temp, RH, quality control | [No information noted] | |||
| For <1 day exposure measurement, details of measurement protocol and influence of sources of exposure should be included | Low: <1 day exposure measure without protocol discussion and QC | Average of 1-hr samples from two rooms; exposure sampling protocol referenced | Limited sampling period | <1 day exposure measurement (but protocol was discussed). Classify as medium rather than low? Protocol includes QC but not LOD |
| LOD and percent < LOD | LOD 0.12 mg/m3 | The study does not report a LOD | ||
| Concentration measure captures mean individual exposure | High: Exposure assessment designed to characterize mean exposures Med: More limited exposure assessment |
Average of 1-hr samples from two rooms | Limited sampling period | <1 day exposure measurement, unclear if this is categorized as “more limited” |
| Validated data collection instrument used and described | High: Validated data collection instrument used & described Med: instrument less well described |
Self-report questionnaire, no description | Questionnaire not described | Medium = less well described; unclear how EPA rates “no description” |
| Outcome ascertainment independent of exposure knowledge | High and Med: Outcome ascertainment independent of exposure knowledge | Response blind to formaldehyde measurements | ||
| Timing of outcome assessment with exposure assessment | High and Med: Symptom assessment concurrent with exposure assessment | [No information noted] | Outcome assessment and exposure assessment done at the same time (although outcome involved recall for entire time in the house) | |
| Potential for Confounding | No Issues Noted in Summary Diagram | |||
| Important confounders addressed in study design or analysis | High: confounding considered and addressed in design or analysis | Logistic regression model adjusted for age, gender, smoking status | ||
| Confounding by coexposures addressed | Med: Confounding considered and addressed in design or analysis, but questions remain about correlation between formaldehyde and coexposures Low: High likelihood of confounding preventing differentiation of formaldehyde effect from that of other exposures (Low) |
[No information noted] | No information about confounding by coexposures noted, but not noted as a deficiency by EPA | |
| Analysis | No Issues Noted in Summary Diagram | |||
| Appropriate analytical approach used | High: Analytic approach for dose-response appropriate for data type Med: analytic approach more limited Low: limited or inappropriate data analysis |
Logistic regression | ||
| Consider alternate explanations for findings | [No information noted] | No evidence that this was done (generally not addressed in study quality tables) | ||
| Quantitative results presented | High: Quantitative results provided | Logistic regression, provided graph of predicted mean prevalence normalized to mean age, and upper and lower 95% confidence interval by concentration from regression model | Only one figure reported regression results, no info about regression coefficients and fit, no other results presented, no reporting of primary results | |
| Other considerations not otherwise evaluated | No Issues Noted in Summary Diagram | |||
| Sensitivity (exposure levels, exposure contrast, duration of followup, outcome ascertainment) | [No information noted] | |||
| Sample size | High: Large sample size Med: sample size may be a limitation Low: small sample size |
N = 61 | Assume that a sample size of 61 is large, because EPA did not note a deficiency here | |
NOTES: Based on Table A-34 of EPA’s 2022 Draft Assessment. LOD = limit of detection; NI = not informative; QC = quality control; RH = relative humidity.
The committee’s review of the Hanrahan et al. (1984) study generated concerns not captured by EPA’s review. These include concerns about the application of criteria relevant to the Information Bias domain:
- The domain includes the criteria “exposure assessment timing appropriate for outcome observation” (A.5.1), and “assessment of symptoms timed concurrent with exposure assessment” (Table A-33, A.5.2), with the latter included in the descriptions of both high and medium quality studies. However, although the exposure measurements and the symptom questionnaire were conducted at the same time, the questionnaire gathered information about symptoms reported for any time since moving into the home. Therefore, the exposure assessment was not concurrent with the symptoms. EPA noted this concern when discussing the Hanrahan et al. study in the dose-response assessment, which states that the confidence in the point of departure derived using the Hanrahan et al. study was medium, “reflecting uncertainty in the temporal relationship of the exposure measurements with respect to the assessment of irritation symptoms.” (p. 2-10).
- Table A-33 (A.5.2) describes a medium-quality study as one with the data collection instrument “less well-described.” Hanrahan et al. (1984) does not describe the data collection instrument (the survey) at all, which is seemingly inconsistent with a medium quality rating.
For the Analysis domain (summarized in the Other category in the EPA summary figure), one of the criteria is the presentation of quantitative results. The only results data presented in the Hanrahan paper are within a figure showing the regression relationship for one endpoint, with no information about the primary data, the regression coefficients themselves, or model fit. EPA did not call out this deficiency in the Analysis category or in the summary figure.
Inconsistencies are also apparent in how study quality deficiencies are represented in the four-domain summary confidence figure for human sensory irritation studies. For example, descriptions of methods are insufficient for some PECO domains in the six-domain table. These deficiencies are not indicated as colored boxes in the final four-domain summary figure for some studies (e.g., Norsted 1985; Thun, 1982), although they are marked for other studies (e.g., Wantke, 1996b). Also, the overall confidence summaries do not always include descriptions for deficiencies noted in the four-domain figure. For example, for Zhai (2013), a deficiency is noted in the Other category of the figure for analysis of combined respiratory symptoms, with no explanation as to why that category is marked. For the Other category, explanations of deficiencies noted in the four-domain summary figure are often provided below the figure, but not in the corresponding domains (e.g., Analysis, Sample Size) in the table. There is a contrast with the other domains for which any issues described with the summary figure are also explained in the domain-specific column (e.g., for Participation Selection or Exposure) (see, e.g., Dally, 1981; Main and Hogan, 1983).
Overall, there are a number of inconsistencies between the specific evaluation criteria that are presented for the human sensory irritation outcome and how they are applied to the Hanrahan et al. (1984) study, as well as how study limitations are presented for other sensory irritation studies.
STEPS 5 AND 6: SYNTHESIS OF RESULTS AND SYNTHESIS JUDGMENTS
Step 5 of the EPA process involves separately interpreting the evidence from human studies, animal studies, and mechanistic studies. EPA applied a set of considerations and a framework for assessing the strength of evidence in each of the evidence streams, which are described in the Preface of the main document (Tables IV and VI for human evidence).
Step 6 of the process diagram involves applying the synthesis framework from Step 5 to the endpoint and making evidence stream-specific synthesis judgments. The panel used human sensory irritation and animal respiratory pathology as case studies to evaluate EPA’s application of their framework.
For human sensory irritation, the information that applied to the synthesis judgments is described in the text of the main document in Section 1.2.1, under the title Integrated Summary of Evidence on Sensory Irritation. EPA determined that the strength of evidence was robust, and they provided information that addressed risk of bias, consistency, biological gradient/dose-response, coherence, mechanism/biological plausibility, and other considerations (from Table VI; the set of studies includes varied populations). The text did not address the strength and precision of the estimates (although this category is not a required criteria to qualify as a robust study, as per Table IV), or the criteria from Table VI that there is “reasonable confidence that chance, bias, confounding, can be ruled out.” Although these criteria are not discussed, EPA was clear about the basis of the strength-of-evidence determination overall, and applied it in a way that was consistent with their stated framework.
STEP 7: EVIDENCE INTEGRATION JUDGMENTS
Step 7 in EPA’s process diagram comprises evidence integration judgments, which generally equate to the final hazard identification step in the assessment. In the Preface, EPA presented Table VIII, which describes how evidence integration judgments are made, based on synthesis judgments for each evidence stream and considering biological plausibility. This table clearly lays out the types and confidence of evidence that are used to make the judgments of strength of evidence: evidence demonstrates, evidence indicates (likely), evidence suggests (but is insufficient to infer), and evidence inadequate. The information provided from Step 6 (synthesis judgments) can be directly applied to the metrics in this table to determine the final evidence judgment. The bases of these judgments appear reasonable and follow from earlier steps in the process.
The committee evaluated the application of these criteria to the sensory irritation endpoint. For sensory irritation, the information about overall evidence integration is described in Table 1-4. This table provides the information that both justifies the synthesis judgment for each evidence stream (for Step 6), as well as presenting information for the Step 7 evidence integration judgment. For human studies (robust), the table summarizes the number of high- and medium-quality studies from each relevant study type (residential, controlled human exposure, longitudinal occupational and anatomy lab). However, the table mistakenly states that there were four high- and medium-confidence residential studies, when there were no high-confidence residential studies (there were four medium-confidence studies). In addition, EPA notes that there were numerous high- and medium-confidence longitudinal (occupational and anatomy lab) studies, but these studies receive limited discussion in the main text. It is unclear why EPA appears to have de-emphasized these studies when evaluating sensory irritation, but then used them as a basis for the robust determination when synthesizing the evidence. In addition to the human evidence stream, EPA presented a robust evidence judgment for animal evidence (not reviewed in EPA’s evaluation, but considered to be a well-documented phenomenon), which provides robust and moderate mechanistic evidence to support biological plausibility of formaldehyde effects on sensory irritation. Overall, EPA’s conclusion that Evidence Demonstrates is supported by the evidence and is consistent with the criteria presented in Table VIII.
STEP 8: DOSE-RESPONSE STUDY SELECTION
Step 8 in the EPA process diagram is dose-response study selection. In the Preface, EPA presented considerations for study selection for quantitative dose-response assessment and derivation of toxicity values in Table X. This table provides guidelines for study inclusion in the categories of Overall Confidence Conclusion, Study Confidence, Population, and Exposure Information. Each category includes one or more considerations that EPA considered important for study selection, although EPA did not provide further descriptions of those considerations to aid in interpretation of how they were applied. For example, in the Study Confidence category, EPA did not provide further explanation of what would be considered as reasonably complete reporting of results, or of what study designs are appropriate (aside from long-term animal bioassays). The text of the Preface provided further considerations for study selection in addition to those in Table X, stating that EPA puts particular emphasis on the accuracy of formaldehyde exposure, the severity of the observed effects, and the exposure levels analyzed.
EPA also provided information about study selection in Section 2.1 of the main document (p. 2-1), which states that studies and endpoints that are sufficient for deriving a reference concentration (RfC), including high or medium confidence in the study methodological conduct. It is unclear whether EPA used a determination of a high or medium confidence study in the hazard assessment, in place of conducting an evaluation of the study design considerations listed in Table X from the perspective of the dose-response assessment. Section 2.1 also provides further study selection criteria for human and animal studies. Table C-3 below provides a compilation of the general study selection considerations for dose-response assessment, based on the information from the Preface and Section 2.1.
Additionally, EPA provided endpoint-specific dose-response study selection considerations in Section 2.1.1. For sensory irritation, it stated that studies that conducted the exposure assessment concurrently with the outcome assessment were the most informative for RfC derivation because formaldehyde induces a rapid irritant response.
EPA did not provide a description in Section 2.1.1 or Appendix B as to why they selected the Hanrahan study based on their study selection considerations. Table C-4 compares EPA’s study selection criteria and the Hanrahan study, using information about the study that can be found elsewhere in the Draft Assessment, or in the Hanrahan study itself.
For Study Confidence, there are inconsistencies between EPA’s criteria of reasonably complete reporting of results and the lack of reporting of results in the paper; and the consideration of an accurate exposure assessment of the 1-hour formaldehyde measurements taken in the Hanrahan et al. (1984) study. In Section 2.1.1, EPA concluded that the Hanrahan exposure assessment “reflect[ed] the usual, relatively constant formaldehyde concentrations in the residences” (p. 2-9), which is not supported by the short duration and the single occasion when measurements were taken at each home.
Another point of concern is how EPA used measurement data from Hanrahan et al. (1984) to draw conclusions about exposure of the study subjects and to derive a point of departure. The only exposure information provided in Hanrahan consists of a measurement range of <0.1–0.8 ppm for the indoor samples, as well as a median of 0.16 ppm and a geometric mean of 0.16–0.17 ppm. Data about outdoor measurements are also provided (mean of 0.04 ppm, standard deviation of 0.03 ppm), but the study does not state that the measurement durations for indoor and outdoor samples were the same (which can impact the limit of detection [LOD]). It seems plausible that 0.1 ppm was the detection limit for the indoor samples (and EPA stated that the LOD for Hanrahan was 0.1 ppm in Table A-34, although the study does not provide an LOD). Using this limited information,
in Section 2.1.1, EPA made estimates about the number of measurements below 100 ppb (44 percent; footnote 33, p. 2-7) and below 50 ppb (36 percent). They then concluded in the text that “a significant proportion of the study population was estimated to be exposed to average formaldehyde concentrations below 0.05 mg/m3” (pp. 2-9 to 2-10). This is not supported by the information in the study where the distribution below 0.1 ppm (0.12 mg/m3) is unknown, because it is likely that 0.1 ppm was the LOD.
SUMMARY AND CONCLUSIONS
This case study was carried out to test the replicability of EPA’s approach to carrying out the eight steps of its Integrated Risk Information System (IRIS) Assessment Framework (EPA, 2022b), as applied in the 2022 Draft Formaldehyde Assessment (EPA, 2022a). The committee understands that specific systematic review protocols had not been prepared for this assessment. Instead, through its queries to EPA, the committee established that EPA could provide its methods across the three documents comprising the assessment. The case study shows that the components can be identified, albeit with some difficulty (Figure C-2). The case study adds support to the committee’s general concern about the challenge of recreating the review methods of the IRIS Program for this assessment.
The committee walked through the various steps of the assessment in order to evaluate the utility of the documentation identified—not to attempt to “validate” the review outcome for human sensory irritation. While we acknowledge that different groups of expert reviewers may come to different places in a multistep review process, the purpose of this case study was to evaluate the transparency of EPA’s review methods. The committee could not replicate the agency’s process with complete fidelity, and we identified inconsistencies in EPA’s evaluation of the Hanrahan et al. (1984) study versus EPA’s stated criteria for study evaluation. However, within the specified approaches for the synthesis and integration steps of the process, the 2022 Draft Assessment reaches justified conclusions within the framework.
TABLE C-3 The U.S. Environmental Protection Agency’s (EPA’s) General Study Selection Considerations for Quantitative Dose-Response Assessment
| Factor | Considerations |
|---|---|
| Overall Confidence Conclusion | Evidence demonstrates or evidence likely (if data were amenable); (evidence suggests is possible, but not done for this assessment) |
| Study Confidence | Appropriate study designs (e.g., long-term animal bioassays) |
| (Reasonably) Complete results reporting | |
| No selection bias, information bias, or confounding that substantially alters interpretation of results | |
| Accuracy of exposure assessment | |
| Severity of observed effectsa | |
| Animal studies: used paraformaldehyde as test article | |
| Animal studies: longer exposure duration and follow-up | |
| Animal studies: adequately powered to detect effects at lower levels | |
| Population | Human studies preferred over animals |
| Dose-response from most susceptible subgroup, as appropriate (and available) | |
| Human studies: preference for study groups from general population (e.g., residences, schools) | |
| Animal studies: preference for animal models that respond most like humans |
| Factor | Considerations |
|---|---|
| Exposure Information | Risk estimates for multiple exposure levels or regression coefficients preferred over LOAEL/NOAEL (provide info about shape of C-R curve and data for BMD modeling) |
| Exposure levels analyzedb |
NOTES: a Text does not specify whether more or less severe effects are preferred (in theory the preference should be for less severe effects)
b The description “exposure levels analyzed” does not specify if EPA means that multiple exposure levels were assessed, or if levels in a certain concentration range are preferred.
Based on the Preface, Table X, and Section 2.1 of EPA’s 2022 Draft Formaldehyde Assessment. BMD = benchmark dose; C-R = concentration-response; LOAEL/NOAEL = lowest observed effect level/no observed effect level.
TABLE C-4 Application of Study Selection Considerations for U.S. Environmental Protection Agency’s (EPA’s) Dose-Response Assessment to Hanrahan et al. (1984)
| Study Selection Considerations for Quantitative Dose-Response Assessment (Draft Assessment Preface, Table X, Section 2.1) (EPA, 2022a) | Hanrahan et al. (1984), Sensory Irritation | ||
|---|---|---|---|
| Factor | Considerations | Relevant Study/Outcome Characteristics (from hazard assessment) | Committee Notes |
| Overall Confidence Conclusion | Evidence demonstrates or evidence likely (if data were amendable); (evidence suggests is possible, but not done for this assessment) | Evidence demonstrates | |
| Study Confidence | Appropriate study designs (e.g., long-term animal bioassays) | Formaldehyde concentration measure in homes with survey about symptoms | |
| (Reasonably) complete results reporting | Only results are overall percentage indicating prevalence of symptoms and graph of predicted prevalence of burning eyes | Only one figure reported regression results, no info about regression coefficients and fit, no other results presented, no reporting of primary results | |
| No selection bias, information bias, or confounding that substantially alters interpretation of results | No info on survey used | Some information bias from lack of survey info | |
| Accuracy of exposure assessment | 1-hr exposure measurement | Very short exposure assessment | |
| Severity of observed effects | Eye irritation (“burning eyes”) | ||
| High- or medium-confidence study | Medium confidence | ||
| Concurrent exposure and outcome assessmenta | Concurrent 1-hr measure and survey for symptoms since moving into home | The assessments were concurrent, but the outcome applied to anytime since moving into home | |
| Study Selection Considerations for Quantitative Dose-Response Assessment (Draft Assessment Preface, Table X, Section 2.1) (EPA, 2022a) | Hanrahan et al. (1984), Sensory Irritation | ||
|---|---|---|---|
| Factor | Considerations | Relevant Study/Outcome Characteristics (from hazard assessment) | Committee Notes |
| Population | Human studies preferred over animals | Human study | |
| Dose-response from most susceptible subgroup, as appropriate (and available) | Included adults and teenagers | Sensitive populations not included (on p. 2-9, EPA states that some had chronic disease, but this is not stated in the paper) | |
| Human studies: preference for study groups from general population (e.g., residences, schools) | Residence study | ||
| Exposure Information | Risk estimates for multiple exposure levels or regression coefficients preferred over LOAEL/NOAEL (provide info about shape of C-R curve and data for BMD modeling) | Estimate of regression from graph of percent Predicted Prevalence x Formaldehyde Concentration | No regression coefficients provided, estimated from graph; exposure levels below 100 ppb were estimated, but not clear if those were actually below LOD of method; no info about model fit |
| Exposure levels analyzed | <0.12–0.98 mg/m3 | On pp. 2-9 to 2-10, EPA stated that they estimated a significant portion of the study population to be exposed to <0.05 mg/m3; this is based on their exposure assumptions (which do not consider the possibility of LOD at 0.12 mg/m3), not on study info | |
NOTES: a Consideration specific to the sensory irritation outcome (p. 2-7).
BMD = benchmark dose; C-R = concentration response; LOAEL/NOAEL = lowest observed effect level/ no observed effect level; LOD = limitation of detection
SOURCE: EPA’s 2022 Draft Formaldehyde Assessment; Hanrahan et al. (1984).
REFERENCES
EPA (U.S. Environmental Protection Agency). 2022a. IRIS Toxicological Review of Formaldehyde-Inhalation, External Review Draft. Washington, DC. https://iris.epa.gov/Document/&deid=248150 (accessed September 18, 2023).
EPA. 2022b. ORD staff handbook for developing IRIS assessments. Washington, DC: EPA Office of Research and Development. https://cfpub.epa.gov/ncea/iris_drafts/recordisplay.cfm?deid=356370 (accessed July 12, 2023).
Hanrahan, L. P., K. A. Dally, H. A. Anderson, M. S. Kanarek, and J. Rankin. 1984. Formaldehyde vapor in mobile homes: A cross sectional survey of concentrations and irritant effects. American Journal of Public Health 74(9):1026–1027. https://doi.org/10.2105/ajph.74.9.1026.


