
– 9 –

Identification of Rural and Special Populations: Small Communities, the Young, and the Elderly
Matthew Snipp (Stanford University) moderated the second session on rural and special populations, which addressed data for small communities, the young, and the elderly. The session included five presentations. Eric Sandberg (Alaska Department of Labor) spoke on privatized data for Alaska communities; William O’Hare (independent demographic consultant) considered the effects of differential privacy on the accuracy of census data for young children aged 0 to 4; Jan Vink (Cornell University) examined census data accuracy for school-age children; Joe Salvo (New York City Department of City Planning) addressed the uses of census age data for city planning; and Aaron Sojourner (University of Minnesota) looked at estimates of child poverty for school districts and their use in fund allocations under Title I. Floor discussion followed the presentations.
9.1 PRIVATIZED DATA FOR ALASKA COMMUNITIES
Eric Sandberg (Alaska Department of Labor) said Alaska was one of the states that Je Hardcastle (State of Nevada) had listed as producing its own intercensal population estimates, for all levels of Alaska geography based on the decennial census. Sandberg’s analysis of the 2010 Demonstration Data Products
(DDP) compared with the original 2010 Summary File 1 (SF1) mostly addressed place-level geography.
9.1.1 Alaska Geography
Sandberg provided a primer on Alaska geography. Alaska is a very large state in land area—more than twice the size of Texas. But in terms of population, it is a small state with only 710,000 people in 2010, 47th in the nation and just slightly more populous than the District of Columbia.
Alaska calls its counties boroughs, but they do not cover the entire state. The rest of Alaska is unorganized, so the Census Bureau has created statistical equivalents of the boroughs called census areas. The primary reason for unorganized territory is because there does not exist a tax base large enough to pay for the services that boroughs must provide such as schools. Below the borough or census area level, there are 355 places in Alaska consisting of cities and census-designated places. About 60 percent of the places (130 out of 148 incorporated cities) in Alaska are off the road system (the only way one can reach town is via plane or possibly boat).
In the unorganized territory in western and northern Alaska, 50 to 90 percent of the population of places is Alaska Native. This population is spread throughout other parts of the state, but its concentration is in the unorganized territory. Overall, 80 percent of Alaska’s population is in urban centers, mostly along the Alaska railroad.
To put the sparsity of Alaska’s places in context, Sandberg presented some summaries as shown in Figure 9.1(a). Breaking down places by population size in the 2010 Census SF1, about 67 percent (twice the national average) were under 500 people. In fact, about that percentage could fit their whole community in the auditorium in the National Academy of Sciences building. Alaska, then, has to deal with very small numbers when creating population estimates. At the other end of the scale, only six places (2 percent) numbered over 10,000 people, much less than the national average of 13 percent.
9.1.2 Impacts of Differential Privacy
When Alaska heard about differential privacy, the thought was that it could get ugly, and it did. Sandberg said that Alaska had the highest average absolute place level percentage change between the 2010 SF1 data and the 2010 DDP among the states, depicting the results in Figure 9.1(b). On average, Alaskan places differed in the DDP from their original SF1 populations by 46 percent, a very high number compared with the other states. Only 34 percent of places in Alaska were in the range of +5 percent to −5 percent compared with 58 percent of places nationwide. On the extreme ends, over a quarter of Alaskan places were ±25 percent in the DDP compared with SF1. Moreover, 58 percent of
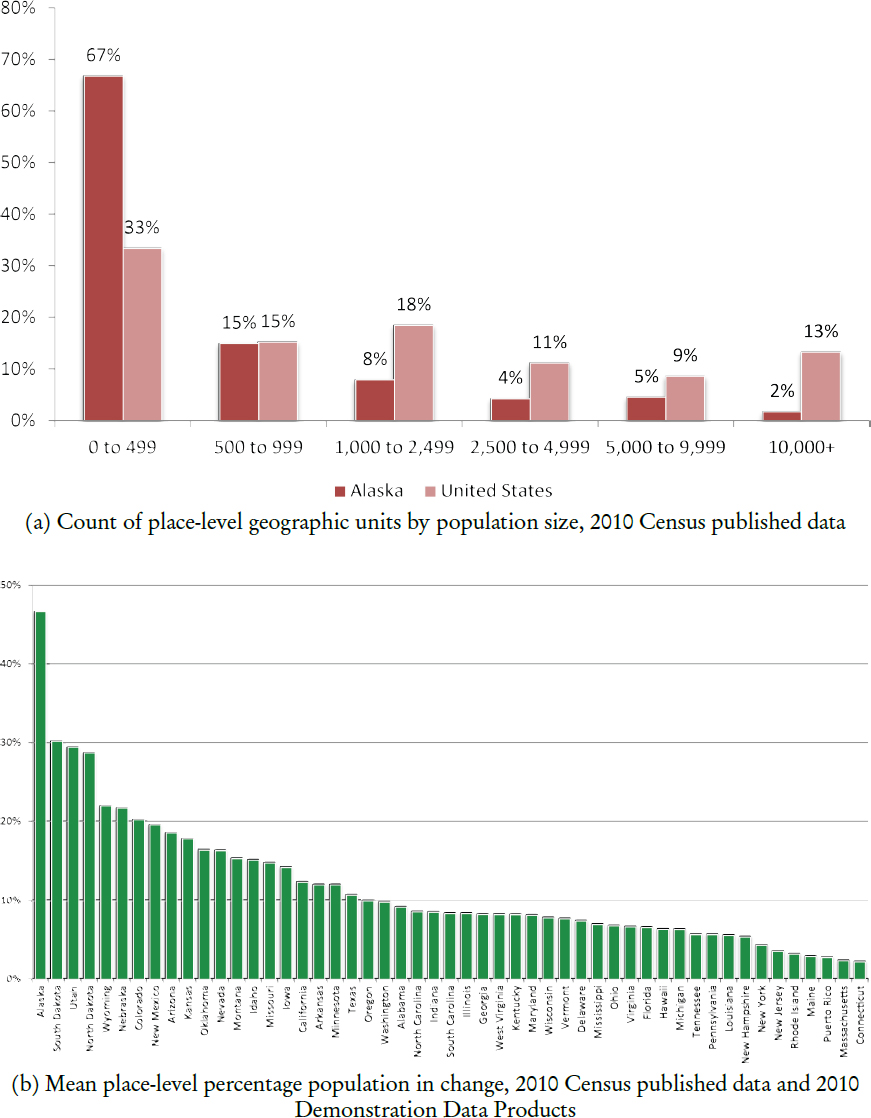
SOURCE: Eric Sandberg workshop presentation; Sandberg notes that he used the IPUMS National Historical Geographic Information System (NHGIS) version of the data files.
NOTE: Unaltered from presenter original graphic, which uses “DP” as label for the 2010 Demonstration Data Products.
SOURCE: Eric Sandberg workshop presentation.
places were smaller in the DDP than in SF1, and in some rural areas, 70 to 80 percent of places swung negative.
Sandberg asked where this population may have gone. The answer was that the people in places that lost population in the DDP were allocated to the balance of boroughs outside cities or census-designated places. What appeared to be driving this result was that the TopDown Algorithm (TDA) kept the housing unit count invariant. That turned out to be a problem because the balances of boroughs tended to have fewer people than housing units. For example, in Yukon-Koyukuk, only 6 percent of the population in SF1 was in the balance of the borough, compared with 25 percent of housing units. Many of these housing units were lodges and fishing camps used by Alaska Natives who still lived a subsistence lifestyle. As Matthew Berman (University of Alaska Anchorage) indicated, Alaska has old villages with viable housing that have been abandoned, so the TDA was bringing people back to abandoned villages that had not been lived in for decades.
9.1.3 Effects on State Programs
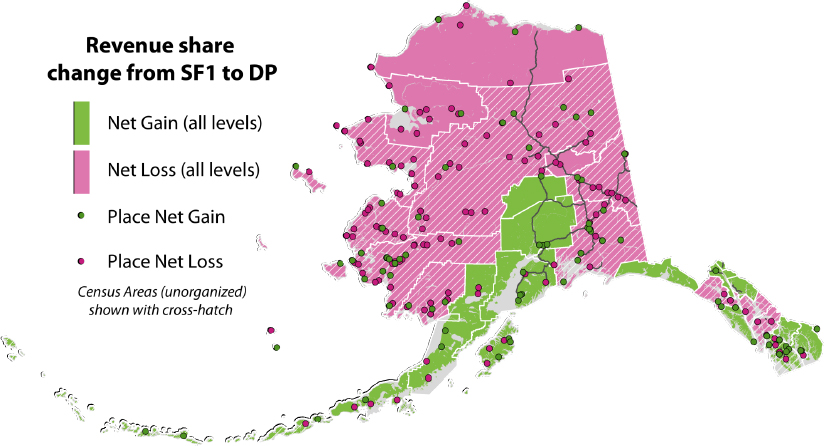
Sandberg looked at how the different population counts between SF1 and the DDP would affect various state programs. For example, Alaska has a revenue sharing program called the Community Assistance Program, which allocates funds to local communities. The allocation was based on decennial census data every 10 years and the state’s population estimates during the intervening years. Figure 9.2 shows that, with the DDP, villages in the rural areas would lose money because so much of their population wound up in the balance of boroughs. Conversely, urban areas would gain funding.
9.2 CHILDREN AGES 0–4, STATES AND COUNTIES
William O’Hare (independent demographic consultant) said he was struggling to understand differential privacy and its implications for census data use. His use case involved the undercount of children ages 0 to 4 in the census.
9.2.1 Background
O’Hare began by summarizing the research on the undercount of young children in the census, conducted with the method of demographic analysis. In 2010, the 0–4 age group had a net undercount nationwide of 4.6 percent, much higher than for any other five-year age group. In fact, the next highest undercount rate was for children aged 5 to 9, and above that, no age group had a net undercount larger than 0.7 percent. Over time, from 1950 to 1980, the net undercount rates for young children aged 0 to 4 and adults aged 18 and over were about the same and getting smaller. After 1980, the trend lines diverged. Between 1980 and 2010, the net undercount of young children tripled from about 1.5 percent to 4.5 percent, while the coverage of adults continued to improve to the point that there were net overcounts in 2000 and 2010. In 2010, the census had a net undercount of about 1 million of 21 million young children. In sum, young children present a growing problem for census accuracy, which was why O’Hare believed it important to consider the implications of differential privacy.
9.2.2 Methodology
For his analysis, O’Hare used four files from the Census Bureau. The first was the 2010 SF1, and the second was the 2010 DDP. The third file was the 2010-vintage population estimates for states and counties, abbreviated as PEP. These were produced by accounting for births and deaths subsequent to 2000 and migration at the state and county level. The birth and death data were very solid. Although there were potential problems with migration data, this was typically not important for young children, as it was births that drove the
estimates at that level. In fact, O’Hare argued, the 2010 PEP estimates were more accurate than the 2010 Census. The fourth file provided some updated experimental demographic analysis estimates of the population for 2010 based on some uncovered new data, which were made available for states and large counties in 2018. O’Hare assumed that these estimates were the most accurate representation of the population in 2010.
9.2.3 State-Level Analysis
O’Hare found a high correlation at the state level between estimates of young children from SF1 and the DDP. The two distributions were almost identical.
9.2.4 County-Level Analysis
O’Hare sorted counties into two groups: large counties with 100,000 or more people (including the District of Columbia) and smaller counties. Most of the people live in large counties, but most of the counties (about 2,600 out of about 3,100) are small counties.
Comparing the two 2010 datasets with the 2018 updated demographic analysis results for large counties, O’Hare found a high correlation in the errors (net undercounts) between the two (the SF1 and the DDP). Large counties had a relatively high net undercount—4 to 5 percent—in 2010, so the distribution of error in the two datasets was around this large net undercount as opposed to 0. For small counties, there was much less correlation—only 0.46—between the SF1 and the DDP. The smaller counties had a collective net undercount of young children of −0.8 percent, so the variation of the SF1 and the DDP was around 0.
The mean absolute error for small counties for young children in the DDP compared with the 2018 updated demographic analysis estimates was 15.2 percent compared to 8.1 percent for the SF1 file. Also, 43 percent of small counties had absolute errors of 10 percent or more using the DDP compared to only 24 percent using the SF1. Conversely, 22 percent of small counties in the SF1 had absolute errors of less than 10 percent compared with only 13 percent of counties in the DDP data. The DDP was more problematic for smaller areas, in this case smaller counties, which are the vast majority of counties in the country.
9.2.5 Uses of Data for Young Children
O’Hare noted that the count of young children was important for communities, as the Census Bureau has acknowledged. Policy decisions for children are more often made at the state and local levels rather than the federal level, in contrast to other groups such as the elderly. School districts are an obvious
example, as policy and program decisions are most often made at the county or even sub-county level for the school-age population.
O’Hare turned to the distribution of federal funds to states and localities. The website “Counting for Dollars 2020” created by Andrew Reamer at George Washington University1 showed that 316 federal programs gave out $1.5 trillion in fiscal 2017 based on census-derived data. (There is not much systematic information about state fund allocations to localities.) Dividing $1.5 trillion by the population comes out to almost $5,000 per person. While O’Hare posited that it was probably not fair to say that a jurisdiction would lose that much money for every person not counted, the number provided an order of magnitude of the funding that the census count could affect. O’Hare further noted that an error in the census for young children would mean miscounting them for most of their childhood, as they would make it all the way from preschool to high school during the 10-year period of the census. O’Hare was able to quickly find four programs that allocated funds for services to children aged 0 to 4, meaning that a lot of money could be riding on the accurate count of young children in 2020. These programs were Head Start, the Special Supplemental Nutrition Program for Women, Infants, and Children (WIC), the Child Care and Development Block Grant, and the Maternal and Child Health Services Block Grant.
O’Hare noted that the DDP seemed to be worse or less accurate for smaller areas of geography, yet they were most in need of accurate census data and the funding riding on those data. O’Hare estimated that using the 2010 DDP, 43 percent of the smaller counties would have the prospect of getting 10 percent too much or 10 percent too little funding for the next 10 years. Most of them would be happy to get 10 percent more, but that choice would not be up to them. For small counties, it would be difficult to deal with inconsistent data and the implications for funding streams.
9.2.6 Concluding Comments
O’Hare commented that in terms of communicating the differential privacy issue to the public, there was a pressing need for better metrics and communication tools. It would be useful to have a metric such that, with a given level of ϵ, someone could be reidentified at a 10 percent rate, a 1 percent rate, or whatever. Also needed were better measures of accuracy for the differentially privatized data.
O’Hare’s last comment concerned those who cared about privacy. Speaking personally, he was not concerned that his age, sex, and race could be identified, but he understood that some people did care. These people were not at the
___________________
1 See https://gwipp.gwu.edu/counting-dollars-2020-role-decennial-census-geographic-distribution-federal-funds.
table, and O’Hare was not sure how to get them to the table. In trying to balance the trade-off of privacy and accuracy, it would help to know the cost of a lack of privacy for people who worried about it the most.
9.3 ELEMENTARY SCHOOL ENROLLMENT
Jan Vink (Cornell University) started with the big picture about data quality and accuracy, and then presented results from a couple of use cases comparing the 2010 SF1 and the DDP. He concluded with thoughts on how to go forward.
Vink said that he cared about the mission of the Census Bureau: “to serve as the leading provider of quality data about its people and economy.” He had trouble, however, finding on the Census Bureau website what they meant by quality of data. Statistics Canada has a similar mission statement and a lot of documentation on quality attributes related to the data, which refer to usefulness, coverage, granularity, and accuracy, the latter term referring to precision, bias, reliability, validity, and consistency. Their documentation also includes the protection of census information as one of the attributes of quality data. Comparing the 2010 DDP with the SF1, he focused on accuracy.
9.3.1 School District Use Cases
Vink’s first use case involved predicting change in elementary school enrollment in school districts in New York State using administrative data and the 2010 Census. The elementary school–age population in 2010 was 6 to 11 years old, but the next generation, children aged 0 to 5, was already there. He calculated the ratio of 0- to 5-year-olds to 6- to 11-year-olds separately from the SF1 and DDP data and compared the results to the observed change in enrollment between the 2009/2010 school year and the 2015/2016 school year; see Figure 9.3. He carried out the calculations for 425 New York State school districts with at least 50 students enrolled in elementary school.
For SF1, the ratio of the two age groups did a good job in predicting the expected change in school enrollment in elementary school. However, the DDP did not perform so well. The ratios for school districts ranged from just over 0.1—meaning that there were something like eight to nine times as many children aged 6 to 11 as those that were 0 to 5—to about seven times as many children aged 0 to 5 as those aged 5 to 11.
Vink’s second use case had to do with catchment ratios, or what could be called market shares, that is, how many children aged 6 to 11 in the school district were enrolled in elementary school. This indicator, which he calculated for 444 New York State school districts with 1,000 or fewer students in elementary school, could be important for school districts to self-reflect on how many kids they attracted. In the SF1, the shares were between 80 to 100 percent, what one would expect, given that some school districts had
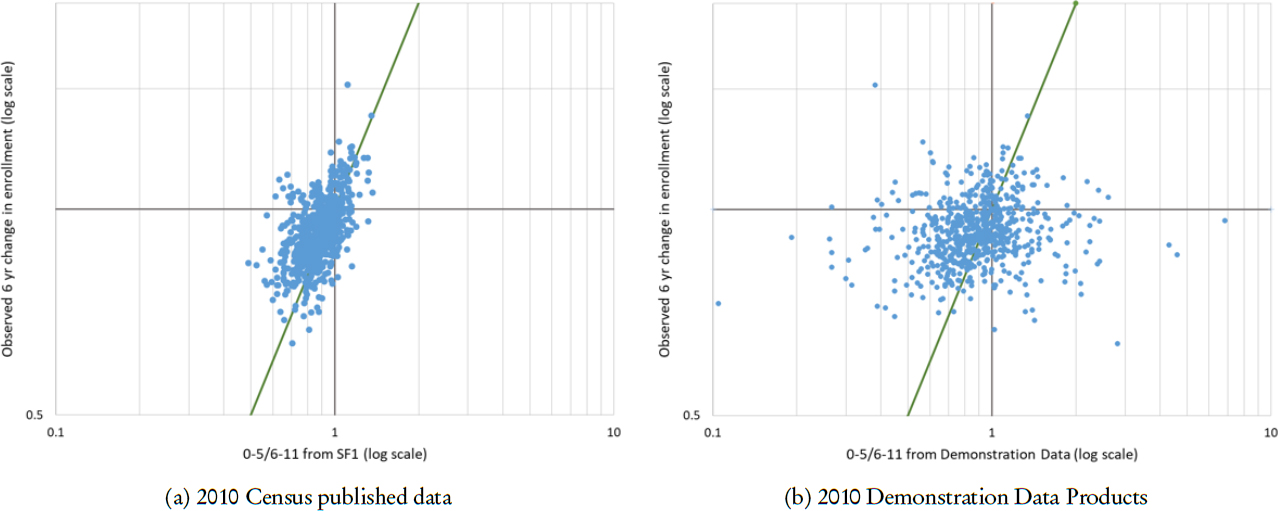
NOTES: x-axis is the district-level ratio of children aged 0 to 5 to those ages 6 to 11. Both x and y axes are on log scale. Data points represent 425 New York school districts with at least 50 children enrolled in elementary school in 2009/2010.
SOURCE: Jan Vink workshop presentation.
competition from private schools in the area. The DDP, in contrast, showed a much wider range of shares—from 50 to 200 percent—with values that were not credible. It would be much harder for school districts to assess their market shares with these data.
9.3.2 Some Statistics
Vink looked at three age groups for children: 0–5, 6–11, and 12–17. Each group would be important to a school district to determine where to put resources. In SF1, the ratios of children aged 6 to 11 to those 0 to 17 in New York State school districts with at least 50 children aged 0 to 17 were generally in a narrow band of 33 to 34 percent. In contrast, the band was much wider—from 5 to 70 percent of children aged 6 to 11 as a share of those aged 0 to 17—and the outliers much more extreme in the DDP.
Vink also looked at the number of zeroes for each single year of age in the 6 to 11 category, reflecting empty classrooms, which could be problematic. In the SF1, there were only two school districts that had at least one zero in the elementary school ages—one district had only 22 elementary students and the other only 25—out of about 700 school districts total in New York, 699 of them outside New York City. In the DDP, in contrast, 62 school districts had at least one empty classroom, including a district with almost 400 elementary-age students.
Finally, Vink looked at the correlations for census tracts with at least 50 children aged 0 to 17, between single years of age. It would be expected that the number of 6-year-olds in a tract would correlate highly with the number of 7-year-olds and a little bit less so as the age gap got larger. In the SF1, the correlations between one age and the next were high as one would expect, but much less so for the DDP.
9.3.3 Thoughts About ϵ
Vink said the ϵ issue was new to him, so he simplified it to something he could calculate in an Excel spreadsheet to obtain a feel for how ϵ and accuracy related to each other. He posed a simple experiment: take a random group of N people, each of whom had a 50 percent probability of being male or female, and ask what was the probability that both sexes were represented in this group. Before the application of differential privacy, this probability would be easy to calculate. To simulate differential privacy, Vink created histograms and applied two random draws from a Laplace function with parameter β. He started with ϵ = 0.1 and estimated a probability of 0.73 that both sexes would be represented in a group of 50, very different than the probability before differential privacy. With an ϵ = 6.7, the probabilities were about equal.
Vink looked at the operational plan for Count Review, a program meant to ensure that changes in the counts at multiple levels of geography are reasonable. He suggested the Census Bureau should plan ahead of time for what was reasonable to expect from differential privacy with regard to precision, bias, validity, and consistency of the data at multiple levels of geography. Also, the Census Bureau should have a plan for how to get to a better place, should the iterative process of developing a useful differential privacy approach keep producing unreasonable results. He suggested starting with different levels of ϵ for evaluation and fine-tuning purposes.
9.4 USES OF CENSUS DATA ON AGE IN LOCAL PLANNING
Joe Salvo (New York City Department of City Planning) had two purposes. One was to present a use case on emergency preparedness in New York City on behalf of the elderly. The second was to make a case for good data throughout the age distribution. Good data are what this is all about. Users were contending with the tension between utility and disclosure avoidance.
9.4.1 Emergency Preparedness in New York City
One function of the Population Division in the New York City Department of City Planning was to help New York City prepare for emergencies like the next Hurricane Sandy. New York City has 2,165 census tracts, of which 18 percent or 394 tracts were in the Hurricane Sandy inundation areas. New York City is actually a group of islands, and the only part connected to the mainland United States is the Bronx. New York City has hundreds of miles of shoreline and is very vulnerable, so the city spent a lot of time preparing for the inevitable.
The preparation was done in several ways, one of which was to look at data on the older population. A majority of people 75 years of age and over have at least one disability, according to the American Community Survey (ACS). The city wanted to make sure that storm shelters were physically accessible, and the city’s Office for People with Disabilities worked on this project with the Department of City Planning. The project needed the characteristics of the local population for evacuation purposes in order to queue up buses and to know where the Metropolitan Transportation Authority should keep its fleet of buses. The project also needed to look at emergency generators because water inundation typically leads to blackouts. The city also planned to deal with heat emergencies for which generators would be needed, as well as other services that might need to be provided by the city’s Department of Health and Mental Hygiene.
The Planning Department created a map to identify concentrations of people ages 75 and older. Then they compared the results using the 2010 SF1 and the 2010 DDP; see Figure 9.4. In almost half of the tracts in the Hurricane
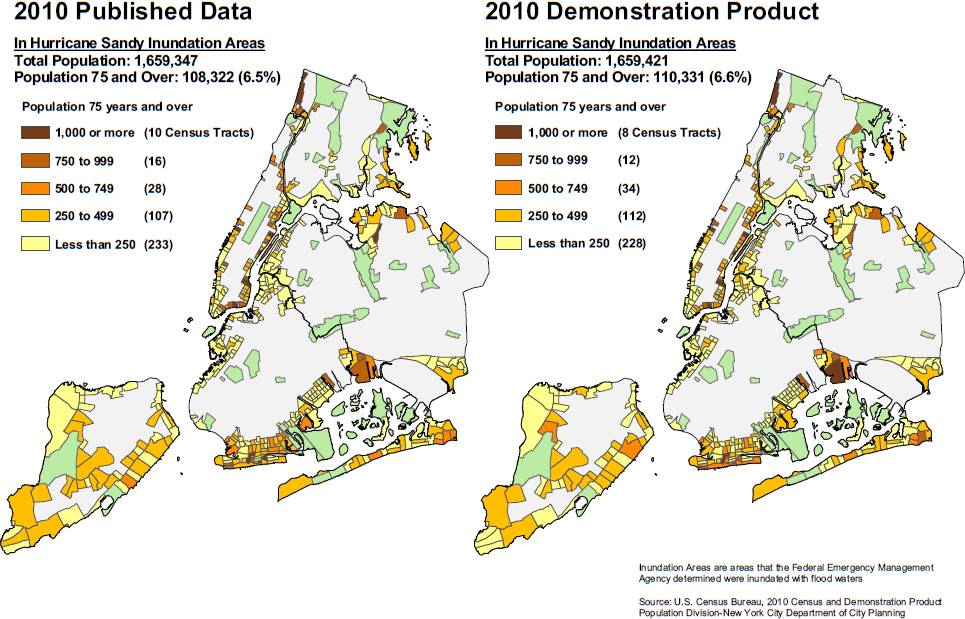
SOURCE: Joseph Salvo workshop presentation.
Sandy inundation areas, the population ages 75 and older differed by 25 percent or more. On the positive side, the clustering of the older population was similar between the two datasets, which would give the city the ability to identify the areas that would be at risk. Also, after aggregating the number of tracts in each of five categories of concentration among the elderly, the number of tracts in each category did not change much. Summary statistics for one use case, however, could not provide the whole picture.
9.4.2 Age Data as Input for Many Local Uses
Salvo showed comparisons between SF1 and the DDP for census tracts for different age groups by the population bin into which each tract fell (such as 0 to 50 people aged 20 to 24, 50 to 100 people, and so on). The absolute average percentage differences between the two datasets were high: 32 to 34 percent for five-year age groups from ages 20 to 24 through ages 35 to 39. Grouping the ages into one category of people 20 to 39 years old had the result of decreasing the average absolute percentage difference, yet cities need age data in five-year groupings. Not surprisingly, the bigger differences were for the less-populated tracts.
Salvo next looked at aggregation to larger geographic areas, specifically neighborhoods, which have about the same population as the minimum population size for central cities of 50,000. For East Harlem North in Manhattan, the average absolute percentage difference between the SF1 and the DDP for five-year groups from under 5 years to age 85 and older was about 6.4 percent, which was not bad. On the other hand, while the SF1 data showed a smooth pattern across ages, the DDP showed a jagged pattern. Salvo said that this would “not pass the smell test” given that in demography, jagged movements from one age to the next will typically only occur in places where there have been major problems such as war, famine, or refugee movements, or in situations where there was a mobilization of a military population.
Salvo gave another example of Crown Heights South in Brooklyn, which had seen a big influx of young people; see Figure 9.5. The SF1 data showed a pattern that reflected this influx. However, the DDP data did not show that pattern. The immediate reaction of Planning Department staff was that the erratic pattern in the DDP needed to be fixed. Salvo was not sure what level of ϵ would be necessary to effect this fix, but it did need to be done. There are many places in the country with 40,000 to 60,000 people that might experience such anomalies.
Salvo called for age to “take its share of ϵ ” because age data were fundamental for applied demographers, especially at a local level. Age data were essential for drawing school zones and projecting student numbers as denominators for vital rates to monitor health and, of course, to develop population estimates and
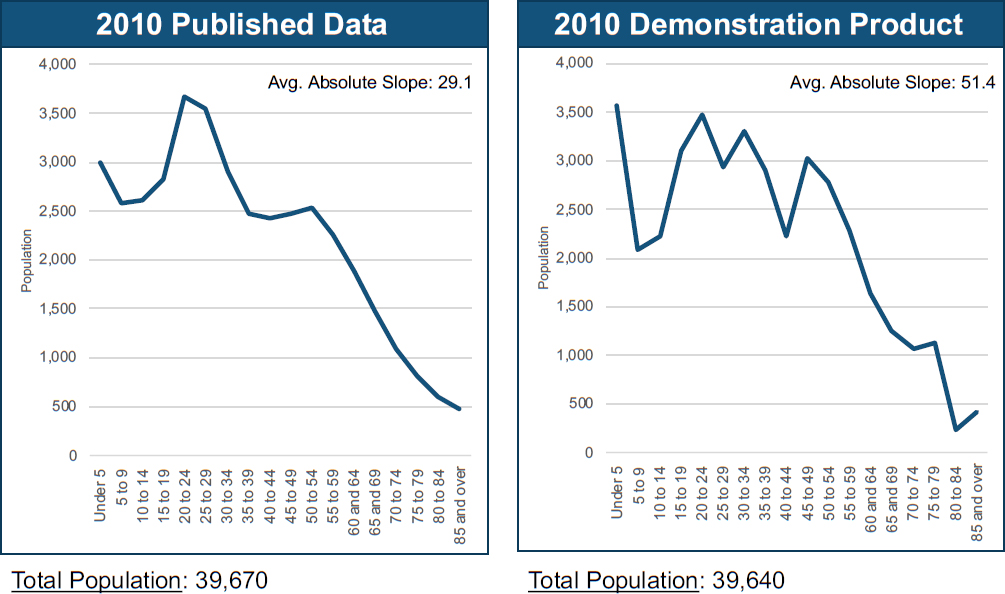
SOURCE: Joseph Salvo workshop presentation.
projections. Salvo’s bottom line was that age had to be made a priority so that age patterns would behave appropriately.
9.5 CHILD POVERTY BY LOCAL SCHOOL DISTRICT AND ALLOCATION OF FEDERAL TITLE I FUNDS
Aaron Sojourner (University of Minnesota) said his presentation would cover work done in collaboration with David Van Riper (University of Minnesota) on estimates of child poverty used for allocation of federal funds to school districts under Title I of the Elementary and Secondary Education Act. Their work used rough models of the funding formulas to analyze the agreement or disagreement between estimates of school-aged children in poverty, chances school districts have of qualifying for Title I funding through different subprograms, and the amount of funding they would receive. The models used the Small-Area Income and Poverty Estimates (SAIPE) from the Census Bureau for numerators and census data for denominators. There were two models for each subprogram, differing only in whether the model used the 2010 SF1 data or the 2010 DDP data.
In summary, the average level of disagreement for school district numbers of poor children was about 8.6 percent between the two data files. While this was a moderate level of disagreement, there was a lot of variance around the mean. There was little disagreement in terms of whether a district qualified according to the federal program rules. In terms of the funding amount that a school district would receive, the average disagreement was 9 percent, with greater disagreement for small school districts and for states with smaller or fewer districts.
9.5.1 Title I
Title I has been the primary education funding stream for children living in poverty since 1965. Funds flow from the U.S. Department of Education to states, to local school districts, and then to schools. Districts can qualify for funding based on the number and share of the school-aged kids in their population who are eligible. The main criterion for eligibility is whether the child lives in a poor family. Sojourner and Van Riper’s analysis looked at 11,000 unified school districts in the country, ignoring districts that were for elementary or secondary solely.
Title I has several types of grants: basic grants, concentration grants, targeted grants, and education finance grants. Overall, Title I provides about $15 billion a year to school districts.
9.5.2 Number of School-Aged Children in Poverty
To produce estimates, Sojourner and Van Riper took the school district SAIPE poverty rates and multiplied them by the estimated (DDP) or the tabulated (SF1) school-age population counts to obtain a count of the district’s number of school-age children in poverty. Looking across all school districts, the two sets of estimates were similar. On a percentage basis, there was disagreement, particularly for smaller districts.
Sojourner and Van Riper further broke down school districts into deciles by school-age population and looked at the 25th percentile, median, and 75th percentile of disagreement between the two data sources. This approach showed more disagreement, particularly for smaller districts. Doing this by child poverty rate decile, there was not a clear-cut gradient. Many differences were small, although there were definitely some outliers.
9.5.3 Title I Funding: Eligibility and Amounts
Sojourner and Van Riper first asked whether a school district qualified for a Title 1 basic grant under the SF1 estimates, differentially private estimates, or both. There was 99 percent agreement for districts that qualified, but only 80 percent agreement for districts that did not qualify. The results for the other three programs showed more agreement.
Sojourner and Van Riper then looked at funding using a simple model, which assumed an average amount per child, even though there is a lot of variation in per child funding in actuality. Specifically, their model assumed an average of $550, $134, and $564 per poor child, respectively, for the basic program, concentration program, and other two programs combined. The biggest differences between funding with the SF1 and the DDP were about $3 million. Looking at districts by school-age population deciles (the smallest 10 percent to the largest 10 percent), there were much higher levels of mean or median disagreement and much more variance for smaller districts.
Finally, Sojourner and Van Riper calculated the average funding percent disagreement among school districts by state between the SF1 and the DDP. The results showed wide variation. Some states had big differences (Alaska, Montana) and others very little (California, Connecticut).
9.6 FLOOR DISCUSSION
Matthew Berman (University of Alaska Anchorage) offered an example of an important census data use that was challenged by differential privacy, specifically, a research project on suicide prevention in rural Alaska funded by the National Institute of Mental Health. The project’s goal was to identify community protective factors, motivated by the fact that this population has
one of the highest suicide rates experienced globally, certainly higher than anywhere in the United States. Some communities have very high numbers of suicides, which have been intractable to interventions, while adjacent similar-appearing communities have gone for decades with no suicides. The question was whether there was anything about the suicide-free communities that protected them. To do the study required accurate rates of suicide by community, which in turn required census data as the denominators. With the 2010 DDP, it turned out that a program would have to have a 50 percent greater effect on suicide for the effect to be statistically detectable, which would be a high burden. Moreover, because suicides are heavily concentrated among young adults, especially young adult males, the data needed to be age-adjusted using 2010 SF1 age data. The 2010 DDP data were unusable for this purpose given the noise in the data. Moreover, with the DDP data, it would not be possible to reproduce the study in future years. In fact, these communities are volunteering with the study and in them everyone knows everyone else, so the idea that gender, race, and approximate age were not already public information and needed to be protected was ludicrous.
In addition, Berman noted that rural Alaskans were suspicious of government coming in to collect data. If the Census Bureau conducted the 2020 Census and then gave back noisy data, which people in the communities knew for certain were spurious, then they might not be willing to cooperate with the Census Bureau in future surveys.
Helen Nissenbaum (Cornell Tech) wondered whether some applications such as decisions about child services in New York City were possibly trying to get more out of census data than they were ever intended to provide. Government actors must make lots of administrative decisions, and they cannot all hang on census data. Should not governments perhaps treat the census as an imperfect baseline and seek to capture more of the detail locally? Sojourner replied that the Census Bureau provided a tremendous public good by going out and talking to everyone and collecting all these data at the same time so that jurisdictions did not have to each do their own collection. Yes, there was a tradeoff between making decisions with more accurate and less accurate information. The use cases presented in the workshop were valuable for illustrating some of the real resources that were on the line and their magnitudes. Policy makers passed laws and regulations to target resources toward certain ends, and to the extent that the data were less accurate, the targeting would be less effective. There would never be perfect information, and there could well be a role for local supplementation of census data, but there was also a cost to the Census Bureau doing less given that they were providing a major public good. Salvo added that his city had always relied on the census for basic information, including age as probably the most fundamental characteristic aside from the total population count, because it drove so many uses. While age data might be available on the Internet, the accuracy of those data has always been questioned.
Admittedly, census data have deficiencies (such as the undercount of children as discussed by William O’Hare), but the reason those deficiencies could be identified was that the census measurement was there in the first place. Were users to rely on sources that did not have the credibility that the Census Bureau had enjoyed and will hopefully continue to enjoy, that would be taking a shot in the dark.
Salvo acknowledged that how much detail users needed was a question, for example, whether single years of age by sex were needed. From the public health standpoint, it would be important to have single years of age from 0 to 15, but whether single years of age were needed for older ages was an open question.
Paul Ohm (Georgetown Law Center) observed that many of the speakers talked about questions of equity, race, diversity, gender, and the need to focus on the least among us, people who aren’t represented, and people who are voiceless. He said in his community, it would be considered startling to have a panel of six white men discussing such questions. He said that this may be a question for the conference organizers or for public discussion at lunch. Snipp responded that he is a member of the Cherokee Nation of Oklahoma.


