
CHAPTER THREE
FEMA’S Map Modernization Program
Digital elevation mapping is the fundamental basis for the engineering analysis used to produce a floodplain map and is critical to the beginning and the end of the floodplain mapping process. In the beginning, physical parameters, such as the geometry and slope of the surface, are derived from the digital elevation data and are used in computer models and simulations. At the end, the computed water surface elevations are mapped onto the digital elevation surface. Thus, digital elevation information is one of the primary inputs for the entire floodplain study and the mapping of the study results. Digital elevation data apply to both riverine and coastal requirements.
The purpose of this chapter is to review the Federal Emergency Management Agency’s (FEMA’s) mapping activities and describe the basis for the use of various mapping technologies in the Flood Map Modernization program. The chapter reviews the basic elements of the FEMA Flood Insurance Rate Map (FIRM) and Digital FIRM (DFIRM), the various types of FEMA engineering studies and the input data that these studies require, FEMA’s map inventory, and a 35-year history of FEMA’s flood mapping process that includes FEMA’s five-year plan to provide updated digital flood hazard data and maps for the United States. The chapter concludes with a description of FEMA’s method for risk determination and mapping prioritization and the map quality standards and elevation data and data models that meet these standards.
3.1
THE FEMA FLOOD INSURANCE RATE MAP
The end result of the engineering analysis is a Flood Insurance Study (FIS) text, the profile plots of flood elevation along the streams, and a map called a FIRM. The engineering analysis includes data collection, hydrologic analysis, and hydraulic analysis. The FIRM is a map used by a variety of stakeholders including insurance agents, local and state floodplain administrators, planners, developers, engineers, surveyors, and the public, some of whom have a direct interest in community risks and zoning decisions. The following general descriptions apply to FIRMs and DFIRMs.
3.1.1
Overview
The basic FEMA FIRM is typically printed on 36-inch by 25.9-inch paper. The map includes the following elements (Figure 3.1):
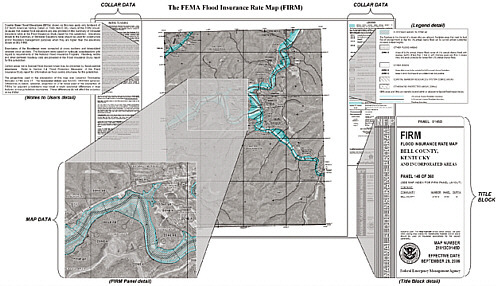
FIGURE 3.1 The three main elements of a FEMA FIRM are highlighted in expanded windows. The title block is on the lower right; the collar data include the map legend (upper right) and the column of text or Notes to Users (left side of the map); and the map data comprise the main map features with flood boundaries delineated. Fine text is not legible in detail at this scale; the map is shown for identification of FIRM components only.
-
The title block describes the name of the community, date of the map, and individual map number;
-
The collar data include common and specific notes about the map, including the map legend; and
-
The map data include the extent of the flood boundaries and the base map, which may be an orthophoto image or vector information that shows road and other feature locations.
3.1.2
Map Data
The map data portion of the FIRM is most relevant to the discussion of mapping technologies and includes the following panel elements (Figure 3.2):
-
Zone labels: these labels show an insurance agent what rates to charge the property owner for flood insurance. Typical 1 percent recurrence interval zones will begin with either the letter A or the letter V. The letter A represents riverine flooding or
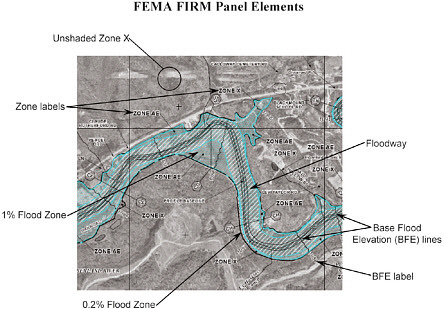
FIGURE 3.2 The main panel elements for the map data in a FIRM. These elements include the zone labels: the 1% Zone, the 0.2% Zone, the unshaded Zone X, the BFEs, and the floodway.
-
waves less than 3 feet high, and V represents areas where waves can be expected to be greater than 3 feet.
-
1% Zone: this zone has a 1 percent chance of flooding to this elevation in a given year (often referred to as the 100-year flood). Typically, areas that fall within this zone are designated with the letter A or V. For a 30-year mortgage, the risk to the property owner experiencing at least one 100-year flood during the life of a 30-year mortgage is 26 percent. This result is calculated using the formula: Risk, R = 1 − [1-(1/T)]N, where T is the average recurrence interval of the flood event in years and N is the time horizon of interest in years. With T = 100 and N = 30, this formula yields R = 0.26 or 26 percent.
-
0.2% Zone: this zone has a 0.2 percent chance of flooding to this elevation in a given year (often referred to as the 500-year flood). Typically, areas that fall within this zone are designated with the letter B or X. For a 30-year mortgage, the risk to the property owner of experiencing at least one 500-year flood during the life of a 30-year mortgage is 6 percent, using the same calculation as described for the 100-year flood zone. FEMA does use shaded Zone X to represent some 1 percent annual probability events such as areas of shallow flooding and, in some instances, areas behind levees.
-
Unshaded Zone X: this zone is predicted to be outside the 0.2 percent zone or in an area that is expected to flood less than once in 500 years. In some areas, streams are within an unshaded Zone X if the existing flood risk is very small. In these areas, the actual risk is not zero but does not reach the level at which FEMA requires an engineering analysis (see Section 3.2).
-
Base Flood Elevations (BFEs): these are lines on the map that represent the 1 percent annual chance flood elevations. BFEs are used to replicate the flood profile that is contained within the FIS narrative and are used by stakeholders as a general guide for building elevations near or within the 1 percent floodplain. Typically, the first floor elevation of such buildings should be above the BFE.
Within the FEMA community, the 1 percent area is often referred to as “the floodplain” or the flood hazard zone because almost all floodplain regulations are in reference to the 1 percent chance flood. In reality, the floodplain is marked by any event that exceeds the channel banks of the flooding source. The analysis to determine the floodplain is based upon hydrology and hydraulics. In general, hydrology is used to determine the amount of water flowing in a flooding source, while hydraulics is used to determine how deep the water will become with a certain amount of flow. The floodway in Figure 3.2 is an area defined within the 1 percent floodplain that carries most of the water flow and has the highest water velocities. Within this area, development is restricted so that the increase in flood heights caused directly by development in the floodplain is limited and the likelihood of loss of life
or property is minimized in the event of a flood. A schematic diagram with a cross section of the floodway is shown in Box 3.1.
3.2
FEMA ENGINEERING STUDY TYPES
FEMA has several types of engineering study approaches, each with a different set of input data, the most basic of which are elevation data. Accurate elevation data are a key element
|
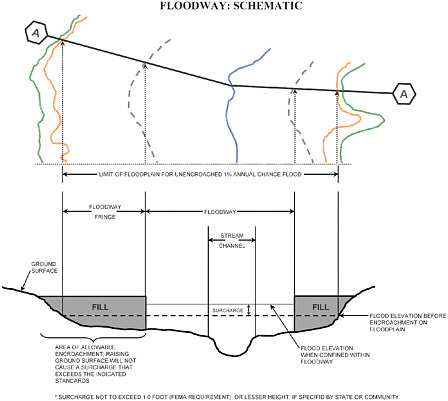
BOX 3.1 The Floodway The floodway map (below) shows the areal extent of a river or stream channel and the flood boundaries (upper panel) and the cross section of the river channel (lower diagram, drawn between two “A” points in the upper panel) from which the floodway is calculated. In the upper panel, the green line represents the 0.2 percent annual recurrence interval flood, the orange line represents the 1 percent annual recurrence interval flood, the blue line is the stream centerline, and the dashed lines represent the floodway. In the lower panel, the cross section of the river channel is obtained from a combination of available elevation data, derived from both remote data collection (e.g., digital data collection) and field leveling surveys. Floodplain encroachment by intense land development is computed on the cross section by simulating fill on the left and right overbanks. The artificial fill has the effect of reducing the size of the floodway. The floodway limits are set when one of the following conditions occurs: (1) the vertical increment target threshold is reached (the national maximum vertical increment limit is 1 foot, but many states have lower limits); (2) hazardous velocities are achieved; or (3) the floodway encroachment line reaches the channel bank (the minimum floodway width is from channel bank to channel bank). |
to producing an accurate flood map. As shown in Box 3.2, flood maps play a significant role in establishing the true flood hazard for property owners and determining whether flood insurance is needed. New FEMA engineering studies produce more accurate flood maps and allow reevaluation of property locations relative to the floodplain. The study types include the approximate study, the limited detailed study, and the detailed study. The major differences between the engineering study approaches are the amount of information used in the study process and the desired accuracy of the results.
|
BOX 3.2 FEMA Letter of Map Changes The federal government requires any federally backed mortgage that has a structure within the 1 percent annual recurrence interval floodplain to purchase flood insurance. When errors in FEMA’s map boundaries or analysis are discovered, FEMA has a process that allows errors to be fixed with a Letter of Map Change. FEMA has two types of map changes, Letters of Map Revision (LOMR) and Letters of Map Amendment (LOMA). LOMAs are generally used when the floodplain boundary does not match the natural ground elevation data on the particular site. LOMRs are generally used when changes to the floodplain have occurred or when a new engineering analysis is performed. FEMA processes approximately 15,000 LOMA cases per year. If higher-accuracy ground elevation data are available to FEMA when the floodplains are plotted, the number of LOMAs processed may be significantly reduced. LOMAs are typically initiated by the homeowner when it is believed the house lies above the expected elevation of the flood and the property owner wants to dispute the need to purchase flood insurance. To correct the problem, the property owner hires a land surveyor to make the measurements and submit the LOMA to FEMA. In the case where the floodplain is not mapped wide enough due to inaccurate mapping, the property owner typically is unaware of the true flood hazard. Although flood insurance is still available, the property owner may choose not to obtain adequate insurance because the owner’s structure appears to lie outside the (inaccurately mapped) flood boundary. Almost all homeowners’ insurance policies exclude flood coverage. Therefore, if a flood occurs and the property owner does not have flood insurance, the property owner has to pay all costs for reconstruction. Accurate flood maps are necessary to lessen the likelihood of property owner hardships. |
Semiautomated hydrologic, hydraulic, and mapping tools, coupled with digital elevation data, allow prediction of the floodplain limits, especially in lower-risk areas. If these tools are used without benefit of any field survey data, the study is an approximate study. If the tools are used with some data collected in the field—for example, sketches of bridges to determine the clear opening—the study is called a limited detailed study. Limited detailed analysis sometimes results in the publishing of the BFEs on the maps. The decision to place BFEs on a limited detailed study analysis is based on the desire of the community for the BFEs to be shown, plus the accuracy of the elevation data and the data on bridges, dams, and culverts that may impede flow on the flooding source. A study performed using these same tools and the same underlying map, with the addition of field-surveyed cross sections, field surveys of bridges, culverts, and dams, along with a more rigorous analysis including products such as floodways, new calibrations for hydrologic and hydraulic models, and the
modeling of additional frequencies, is a detailed study. Detailed studies provide BFE information and flood profiles and usually a floodway, whereas approximate studies do not.
FEMA assembles cost information for the various study types. In 2006, the average cost for a detailed study was $20,000 per stream mile; for a limited detailed study, $1,500 per stream mile; and for an approximate study, $500 per stream mile. These costs do not include the acquisition of new elevation data other than field surveys of cross sections and hydraulic structures.
Figure 3.3 provides a comparison between a limited detailed study and a detailed study hydraulic model cross section illustrating how the underwater channel geometry is approximated as a simple trapezoid determined by drainage area relationships. The detailed study uses land survey techniques to define the channel more precisely. The land elevation and the underwater channel geometries may be derived from different types of elevation data.
In parts of the country where flood risks have not changed significantly since the date of the hazard analysis of an existing FIRM, FEMA provides an alternative flood study method involving the redelineation of effective detailed study data using updated digital elevation data. This simply involves the transfer of effective BFEs to the current land surface and results in a floodplain fit to existing terrain conditions (Figure 3.4).
Redelineation is an extremely effective approach from a cost and schedule standpoint because new engineering analyses are not required, and since the BFEs have not changed, no appeal period exists when the maps are issued. The savings of using existing engineering analyses, when valid, compared to new engineering analysis is between 200 and more than 1,000 percent and results in the product being delivered in a few days as opposed to several months. While all detailed studies will eventually be revised across the nation as the flood hazard data under predict the actual hazard due to factors including watershed and floodplain development, redelineation studies offer a reasonable interim compromise for refining the lateral extent of mapped floodplains to match existing land conditions and converting these data to a digital format.
Digitization is the simplest method of converting paper map data to a digital format, but it is the least accurate. Digitizing two-dimensional floodplain boundaries from a paper map to create a digital map layer does not account for horizontal misalignment on older maps or new elevation data as redelineation does, and the resulting flood boundaries may not agree with the digital elevation data. Since 2005, FEMA has discouraged the use of digitization in the Flood Map Modernization program because the resulting product will usually not meet the “Guidelines and Specifications for Flood Hazard Mapping Partners” (FEMA, 2003) or the terms of the Procedure Memorandum (FEMA, 2006a) . Subsidence, a gradual settling or sudden sinking of the earth’s surface owing to subsurface movement of earth materials, occurs in many areas of the United States and is an example of a particular challenge in converting old data to meet the requirements for Flood Map Modernization (Box 3.3).
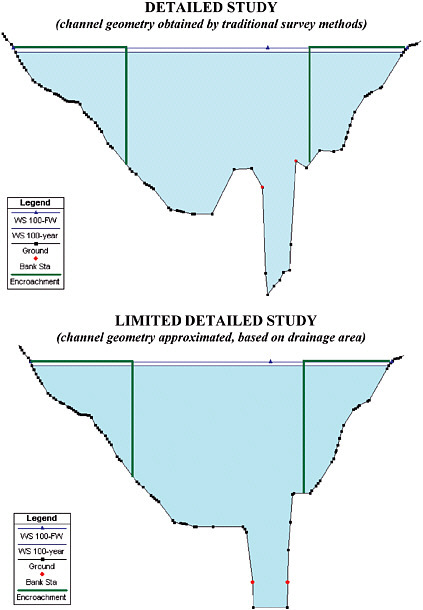
FIGURE 3.3 Comparison between a detailed and a limited detailed study. A detailed study includes field-surveyed cross sections and field surveys of bridges, culverts, and dams. A limited detailed study does not include as much field survey data. Both types of studies include the 1 percent annual probability event and may also include floodways and profiles, although these are optional for a limited detailed study.
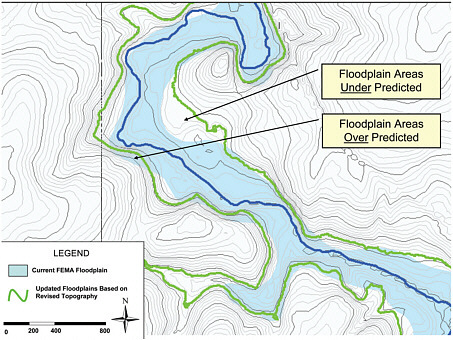
FIGURE 3.4 Redelineation study example. This type of study is provided by FEMA in cases where flood risks have not changed significantly since the date of the hazard analysis. This involves transfer of effective BFEs to the current land surface. The BFEs were intentionally left off the figure to show the differences in the plotted flood boundary, but all of the original information including BFEs would normally be shown on the new map.
3.3
FLOOD INSURANCE
Flood insurance is mandatory for the homeowner if the homeowner has a federally backed mortgage and is within the 1 percent annual chance floodplain (100-year flood) as determined by the FIRMs. This determination is typically performed at the closing of the home sale by a flood insurance determination company for the lender. These determination companies have sophisticated systems and databases that allow a quick determination for mandatory purchase for a minimal fee—typically between $15 and $25 at closing. In addition, all lending institutions must review their portfolios whenever a FIRM change is issued to determine if flood insurance should now be required for a particular mortgage.
If flood insurance is purchased, because of either mandatory requirements or voluntary actions, then the premium is determined. Determination of the actual premium is
complicated and unique to the structure and community. The information provided within this section gives a general overview for the purpose of this study.
Currently, if the property is not within the 1 percent annual chance flood area (100-year boundary) as determined on the FIRM, then one rate is assessed. No distinction is made if the property is within, outside, or above the 0.2 percent annual chance flood area (500-year boundary, all unshaded areas on the FIRM).
If the property is within the 1 percent annual chance flood area, then the rates are determined differently if the property is within an approximate zone or a detailed zone. An approximate zone does not show any flood elevations to the user of the maps. In these areas, FEMA typically charges a rate for flood insurance that is based on the difference of the elevation of the first finished floor and the highest adjacent grade without an estimated BFE. The premium rates based on an estimated BFE are lower than a property without an estimated BFE. The estimated BFE can be computed by the local community, a licensed engineer, or in some cases, the local, state, or federal agency.
Within a detailed zone, FEMA does publish the flood elevation, and the flood premiums are related to the lowest finished floor of the structure with respect to the 1 percent annual chance flood elevation at that particular structure. The lowest finished floor is simple if the structure is built as a slab on grade. In this instance the lowest finished floor is the same as first floor of the structure. The determination of the first finished floor is more complicated for structures that have basements or crawl spaces or are elevated such as areas near the coast. For instance, if a structure has a finished basement, then the premiums are based on the difference between the 1 percent annual chance flood elevation and the elevation of the basement, not the first floor of the structure. In areas with elevated structures, if a property owner encloses the bottom area, this could become the lowest finished floor of the structure. Premiums for structures built below the 1 percent annual chance flood are significantly higher than those built at or above the 1 percent annual chance flood. For example, for one type of structure, if the first floor elevation was built at the same elevation as the 1 percent annual chance flood, then the cost for $100 of coverage would be $1.19 (FEMA, 2006b, p. 4). However if the finished first floor was 3 feet above the 1 percent annual chance flood, then the premium would drop to $0.24 and if the structure was 1 foot below, the rate would increase to $3.00. FEMA does allow some grandfathering of premiums based on when the structure was built and if flood insurance was previously purchased within a certain period of time compared to the current FIRM. FEMA also has established a voluntary community-based program entitled “Community Rating System” (CRS). Participation CRS encourages good floodplain management and can reduce premiums by up to 45 percent depending on the level of participation by the community.
Several problems occur under the current system. First, FEMA has not mapped all of the flood hazards within the nation. Therefore, even if the FIRM does not indicate 1 percent
flooding, the area may not, in fact, have been mapped because it was determined by FEMA to be in a low-risk area that did not justify the expense of a map. Second, FEMA uses the 1 percent chance annual flood for the standard for mapping and insurance. When a storm of higher magnitude is experienced within the area, uninsured flood losses may result. Third, if the property owner does not have a loan that is backed by the federal government or if the property has no mortgage, then the decision to purchase flood insurance is at the sole discretion of the property owner. This last case can create great hardship when a disaster occurs. This was recently highlighted after Hurricane Katrina in which some homes that had been in families for several generations had no mortgage, and the property owner decided not to purchase flood insurance.
3.4
FEMA’S MAP INVENTORY
FEMA produces and maintains a very large number of maps across the country. FEMA’s map inventory has traditionally been based on a count of the number of map panels produced. A “map panel” is a representation of a geographic area that depicts flood risk information as well as basic features such as the road network and community boundaries. Prior to Flood Map Modernization, approximately 100,000 maps were required to cover most flood-prone lands in the nation. A single map would cover between 5 and 80 square miles depending on the map scale. Two typical map panels are shown in Figure 3.5.
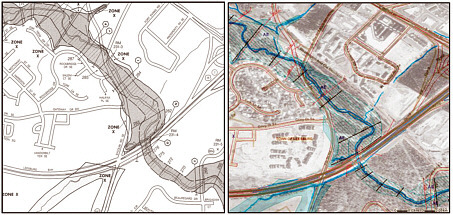
FIGURE 3.5 Comparison between paper and digital FEMA map panels (FEMA, 2006c). The left panel shows an older, paper map; the right panel shows a digital version of the same area.
The higher level of detail and accuracy available with digital mapping techniques is enabling FEMA to shift to the use of stream miles (including shoreline miles for the open ocean, lakes, and ponds), rather than map panels, as a measure of progress under Flood Map Modernization. The number of stream and coastal miles in the nation is virtually fixed and thus provides a standard against which progress can be measured. As of June 30, 2006, FEMA had mapped flood risk associated with 49 percent of the nation’s population, with 23 percent of the stream and coastal miles meeting the floodplain boundary standard in the form of preliminary maps for the local communities (FEMA Multi-year Flood Hazard and Identification Plan [MHIP], version 2.0, http://www.fema.gov/plan/prevent/fhm/dl_mhip.shtm). Using stream and coastal miles rather than map panels also allows identification of specific reaches that may need new or updated study. Further, using stream or coastal miles permits more precise identification of areas in need of additional attention, such as the incorporation of new flood data or a review of the mapping standards being applied along a particular reach of stream.
Full digital flood map coverage of those portions of the nation that face some flood risk will eventually range between 1 million and 2.9 million stream miles depending on the risk ranking of an area in order to justify the expense of the engineering analysis and mapping. The total number of stream miles for the nation includes approximately 4.2 million miles of channels and coastline in the United States (as defined on the 1:100,000-scale National Hydrography Dataset). Of these, about 1.3 million miles lie within federal lands (such as national parks and military bases). FEMA has very few miles of inventory within federal lands. Of the remaining 2.9 million miles that are or could be subject to some degree of flood risk to property due to development, there are approximately 247,000 miles of streams with flood hazards identified by detailed study methods and approximately 745,000 miles of streams identified by approximate study methods (FEMA, 2006d). These mile totals are based on FEMA’s inventory as of June 30, 2005.
3.5
FEMA’S PROCESSES AND PROCEDURES—1972 TO 2002
FEMA created the vast majority of its inventory with manual methods prior to the personal computer revolution. Most of the early flood maps were produced using simple, quick techniques. The best available elevation data, often contours from a U.S. Geological Survey (USGS) topographic quadrangle, were used and the limits of flooding were mapped based on an estimated height above the bank of the river or stream.
The fundamental and most widely used mapping product is the FIRM. These maps are prepared using hydraulic modeling that relies on elevation data (see Chapter 2). Maps and FIS reports that were created prior to Flood Map Modernization are available from FEMA via the Internet at the Map Service Center (http://msc.fema.gov); however, the supporting technical data—hydrologic and hydraulic models and, especially, survey and
elevation data—are generally difficult to reuse either because they are older, analog products that are difficult to convert to digital products or because they are difficult to locate because there were not archived consistently with the particular flood study with which they were associated. This difficulty in retrieving supporting data makes it difficult to build on past studies when updating these older maps.
3.6
FEMA’S PROCESSES AND PROCEDURES—2002 TO 2006 FLOOD MAP MODERNIZATION
In 2002, FEMA changed its mapping process based on guidance and funding supplied by Congress. Flood Map Modernization uses digital technology to provide better flood hazard maps and data and to compile a digital archive of the resulting materials.
One of the major changes FEMA made was to move to a digital mapping environment. Digital maps provide benefits in addition to accuracy: they are easier to use and maintain and should be less expensive to update than manually produced cartographic maps. They afford a uniform structure for digital flood data for the nation, support multihazard mapping activities, and provide greater utility for local planning and hazard analyses (FEMA, 2005). Compared to paper maps, digital maps offer several benefits (FEMA, 2006e):
-
Communities are provided with a more comprehensive base map because many more roads and other features are shown than on paper maps.
-
The map can be updated easily by adding or removing data without having to change all of the other elements in the map. For example, if the street system of a growing community is expanded, the new street data can be inserted into the digital map without the time and expense of recreating the other map information.
-
Map data and the output from engineering flood analysis models can be communicated electronically, which makes data transfer more efficient and more accurate.
-
Updated elevation data can be used to revise floodplain boundaries to more closely match the land surface.
-
Information can be stored in an electronic data archive rather than in a warehouse, thereby facilitating storage, retrieval, and version control and eliminating the deterioration that is inevitable with paper products.
-
Maps and supporting data can be shared via the Internet.
-
The costs of maintenance and update are reduced. This advantage is extremely important because flood risk is continually changing as the nation’s watersheds are developed and the land surface is transformed into a more urbanized setting. Floodplain maps must be updated periodically to reflect changing flood risks.
-
The digital system allows FEMA to delegate portions of the mapmaking processes more easily to its state and local partners.
3.7
CREATION OF FEMA’S FIVE-YEAR PLAN—MHIP
Through Flood Map Modernization, FEMA intends to provide reliable digital flood hazard data and maps for the United States to support the National Flood Insurance Program (NFIP). The Multi-year Flood Hazard Identification Plan details FEMA’s five-year plan for providing updated digital flood hazard data and maps for areas with flood risk. The completion of flood map updates extends to 2010 (FEMA, 2005).
The MHIP provides detailed tables and graphs of projected flood map production sequencing and projected funding allocations at the county level. The MHIP also includes a summary of input provided through the business plans and FEMA’s next steps to enhance map quality. Table 3.1 shows the current and projected status of Flood Map Modernization. Typically, between six months and one year passes from the time the preliminary maps are made available to the community until the maps become effective. However, local communities will start to use the preliminary maps for floodplain management decisions when they are received. The maps usually become “effective” for insurance purposes after a set time period designed to allow communities time to formally adopt the map and update their zoning ordinances.
Map quality is directly related to the different types of engineering studies that are used to update flood maps; each type of study represents a trade-off between detail and cost. In general, more complex studies take more time and effort and cost more than simple studies. Recognizing this variability, the Government Accountability Office (GAO) recommended that FEMA “develop and implement data standards that will enable FEMA, its contractor[s], and its state and local partners to identify and use consistent data collection and analysis methods for developing maps for communities with similar flood risk” (GAO, 2005, p. 4-5).
The actual data collection and analysis are funded either by FEMA, by the state or local community, or by some combination of these.
Additionally, while the quality of the final digital products will be superior to that of older paper maps, stakeholders have clearly expressed concerns that simply digitizing the existing maps will not result in reliable products. Ensuring a high level of quality for all studies is critical for Flood Map Modernization. Therefore a key function of the MHIP has been to provide documentation on new standards and procedures initiated under Flood Map Modernization that will lead to improved map quality. The MHIP also provides a summary of cost-savings processes, procedures, and tools and describes a geospatial data coordination policy and plan to ensure that FEMA discovers the best available elevation data and base map data, and that geospatial data collected by FEMA: (1) do not duplicate existing public holdings, (2) are documented, and (3) are made widely available.
3.8
FEMA’S METHOD FOR RISK DETERMINATION AND MAPPING PRIORITIZATION
FEMA has developed a geographic information system (GIS) based analysis to rank the relative flood risk of each U.S. Census block group across the entire nation. This National Flood Risk analysis is intended to assist both FEMA and local authorities in prioritizing regional flood study mapping projects at the sub-county level.
Previously, FEMA regions had scheduled flood study projects based on local knowledge of the community. FEMA developed the new GIS-based analysis method to be used along with knowledge of the local needs as a ranking, prioritization, or “sequencing” process for use in prioritizing mapping projects. The GIS-based approach allows localized information to be analyzed and compared at a national level.
Three elements are significant in the refined approach: (1) the data are analyzed at the Census block group level, versus the county level, to allow for greater precision with regard to spatial location; (2) the decision-making process emphasizes the use of geospatial data using GIS, versus sole reliance on tabular county data, to enable the spatial identification of areas in the nation for flood mapping needs; and (3) the risk parameters are refined to better represent the broad characteristics of flood risk that affect people and local economies as well as property. Prior to 2006, FEMA utilized a summary of risk parameters within the county without respect to the actual flooding sources. By switching to the Census block group analysis, the results are better correlated with the localized flooding sources to compute the risk.
The primary objective of the National Flood Risk analysis is to estimate a relative flood risk value for each of the 211,684 Census block groups in the nation. This risk value provides a more robust basis to improve the detail and precision so that FEMA can make sound decisions on mapping priorities at the regional, state, and local levels. Block groups
provide a higher geographic resolution than counties and Census tracts, but they are more manageable than individual Census blocks. A supporting objective involving the preparation of the data was to develop an unbiased and standardized methodology to assess flood risk, with the underlying objective to determine which areas of the country should be given the highest priority in receiving modernized maps.
The FEMA prioritization of higher-risk Census block group areas for flood mapping will provide FEMA regions the option of not completing the low-risk areas and focusing available funding on the more risk-prone areas in their regions. This approach is a change from FEMA’s prior objectives that included mapping the entire nation, but it has the benefit of responding to congressional and local concerns that FEMA concentrate on areas of greatest benefit.
Ten “risk factors” were estimated for each Census block group by dividing the parameter value for that group by the total value of the parameters for all Census block groups in the nation. The risk factors are all weighted equally in the equation. The 10 risk factors are presented as a relative percentage value for each Census block group, including the following:
-
2000 population
-
Population change, 1980-2000
-
Housing units
-
NFIP policies
-
NFIP claims
-
Repetitive loss claims
-
Repetitive loss properties
-
Federally declared flood disasters
-
Predicted population growth to 2010
-
Length of stream or coasts on nonfederal lands (some minor amount of mapping does occur on federal lands)
The mapping involved a significant effort to retrieve and correlate spatial data from a variety of databases and to check the coverage and quality of those data. The data were then analyzed to establish quantitative estimates of each parameter for each Census block group. A risk rating, or factor, was assigned to each Census block group as a percentage of the sum of the 10 spatial risk parameters. Figure 3.6 shows the results of this effort and provides a breakdown of flood risk in selected ranges, where the highest-risk areas are associated with the top 25 percent of the data and are identified in a purple color. As can be seen from this figure, the highest-risk areas of the nation are near the coastline, with particular risk in the Gulf and southern Atlantic coasts as well as the lower, central, and northwestern areas of the Pacific coast. This risk is summarized by FEMA’s 10 regions in Figure 3.7. The figure shows that FEMA Regions 4 and 6 have the majority of the risk in the nation.
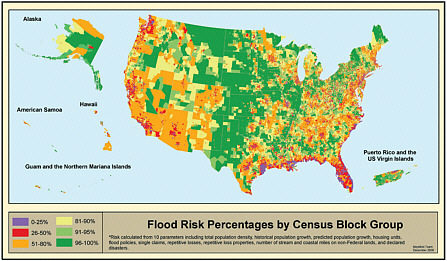
FIGURE 3.6 National flood risk by Census block group. SOURCE: MHIP version 2.0, Figure 3.1, Chapter 3; http://www.fema.gov/plan/prevent/fhm/dl_mhip.shtm.
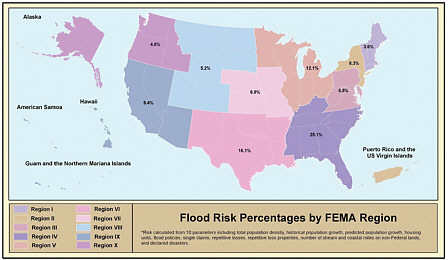
FIGURE 3.7 National flood risk percentages by FEMA region. The Gulf coast states have the highest flood risk percentages in the country. FEMA regions are shown by color, and flood risk percentages are shown on the map.
3.9
FEMA MAP QUALITY STANDARDS
After Flood Map Modernization began, Congress, the GAO, and Flood Map Modernization’s stakeholders, expressed concern that some of the mapped flood risk zone boundaries that were planned to be digitally transferred would not adequately reflect the true flood boundary. This concern was due to two changes in the characteristics of the mapping process. First, in the paper mapmaking process, horizontal distortions of one map layer relative to others occur, and these can be corrected in the digital environment. Second, in the digital environment, it is possible for a mapping specialist to compare other data layers such as photos, elevation data, and base maps to ensure that the transferred floodplain boundary is adequately positioned to provide a “best fit” to the ground condition. This step of matching the floodplain boundary to the elevation data, while certainly a good practice, was not a specified standard prior to 2005.
At the end of FEMA’s Map Modernization initiative, when the maps become effective, digital flood maps will cover 92 percent of the population of the United States and 65 percent of its land area. Overall, 75 percent of the mapped stream miles within the Map Modernization initiative will meet the 2005 Floodplain Boundary Standard, specified in Table 3.2, meaning that the floodplain boundaries on the maps are drawn consistently with the best available elevation data.
TABLE 3.2 Risk Classes of Flood Insurance Rate Maps
|
Risk Class |
Characteristics |
Typically Achieved by |
Delineation Reliability of the Flood Boundarya |
|
A |
High populations and densities within the floodplain; high anticipated growth |
Zones AE, VE, AO, AH |
±0.5 foot/95% |
|
B |
Medium populations and densities within the floodplain; modest anticipated growth |
Zones A and AE |
±1.0 foot/95% |
|
C |
Low populations and densities within the floodplain; small or no anticipated growth |
Zones A and AE |
±½ contour interval/90%b |
|
D |
Undetermined risk; likely subject to flooding |
Zone D |
N/A |
|
E |
Minimal risk of flooding; area not studied |
(area not mapped) |
N/A |
|
aThe difference between the ground elevation (defined from topographic data) and the computed flood elevation. bThis number is taken from FEMA’s policy memorandum and was adopted to make the requirement more achievable for lower-risk areas. SOURCE: FEMA, 2004. |
|||
In a March 31, 2004, GAO review of the Flood Map Modernization program, the GAO recommended that FEMA use its resources more effectively by defining the level of data collection and types of analyses associated with different levels of flood risk; that is, the need for extensive data and highly detailed methods may be appropriate for areas with significant flood risk, while more approximate methods may be reasonable for areas with a lower risk of flooding (GAO, 2004). To do this, FEMA has associated the traditional mapping zones with a new classification of flood risk that considers population density and anticipated growth in flood-prone areas (Table 3.2). This risk classification is slightly different from that discussed in the previous section.
Based on the risk class determined for each flooding source, varying methods of analysis can be employed in a flood study. Within the table, zones that begin with A refer to different areas of the annual 1 percent chance flood, and zones that begin with V refer to areas of the 1 percent annual chance flood where waves of greater than 3 feet exist. FEMA has not quantified how many stream or coastal miles are within each risk class.
The objective of these changes is to develop flood hazard data that better relate the level of effort for a flood study to the level of risk for each county. The guidance in Table 3.2 is being applied to all approximate, existing detailed, and new detailed studies for riverine and coastal flooding sources. In Table 3.2, the column that represents the delineation reliability of the flood boundary assesses only the accuracy of the plotted boundary in terms of the elevation data, not the accuracy of the elevation data themselves. For example, in risk class A, FEMA is not stating that the elevation accuracy must be 0.5 feet but rather that the plotted boundary agrees with the elevation data source within 0.5 feet 95 percent of the time. In this case, the actual accuracy of the elevation map may be equivalent to a 2- or a 4-foot contour interval map. This accuracy distinction is very important. The standard does not specify the accuracy of the elevation data but the precision with which the flood boundary has been mapped onto the available elevation surface.
3.10
FEMA’S CURRENT USE OF ELEVATION DATA
3.10.1
Elevation Data Accuracy Requirements and Elevation Data Collection Methods
Engineering modeling software and GIS have advanced dramatically in the past 5 to 10 years. These advances have revolutionized hydrologic and hydraulic modeling and floodplain mapping. Significant advances also have been made in elevation data acquisition, processing, and development. Airborne remote sensing technologies provide input elevation data to engineering models that generate BFEs and additional digital information to support floodplain boundary mapping. In most cases, remotely sensed digital elevation information supports the determination of BFEs and the delineation of floodplain boundaries more efficiently than conventional, field-collected land survey data. The main components of a
flood study performed to define flood hazards include topographic data, survey methodology, and flood hazard identification techniques (modeling and mapping).
FEMA publishes guidelines and specifications for flood hazard mapping partners, among which is “Appendix A: Guidance for Aerial Mapping and Surveying” (FEMA, 2003). This document is very important because it describes the technical standards for base mapping for DFIRM development. With respect to elevation data, Appendix A states (FEMA, 2003, p. A-5):
FEMA has reduced the complex requirements to two standard choices for digital elevation data, expressed as equivalent contour intervals:
-
Two-foot equivalent contour interval for flat terrain (Accuracyz = 1.2 feet at the 95 percent confidence level). This means that 95 percent of the elevations in the dataset will have an error with respect to true ground elevation that is equal to or smaller than 1.2 feet.
-
Four-foot equivalent contour interval for rolling to hilly terrain (Accuracyz = 2.4 feet at the 95 percent confidence level). This means that 95 percent of the elevations in the dataset will have an error with respect to true ground elevation that is equal to or smaller than 2.4 feet.
The FEMA Lead for a Flood Map Project … may select non-standard alternatives when valid and compelling reasons for specifying other accuracy standards exist.
As presented in Chapter 5 of this report, the committee concludes that the nation needs additional accuracy to a 1-foot equivalent contour interval in very flat areas of coastal terrain subject to hurricane storm surge and for inland floodplain analysis on very flat terrain. In this report, the committee has standardized on reporting vertical accuracy in terms of root mean square error (RMSE) of the measured values, as discussed further in Chapter 4 (see Section 4.1.3). The acceptable RMSE errors for these elevation data are 0.30 foot, or 9.25 centimeters, for 1-foot equivalent contour accuracy data; 0.61 foot, or 18.5 centimeters, for 2-foot equivalent contour accuracy data; and 1.22 feet, or 37.0 centimeters, for 4-foot equivalent contour accuracy data. The report shows later that the National Elevation Dataset (NED) has an overall RMSE about 10 times greater than these values, although existing digital elevation model (DEM) coverage in many areas of the country is of significantly better quality. The USGS has developed the NED as a compilation of the nationwide coverage of these DEMs. DEMs are explored in detail in Section 3.12. The USGS NED is discussed in detail in Chapter 5.
The FEMA Guidelines and Specifications for Flood Hazard Mapping Partners define the acceptable currency of floodplain maps: “The National Flood Insurance Reform Act of 1994 mandates that at least once every 5 years FEMA assess the need to revise and update all floodplain areas and flood risk zones” (FEMA, 2002b, p. 1-10). These specifications also define the acceptable currency of the base map data used in flood map revisions: “The data must have been created or reviewed for update needs within the last 7 years” (FEMA, 2002b, p. 1-77). As discussed later in the report, the elevation data in the NED are, on average, more than 35 years old.
Elevation data generally can be collected using airborne remote sensing technologies such as lidar (light detection and ranging) and interferometric synthetic aperture radar (IFSAR), via photogrammetric techniques, with satellites, or by using conventional land surveying techniques. The applicability of each technique tends to vary with terrain type, and most elevation data collection projects use a combination of techniques to fully define floodplain geometry and other characteristics. In general, the committee has observed the following trends in the methods used by commercial companies conducting these studies:
-
Traditional field surveys yield the highest accuracy but at the highest cost.
-
Traditional photogrammetry yields good results for a medium cost.
-
Lidar yields good results in all terrain settings for a low cost if the project is a large area (greater than 400 square miles).
-
IFSAR yields good first surface results at a very low cost but cannot be used in areas of dense vegetation.
Traditional field surveys are not described in detail because of the high cost of data acquisition. The latter three methods are described in detail in Chapter 4. Whatever method is used, it is extremely critical that a bare-earth digital elevation surface be the final product. The term “bare earth” refers to a digital elevation surface from which all buildings and vegetation have been removed. This distinction is important since the engineering principles and equations utilized in the analyses assume this condition in addition to obtaining an accurate map of the final inundation of the flood. For example, if the following condition existed: Elevation of top of the tree or building is 90 feet, elevation of the ground at the tree or building is 65 feet, and the elevation of the flood at this location is 70 feet. If the flood elevation (70 feet) is mapped according to the top of the vegetation or building (90 feet), it would show that the area near the tree or building would not be flooded; however, if the ground elevation (65 feet) is used, then the tree or building will be shown within the flood boundary.
FEMA’s decision to publish BFEs, the existence of which makes the difference between an approximate study and a detailed study, depends on the reliability of predicted and mapped BFEs. Many factors affect BFE reliability; the major factor is the quality of the
input data used in the riverine or coastal hydraulic models. Based on the risk class determined for each flooding source (Table 3.2), varying methods of analysis can be employed. The methods chosen for each component of the study should be mutually compatible to achieve overall reliability. Investment in detailed methods for some components of a study should not unduly shortchange the effort applied to other components. The significance of elevation data quality and its effect on BFE reliability are described below.
In general, the value of any hydraulic model is highly dependent on the quality of elevation data and other data used to generate the model. Conventional detailed studies contain a combination of data taken from elevation maps along with detailed field survey data for the cross sections and hydraulic structures. Elevation field surveys are among the more costly components of a detailed study, and the development of accurate elevation maps also can be costly. However, ground elevation information has a multitude of other uses and often is already available. FEMA encourages NFIP communities to provide elevation data that they have collected independently of FEMA to enhance the spatial delineation of the flood boundaries and reduce the cost of flood studies to taxpayers. For most cases, FEMA does not fund large-scale elevation mapping efforts.
The best available elevation information should be used for both approximate and detailed study modeling. These elevation data can include any of the following:
-
Conventional elevation data (spot elevations and breaklines),
-
Contours (lines of equal elevation),
-
Lidar,
-
IFSAR (in selected areas of sparse vegetation),
-
USGS 30-meter digital elevation models (primarily for hydrology),
-
USGS 7.5-minute quadrangle maps, and
-
Field survey data.
Table 3.3 lists the general suitability of elevation data for flood hazard identification purposes (FEMA, 2004). The detailed terrain data listed in the table can be acquired with traditional photogrammetry (which will yield spot elevations, breaklines, contours), lidar, and IFSAR methods. The methodologies, products, and applicability of these methods of elevation data collection to different areas of the nation for the purpose of generating floodplain maps are discussed in detail in Chapters 4 and 5.
In some cases, countywide, statewide, or regionwide elevation data will be available. Prior to a study, FEMA performs a comprehensive information search to identify the best available elevation data sources for use in the performance of the study.
TABLE 3.3 Suitability of Elevation Data Sources
|
Topographic Data Source |
Suitability |
||
|
Hydrology Suitability |
Hydraulics Suitability |
Mapping Suitability |
|
|
Field survey |
Generally not applicable for hydrology |
Acceptable for all risk classes (A-C) |
Acceptable for mapping at surveyed sections, but mapping will be interpolated between sections based on available topographic data between survey sections |
|
Detailed terrain |
Acceptable for all risk classes (A-C) |
Acceptable for all risk classes (A-C) |
Acceptable for all risk classes (A-C) |
|
USGS quadrangle maps (tagged vector contour information) |
Acceptable for all risk classes (A-C) |
Limited acceptability for risk classes A and B; acceptable for risk class C |
Limited acceptability for floodplain mapping for risk classes A and B; acceptable for risk class C |
|
30-m USGS DEMs |
Generally accepted for hydrologic modeling if hydro-enforced |
30-m DEMs may not be acceptable for hydraulic modeling; 10-m DEMs, if available, may be acceptablea for risk class C |
30-m DEMs, generally not acceptable for floodplain mapping; 10-m DEMs acceptable for risk class C |
|
a10-m DEM data currently exist for approximately 50% of the United States. SOURCE: FEMA, 2004. |
|||
3.11
BATHYMETRY
Bathymetry is the portion of the ground surface that is beneath the normal level of the water in a river, lake, or ocean. When 2-foot contours or better are used, FEMA sometimes allows the collection of bathymetry to be optional for riverine studies because the calculations used to determine the water surface elevation are primarily dependent on the ground surface above the normal water level.
3.12
MODELS FOR ELEVATION DATA
An elevation surface can be characterized in many ways depending on the interest and perspective of the user. The term elevation model has already been used in a generic sense; now it is necessary to assign meaning to a number of more technical terms used to distinguish the special ways in which digital elevation data are stored, modeled, and analyzed.
A DEM contains elevations at points arranged in a raster data structure, a regularly spaced x,y grid, where the intervals of Δx and Δy are normally in linear units (feet or meters) or geographic units (degrees or fractions of degrees of latitude or longitude). The z-values in a DEM represent the height of the terrain, relative to a specific vertical datum and void of vegetation or manmade structures such as buildings, bridges, or walls, et cetera. The elevation of lakes and rivers in a DEM implies the height of the water surface based on the elevation of the exposed shoreline. The observations, or direct measurements, of elevation that comprise the DEM are almost never actually captured on a regular grid; therefore, the elevation for any given point in the grid is normally interpolated from individual point observations. Linear features, such as streams, drainage ditches, ridges, and roads, are often lost in a DEM if the grid spacing is larger than the dimensions of the feature. Furthermore in a DEM, it is unlikely that the sharp edge of the feature will be represented correctly in the elevation model. The DEM is, however, an efficient data structure for storage, analysis, rendering, and visualization.
A USGS DEM fits the above description, with standard grid spacing of either 1 arc-second of latitude by 1 arc-second of longitude (30 meters by 30 meters), 1/3 arc-second of latitude by 1/3 arc-second of longitude (10 meters by 10 meters), or 1/9 arc-second of latitude by 1/9 arc-second of longitude (3 meters by 3 meters) (Figure 3.8). As mentioned previously, the USGS NED is a compilation of the nationwide coverage of these DEMs.
A digital terrain model (DTM) data structure is also made up of x,y points with z-values representing elevations, but unlike the DEM, these may be irregularly or randomly spaced mass points. Direct observations of elevation at a particular location can be incorporated without interpolation, and the density of points can be adjusted so as best to characterize the actual terrain. Fewer points can describe very flat or evenly sloping ground; more points can be captured to describe very complicated terrain. In addition to mass points, the DTM data structure often incorporates breaklines (further defined below) to retain abrupt linear features in the model. A DTM is considered technically superior to a DEM for most engineering analyses because it retains natural features of the terrain.
A digital surface model (DSM) includes features above the ground, such as buildings and vegetation, and is used to distinguish a bare-earth elevation model from a non-bare-earth elevation model. The term DSM is generally applied regardless of whether the data are in gridded or mass point format.
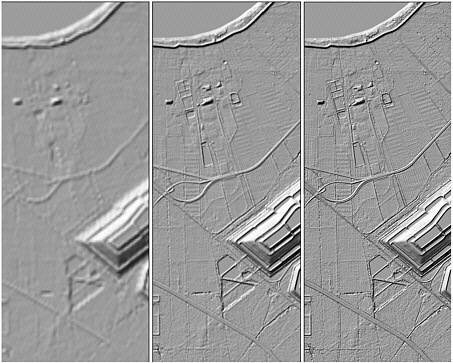
FIGURE 3.8 USGS DEM at three resolutions; 1 arc-second (30 meters), 1/3 arc-second (10 meters), and 1/9 arc-second (3 meters) from left to right. SOURCE: Maune, 2007. Reprinted with permission from the American Society for Photogrammetry and Remote Sensing.
A triangulated irregular network (TIN) represents terrain with adjacent, non-overlapping triangular surfaces. A TIN is a vector data structure generated from the mass points and breaklines in a DTM. TINs also preserve abrupt linear features and are excellent for calculations of slope, aspect, and surface area and for automated generation of topographic contours, which are all important functions to flood study engineering.
Breaklines are linear data structures that represent a distinct or abrupt change in the terrain. They comprise a series of vertices with z-values (elevations) attached. Breaklines contained in a DTM will be forced as edges in a TIN model.
Contours are isolines of elevation; they are the traditional method for representing a three-dimensional surface on a two-dimensional map. They are excellent for human interpretation, but inferior to DEMs, DTMs, and TINs for computer display and analysis. Historically, contours were drawn by hand and smoothed to produce a cartographically pleasing product. Now, automated methods for producing contours from TINs or DEMs
are available, but the final product contains no new information and adds little value to an engineering analysis. Many of the USGS DEMs in the NED were created by interpolating a raster of elevations from the archive of hand-drawn contours created for the 1:24,000-scale USGS topographic map series.
3.13
DEM VERSUS TIN MAPPING
Two common methods of automated floodplain mapping involve the use of TINs and regular grids (DEMs). Each method has its own set of advantages and disadvantages related to floodplain mapping. For most if not all applications, TINs are the most accurate method of modeling the surface of the earth.
Regular grids, commonly referred to as DEMs, are a readily available source of elevation data and are thus widely used. A grid is a very efficient means of storing data, since it generalizes the underlying topography for each grid into one discrete value. The data storage structure is very simple and is quite easy to use. Figure 3.9a shows a grid-based DEM.
The general procedure for mapping a water surface elevation on a DEM involves interpolating a water surface elevation for each grid and comparing that to the grid’s land surface elevation. If the water surface is higher, the grid is considered to be inundated. Figure 3.9b shows the floodplain mapped in gray onto the same DEM surface as Figure 3.9a.
TINs are another method of representing topography. TINs utilize points and breaklines to create a triangulated surface. The data storage format for TINs is more complex than that for DEMs, and the processing of TINs generally requires more complex planar geometry than the raster math involved with DEMs. One advantage of the TIN surface is that it utilizes all of the source elevation data; no generalization is required, so all elevation features that were measured are represented in the data model. Figure 3.9c shows a TIN-based surface, and Figure 3.9d shows the floodplain mapped onto the same surface. The additional degree of detail provided to floodplain mapping by using TINs rather than grids is seen by comparing Figures 3.9b and 3.9d. In addition to the two-dimensional or surface view, both grids and TINs can be viewed in perspective in three dimensions, as shown for the TIN in Figure 3.9e.
Floodplain mapping on a TIN surface involves complex calculations. First, a TIN is created based on the calculated water surface elevations. This TIN is then intersected with the ground TIN, and the intersection of the surfaces is the floodplain boundary. Because of the complex mathematics, the processing speed for the calculation is generally slow, but the results are closest to the true elevation without any further generalization.
Although there are advantages to using DEMs, they do come at a cost. Grids are a general representation of the source elevation data and therefore can miss important features that lie within the grid itself. The grid resolution also plays a large part in the quality
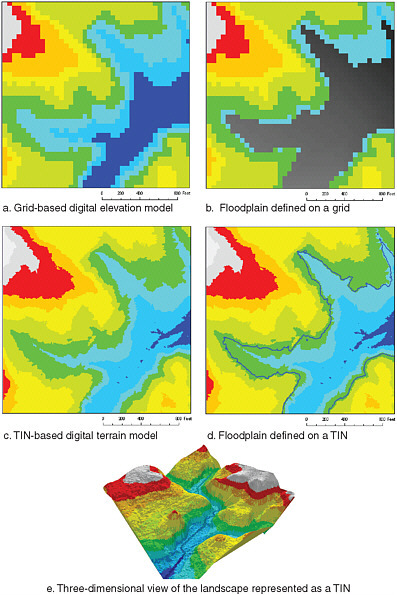
FIGURE 3.9 Comparisons between gridded DEM surfaces and two- and three-dimensional TIN surfaces that are part of the base for floodplain maps: (a) gridded DEM surface; (b) floodplain area (in gray) mapped on a gridded DEM surface; (c) two-dimensional TIN surface; (d) two-dimensional TIN floodplain; and (e) three-dimensional view of a TIN surface. The three-dimensional TIN surface requires the most computational time, but yields the product that most closely represents true elevation.
of a DEM. Selecting a larger grid size reduces file size and improves processing speed but increases the likelihood of missing important elevation features.
Since the NED is in the form of a gridded DEM and floodplain mapping is more appropriately carried out using TINs, as just described, one approach to generating TINs for floodplain mapping is to convert them from DEMs. However, a significant problem emerges when this is done. Since DEMs are “perfect” squares, two different triangulations can occur. This makes duplicating the results very difficult or impossible. Figure 3.10 shows four points of a DEM grid. If the TIN triangulation produces example 1, the midpoint elevation is 100; however if the TIN triangulation produces example 2, the midpoint elevation is 75. Therefore, the triangulation of DEMs should be avoided for use in floodplain mapping since results are difficult to reproduce.
In summary, the intersection of the computed water surface elevation with TINs creates the most accurate flood boundary and should be used whenever possible. When a DEM elevation source is known, the source data for the DEM should be used instead of the DEM itself for floodplain mapping. For example, if the USGS 10-meter DEMs are identified to be used for a portion of the study, the original Tagged Vector Contour files (TVCs) should be used since these were the source data for the DEMs. In addition, the triangulation of DEMs should be avoided.
3.14
HYDRO-ENFORCED STREAMLINES
As a part of the digital elevation data required for floodplain analysis, hydro-enforced streamlines greatly enhance the digital elevation data and increase the efficiency of the engineering analysis. Hydro-enforced streamlines follow the centerline of all streams and the edge of banklines along streams wider than a project-specific criterion (usually 40 feet). These hydro-enforced stream lines are used to create downhill-flowing stream channels in a generated TIN. Figure 3.11 shows the TIN created from lidar point data alone versus the enhanced TIN created by introducing hydro-enforced streamlines.
3.15
CHAPTER SUMMARY
The purpose of this chapter is to provide the fundamental concepts of FEMA’s Map Modernization program. The primary interface to communicate the risk of flooding to the general public is with the FEMA Digital Flood Insurance Rate Map. This map contains general information for the user: roads, streams, the 1 percent (100-year) and 0.2 percent (500-year) annual recurrence interval events, and the floodway.
FEMA has three types of engineering products—detailed study, limited, detailed study and approximate study—used to map the floodplain based on the assessed risk for the stream reach. Detailed studies are the most accurate but are also the most expensive. The
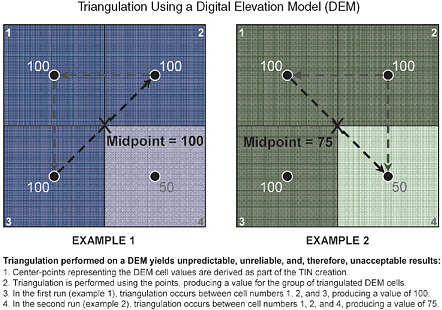
FIGURE 3.10 Inconsistencies experienced when triangulating DEMs.
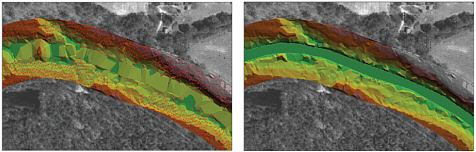
FIGURE 3.11 Impacts of hydro-enforced streamlines. Left: Without breaklines, the TIN, while correctly depicting the natural undulations along the shorelines, misleadingly models the river as though water will not flow through areas shown in yellow, orange, and red. Right: Breaklines for the shore and stream centerlines enforce the downstream flow of the water. SOURCE: Courtesy of EarthData International.
FEMA program maintains more than 100,000 map panels. The nation has approximately 4.2 million miles of streams and coastlines. Of this total inventory, FEMA has mapped approximately 1 million miles of floodplain. As development occurs, FEMA constantly has to update the existing floodplain maps and generate new maps for previously unstudied streams. The rate of re-study depends on how quickly development occurs within a watershed. Subsidence, the gradual settlement or sudden sinking of the earth’s surface caused by human development and natural causes, can create problems for the users of DFIRMs product. In areas of riverine flooding if the subsidence is widespread and uniform, the relative difference between the floodplain and the development is critical, and in areas of coastal flooding, the absolute elevation is critical. A large user of the DFIRMs is the insurance industry. The federal government requires any federally backed mortgage whose structure is within the 1 percent annual recurrence interval floodplain to purchase flood insurance. Accurate flood maps are necessary to lessen the likelihood of property owner hardships, and accurate elevation data are fundamental to generating an accurate flood map. The current Map Modernization program is performing a national update of the floodplains. This work is funded from 2004 to 2008, and the products will be available by 2010. This update will cover approximately 65 percent of the nation.
FEMA has ranked every area of the nation based on a risk analysis that incorporates 10 parameters. This risk ranking is used to prioritize where and when updates should occur within the nation. FEMA in 2005 adopted additional map quality standards specifying that the floodplain boundary must match the best available topographic data. The goal is that of the maps that become modernized, 75 percent of the streams and coastlines will meet this requirement.
For most cases, FEMA does not acquire digital elevation data during a floodplain study but usually relies on the best available information. Typically for high-population counties, the local government does have good elevation data, but in low-population areas, USGS 7.5-minute quadrangle maps are the best available elevation data.
The actual drawing of the floodplain boundary can occur by hand or with digital techniques using DEMs or TINs. The floodplains should be drawn based on the TINs since this will generally create the most accurate floodplain map.


