I
Proportion of the Population Above and Below 40 nmol/L Serum 25-Hydroxyvitamin D Concentrations and Cumulative Distribution of Serum 25-Hydroxyvitamin D Concentrations: United States and Canada
The data in this appendix are provided for the readers of this report and were not reviewed by the committee.
For the United States (Table I-1 and Figures I-1 through I-8), the tables and figures for serum 25-hydroxyvitamin D (25OHD) concentrations are from analyses conducted in August 2010 by the National Center for Health Statistics, U.S. Centers for Disease Control and Prevention and based on the National Health and Nutrition Examination Survey (NHANES) 2003–2006.
For Canada (Table I-2 and Figures I-9 through I-14), the tables and figures for serum 25OHD concentrations are from analyses conducted in August 2010 by Statistics Canada and based on the Canadian Health Measures Survey (CHMS), Cycle 1, 2007–2009.
PERSONS ABOVE AND BELOW 40 NMOL/L SERUM 25-HYDROXYVITAMIN D CONCENTRATIONS FROM NATIONAL SURVEYS
TABLE I-1 United States: Prevalence of Serum 25OHD Concentrations (QC adjusted) Above and Below 40 nmol/L by Total Population and by Race/Ethnicity (ages 1 year and older) from NHANES 2003–2006
|
|
Estimate (95% Confidence Interval) |
||||
|
Total |
Non-Hispanic White |
Non-Hispanic Black |
Mexican American |
Others |
|
|
Percent < 40 nmol/L |
18.8 (16.3–21.5) |
10.6 (8.9–12.4) |
53.6 (48.9–58.2) |
27.2 (22.8–32.0) |
27.2 (23.2–31.7) |
|
Percent ≥ 40 nmol/L |
81.2 (78.5–83.7) |
89.5 (87.6–91.1) |
46.4 (41.8–51.1) |
72.9 (68.0–77.2) |
72.8 (68.3–76.8) |
|
SOURCE: NHANES 2003–2006. |
|||||
TABLE I-2 Canada: Prevalence of Serum 25OHD Concentrations Above and Below 40 nmol/L in Canada by Total Population (ages 9 years and older) from CHMS, Cycle 1, 2007–2009
|
|
Estimate (95% Confidence Interval) |
|
Percent < 40 nmol/L |
13.0 (9.9, 16.1) |
|
Percent ≥ 40 nmol/L |
87.0 (83.9, 90.1) |
|
SOURCE: CHMS, Cycle 1, 2007–2009. |
|
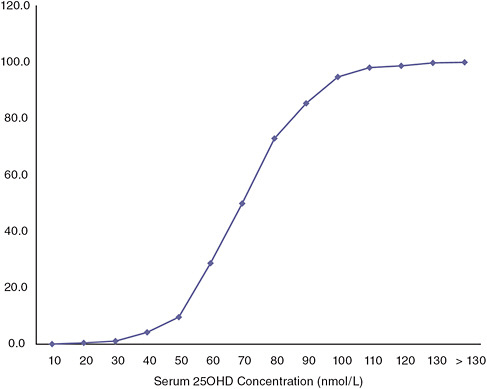
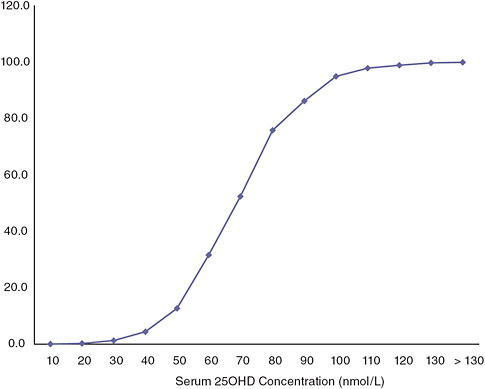
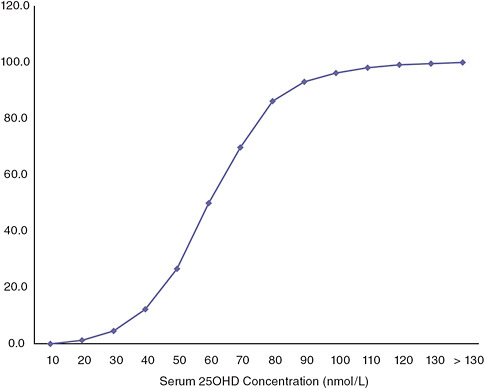
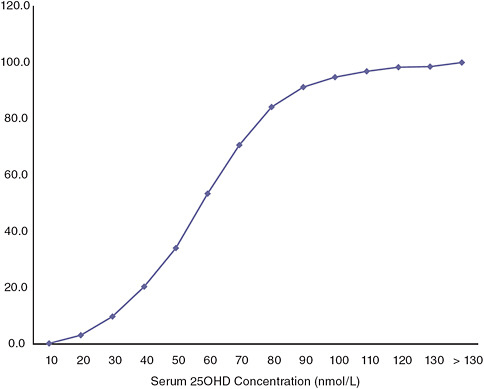
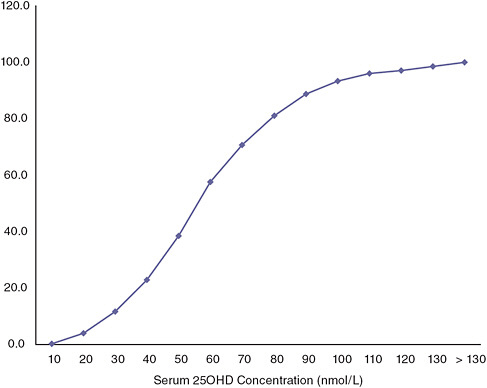
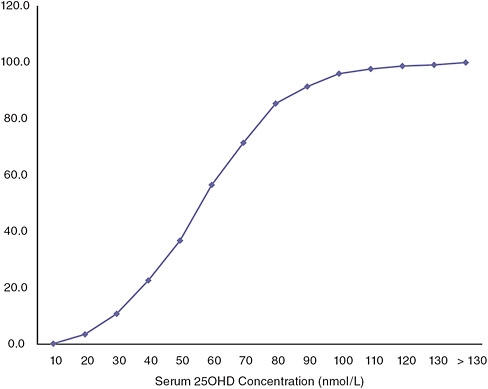
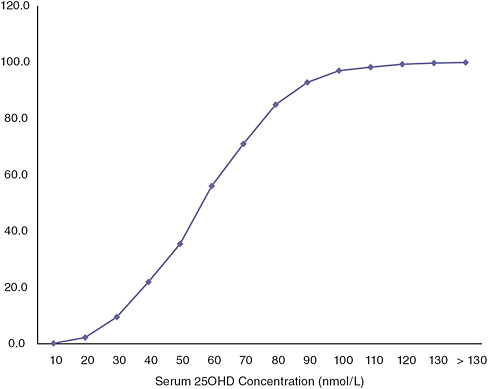
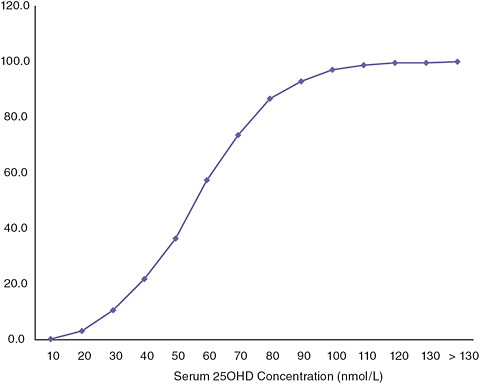
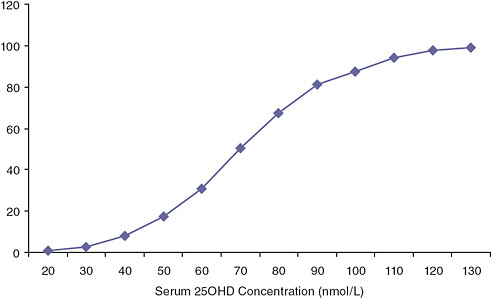
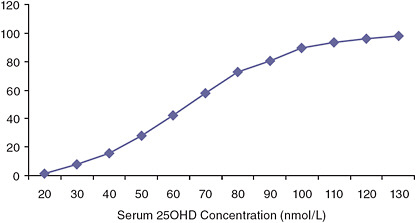
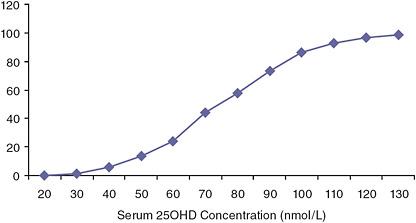
FIGURE I-10 Cumulative distribution of serum 25OHD for 14- to 18-year-olds in Canada for the 2007 to 2009 time period.
SOURCE: CHMS, Cycle 1, 2007–2009.
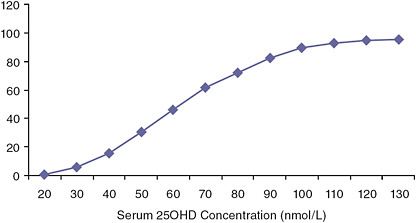
FIGURE I-11 Cumulative distribution of serum 25OHD for 19- to 30-year-olds in Canada for the 2007 to 2009 time period.
SOURCE: CHMS, Cycle 1, 2007–2009.
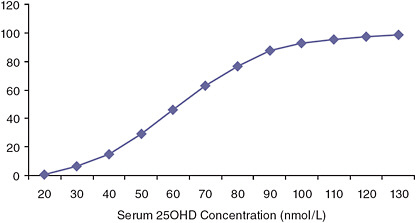
FIGURE I-12 Cumulative distribution of serum 25OHD for 31- to 50-year-olds in Canada for the 2007 to 2009 time period.
SOURCE: CHMS, Cycle 1, 2007–2009.
FIGURE I-13 Cumulative distribution of serum 25OHD for 51- to 70-year-olds in Canada for the 2007 to 2009 time period.
SOURCE: CHMS, Cycle 1, 2007–2009.