
6
Contextual Factors: Host, Diet/Environment, and Health Status
OVERVIEW
In session 3, moderated by Suzanne Murphy and John Muyonga, six speakers representing a wide geographic range discussed contextual factors related to host genetics and physiology, diet and environment, and health status. This chapter summarizes their presentations and the discussion that followed, with major points highlighted here and in Box 6-1.
To start the session, Patrick Stover stated that a number of physiological processes can be modified in ways that change what a nutrient requirement may or may not be. Genetics is one of these modifiers. He showed evidence illustrating that although the strongest evidence for a diet-related gene remains for the lactase gene and its evolution to allow lactose tolerance, proof-of-concept evidence exists for several other diet-related genes. But the real question, he said, is whether genetic variation in diet-related genes matters in terms of nutrient requirements. According to Stover, most genes that have an elevated effect on nutrient requirements are also high-risk factors for miscarriage, with most conceptions not proceeding to birth and, thus, naturally being selected out. He explained how variation in a common folate-related variant is a rare example of a diet-related gene that does have an effect. In 2015, the World Health Organization (WHO) used this knowledge to develop new guidelines for red blood cell folate concentrations for women of reproductive age.
Not only is variation the norm for human physiology, Anura Kurpad continued, but it is also heritable. In his opinion, the estimated average requirement (EAR) and tolerable upper intake level (UL) are not the only
two nutrient intake reference values that need to be measured. Variability is another. You cannot just “grab” study participants “off the road” and enroll them in randomized controlled trials (RCTs) for nutrient requirements, he said. Because baseline measurements of habitual intake, nutrient status, and body composition are so critically important, subjects need to be “normalized” before measuring these values. According to Kurpad, the consequences of not adapting subjects before studying them in an RCT can have economic consequences (e.g., if subjects are eating higher amounts of a nutrient when enrolled, their intake requirements will appear to be higher
than they would be otherwise). In closing, among other reflections, Kurpad wondered if the EAR should be philosophically reconsidered with respect to what is “necessary” versus “sufficient.” He pointed out that, currently, the EAR for protein, for example, is the minimum, not optimal, intake that assures balancing intake against daily losses.
The next two speakers focused on health status and its effect on nutrient intake requirements. In his overview on the role of infections, Seth Adu-Afarwuah emphasized that despite massive reductions over the past 15 years in infectious diseases in children under 5 years of age, such diseases still account for a high percentage of child mortality worldwide. He listed four ways that infections can impair nutrient metabolism and, consequently, nutrient requirements: (1) decreased food intake, (2) impaired nutrient absorption, or reabsorption, (3) loss of body nutrients (i.e., wastage), and (4) uptake, diversion, or sequestration of body nutrients. He used examples from the literature to illustrate each. “One of the hallmarks of infection is the breakdown or loss of muscle protein,” Adu-Afarwuah said, in reference to the third mechanism. Data from multiple studies have all shown associations between infection and loss of nitrogen or protein. In conclusion, Adu-Afarwuah suggested considering two sets of recommendations: one for developed countries, the other for developing countries with allowance for infections.
Caryl Nowson continued the discussion on health status, but in the context of aging. Among other physiological changes with age, by 70 years of age, people have lost, on average, 40 percent of muscle mass and strength, which has a major effect on their quality of life. Likewise, bone loss with age follows a similar trend. Nowson emphasized the importance of not just physiological and metabolic responses to nutrient intakes, but also functional (e.g., risk of falls, ability to maintain activities of daily living) and chronic disease outcomes. For example, while both calcium and vitamin D have biochemical indices related to nutrient deficiency, both also have functional outcomes (e.g., fracture risk). Among other challenges in setting nutrient reference values (NRVs) for older people, Nowson questioned the extent to which functional outcomes overlap with chronic disease outcomes in this population and how NRVs for highly interrelated nutrients, like vitamin D and calcium, should be developed and communicated.
Next, Rosalind Gibson provided an overview of bioavailability. She emphasized that if host conditions, diet, or environment do not affect bioavailability, then the physiological and dietary requirements will be the same. Dietary factors known to influence bioavailability include chemical form, nature of the dietary matrix, effects of other food components (e.g., certain organic components inhibit, while others enhance), and pretreatment of food (e.g., blending, fermentation). Among the several types of methods used in the past to estimate nutrient bioavailability, the most accu-
rate are isotopic methods based on whole diets, not single meals, according to Gibson. She discussed two types of potential tools to estimate bioavailability in a harmonized manner and allow for cross-country comparisons, The first tools would be based on food supply data from either the United Nations’ Food and Agriculture Organization (FAO) food balance sheets or the FAO/WHO Global Environment Monitoring System (GEMS) cluster diet database. The second set of tools would be based on food consumption data, namely the FAO/WHO Global Individual Food consumption data Tool (GIFT) platform (FAO/WHO, 2017). She called for more exploration of the GIFT platform in particular.
Continuing the focus on bioavailability, Umi Fahmida discussed estimates of bioavailability in Southeast Asian countries that were derived using the same tools described by Gibson. She commented on the variation in iron bioavailability data obtained from isotope studies for different types of diets across India, Myanmar, and Thailand (ranging from 2–20 percent) and how this variation reflects the complexity of diet in Asian countries. Balance sheet data on energy from animal source foods show the same variation. For example, animal source foods provide 6.6 percent of energy in the Indonesia diet, compared to 21.5 percent in Brunei Darussalam. Similarly, food consumption data reveal variation in dietary intake not just among countries, but even within countries and also among life-stage groups. Fahmida shared conclusions from a 2005 report (on harmonizing recommended dietary allowances [RDAs] across Southeast Asia) regarding when and how to estimate bioavailability for what she described as “typical problem nutrients” in Southeast Asia, that is, calcium, iron, and zinc. Today, Fahmida said, despite these efforts, each country still has its own way of estimating bioavailabilities. She emphasized that it is not the values themselves that need to be harmonized, rather approaches for estimating these values.
THE ROLE OF THE HOST: GENETIC VARIATION1
To start the session, Patrick Stover provided a survey of the biological premise and evidence for the role that genetic variation plays in nutrient requirements. He noted that he would be essentially updating information that he had presented at the initial harmonization meeting in Florence, Italy, in 2005.
Dietary requirements are complex traits, he began. That is, there are a number of physiological processes that occur and that can be modified in ways that change what a requirement might or might not be. These modi-
___________________
1 This section summarizes information presented by Patrick Stover, Ph.D., professor and director, Division of Nutritional Sciences, Cornell University, Ithaca, New York.
fiers include disease, epigenetics, the food matrix, nutrient–nutrient interactions, pharmaceuticals, toxins, the microbiome, and genetics. The question he said he would be focusing on for the remainder of his presentation was: how meaningful are these modifiers, in particular genetics, in terms of public health? He described this as a “hot area” of research. When the American Society for Nutrition set its research agenda in 2013, the number one priority on the agenda was to understand variability in responses to diet and food, with genetics being one of the contributing factors (Olhorst et al., 2013). Evidence for the role of genetics stretches back to the 1990s global initiative to sequence the human genome. The Human Genome Project (1990–2003) sought to determine what Stover called the “blueprint for all of life” (U.S. Department of Energy, 2017), allowing for a classification of components that make up cellular networks and determination of gene variants that modify how these networks function.
One of the most common sources of genetic variation, Stover said, are single nucleotide polymorphisms (SNPs). SNPs are single base pair differences. There are about 10 million of them in the human genome. According to Stover, although most SNPs are silent, SNPs can cause functional differences and can contribute to complex traits, such as susceptibility to chronic diseases, metabolism, and drug efficacy. Another type of genetic variation that is important with respect to diet and nutrition is copy number variation. Copy number variants (CNVs) are common variations in gene copy numbers that encode for particular proteins. They result from a duplication event, with each event increasing the amount of protein available to carry out a particular metabolic or other cell function. Like SNPs, CNVs can have functional consequences and can contribute to complex traits, including metabolism and drug resistance.
Diet and Evolution
Dietary components have been a powerful force in the evolution of all species, Stover continued (Leonard, 2002). The food that is available to a species can select for changes in the enrichment of DNA primary sequences within a population, he explained. Food can also program the genome and change gene expression. Moreover, in humans, not only have dietary components throughout evolution contributed to today’s genomes, but today’s human genomes, in turn, code for food tolerances and intolerances, dietary requirements, and susceptibility to metabolic disease. Where you see increased rates of diet-induced metabolic disease or associated metabolic disease, Stover said, you also often find related genome adaptions to a past environment. In its new environment, those adaptive genes are now disease alleles.
Two events need to happen for nutrition-related genetic variation to
arise, Stover explained. First, there needs to be a random mutation. Then, that mutation has to expand in a population either because it confers some sort of advantage to an individual (i.e., natural selection) or because of genetic drift. According to Stover, it is now known, through computational methods, that factors related to immunity to pathogens, diet, and environmental change have been the most powerful drivers of genetic variation that determine whether an individual survives or not. These computational methods help to identify where in the genome past mutation events have wiped out preexisting variation, that is, where a new mutation that offers some sort of selective advantage has suddenly emerged and replaced all the other existent variation in the population.
According to Stover, based on what has been seen thus far computationally, the most powerful selection for a diet-related gene has been for the lactose tolerance gene (Itan et al., 2010; the lactose tolerance gene is also known as the lactose persistence gene). Expression of this gene allows humans to use lactose as a food source even as adults. The heat maps shown in Figure 6-1 illustrate a close geographic correlation between genotype and phenotype, which Stover interpreted as proof of principle that a genetic change enabled lactose to be used as a food source and that the change expanded in certain populations because it offered a selective advantage. While it is not clear if evolution of this gene was diet induced or food safety induced (i.e., with milk serving as a source of sterile liquid), “nonetheless,” he said, “this is the best example we have.”
Also using computational methodology, Fan et al. (2016) examined genomes around the globe and looked for local genetic adaptations that have enabled humans to live in certain areas. Among other findings, they reported that an amylase CNV that enables humans to digest starch was selected in one area, while gene variants that confer the ability to metabolize high-fat diets were selected in another area. The amylase CMV is interesting, in Stover’s opinion, because it correlates well with cultures that have a history of agriculture and reliance on starchy foods for their calories. In contrast, populations that have historically been hunter-gatherers do not have as many copies of the gene.
Other diet-related genes that have similarly displayed computational signatures of selective pressure include genes for ethanol metabolism, iron homeostasis, some of the taste receptors, calcium transporters, and protein metabolism (Stover, 2007). Stover found it interesting that selection for the calcium transporter gene occurred after selection for the lactose tolerance gene, that is, that the lactose tolerance gene allowed for consumption of milk first, followed by subsequent selection for a different gene involved in calcium transport.
While all of these findings are interesting for population geneticists, the “real” question, Stover emphasized, is whether genetic variation in
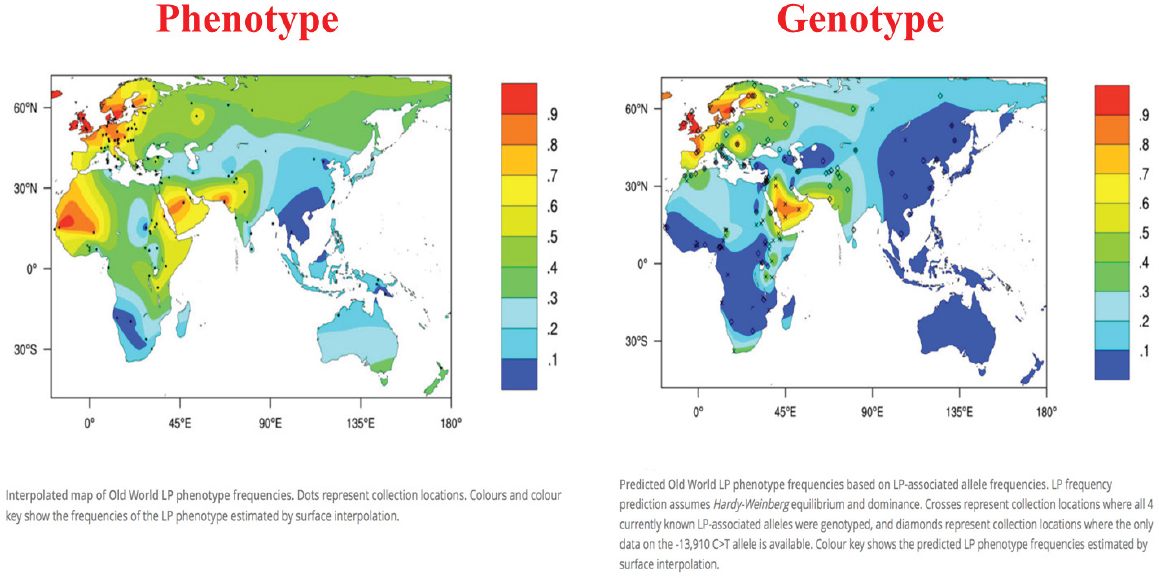
NOTE: LP = lactase persistence.
SOURCES: Presented by Patrick Stover, HMD Workshop, Rome, Italy, September 21, 2017 (Itan et al., 2010, modified with permission from BioMed Central).
diet-related genes matters in terms of nutrient requirements. The basis of personal nutrition, at least when it was first envisioned, was that genetic variation would have a highly penetrant effect on nutrient requirements. “In fact,” Stover said, “that has not [been] borne out in any of the data.” Only a couple of examples to date have shown an effect, because, according to Stover, gene variants with a marked effect on nutrient requirements also, by and large, are high-risk factors for miscarriage (Stover, 2007). He explained that embryos with mutations for specific nutrient requirements that cannot be met by the mother will not develop. Most do not implant, and many spontaneously abort. Thus, many of these mutations are naturally selected out during gestation. Polymorphisms in folate-encoding genes, described below, are a rare exception.
A Diet-Related Polymorphism with Policy Implications: Variation in Folate Requirement
Folate-encoding genes have many polymorphisms that can increase the risk for neural tube defects, homocysteine-related health outcomes, drug efficacy, and probably also folate requirements, Stover continued. For example, the MTHFR gene, a gene that metabolizes folate, has a common variant at base pair 677, with about 80 percent of the alleles at this position being C, coding alanine (Ala), and the other 20 percent being T and coding valine (Val). This difference has a large effect on metabolism and folate requirements, with both benefits and risks, Stover said. Individuals with the T allele have a low folate status and, thus, a higher folate requirement. They are at risk for spina bifida and, because of their higher folate requirement, miscarriage. However, if they survive gestation, they have one of the lowest rates of colon cancer known if they maintain adequate folate status (Ma et al., 1999). According to Stover, this finding has been validated in several studies. Individuals without the T allele lose that genetic advantage for cancer prevention if they become folate deficient.
The frequency of the T allele varies among populations (from 0 percent in Africans to 30 percent in Mexicans), which has implications for harmonization for nutrient standards, Stover stated, if the differences in requirements attributable to this genetic change are meaningful. Data from a large-scale study of a nonfortified Norwegian population (Fredriksen et al., 2007) showed a 32 percent difference in homocysteine (a functional indicator of folate status) and a 30 percent difference in folate status between MTHFR 677TT and 677CC homozygotes. The question is: does this difference affect nutrient requirements?
The answer is yes, he said, pointing to results of a 2008 study published in the Journal of Nutrition, where Solis et al. (2008) showed that folate intake at the current RDA level was inadequate for Mexican American
men with the MTHFR 677TT genotype. The men were put on a controlled diet with the RDA for folate, which is 400 micrograms of dietary folate equivalents per day. Over time, homocysteine levels (again, a functional marker of folate status) among TT homozygotes went up markedly, while homocysteine levels among CC homozygotes remained the same. Stover interpreted these results to mean that, clearly, individuals have different folate requirements because of this polymorphism. “But again,” he said, “this is a rare example.”
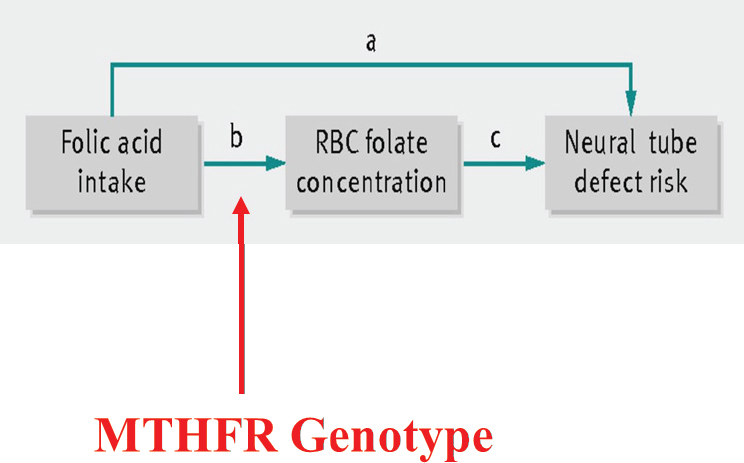
In 2015, WHO used this knowledge about folate gene polymorphisms to develop new guidelines for red blood cell (RBC) folate concentrations for women of reproductive age (WHO, 2015a). This was in response to countries approaching WHO and asking about levels to which they should fortify their food supply to prevent neural tube defects. Stover explained how WHO broke the question down by deciding not to focus on either folic acid intake or neural tube defect risk, because of the errors associated with both of those measurements, but on the connection between the two: RBC folate concentration (see Figure 6-2). RBC folate concentration can be measured very well, Stover said. Then, from that measurement, one can work either backward (to folic acid intake) or forward (to neural tube defect risk). Additionally, WHO examined the effect of MTHFR status,
SOURCES: Presented by Patrick Stover, HMD Workshop, Rome, Italy, September 21, 2017 (Crider et al., 2014, with permission from BMJ Publishing Group, Ltd.).
since it was known to be a modifier of both folate status and neural tube defect risk.
More specifically, Stover explained, using data from China, first, they ran a genotype model whose output was estimates of MTHFR genotype frequencies; then they entered that output, along with data on folic acid intake, into a concentration model whose output was estimated RBC folate concentrations; finally, they entered that output into a risk model whose output was the association between RBC folate concentration and neural tube defect risk. Through iterations of this, they computed a dose–response curve of estimated neural tube risk (per 10,000 births) as a function of RBC folate concentration (see Figure 6-3). “The beauty of this,” Stover remarked, was that there were RBC clinical data from Ireland showing folate levels in all women who had a child with a neural tube defect (Daly et al., 1995). Although the generalizability of the Ireland study was unknown, nonetheless, as shown in Figure 6-3, those data overlaid very nicely with WHO’s dose–response data from China.
Based on this work, WHO (2015a) was able to recommend levels of RBC folate that are needed to prevent, or reduce the risk of, neural tube defects. Countries can then decide on their own how they want to reach that level, if that is their goal, Stover explained.
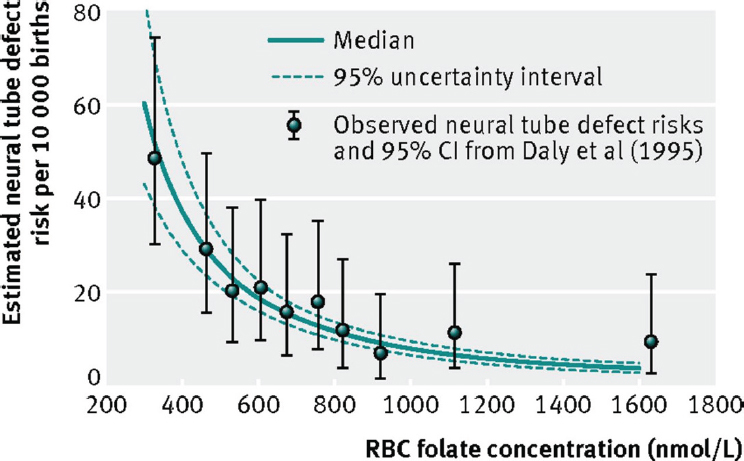
NOTE: CI = confidence interval; RBC = red blood cell.
SOURCES: Presented by Patrick Stover, HMD Workshop, Rome, Italy, September 21, 2017 (Crider et al., 2014, with permission from BMJ Publishing Group, Ltd.).
In closing, Stover repeated, “These examples are very rare,” as they should be, based on the biological premise that genetic variants that change nutritional requirements in a way that cannot met by the mother are not going to survive. “But certainly,” he said, “when they are present, like the MTHFR genotype, we have to account for them when establishing Dietary Reference Intakes.”
THE ROLE OF THE HOST: PHYSIOLOGY ADAPTATION2
There is this idea out there, Anura Kurpad began, that physiology is the same everywhere in the world. “I’m here to tell you it’s probably not,” he said. According to Kurpad, it was Adolphe Quetelet, who came up with the body mass index (BMI), did so based on his belief that any variation observed was really measurement error and that a mean value described a population very well. In contrast, Charles Darwin, Francis Galton, and others viewed variation as real biology (i.e., not measurement error). Not only was variation real, but it was heritable, in their view. In Kurpad’s opinion, in addition to the nutrient intake values (NIVs) mentioned by King earlier in the day as the two that really need to be measured—average nutrient requirement (ANR) and upper nutrient level (UNL)—there should be a third: variability. “I think it is very important to measure it,” he said, and not just impute it or assume it. The challenge is there are different types of factors that contribute to physiological variability (i.e., interindividual variation, intraindividual variation, measurement error), all of which need to be measured.
“Normalizing” or Adapting Subjects Before Studying Nutrient Requirements
Because of this physiological variation, Kurpad said, “I think it is extremely difficult to fulfill the requirements of a clinical drug RCT for nutrients.” You cannot start a nutrient requirement RCT, he said, by “getting someone off the street” and giving them doses of the nutrient under consideration. He emphasized the critical importance of the baseline measurement and the need to “normalize” study participants, or adapt them to what they normally, or habitually, eat before measuring their baseline. In addition to habitual intake, their nutrient status and body composition need to be considered as well. Too often this is not done, he said.
As an example of what he meant by adaptation, he described some of his past work with Vernon Young on the leucine requirement. They fed
___________________
2 This section summarizes information presented by Anura Kurpad, M.D., Ph.D., professor of physiology and nutrition, St. John’s Medical College, Bangalore, India.
people different levels of leucine and adapted them to those levels of intake for 7 days. Only after being adapted were subjects’ leucine oxidation levels measured in the fed versus fast states. Kurpad and Young found that swings in amino acid oxidation increased the more amino acids one habitually ate. “Now, that is my point,” he said, that is, that a person entering a study [on lysine requirement] at one level of an amino acid intake would react very differently at baseline than someone entering the study at a different level. Thus, people need to be adapted to whatever level the investigators decide is “normal.”
Regarding the length of time needed for adaptation, Quevedo et al. (1994) showed that, when subjects are switched from a high protein intake (approximately 292 mgN/kg/d) to a medium protein intake (approximately 125 mgN/kg/d), it took about a week before the subjects’ urinary nitrogen (N) excretion reached what was considered an acceptable steady state; this would be the point at which their baseline measurement for a subsequent dose in an RCT could be determined. In other work, with essential amino acids, Kurpad and colleagues had to adapt subjects for 7 to 21 days to demonstrate that a 7-day adaptation period was enough. There are consequences of not adapting subjects before they are studied, Kurpad continued. If subjects were eating high amounts of the nutrient to be studied, then their measured requirements will be higher than usual.
Another consequence of not adapting subjects is that if subjects entering a study have a larger distribution of the EAR, that is, if subjects are very variable, with some subjects eating very low amounts of the nutrient to be studied, and others eat large amounts, this will affect the estimated RDA (as opposed to the EAR), since this is determined from the distribution of measured requirements. Kurpad remarked that he has seen data from China indicating a lysine RDA that was double what he and his colleagues had determined. He explained that in the nutrition requirements world, a coefficient of variation (CV) of 10–15 percent is considered to be a reasonable CV for an EAR distribution. But, again, in studies where investigators are just “taking people off the road,” without adapting them, he has seen CVs as high as 40 percent. “I think this is where we need to be clear,” he said, and “harmonize all these different methods.”
The Problem of Scaling
For Kurpad, in addition to the need to normalize, or adapt, subjects before studying nutrient requirements, scaling poses another challenge. He explained that requirements typically are scaled to body weight and not what he considers the “really important” components, like fat free mass. The WHO equation for basal metabolic rate (BMR), for example, is based on weight, sex, and age. However, like every prediction equation, Kurpad
said, the BMR equation is dependent on the population from which the equation came. In its case, it was young army recruits from Italy who dominated the first BMR database. As a result, because those young, muscular men probably had higher than usual BMRs, the equation derived to predict BMR predicts a higher than expected BMR. The use of this same equation in India, Malaysia, or Singapore, for example, always overestimates BMR, and there are several publications that have pointed this out, according to Kurpad. In and of itself, this overestimation is not a lot. It is about 5–10 percent. But there are consequences of that overestimation, he cautioned, as the error propagates down to total energy expenditure.
A Fallacy of the Factorial Method
One would expect increased physical activity to be correlated with increased energy expenditure, based on the factorial model, Kurpad continued. However, this was not the case when Pontzer et al. (2016) collected physical activity data and measured energy expenditure in several countries worldwide. The relationship between physical activity and energy expenditure was more constrained, and energy expenditure did not increase as expected with increased physical activity. Kurpad explained that this is because there is a behavioral response that occurs when people increase their level of physical activity. In a study of semimanual laborers in India, to his surprise, he and colleagues found that the laborers actually had very low total energy expenditures. They would go to work, he said, and then come home in the evening and “sit around doing nothing, because this is the way their culture was.” This meant that their work activity was nullified by extremely low leisure activity. He encouraged more thinking about the factorial method and its use for measuring requirements in children. Currently, it is the only method available, he said, but it has its fallacies.
Closing Thoughts
In closing, Kurpad repeated his concern about what “normal” is. If one is to set up a harmonized RCT and enter into the study only subjects with a baseline that has been carefully considered with respect to what normal is, the question becomes, what is normal? Again, he lamented not knowing what a unified standard of the “normal” might be, but that it depends on geography, poverty, culture, and habits. Additionally, he emphasized the importance of scaling to body composition, not weight, as illustrated by the overestimation of BMR among nonmuscular Indians (i.e., when using a BMR equation that was formulated based on data from muscular army recruits).
Kurpad also emphasized the importance of functional endpoints when setting nutrient requirements. Currently, most of these requirements are
based on more readily measurable endpoints, typically physiological or biochemical losses from the body.
Finally, regarding target intake, the focus is always on the “average requirement,” he said. But is the EAR an average, or is it a minimum? In fact, he said, it is the minimum intake that assures a balance with daily nutrient losses. He opined that people do not want to be told the minimum they should eat, but what is optimal for their functional health.
THE ROLE OF HEALTH STATUS: INFECTION3
Seth Adu-Afarwuah began by emphasizing variation in the incidence of infectious diseases between developing and developed countries. Despite massive reductions in the incidence of infectious diseases in the last two decades, infections are still common in many places worldwide. For example, in 2015, 16 percent of all deaths of children under the age of 5 years was attributable to pneumonia, with most of these deaths occurring in developing countries in the tropics (i.e., Africa, Southeast Asia, South Asia, and the Pacific). Other infectious diseases, such as diarrhea, malaria, and tuberculosis, show the same pattern, Adu-Afarwuah stated, rarely occurring in developed countries. For example, typhoid fever occurs in South Asia at a rate 10 times that in North America; and the prevalence of Helicobacter pylori infection is nearly 90 percent in Nigeria, compared to 9 percent in Switzerland.
Infections affect nutrient metabolism and, subsequently, nutrient requirements in four ways: (1) decreased food intake; (2) impaired nutrient absorption or reabsorption; (3) absolute or direct losses of body nutrients (i.e., wastage); and (4) uptake, diversion, and sequestration of body nutrients (Bresnahan and Tanumihardjo, 2014). Adu-Afarwuah went on to describe examples from the literature illustrating each of these mechanisms, with a focus on vitamin A and protein.
Decreased Food Intake
Adu-Afarwuah described several studies showing that infectious diseases affect nutrient requirements by decreasing food intake, beginning with a study of children in Guatemala, ages 15–60 months, who either had or did not have selected common symptoms (Martorell et al., 1980). The authors reported that children who had symptoms had a 20 percent decrease in energy intakes and an 18 percent decrease in protein intakes. Similar findings have been reported from Kenya, where children with mea-
___________________
3 This section summarizes information presented by Seth Adu-Afarwuah, Ph.D., senior lecturer, Department of Nutrition and Food Science, University of Ghana, Legon, Ghana.
sles had a 75 percent reduction in energy consumption (Duggan and Milner, 1986). Evidence from Peru shows the same: infants with diarrhea or fever had a 5–6 percent reduction in total energy consumption or a 30 percent reduction in non-breastmilk energy intake (Brown et al., 1990). Similarly, among Bangladeshi preschool children, cholera and rotavirus infection have been shown to reduce nitrogen and fat consumption (Molla et al., 1982). As a final example, in Zambia, children with malaria demonstrated reduced energy, carbohydrate, and vitamin A consumption (Bresnahan et al., 2014).
Impaired Nutrient Absorption or Reabsorption
There are several mechanisms by which infections can impair nutrient absorption or reabsorption, Adu-Afarwuah continued. Inflammatory lesions can affect, or even damage, the proper functioning of the intestinal mucosa or cells; parasite load or size, if sufficiently severe, can affect absorptive mechanisms; interference from treatment (e.g., antibiotics) can also affect nutrient metabolism and, therefore, nutrient requirements; and, lastly, alterations in the transport system of the intestinal mucosa can affect blood flow and, consequently, nutritional requirements.
Again, Adu-Afarwuah described several studies from the literature demonstrating, in this case, that infectious diseases affect nutrient requirements by impairing nutrient absorption or reabsorption, beginning with a study of preschool children in Nigeria where the excretion of iron-labeled iron dextran, an indicator of protein loss, was higher in children with acute measles (Dossetor and Whittle, 1975). When the measles subsided, protein loss was relatively low. In the same study, lower xylose concentration in the blood, an indication of reduced absorption, reversed after the measles subsided, suggesting that the infection had impaired absorption, Adu-Afarwuah explained. In Bangladesh, preschool children with cholera and rotavirus infection absorbed less than half of nitrogen and less than half of fat; when the illnesses were over, absorption rates for both nitrogen and fat increased (Molla et al., 1982). In a study in the United States, the excretion of nitrogenous compounds, amino acids, and proteins was high in children (ages 3–9 months) with diarrhea, compared to those with no diarrhea (Ghadimi et al., 1973). As a final example, in India, preschool children with diarrhea absorbed and retained less vitamin A, compared to those with no diarrhea (Reddy et al., 1986).
Absolute Loss of Body Nutrients
Infections’ effects on nutrient requirements are different than the type of loss observed during simple starvation or as a result of decreased energy consumption, Adu-Afarwuah clarified. One of the hallmarks of infection is
the breakdown or loss of muscle protein and other tissues. These depletions provide a supply of amino acids to make up for the fact that, during infections, the amount of protein needed typically exceeds what is provided in the diet. Additionally, urinary loss of protein and vitamin A may occur during infections because of fever-induced damage to renal tubules. As evidence for this loss of protein, Adu-Afarwuah cited a study of people who were infected with the sandfly virus; individuals with sandfly fever symptoms excreted higher levels of nitrogenous compounds, compared to those who were not infected by the virus (Beisel et al., 1972).
Regarding the amount of protein lost during an infection, there is not much evidence, Adu-Afarwuah added, plus it is old evidence, but values between 2.5 and 3.5 grams (g) of protein per kilogram (kg) of muscle have been reported (Kocher, 1914; MacCallum, 1910). Scrimshaw (1977) reported 0.6 g protein/kg of muscle for patients with acute infection and 0.9 g protein/kg of muscle during diarrhea. According to Adu-Afarwuah, anywhere from about 0.6 or 0.9 up to 3.5 g protein/kg of muscle may be lost during an infection.
Additional examples from the literature of the absolute loss of body nutrients during infection include a study on vitamin A, where adults with pneumonia or sepsis excreted more vitamin A than a control group (Stephensen et al. 1994). In the same study, those with fever excreted more than those without fever, and individuals who were sicker excreted more than those who were not as sick. “So the excretion depends on the severity and the duration of infection,” Adu-Afarwuah interpreted. In another study, children (ages 6 to 36 months) with diarrhea excreted more urinary retinol over the course of 3 days after admission to a hospital, compared to children without diarrhea (Alvarez et al., 1995). Additionally, among those with diarrhea, those with fever excreted more, compared to children without fever. Thus, again, Adu-Afarwuah explained, both infection and the presence of fever cause excretion. In yet another study, 59 percent of preschool children hospitalized for shigella experienced urinary retinol loss, with 8 percent losing more than 0.1 micro-mole per day (Mitra et al., 1998). Children with more severe disease excreted more vitamin A, and those with fever excreted more than those without fever.
As a final example, he mentioned a study in Brazil, where children were administered high-dose vitamin A, then, 1 month later, their liver vitamin A levels were assessed (Campos et al., 1987). At the 1-month mark, none of the children had a low liver vitamin A level. But soon after, there was a chicken pox outbreak such that, when their liver vitamin A levels were reassessed at 4 months, 10 percent of those infected had inadequate stores of vitamin A in their livers. At 6 months, 74 percent of children infected with chickenpox had inadequate liver stores, compared to only 10 percent in those who were not infected. Again, Adu-Afarwuah said, the point here is that “infection takes away a lot of the nutrient stores.”
Uptake, Diversion, and Sequestration of Various Body Nutrients
Infections cause the uptake, diversion, and sequestration of various body nutrients because of the many different increased nutrient requirements needed as the body fights an infection, Adu-Afarwuah explained. For example, proteins may be needed for the production of positive acute phase proteins or the synthesis and function of phagocytic cells and immunoglobulins. Or, amino acids may be needed for energy, if the body’s ability to use fat and carbohydrates is impaired in the course of infection.
As an example of evidence from the literature for this mechanism, Adu-Afarwuah cited a study of volunteers who were infected with shigella (Bostian et al., 1976). Those who developed typhoid fever showed increased synthesis of plasma proteins, whereas those who did not develop fever showed no change in plasma protein synthesis.
Implications for Harmonization
Current nutrient recommendations do not make any provision for infections. According to Adu-Afarwuah, this is partly because of the lack or scarcity of data when these recommendations were made. But additionally, arguments have been made for not making any such provision. As Adu-Afarwuah explained, it has been argued that the metabolic responses that occur with infections are purposeful adaptive mechanisms. Anorexia, for example, may be the body’s way of protecting itself. It has also been argued that efficiency of the use of nutrients, which is typically very high during infection, is sufficient to allow for the repletion of nutrients during that time. Still another argument is that the focus should be on combating infections, not providing more nutrients. Finally, it has been argued that there is a “safe level of intake” that offsets the increased requirements associated with infection.
On the other hand, it has been argued that nutrient requirements should be increased when there are infections. Adu-Afarwauh explained that this argument is supported, or may be supported, by the fact that, if an individual is at borderline nutrition status, then increased nutrition could help to fight off the infection. Moreover, in this case, after the infection has subsided, one’s nutrient requirements would be even higher, as the infection would have depleted body nutrients stores to a large extent. Or, he continued to explain, if a person has a marginal intake before infection, then returning to the same marginal intake after the infection has subsided would mean a longer recovery period, during which time it would make sense to increase an individual’s requirements. Or, in situations where infections are frequent, increasing requirements would provide rapid repletion before the “next” disease episode. Additionally, it is known that when protein and
energy intakes are increased during or immediately after an infection, this can ameliorate the negative effect of the infection.
In conclusion, Adu-Afarwuah stated that it seems, or one might argue, that the nutrient requirements for developing countries may be different than those of developed countries owing to differences in the prevalence of infection. In addition to a systematic review of the evidence, he suggested consideration of two sets of recommendations: one for developed countries, the other for developing countries that take into account the effect of infections.
THE ROLE OF HEALTH STATUS: AGING4
Echoing Kurpad’s questioning what “normal” is, Caryl Nowson asked, “What is a normal aged person? What is expected of normal aging? What is sufficient, and what is necessary for this age group?” Her approach to looking at aging was informed by work she did with Peter Clifton while developing the framework for the NRV review in Australia (Australian Government Department of Health, 2015) (a summary of Clifton’s presentation is provided in Chapter 3). When thinking about the role of aging, she always thinks about the difference between prevention of deficiency and prevention of chronic disease. It is much harder to separate these two among older adults. If the decision is made to look at endpoints for deficiency, then those endpoints need to be decided, as do the physiological and biochemical indices along that trajectory. On the other hand, if the decision is made to look at chronic disease prevention, then biomarkers need to be identified that are associated with those disease outcomes. Additionally, known interactions between nutrients also need to be accounted for, as does the population intake of relevant foods.
Physiological Changes with Age: What Is Normal Aging?
“Unfortunately,” Nowson said, “we all get old, and things deteriorate.” Our kidneys are not working as well, our heart is not working as well, and by the age of 70 years, on average, people have lost 40 percent of their muscle mass and strength (Janssen et al., 2000). Muscle loss, or sarcopenia, significantly affects quality of life because it requires a greater effort to move. People don’t want to get out of their chairs, Nowson said. It is much easier to stay sitting. This reduced physical activity, in turn, leads to yet more muscle loss and becomes what she described as a “vicious cycle.” Bone loss with age shows a similar trend, although some races are protected
___________________
4 This section summarizes information presented by Caryl Nowson, Ph.D., professor of nutrition and aging, Deakin University, Victoria, Australia.
from bone loss to some degree, because they have higher bone mass initially, so although they decline, they don’t fall into the osteopenia range (Seeman, 2003). The amount and rate of bone lost from different bones in the body varies, resulting in increased risk of fracture at specific sites such as the hip and spine. Nowson wondered whether, in an ideal world, no muscle loss or no bone loss is even achievable. “It is making me think,” she said, “where are we trying to get to in terms of aging?”
Not only does deterioration happen, but the older population is a diverse mix with diverse needs. There are the well-fit elderly at one end of the range, the frail at the other end. Approximately 80 percent of adults over the age of 65 have high blood pressure, 50 percent of women over the age of 80 have a vertebral fracture, and 10 to 30 percent of adults over the age of 60 have atrophic gastritis. Based on self-reported health data, two out of three people over 65 years of age have multiple health conditions (CDC, 2013; National Center for Health Statistics, 2016). “So are we really saying that we are not going to do NRVs for those two out of three people?” she asked, in reference to the notion that NRVs are only for healthy people.
In addition to this variation in health, a whole range of lifestyle factors influence nutrient requirements in the older population, Nowson continued. For example, with respect to activity level, a sedentary lifestyle is associated with higher body fat. Obesity, in turn, is associated with low levels of circulating vitamin D. Resistance training in particular has been shown to increase muscle mass and bone density. Among adults with a mean age of 90 years, Fiatarone et al. (1994) found that 8 weeks of resistance training increased muscle strength by 180 percent and muscle size by 11 percent. “So they can do it, if you really push them,” Nowson said, but “how many people are actually going to do that?” In another study, resistance training combined with higher protein intake led to an increase in muscle mass and strength (Houston et al., 2008). But again, Nowson asked, how many people are going to do this? These findings raise the question: when making nutrient recommendations, how should this type of exercise, as well as other lifestyle factors, be taken into account?
Other lifestyle factors that can affect nutrient requirements in the older population include smoking, which can have lifelong effects on bone density; high alcohol intake throughout life; industrialization, with the highest hip fracture rates in North Europe and the United States and the lowest in Latin America and Africa; and latitude, with a north–south gradient in fractures, which Nowson noted is perhaps related, to some degree, with vitamin D and cultural practices (i.e., covering up in the sun), as well as the effects of clouds and pollution on ultraviolet (UV) exposure (Bow et al., 2012; Dhanwal et al., 2011; Ensrud, 2013).
Protein: Functional Outcomes
Nowson emphasized the importance of looking at protein in terms of functional outcomes, not just physiological and metabolic responses (Campbell et al., 1994, 2001; Castaneda et al., 1995). Protein-related functional outcomes include falls, fractures, and activities of daily living. These functional outcomes are also affected by interrelationships with other nutrients, like vitamin D and dietary calcium; medications; and the home environment. Nowson commented on the need to dissect these out when making recommendations and the fact that there remain unanswered questions around how to do that. She cited a 2013 FAO report on protein quality, where it was argued that future efforts should be directed toward looking at long-term health outcomes, including age-related function, bone strength, and chronic diseases (FAO, 2013).
There is no one specific physiological index of protein deficiency, although there are a number of indices that can provide an indication of the protein status of the body. Body weight reflects total body mass, including muscle which is related to both energy and protein intake. Dual-energy X-ray absorptiometry (DEXA) measurements provide measurements of body composition, including the amount of muscle. There are also indices of muscle strength such as hand grip. Although all of these are affected by inadequate intake of dietary protein, they are also affected by a range of other factors, including energy intake, vitamin status (e.g., vitamin D), and level of physical activity. Biochemical indices are not very reliable for older people, according to Nowson. For example, nitrogen balance has not been shown to be a robust marker, because older people adapt to a lower protein intake by breaking down some of their muscle mass, although, she noted, new methods may assist with that (Castaneda et al., 1995).
Calcium and Vitamin D: Functional Outcomes
With calcium and vitamin D, again, as with protein, one could measure physiological or biochemical indices of deficiency. But again, with respect to biochemical indices, serum calcium levels are of no use, Nowson remarked, and there are questions about the use of calcium balance studies given the unrealistic expectation that there will be no bone loss at 80 or 90 years of age, likewise, with physiological indices, such as bone density. She asked, “Do we really expect to have the bone density of a 30-year-old [at 80 or 90 years of age]?”
While some experts have called for a target level of serum 25(OH)D (i.e., above 80 nmol/L) for normal functioning, in Nowson’s opinion, there is no good evidence for this (Forsythe et al., 2012). However, she noted there is a clear increased risk of rickets at 25(OH)D levels less than 30 nmol/L and
an apparent risk of osteoporosis at levels less than 50 nmol/L. While vitamin D status is related to calcium absorption at relatively low dietary calcium intakes, she said, “Again, it doesn’t give you the whole picture.” Several aging-related conditions, including reduction in body weight, muscle mass, and physical activity, negatively affect total body calcium, with subsequent reductions in bone mineral density resulting in structural defects. Other nutrients can also affect calcium balance and, consequently, bone mineral density and structure. For example, insufficient protein can adversely affect calcium absorption, while a higher sodium diet can increase calcium excretion.
Functional outcomes related to calcium and vitamin D deficiency include osteoporosis, fractures, and falls, all of which occur, Nowson noted, with low bone density (Kenney and Prestwood, 2000). Overlaying all of this, vitamin D deficiency is associated with osteomalacia (inadequate calcification of the bones), as measured by bone biopsy, as well as with a reduction in muscle strength. Although many vitamin D supplementation trials have reported a reduction in falls and fractures, these reductions occur primarily before there is any effect on the bone, so they may be muscle related.
Bones at old age, she explained, are dependent on genetic makeup and the accumulation of what has happened throughout life, including the amount of bone built up during early life. Much of the prevention of osteoporosis has been an effort to increase bone density during childhood, as doing so reduces risk of falling into the “fracture zone” at an older age, Nowson explained. While women lose bone more rapidly during menopause, everyone experiences bone loss with age, which raises the question for Nowson, “How much can we actually have an impact on that?”
Global Patterns in Calcium and Vitamin D
Although the global patterns of calcium supply and deficiency risks reported in Kumssa et al. (2015) show where the greatest deficiency risks are, including in Africa and India, these patterns do not correlate with fracture outcomes, Nowson continued.
The global distribution of low vitamin D status among elders, as reported in Palacios and Gonzalez (2014), shows no “frank deficiencies” (i.e., less than 30 nmol/L) and low levels (19 percent) of moderate deficiency (below 49 nmol/L) in Canada. This is probably because of mandatory fortification, Nowson noted. In the United States, the frank deficiency rate is 5 percent, the moderate deficiency rate 34 percent. Like Canada, the United States has higher levels of fortification in its food supply. Rates in Australia are 7 percent frank deficiency and 17 percent moderate deficiency. Some of the highest rates of deficiency are in Morocco (52 percent frank deficiency, 85 percent moderate deficiency), India (62 percent frank deficiency, 91 percent moderate, 98 percent mild [less than 75 nmol/L]), and the Middle East.
Australia has been conducting campaigns around safe sun exposure, Nowson said, but the campaigns are complicated because two out of three Australians will be diagnosed with skin cancer before the age of 70. So there is a risk to recommending sun exposure. Plus, skin-produced vitamin D lasts in the circulation two to three times longer than a supplement of vitamin D, and evidence is emerging that high serum levels may have some adverse effects (Haddad et al., 1993; Holick, 2012; Wacker and Holick, 2013). In addition to sun exposure and vitamin D supplementation, a range of other factors can affect vitamin D status, including age, ethnicity, skin color (people with darker skin need to be out in the sun up to six times as long for UV light to trigger the conversion of inactive vitamin D to active vitamin D), physical activity, skin cancer risk (people who have had skin cancer avoid sunlight), food supply fortification, and dietary intake of calcium.
Possible Challenges in Setting NRVs for Older People
To close, Nowson summarized the challenges in setting NRVs for older people in the form of questions:
- What is a “healthy” older person?
- Currently, NRVs are set for older people between 50 and 70 years of age and for people over the age of 70 years. Is that what we should be using? Or, is functional age, however that is defined, a better categorization?
- What is a functional deficiency outcome? What is a chronic disease outcome? How much do these outcomes overlap in this older population?
- What is the gap between the population intake to prevent a deficiency and the population intake to prevent a chronic disease?
- How much weight should be given to high-dose supplement trials, particularly in populations where nutrient intake is traditionally low? Most of these trials, Nowson said, involve high-dose supplements. There are very few lower-dose trials. She was unaware of any trials that have persisted long enough to examine, for example, the effect on bone outcome of a “good” diet, but with less calcium or other nutrients.
- How should NRVs for nutrients that are highly interrelated, like calcium and vitamin D, be described and communicated?
THE ROLE OF DIET AND ENVIRONMENT IN SETTING NUTRIENT BIOAVAILABILITY FACTORS FOR ESTIMATING DIETARY REQUIREMENTS5
Rosalind Gibson began her presentation by defining bioavailability: To convert physiological requirements into dietary requirements, an adjustment is often needed to take into account factors that affect the proportion of the ingested nutrient that is absorbed and used through normal metabolic pathways (Hurrell et al., 2004). Bioavailability can be influenced by several factors, including diet and environment—which is the focus of Gibson’s talk—but also genetic variation and host health. However, if host conditions, diet, or environment do not affect bioavailability, then the physiological and dietary requirements will be the same, she emphasized. Gibson defined bioefficacy (e.g., as currently applied to provitamin A) as the efficiency with which ingested nutrients are absorbed and converted to an active form.
Factors That Affect Bioavailability
Currently, according to Gibson, there are sufficient data to quantitatively assess the effect of dietary factors on the bioavailability or bioefficacy for only certain nutrients, namely protein, the trace elements iron and zinc, and certain vitamins. These vitamins include folate, particularly the difference between food folate and synthetic folic acid (i.e., in supplements and fortificants); the difference between food vitamin B12 and crystalline B12; and preformed retinol versus the provitamin A carotenoids. For other nutrients, such as selenium and niacin, there are not enough quantitative data to adjust for bioavailability, noted Gibson.
Dietary factors known to influence either bioavailability or bioefficacy include chemical form, nature of the dietary matrix, effects of other food components, and pretreatment of food. Gibson described each of these in detail. Regarding chemical form, it is known that the bioavailability of iron, zinc, folate, and carotenoids is influenced by their chemical form. Regarding the nature of the dietary matrix, it is known that folate and carotenoids are involved.
With respect to the effects of other food components, there are certain organic food components known to inhibit and others known to enhance the bioavailability of certain micronutrients. According to Gibson, these include the following:
___________________
5 This section summarizes information presented by Rosalind Gibson, Ph.D., M.S.P.H., professor emerita, Department of Human Nutrition, University of Otago, Dunedin, New Zealand.
- Phytate, polyphenols, and oxalates, all of which inhibit the bioavailability of certain minerals (see the paragraph at the end of this section for Gibson’s discussion of the inhibitory effect of phytate on zinc);
- Pectin and lignin, both components of dietary fiber that are known to inhibit fat-soluble vitamins, carotenoids, and protein;
- Organic components, such as organic acids, which are known to enhance the bioavailability of iron and zinc;
- Vitamin C, which is known to enhance the bioavailability of iron;
- Animal protein, which is known to enhance the bioavailability of iron, zinc, and copper; and
- Fat, which is known to enhance the fat-soluble vitamins and carotenoids.
Additionally, it is known that interactions between micronutrients tend to occur only with high doses of supplements and without food.
Regarding the pretreatment of food, Gibson continued, it is known that preparation, processing, and cooking can all influence the bioavailability of certain micronutrients. Specifically, it is known that the milling of unrefined cereals reduces the phytate and mineral content; soaking can actually reduce the content of water-soluble phytate and simultaneously reduce some water-soluble minerals and B vitamins; blending can enhance the bioavailability of carotenoids and folates; and germination or fermentation can reduce the phytate content, as a result of enzyme-induced hydrolysis, and simultaneously increase the bioavailability of iron, zinc, and calcium.
Regarding phytate, Gibson explained that recent stable isotope work of Michael Hambidge and coworkers has demonstrated that the inhibiting effect of phytate on zinc absorption is much greater than previously estimated (Rosado et al., 2009). Their data on total absorbed zinc as a function of total dietary zinc at six different levels of phytate have been used by the European Food Safety Authority (EFSA) to generate the dietary zinc requirements for adult males and females at four different levels of phytate, ranging from 300 to 1,200 milligrams per day (EFSA NDA, 2014). In addition, Gibson noted, it is known that people in low-income countries, whose diets are mainly plant based, often have phytate intakes that exceed 1,000 milligrams, meaning that their estimated zinc requirements are probably very high.
Methods Used to Estimate Bioavailability
Several methods have been used in the past to estimate nutrient bioavailability: animal models; in vitro methods; in vivo methods, including isotopic methods; and changes in biomarkers or functional outcomes. Of
these, Gibson said, the most accurate are the isotopic methods, which have been used to assess the bioavailability of iron, zinc, calcium, folate, and vitamin A. It is now known, she added, that isotope studies are most accurate if they are done on whole-day diets, not single meals. The earlier studies on single meals have been shown to have exaggerated the effect of absorption modifiers.
As an example of the use of isotopic methods to estimate bioavailability, Gibson cited WHO/FAO (2004) data showing that a diet with very high meat in two main meals daily and high ascorbic acid has a 27.5 percent iron availability, compared to a diet with negligible meat or fish, high phytate, high tannin, and low ascorbic acid, which has a 5.5 percent iron bioavailability. These calculations were based on a woman weighing 55 kg and with no iron stores and assuming an intake of 15 mg of iron daily.
Additionally, for some nutrients, isotopic methods have been used in combination with mathematical models to develop bioavailability algorithms and classify diets into high, medium, or low bioavailability. As an example, she cited WHO and FAO’s use of isotopic data, along with other data on food consumption patterns, to develop algorithms for both iron and zinc. Diets for each nutrient are classified into three groups: high, moderate, and low bioavailability.
For iron, the low bioavailability diet is 5 percent bioavailability (simple, monotonous diet of cereals, roots, and/or tubers; negligible amounts of meat, poultry, and fish, or ascorbic-acid rich foods); the moderate bioavailability diet is 10 percent bioavailability (diets mainly of cereals, roots, and/or tubers; minimal amounts of meat, poultry, fish, and ascorbic acid); and the high bioavailability diet is 15 percent bioavailability (diversified diet with generous amounts of meat, poultry, fish, and/or with high amounts of ascorbic acid).
For zinc, the three groups are also based on the phytate:zinc molar ratio. The low bioavailability diet has an estimated 15 percent bioavailability, with a phytate:zinc ratio greater than 15 (cereal based with greater than 50 percent energy from unrefined cereals or legumes; negligible animal protein); the moderate bioavailability diet has an estimated 30 percent bioavailability, with a phytate:zinc ratio between 5 and 15 (not based on unrefined cereal grains or high-extraction rate [> 90 percent] flours); and the high bioavailability diet, with its estimated 50 percent bioavailability, has a phytate:zinc ratio less than 5 (low in cereal fiber; animal foods major protein source). More recently, Gibson continued, the International Zinc Nutrition Collaborative Group (IZiNCG) developed an algorithm for zinc that is based on more up-to-date whole-day diets only and which includes only two diets, one a mixed/refined vegetarian diet with a phytate:zinc ratio between 4 and 18, the other an unrefined cereal-based diet with a phytate:zinc ratio greater than 18.
New Tools for Estimating Bioavailability Across Countries
Next, Gibson considered several potential tools that might be used to estimate bioavailability across countries in a harmonized manner that allows for cross-country comparisons. These tools make use of available food supply data, either from FAO food balance sheets or the WHO/FAO GEMS/Food cluster diet database, or food consumption data from the FAO/WHO GIFT platform (FAO/WHO, 2017).
The FAO food balance sheets, Gibson explained, are available for 210 countries. They provide per capita values for the supply of 95 food commodities expressed in grams per day and for energy, protein, and fat. These data can also be used for other nutrients, as has been done for zinc and phytate. As an example of data generated from the FAO food balance sheets, she referred to data from Wessells and Brown (2012) on mean daily per capita phytate:zinc ratios and fractional zinc absorption (as a percentage from the available food supply). The data are available by both region and country. The methods and assumptions that were used to generate the data are described in Wessells et al. (2012). The fractional zinc absorption percentages were calculated using the updated trivariate model in Miller et al. (2007).
The WHO/FAO GEMS/Food cluster diet data are from 183 countries. The data have been standardized into 13 cluster diets, providing, again, a means for characterizing data across countries. Finally, the FAO/WHO GIFT platform, in Gibson’s opinion, would be the preferred data to use because it is based on individual dietary intakes by life-stage group. It provides mean daily intakes of standardized food groups in grams per day, as well as nutrients, antinutrients, and food sources of nutrients.
She described several different indicators that could be used to estimate bioavailability, or bioefficacy, by country and life-stage group, when GIFT data become available. These include food-based indicators, either selected food groups (g/day or g/kg body weight/day) or selected foods (e.g., red meat, liver, maize, rice, orange-yellow fruits and vegetables, green leafy vegetables), both of which could be used to estimate iron, zinc, or vitamin A bioefficacy. Or, nutrient-based indicators might include: total protein, indispensable amino acids, or dietary fiber, all of which could be used to estimate the bioavailability of protein; major food and food group sources of nutrient intakes, which could be used to estimate the bioavailability of calcium or vitamin A; or the proportion of iron or zinc from fresh foods, which could be used to estimate iron and zinc bioavailability. Other potential indicators that might be calculable from GIFT data include heme iron and nonheme iron (to provide an estimate of the bioavailability of iron) and phytate:zinc molar ratios or fractional zinc absorption (to provide estimates of zinc bioavailability).
Environmental Factors
Gibson briefly discussed the one environmental factor known to have the potential to influence nutrient requirements: exposure to UV light from sunshine. Specifically, it is known that such exposure influences the extent of endogenous synthesis of vitamin D in the skin. At higher latitudes, where UV light is decreased, less vitamin D is synthesized in the skin and, thus, more is needed from the diet. She added that although there may be other environmental factors that may also influence nutrient requirements (e.g., extremes in ambient temperatures, exposure to high altitudes, exposure to pollution, pesticide exposure), there are not enough data to actually quantify particular effects.
Closing Remarks
In conclusion, first, Gibson thought it important to remember that physiological requirements must be adjusted to dietary requirements to account for bioavailability of certain nutrients. Second, she suggested that current quantitative iron algorithms may have limited use across populations, whereas the Miller trivariate model for estimating bioavailability of zinc does have that potential, particularly with the advent of the new FAO/International Network of Food Data Systems (INFOODS)/IZiNCG phytate database. Third, she encouraged exploring use of food balance sheets, GEMS, and particularly the new GIFT initiative so diets can be classified more accurately in terms of iron and zinc bioavailability in habitual diets across populations. Fourth, she mentioned that the dietary requirement for vitamin D is the only nutrient adjusted for environmental exposure (i.e., UV light) at the present time.
Additionally, she summarized some approaches to consider for harmonizing the adjustment of bioavailability across countries:
- Reach consensus on which nutrients need to be adjusted for bioavailability. Does the list need to be increased?
- Reach consensus on which isotope data need to be selected for bioavailability estimates, in view of the fact that it is now known that there is a big difference between using whole-day diets versus single meals.
- Explore the use of GIFT indicators for classifying diets as low, intermediate, or high bioavailability for iron and zinc across countries.
- Consider calculating dietary phytate:zinc molar ratios across countries using national food consumption survey data and the new phytate database; and exploring application of the Miller trivariate model for estimating fractional zinc absorption across countries.
- Explore the use of GIFT indicators on the major food sources of provitamin A carotenoids to more accurately estimate the bioefficacy of vitamin A across countries.
- Calculate folate bioavailability by taking into account both food folate and folic acid from fortification and supplements, where relevant.
To close, Gibson emphasized that many countries now have national food consumption data available. However, in New Zealand, for example, the statisticians who analyze the data do not really understand their many potential uses. “We could be using these data much more than we have used them in the past,” she concluded.
THE ROLE OF DIET ON NUTRIENT BIOAVAILABILITY: ISSUES FOR HABITUAL DIETS OF ASIAN COUNTRIES6
Umi Fahmida continued the discussion on bioavailability, with a focus on habitual diets in Southeast Asian countries. She noted the tools used to estimate bioavailability in the Asian region are the same as those described by Gibson, with isotopic studies being the “gold standard.” As Gibson had, she also mentioned the FAO food balance sheets, which profile data from 210 countries; the WHO/FAO GEMS/Food cluster diet data from 183 countries; and National Food Consumption Survey (NFCS) intake data from the FAO/WHO GIFT platform, although not all countries are included in the GIFT platform, she noted, including Indonesia. She then went on to share some examples of bioavailability estimates from these different sources.
The Use of Isotopic Data to Estimate Bioavailability
According to Fahmida, iron absorption data obtained from isotopic studies were among the first reference data available for bioavailability in countries across South and Southeast Asia; these were the same data used by WHO/FAO (2004) to develop its algorithm for iron bioavailability. These data indicated that even within a single country, iron bioavailability can differ greatly among different types of diet. In India, for example, Narasinga Rao et al. (1983) reported iron absorption rates of 1.7–1.8 percent for a millet-based diet, 3.5–4.0 percent for a wheat-based diet, and 8.3–10.3 percent for a rice-based diet; in Myanmar, Aung-Than-Batu et
___________________
6 This section summarizes information presented by Umi Fahmida, Ph.D., deputy director, Southeast Asian Ministers of Education Organization Regional Center for Food and Nutrition, Universitas Indonesia, Jakarta, Indonesia.
al. (1976) reported rates of 1.7 percent for a rice-based diet, 5.5 percent for rice diet plus 15 grams of fish, and 10.1 percent for a rice diet plus 40 grams of fish. In Thailand, Hallberg et al. (1974, 1977) reported rates of 1.9 percent for a rice-based diet, 4.8 percent for a rice-based diet plus 100 grams of fresh fruit; and 21.6 percent for rice diet plus 60 grams of fish. This variation reflects the complexity of the diet in Asian countries, Fahmida remarked.
Use of Food Balance Sheet Data to Estimate Bioavailability
Food balance sheet data have been used to estimate energy obtained from animal source foods across Southeast Asian countries, expressed as both total kilocalories per day and percentage energy from animal source food. For example, in Indonesia, only 6.6 percent of energy comes from animal source foods, compared to in Brunei, where 21.5 percent of energy comes from animal source foods. These same data can also provide more specific information for use in estimating bioavailability, Fahmida explained. For example, using 2005 food balance sheet data, Wessells and Brown (2012) estimated percentage of energy from animal source foods (5.8 percent in Indonesia), as well as percentage of energy of zinc from animal source foods (17.5 percent in Indonesia) and zinc fractional absorption rates (28 percent in Indonesia). What is interesting about these data, Fahmida pointed out, is that, although the percentage of zinc from animal source foods varies among countries (e.g., again, with the highest rate in Brunei, where 43 percent of zinc is obtained from animal source foods), the estimated fractional zinc absorption rates are quite similar across countries, for example, 23.5 percent in Brunei, compared to the 28 percent in Indonesia. Fahmida explained that this is because other food components also affect the bioavailability estimate (i.e., the phytate:zinc molar ratio).
Use of Food Consumption Data to Estimate Bioavailability
The problem with food balance sheet data are that they pertain to available food, not actually consumed food, Fahmida continued her explanation. The best estimates for actual intake come from NFCS data. For example, using NFCS data from South Korea and China, respectively, Kwun and Kwon (2000) and Ma et al. (2007) reported information on the bioavailability of iron, zinc, and calcium not just in terms of total intake (10.1 mg zinc per day in South Korea, 10.6 in China; 15.2 mg iron per day in South Korea, 21.2 in China; and 426.5 mg calcium per day in South Korea, 338.1 in China), but also in terms of phytate:mineral molar ratio and the extent to which this molar ratio was above a desirable cutoff. Additionally, both research teams broke down their estimates by life-stage group and by urban
versus rural setting. This breakdown, Fahmida commented, illustrates how different bioavailability estimates can be derived within a single country.
As an example of how NFCS data have been used in Indonesia, Fahmida shared data on estimates of the percentage of pregnant women consuming cellular animal protein (96.0 percent), vitamin C–containing foods (24.2 percent), orange and yellow fruits and vegetables (20.4 percent), and green leafy vegetables (96.2 percent), as well as frequency of consumption per week and median portion size. These data can be used to estimate bioavailability of habitual diet for specific target groups (e.g., pregnant women). She noted that these data can also be broken down by area.
Harmonization in Southeast Asia
In 2005, a report was issued following a series of meetings in Southeast Asia on the harmonization of RDAs (ILSI, 2005). Fahmida shared some conclusions from that report that she said typify the challenge of estimating bioavailability in Southeast Asia. For example, with calcium, it was decided that dietary calcium content was of greater importance than bioavailability, especially because the intake of dairy products in Asia is often very low. Additionally, the report concluded that calcium was poorly absorbed from foods rich in oxalic acid (e.g., spinach, sweet potatoes, rhubarb, beans) or phytic acid (e.g., unleavened bread, raw beans, seeds, nuts, grains, soy isolates); and that data on calcium absorption from specific foods were limited because the effects of absorption modifiers had not been quantified. Given these considerations, the committee decided that it would not consider bioavailability when setting calcium dietary requirements in the region.
For iron, again, Fahmida repeated that diets in Southeast Asia are too complex to estimate bioavailability for all habitual diets using isotope techniques. Although the committee concluded that the development of algorithms was an attractive alternative to isotopic studies, they also concluded that more work was needed to quantify the effects of various components in Asian diets affecting iron bioavailability. For example, while the new phytate database by FAO/INFOODS/IZiNCG will permit estimates of phytate:iron molar ratios from NFCS data, in fact, Fahmida said, tannin is the most important inhibitor of iron. But there is no consensus yet on the analytical methods needed to estimate tannin. In the meantime, the 2005 committee concluded that it is reasonable to assume, based on available scientific data, that iron bioavailability in Southeast Asia ranges from 5 to 10 percent. To account for this range, the ILSI (2005) committee recommended RDAs for iron based on three different levels of bioavailability: 5, 7.5, and 10 percent.
For zinc bioavailability, the committee deferred to the use of food balance sheet data to estimate fractional zinc absorption and also recom-
mended using the FAO/INFOODS/IZiNCG phytate database to estimate phytate:zinc molar ratios from NFCS dietary data. Additionally, they recommended that fractional zinc absorption (as a percentage) be calculated using individual-level NFCS data, using the updated Miller equation (Miller et al., 2007).
Fahmida remarked that, today, each country has its own RDAs, but it is not the values themselves that need to be harmonized, rather, because of the diversity of habitual diets across Southeast Asia, it is the approach to setting these values that needs to be harmonized.
In summary, Fahmida reiterated that iron bioavailability, given the complexity of the diet in Asian countries, is difficult to estimate. While there is the potential to use algorithms, the challenge is in making additional food consumption data available, for example, for tannin intakes. For zinc, while food balance sheet data allow for estimates of fractional absorbable zinc, in Fahmida’s opinion, a better option would be to use NFCS data so bioavailability estimates are based on food intake, not food availability, and will allow breakdown of bioavailability estimates by specific life-stage groups. Finally, for calcium, although calcium is a problem in Asian countries, Fahmida said, data are still insufficient to quantify the effects of absorption modifiers and, thus, bioavailability is not considered when setting calcium dietary requirements in Southeast Asian countries.
DISCUSSION
Following Fahmida’s presentations, she and the other five speakers in this session participated in an open discussion with the audience, summarized here.
The Globalization of Numbers Versus Methods
A question was asked about whether global harmonization is even possible, given the many factors that can influence nutrient intake values. In response, Murphy reminded workshop participants that the goal of the workshop was to consider not global harmonization of numbers, but of methods. She suggested that perhaps an outcome of this workshop would be to consider whether all of the information presented can be compiled into a procedures manual to provide guidance to regions or countries that want to set their own nutrient recommendations.
Kurpad further clarified the difference between approach and value. He said, “There is a way to be global in your approach to setting standards. You needn’t get the same value.” Murphy agreed with Kurpad, then said, “But I think it is easy to listen to this long list of factors and say it is just hopeless to even think about harmonizing.” She repeated that the purpose
of this workshop was not to discuss setting global numbers, rather global procedures for setting numbers, something that she thought is possible.
Nonetheless, the original question led to continued discussion about whether single numbers are possible. Caroline Spaaij pointed out that the United States and Canada together set single values despite variation across such a large region. She asked, “Why wouldn’t it be possible to set a value even at a larger scale?” When Stover responded that he thought the political barriers were much steeper than the scientific barriers, Spaaij agreed, but still questioned why reference values are set at higher or lower levels in different countries. There are other reasons why this is the case other than differences in bioavailability, she opined. For instance, some organizations set reference values based on clinical relevancy in preventing deficiency symptoms, while others set values to be on what she called the “safe side.” The clinical relevancy of the latter is less clear. She added that, at least in the reports that she has examined, most reference values are based on a few critical references repeated across reports. Yet, she said, these same references yield different values in the different reports.
Przyrembel suspected that the scarcity of good data may explain why the same references are always showing up in different reports. Gibson emphasized the importance of using an evidence-based approach and the need to provide countries with advice on how to select studies in the literature from their own countries. For instance, many people are selecting studies with bioavailability data that are based on single meals, rather than on whole-day dietary intakes. If countries were advised on how to select studies and provided criteria, in her opinion, this would really help to reduce some of the discrepancies across countries.
Kurpad questioned whether something more sinister than biology and health might be at play in setting requirements. He agreed with Spaaij that there are agendas behind the setting of requirements. In his opinion, international transparency is probably the best way to sort through this problem.
Bioconversion for Beta-Carotene
Klaus Kraemer commented on the need to address bioconversion in addition to reference values. He pointed to EFSA’s scientific opinion in 2015 to stay with the WHO/FAO 1:6 retinol activity equivalent (conversion of beta-carotene to vitamin A; WHO/FAO has been using the 1:6 ratio since 1967, according to Kraemer), even though the Institute of Medicine suggested a 1:12 ratio. (As summarized in Chapter 7, Emorn Udomkesmalee also commented on the change in use of these two ratios.)
Hidden Issue: Environmental Enteropathy
Additionally, Kraemer commented on what he considered a largely hidden issue: environmental enteropathic disorder. The workshop discussion has addressed infections and specific physiological states, he reflected, but people in many developing countries, because of hygiene, water, and sanitation issues, are experiencing a situation that may lead not necessarily to diarrhea, but to a leaky gut and chronic inflammation which, in turn, significantly affects nutrient demand. “There is very little known about that,” he said.
Calcium Balance in Southeast Asia
Clifton asked if calcium intake is a problem in Southeast Asia. His studies have suggested that one does not need the “Western kind of RDA” of calcium per day (e.g., 1,300 mg) to be in calcium balance and that people with intakes of 300–400 mg per day can be in balance. He wondered whether any calcium balance studies have been done in Southeast Asia. Prentice questioned why such data were even necessary, given the health and longevity of the population even at low calcium levels. Fahmida was not aware of any existing data from Southeast Asia on calcium balance, but repeated that calcium is considered a “problem” nutrient in the region with respect to intake level. Clifton remarked that it is only a problem compared to WHO suggested calcium levels, which he said, were Western based, not Asian based.
Warren Lee referred workshop participants to recent work by Connie Weaver and colleagues. Using isotopes to study absorption, they were surprised to find that Chinese immigrants in the United States required less calcium and could reach calcium balance at a lower level, compared to Caucasian subjects. This is because they have a higher absorption rate and also a lower excretion rate, Lee explained. He cited this as an example suggesting that there might be physiological differences between groups, in this case between ethnic Chinese and Caucasians. In response to Lee, Clifton suggested that baseline diet matters. Among people who drink a lot of milk and have had high calcium intakes their whole lives, their calcium absorption is switched off, essentially. In contrast, among people who do not drink milk, calcium absorption increases. Lee added that similar differences have been found between white and black Americans, with black Americans tending to have higher calcium absorption and also higher bone accretion, even though they have lower calcium intake compared to white Americans. And unlike the ethnic Chinese, he noted, black Americans were born in the United States (implying that their baseline diets are similar).
This page intentionally left blank.


