
8
An Assessment of GIS as a System for Supporting Spatial Thinking in the K–12 Context
8.1 INTRODUCTION
An analysis of GIS as a high-tech support system for spatial thinking in K–12 education is timely because, given the increasing use of GIS in the workplace (government, industry, business, and academia), education and training in GIS is also increasingly important, especially at higher grades. Given efforts to incorporate GIS into the K–12 context (Appendix G), there are some data and experiences with which to assess GIS against the design and implementation criteria for support systems for spatial thinking.
Using the frameworks laid out in Chapter 6, this chapter addresses the question of whether GIS can provide an effective foundation for teaching and practicing spatial thinking in K–12 education. The committee appraises the current status of GIS in terms of (1) the requirements of a system for supporting spatial thinking, (2) the criteria for the design of a support system in the K–12 context, and (3) the criteria for the implementation of a support system in the K–12 context. This assessment is based on readily available versions of GIS. Readily available versions are products that are available off the shelf, not those extended by various scripts, third-party software, or Visual Basic, Avenue, or AML programming. These off-the-shelf systems are the ones that schools and teachers are most likely to use. Software products that are commonly used in K–12 education are listed in Table 8.1.
The products of ESRI dominate the K–12 market and dominate the assessment that follows. However, the results of the committee’s analysis are reflective of the general issues of the design and implementation of a GIS for the K–12 context. The strengths and weaknesses of ESRI products, while specific to those products, would be matched by another set of different but sometimes overlapping strengths and weaknesses reflecting the particularities of another software package. Our purpose is to illustrate the challenges and potentials of implementing GIS in K–12 education and, thus, to answer the charge posed to the committee.
Software changes rapidly, with new releases replacing prior versions and offering increased functionality, capacity, and performance. Thus, this analysis is based primarily on ESRI’s ArcView 3, although the committee recognizes that subsequent releases of ArcView (e.g., ArcGIS, ArcView
TABLE 8.1 Major GIS Software Products Used in K–12 Education
|
Programs |
World Wide Web Address |
|
ArcExplorera |
|
|
ArcView |
|
|
ArcVoyagera |
|
|
Atlas GIS |
|
|
Autodesk Map |
http://usa.autodesk.com/adsk/servlet/index?siteID=123112&id=3081357 |
|
GeoMedia |
|
|
GRASS |
|
|
Idrisi |
|
|
Mac GIS |
|
|
MapInfo |
|
|
Maptitude |
|
|
Mfworks |
|
|
My Worlda |
|
|
aSoftware programs customized for K–12. |
|
9) have addressed some of the design and implementation problems identified here. The point remains, however, that the frameworks for analysis, presented in Chapter 6, are an appropriate way for analyzing any high-tech support system for spatial thinking. Moreover, the types of problems identified by the committee will probably exist until GIS is designed from scratch with students and teachers in mind.
It must be stressed that GIS was not designed with educational applications in mind. It is a working system for the handling and analysis of geospatial data, designed by and for experts. It is an “industrial-strength” system that far exceeds the needs and capabilities of most teachers and students (indeed, most users). Nevertheless, GIS has been and is being used in educational settings, and ESRI itself has been very supportive of such efforts. Thus, the committee’s analysis reflects a transitional stage in the evolution of GIS software. Just as specialized versions have been developed for specific user communities, such as business logistics or infrastructure design, the committee fully expects that versions will be developed with education in mind. These analyses are intended to aid in such development.
This chapter examines the strengths and weaknesses of currently available off-the-shelf versions of GIS as a learning environment. In making its judgment on the capacity (Section 8.2), design (Section 8.3), and implementation (Section 8.4) of GIS as a support system for spatial thinking in the K–12 environment, the committee relies on primarily oral presentations and written statements from system designers, researchers, and school and university educators (Appendix B). Each section follows a similar format. In the case of system capabilities, for example, there are three requirements: the capacity to spatialize, to visualize, and to perform functions. Each requirement is analyzed, and the committee’s observations are summarized in two ways: (1) by means of a list of observations and (2) by means of an assessment table at the end of each section. Based on the results of this analysis of the current status of GIS in K–12 education, Section 8.5 examines organizational models for redesigning GIS software to fit the needs, constraints, and opportunities of the K–12 context.
8.2 THE CAPACITY OF GIS AS A SUPPORT SYSTEM FOR SPATIAL THINKING
For current GIS software products to support the teaching and learning of spatial thinking in the K–12 context, they must have the capacity to (1) spatialize data sets by providing spatial data
structures and coding systems for nonspatial data, (2) visualize working and final results by providing multiple forms of representation, and (3) perform functions that manipulate the structural relations of data sets. The capacity to spatialize data sets motivates the process of spatial thinking, the capacity to visualize is integral to the process of spatial thinking, and the capacity to manipulate structural relations is the essence of spatial thinking. The following sections discuss the extent to which current GIS software products meet each of these three specific requirements of a support system for spatial thinking.
8.2.1 Capacity to Spatialize
Inside a typical GIS, space is defined by a combination of geometry, projection, and registration data. The structures of space and geographic data are so tightly bound in the software that they are inseparable at the application level. This strong bond sets a GIS apart from most other kinds of information systems by providing the infrastructure necessary for the direct support of geographic operations that can be performed on that space (e.g., registration, re-projection, neighborhood and distance calculations, network analysis, spatial interpolation).
Because of the bonds between space and geography, a GIS is a system that is designed to handle geographic data, but in principle, data defined in any spatial domain are also amenable to handling with GIS. The adjective geographic refers specifically to Earth’s surface and near-surface, and the more general adjective spatial refers to any space, including the space of Earth’s surface. Thus, GIS methods have been applied to nongeographic spaces, including the surfaces of other planets, the space of the cosmos, and the space of the human body. GIS has also been applied to the analysis of genome sequences of DNA.
Attempts have been made to estimate the amount of data that are geographic. It is estimated that between 70 to 80 percent of the data generated and used by local government organizations are geographic (Longley et al., 2001). Local governments use geographic data to improve the quality of their products, processes, and services. Typical GIS applications of geographic data include inventorying resources and infrastructure, planning transportation routing, improving service response time, managing land development, monitoring public health risk, and tracking crime. These applications of GIS often require databases that can easily reach a gigabyte or more in size (Table 8.2).
To be used in a GIS, data must be spatialized. Spatialization is the process of attaching coordinate codes to each data item (e.g., x and y in the case of two-dimensional spatial data, or latitude and longitude in the case of two-dimensional geographic data). A GIS does a fine job of spatializing spatial data. Once spatialized, these data can be presented in a visual representation such as a thematic map.
In contrast to spatial data, GIS give limited support for the spatialization of nonspatial data. For example, a GIS can draw a map of the Internet in which nodes are mapped by their geographic location. However, current versions of GIS cannot draw a map of the Internet based on bandwidth
TABLE 8.2 Potential GIS Database Volumes for Some Typical Applications
accessibility or connection speed without “fooling” the GIS into thinking that bandwidth connections are actually “on” Earth’s surface. Unlike GIS, however, visual exploration systems can readily spatialize nonspatial data. For example, they can draw a map of Internet bandwidth connections where nodes with low-bandwidth connections would be far apart and nodes with high-bandwidth connections would be close together. Thus, a GIS can produce a map of the Internet where space is defined geographically, whereas a visualization exploration system can produce a map of the Internet where space is defined by accessibility or connection speed.
Although GIS does support the x and y dimensions, it gives limited support to the z (or vertical) dimension because it uses only two-dimensional surfaces as a data type. For example, GIS cannot represent an overhanging cliff because some points in the x and y dimensions would require more than two z values. Likewise, a GIS cannot represent layered models of the solid Earth, atmosphere, or oceans because z values would be required for each x,y location. Many applications in science and geography also involve the representation and analysis of the vertical dimension in ways that cannot be represented adequately by a two-dimensional surface. This limitation of GIS does not occur, however, in many of the children’s software games that fully support the construction and exploration of three-dimensional structures. For example, using the video game The Sims Superstars, children can design houses with multiple floors and connecting corridors and stairs, promoting the understanding of true three-dimensional structures.
From this analysis, three observations can be made about the capacity of current versions of GIS to spatialize data sets and, hence, motivate spatial thinking:
-
GIS does a fine job if the data are geospatial;
-
GIS provides limited support for the spatialization of nonspatial data; and
-
GIS does not support a true three-dimensional model of space.
8.2.2 Capacity to Visualize
The advent of GIS and computer displays of geographic data has reinvigorated the ancient field of cartography (Longley et al., 1999; NRC, 2002a).They give map designers new potential to express knowledge of Earth’s surface and new powers to display aspects of this knowledge that were previously beyond the powers of traditional graphic visualizations. The term geovisualization captures this new potential and is the focus of an active and growing research community (NRC, 1997, pp. 63–65; http://www.geovista.psu.edu//sites/icavis/).
A GIS is, however, far more than a computer-based map-making machine. It can supplement maps with textual information, digital images, diagrams, and other graphical information. However, the portrayal of information in a GIS need not be limited to visual display. It could, but currently does not, provide full media support (e.g., sound, hyperlinks) to enhance the learning experience by creating an engaging and challenging environment. Full media support would provide more opportunities for self-paced exploration and support for distance or asynchronous learning.
Nonetheless, maps are the primary GIS products. One task of a GIS user is to transform geographic data in digital form into a visual product, a map, that is accurate, informative, and user-friendly. The appearance of data displayed as a map by a GIS is governed by several factors, including
-
the types of display geometry provided (e.g., symbols, line styles, polygonal regions, images);
-
the visual variables that these geometries can support (e.g., size, density, color, shape, texture, orientation; Bertin, 1983) (see Figure 8.1); and
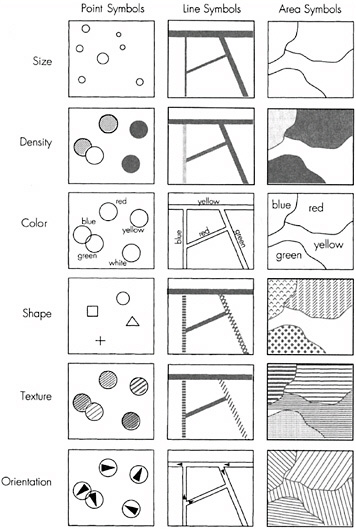
FIGURE 8.1 Six graphic variables that can be used to symbolize geographic phenomena. SOURCE: Bernhardsen, 1999, p. 275. From Geographic Information Systems: An Introduction; Copyright 1999 T. Bernhardsen. This material is used by permission of John Wiley & Sons, Inc.
-
the mapping tools used to assign values in the data to these visual variables (e.g., line thickness, symbol size, color hue).
The cartographic capabilities of most GIS are quite advanced, providing users with perceptually valid color spaces and symbology. Yet GIS are not yet as graphically advanced as information visualization systems (e.g., Advanced Visualization System, Data Explorer) because not all visual variables are under the direct control of the user. GIS provide only a partial set of visual variables to communicate meaning. Some representational techniques are not supported (e.g., transparency, movement, height); others are accessible only via predefined, hard-coded paths. On the positive
side, these paths constrain the options available to users to those that, in the judgments of system designers, make the most cartographic sense in practice. It is, therefore, difficult or even impossible for users to do things to the data that are inappropriate cartographically. By contrast, information visualization systems do not have the geospatial option constraints of GIS. Typically, systems such as Advanced Visualization System or Data Explorer do not enforce projection and registration constraints, thus providing flexibility but also allowing for the problems of misplaced data in the display.
A GIS has the capability to produce high-quality graphical representations, especially maps, making it a potentially valuable support system for the process of spatial thinking in the K–12 context. However, users must be aware of and understand the importance of data quality. Professional-looking final products may conceal data errors. These errors may be referential (i.e., an error in specifying something such as a street address), topological (i.e., a linkage error in spatial data such as an unclosed polygon), relative (i.e., an error in the position of two objects relative to each other), or absolute (i.e., an error in the true position of something such as a floodplain boundary not aligned with property boundaries) (Tomlinson, 2003). Currently, no GIS can automatically handle data error problems in a satisfactory manner. Moreover, products may be graphically misleading. No GIS can guide K–12 operators in the choice of map symbols and other graphic effects.
The process of exploring data on a GIS-produced map could be enhanced if users had real-time control over the visual display. Most information visualization systems provide user interface controls that remain “live” after the display is constructed. This enables users to change the appearance of features in the display interactively (e.g., a color ramp, a size control for point symbols, a transparency control for an image layer). Currently, GIS lack such a capability.
GIS provides poor support for the modeling of time (Peuquet, 2002) and related presentations via animation (MacEachren, 1994). Unlike animation systems such as Director and Flash that explicitly represent time (t) values, existing versions of GIS have no temporal “coordinate” as in x,y,t. Although there are ways to work around this problem, achieved by stacking map layers in a temporal sequence of cross sections that can be refreshed several times per second (Goodchild, 1988), they lead to a noncontinuous sense of time for users. Many important aspects of science and geography revolve around processes occurring through time (e.g., carbon and water cycles, glacial change, migration, urban expansion).
Although GIS lacks the capability to examine processes that occur continuously through time, technology exists for large-scale geospatial virtual representations of the entire Earth over time and in three dimensions. Keyhole Inc. Images (http://www.earthviewer.com) provides users, even those with legacy computers, with access to terabytes of imagery and GIS files to view Earth as a three-dimensional object. Figure 8.2 shows screenshots of Earthviewer (http://www.earthviewer.com), which allows users to zoom smoothly from a whole-Earth view to resolutions as detailed as 1 m and to “fly” over a realistic rendering of Earth’s topography. The data to support these views are fed over the Internet, so a broadband connection is required for adequate performance. Earthviewer and similar developments come close to the vision of “Digital Earth” outlined by former Vice President Al Gore in Earth in the Balance (Gore, 1992). Earthviewer accommodates varying spatial resolutions, building its views dynamically from a patchwork of data obtained from various sources.
8.2.3 Capacity to Perform Functions
As an engine for performing transformations, operations, and analyses, GIS displays its full power for supporting spatial thinking. The earliest GIS was developed in response to the need to make accurate measurements of the size, shape, and characteristics of areas from large numbers of paper maps (Foresman, 1998), a task that is inaccurate, tedious, and expensive when performed by hand. This vision of a GIS as a calculating machine dominated thinking well into the 1990s, and
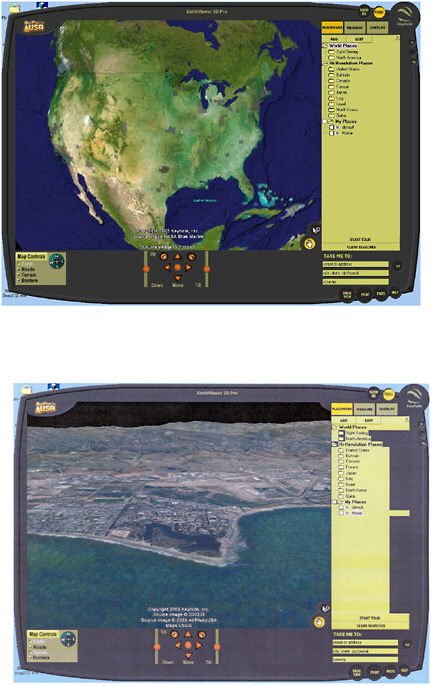
FIGURE 8.2 Two screenshots from Earthviewer. This web site allows users to zoom smoothly from global to submeter resolutions and to combine data from a patchwork of coverages. (a) A continental view, showing the patchwork of higher-resolution data available for U.S. cities. (b) An oblique view of the Santa Barbara coastline, combining high-resolution imagery with terrain. SOURCE: http://www.earthviewer.com/.
by that time, a vast array of techniques had been implemented, either as part of the basic GIS products offered by vendors or as extensions developed by users. Several texts describe the advanced analytic capabilities of GIS (Burrough and MacDonnell, 1998; Fotheringham and Rogerson, 1994; Lee and Wong, 2001). In principle, there is no limit to the range of functions that can be implemented in a GIS, but in practice, priorities are established by the demands of different user communities.
There have been several efforts to systematize the often overwhelming range of functions and to make it easier for users to navigate through them. These efforts range from simplifying schema to interface formats. Tomlin (1990) devised a schema termed cartographic modeling that has been widely adopted as the basis for spatial querying and analysis, despite the fact that it is limited in scope to operations on raster data. The schema classifies GIS transformations into four classes and is used in several raster GIS as the basis for their analysis languages: (1) local operations, which examine rasters cell by cell; (2) focal operations, which compare the value in each cell with the values in its proximate cells; (3) global operations, which produce results that are true of the entire layer, such as its mean value; and (4) zonal operations, which compute results for blocks of contiguous cells that share the same value. The development of so-called WIMP interfaces—based on windows, icons, menus, and pointers—has also helped user interaction, allowing spatial querying and analysis through pointing, clicking, and dragging windows and icons (Egenhofer and Kuhn 1999; Figure 8.3). Nonetheless, navigating through the multitude of capabilities of a modern GIS remains challenging, especially given the lack of a standard nomenclature for operations. Much work remains to be done to simplify user interfaces, standardize terminology, and hide irrelevant detail if GIS is to be adopted widely for use in K–12 education.
A typical GIS can be expected to perform a wide range of transformations, operations, and analyses. Transformations include changes in the map projection or coordinate system. For example, one can change the familiar Mercator projection to one more suitable for areal comparisons, such as the Albers Equal Area, which unlike the Mercator does not distort areas. Transformations might also include conversion from a raster to vector data model, or the reverse. An example of an operation is the point-in-polygon operation, which identifies whether a given area contains a given point. Operations in a GIS may be performed on points, lines, or areas and may involve considerations of spatial proximity or of changes over time. These operations, often highly complex, enable the analysis of spatial data. They can be used to detect whether clustering exists in patterns of points, to select optimal locations for new roads or businesses, and a host of other tasks. More specifically, the major operational functions of a GIS include (1) query, (2) buffer, (3) overlay, (4) proximity, (5) connectivity, and (6) modeling (Box 8.1). Various combinations of these functions are commonly used during the data analysis process.
By and large, the analysis capabilities of a GIS are more advanced than those that will probably be needed in most K–12 education applications. For students, the software’s functionality is generally more complex than is necessary. However, system designers could help students perform analyses with the provision of age- and task-appropriate assistance in the form of wizards, which would guide students through the morass of functionality and options exposed on standard user interfaces.
There is one potential exception to the statement that GIS has more analytical capabilities than most students will ever need. In some desktop GIS, such as ArcView and MapInfo, there is a lack of support for topology, which is the science and mathematics of relationships and is one of the most important parts of geometry. Although topology is a difficult subject, it does present an excellent opportunity to explore and motivate logic-mathematical skills (such as reflexive, transitive, and symmetric relationships).
Where special-purpose analysis capability is missing in GIS, it can usually be added via the API that exposes some of the basic product functionality to a conventional programming language
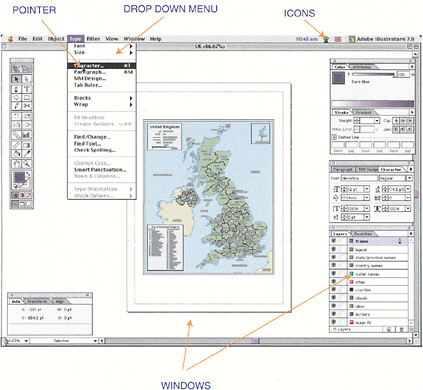
FIGURE 8.3 The WIMP (windows, icons, menus, pointers) environment for computing. SOURCE: Longley et al., 2001, p. 266. John Wiley & Sons, Ltd. Reproduced with permission.
(e.g., Visual Basic in the case of ArcView and MapInfo). Using existing functionality as the building blocks, a programmer can develop special-purpose methods. Both ArcView and MapInfo connect to Visual Basic at the interface level, but the core of the GIS software is not directly accessible. Once new functionality is constructed, it can be made accessible by connecting it with menu items added to the interface. By contrast, a GIS such as Smallworld has a much smaller core, with most of the functionality and interface being developed using a custom-built programming language called Magic. Using Magic, developers can engage in “deep editing” in which the core functionality can be changed or augmented in major ways. The ability to customize software with the use of programming languages to meet the specific needs of students would be valuable in the K–12 context. Customization does, however, place significant demands on the curriculum developer or teacher.
From this analysis, four points can be made about the capacity of GIS to perform functions.
-
GIS is a very powerful tool for performing transformations, operations, and analyses.
-
The capacity of most GIS software to perform functions is greater than K–12 students require.
-
The complexity of existing product functionality is greater than is desirable for the K–12 context.
-
The flexibility to add functionality, although attractive and desirable, may be too challenging in most educational settings.
|
BOX 8.1 Query. A query is a question asked of the support system. For example, a GIS could be asked to show all primary schools, water wells, or markets within a specified geographic area. Queries with more specific conditions might include the following:
Buffer. Buffer analysis is a geographically or temporally constrained version of query analysis. The GIS creates a buffer or boundary of a specified distance (measured in units of length or time) around an object represented as a point, line, or polygon. The buffer is then used to constrain the queries to within that specified distance. The types of questions that might be asked using buffer analysis include the following:
Overlay. This analysis involves the “electronic stacking” of thematic layers of spatial data (e.g., human population, land cover, soils, hydrology) on “top” of each other so that the geographic positions within each layer are precisely registered to all the other data layers in the database (Figure 7.4). Queries that might be answered using overlay analysis include the following:
Proximity. This determines the characteristics of features that are in close proximity (neighboring) to an object or an area of interest. A moving window is used to define proximity; for example, a window might be moved systematically across a data layer to determine the statistical characteristics of the pixels within the window. Connectivity. This is used on vector-based data sets to determine such network characteristics as the shortest route to a clinic. Modeling. GIS can serve as a tool for analyzing processes, analyzing the results of trends, or projecting the possible results of decisions. Changes in the geographic characteristics of features such as size or shape can be modeled over time. For example, land-use changes, such as changing farming practices, can be modeled to predict per-hectare loss of soil over time. SOURCE: NRC, 2002b. |
TABLE 8.3 Assessment of the Capacity of GIS to Spatialize, Visualize, and Perform Functions
|
Requirements |
High |
Medium |
Low |
|
Capacity to spatialize data sets |
|
+ |
|
|
Capacity to visualize |
|
+ |
|
|
Capacity to perform functions |
|
+ |
|
8.2.4 Discussion Summary
Table 8.3 gives the committee’s assessment of the capacity of GIS to spatialize data sets, visualize, and perform functions. Overall, GIS software products possess many of the requirements of a powerful support system for thinking spatially in general and in the K–12 context in particular. However, whether GIS does so in practice in the K–12 context is a function of two additional sets of criteria for its design and implementation. The next section turns to a discussion of the ten general criteria for the design of a K–12 support system and measures GIS against them.
8.3 THE DESIGN OF GIS AS A SUPPORT SYSTEM FOR SPATIAL THINKING IN THE K–12 EDUCATIONAL CONTEXT
Chapter 6 identifies 10 general criteria considered as desiderata for the design of a support system to aid spatial thinking in K–12 education. Here, the committee examines each of these criteria and assesses the extent to which current versions of GIS satisfy them. In essence, this section explores what GIS does well and not so well with respect to each criterion. To organize this assessment, the committee uses the framework established in Chapter 6 in which the 10 criteria are grouped under the headings of (1) meeting educational goals, (2) fitting student needs, and (3) adapted to the educational context.
8.3.1 Meeting Educational Goals
This subsection considers the ability of GIS to meet four educational goals: (1) be supportive of the inquiry process; (2) be useful in solving problems in a wide range of real-world contexts; (3) facilitate learning transfer across a range of school subjects; and (4) provide a rich, generative, inviting, and challenging problem-solving environment for the users of the support system. After considering each goal in turn, the committee provides a summary and an overall assessment of the ability of GIS to meet the four educational goals.
1. Be Supportive of the Inquiry Process. Learning is a process of exploration and discovery driven by curiosity (see the Jerome Bruner example in Chapter 1). Whether in the science or social studies classroom, the inquiry process is the same. Students are expected to
-
develop questions based on their curiosity and interests;
-
acquire data relevant to the questions they have asked;
-
observe and explore patterns and relations within the data;
-
analyze and draw inferences from observed patterns and relations; and
-
generate possible answers and act upon their new understanding.
To be supportive of this process, a GIS analysis would involve several stages: initial assembly of data; addressing issues of transformation to achieve data compatibility; analysis using one or more functions; and preparation of the results for dissemination. As such, GIS has the potential to become an effective vehicle for accommodating the stages of scientific problem formulation and solution. The user, who is able to change direction and retrace steps based on interim results, directs the process of solution. In principle, then, GIS use can reflect many of the ideals of exploration-driven, discovery-based, student-centered inquiry.
In reality, however, current versions of GIS pose problems for student-centered inquiry in the following ways:
-
GIS programs have a tendency to concentrate on the later stages of the inquiry process—analysis, presentation, and communication. They offer limited support for the data exploration stage—hypothesis generation and concept synthesis—upon which the later activities of the inquiry process are predicated. This situation is beginning to change with the inclusion of exploratory visualization techniques into GIS (Gahegan, 1999). These techniques allow the linking together of maps and charts to simultaneously explore spatial and nonspatial patterns in data.
-
Student-centered inquiry benefits from guidance and feedback. GIS software lacks reflective wizards to provide directed feedback. Presently, there are scripting wizards that provide students with prescriptive guidance, but only in the sense of “here’s how to get things done.” Reflective wizards are needed to help students reflect on what is being done, why it is being done in those ways, and what is not being—but might be—done in other ways.
-
Data for use in projects tend to be stored in more than one file. For example, three separate files are needed to view and work with a project in ArcView. These files are .shp (shape file), .dbf (attribute file), and .shx (index file). Lacking appropriate feedback, students tend to copy only one file (.shp) and forget that the other two files are also needed. This situation is beginning to change in ESRI’s new data format where, for clarity, much of the necessary data are contained in a single file.
-
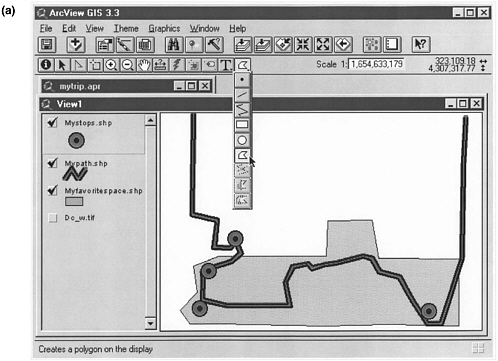
GIS application interfaces do not facilitate multistage inquiry. Two styles of user interface design have dominated the field: the command-line style in which all commands are typed in text form and the WIMP. Both require a substantial commitment on the part of the user to choose and invoke relevant operations. Recently, there has been a movement to a more visual approach, which uses a pictorial interface to design and implement a process of multistage analysis (Figure 8.4). In pictorial interfaces, a box represents every intermediate data set, and arrows represent operations. Interacting with the diagram can lead to change in analyses, and intermediate steps can be recovered when it is necessary to replace one line of approach with another. Pictorial interfaces could make the process of inquiry more explicit and therefore more suited to the K–12 context. There is a clear need to promote pictorial user interfaces for the support of multistage inquiry.
2. Be Useful in Solving Problems in a Wide Range of Real-World Contexts. There is probably no better high-tech support system for addressing spatially explicit real-world problems than GIS. GIS succeeds as a tool for both curiosity-driven scientific research and context-driven problem-solving work because it supports functions that are useful in both situations. For example, ecologists use the perspective provided by GIS both to advance understanding of how organisms interact with each other and with their physical environment and to develop improved plans for wildlife management, based on principles identified by research scientists. Thus, GIS can provide the vital link between science and policy (application). At the most general level, science is interested in principles and laws that are true everywhere, independent of geographic context, and science can be presented as a process for abstracting such truths from their geographic setting.
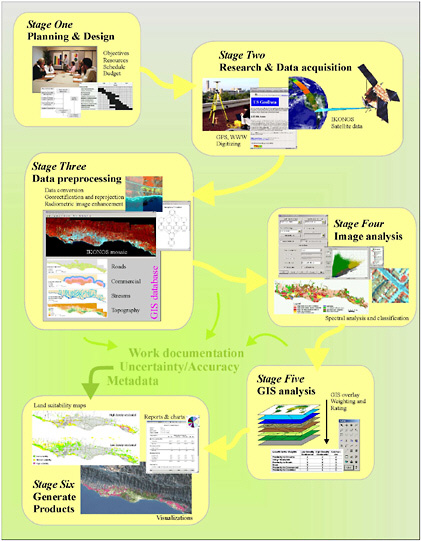
FIGURE 8.4 Multistage analysis in a pictorially based GIS. SOURCE: Hemphill and Herold, 2003.
Policy, on the other hand, takes such principles and laws and puts them back in specific geographic contexts, in order to predict the outcomes of proposed developments or achieve better management of resources. The great bulk of GIS applications are about problem solving in particular contexts rather than elucidating general theories or laws.
In K–12 education, GIS can help students to appreciate and understand both curiosity-driven research and context-driven problem-solving approaches to science. Any tool that serves as a means to such intellectual ends is valuable. Even more valuable these days, when society expects K–12 education to devote attention to social ends, is a tool that can help students address real-world problems.
GIS can enable students to address real-world issues and, at the same time, help to break down
boundaries and barriers between schools and local communities. The Environmental and Spatial Technology (EAST) initiative (http://www.cast.uark.edu/east/) has built on this philosophy by supporting schools with GIS software, data, training, and advice and has achieved success in involving K–12 students in public arenas. The initiative, which encourages spatial thinking through the use of a range of technologies (e.g., geospatial data systems, graphics generators, visual exploration systems) began in 1995 with 20 at-risk students at Greenbrier High School in Arkansas. Through the support of government and corporate partners, the EAST initiative has continued to flourish. More than 200 schools in seven states now participate, involving some 20,000 students in the higher grades. The EAST project is designed to serve a diverse population of students from those who are disadvantaged to those who are gifted. It provides a performance-based learning environment that utilizes problem-based service learning and advanced technological applications. Students, who are trained on-line to use a range of technologies including Intergraph’s GeoMedia, work on real-world problems that can benefit their own schools and communities. To realize the full potential of new technology while enhancing opportunities for students, the EAST project strives to transform the classrooms of schools into information era learning centers.
Recent publications showcase how highly trained and motivated teachers have connected GIS and problem-based learning techniques to address real-world problems (Audet and Ludwig, 2000; English and Feaster, 2003; Malone et al., 2002). For example, Community Geography: GIS in Action (English and Feaster, 2003) presents community projects carried out by middle and high school students. The case studies include mapping and analyzing the patterns of an invasive weed species, mapping the patterns of crime in an urban school neighborhood, mapping the dangers presented by abandoned landfills in the school neighborhood, mapping the characteristics and potential problems of a school’s tree population, mapping seasonal water quality variation in a local river, identifying students eligible to ride on school buses, and selecting potential sites for a parking lot in a wildlife preserve. Teachers served as resource guides and learning facilitators to students who asked questions, acquired the needed resources to study their environment, explored geographic information, and analyzed geographic data. The students presented their results and, in some cases, their recommendations to public officials (Box 8.2). These projects, therefore, provided students with a first-hand demonstration of the link between science and application.
Although GIS can enable students to analyze and understand issues at all scales, the local and state levels offer the greatest opportunity for personal involvement. When students, for example, provide recommendations for community forest planning to their town council, they know that their work made a difference. Students come away from such an experience having acquired not only academic content knowledge, but essential problem-solving skills and practical career skills as well.
There are two qualifications concerning the successful application of GIS to real-world issues in the K–12 context. First, very few teachers and students actually do use GIS in problem-solving contexts because of the still formidable barriers to the use of technology in the classroom (e.g., unreliable computers, lack of time for teachers to learn how to use the software, lack of time in the schedule for students to use computers in class). Second, secondary school students undertake the majority of the problem-solving projects because software developers and educational professionals have failed, for the most part, to provide GIS programs and curriculum materials that are developmentally appropriate for elementary students. The absence of GIS in the elementary grades means that for most students, their first exposure to the capacity of GIS to support spatial thinking may be delayed until their teenage years.
3. Facilitate Learning Transfer Across a Range of School Subjects. The first view of GIS that many users and learners encounter is the layer-cake model (Figure 7.4), reflecting the notion that geography can be expressed as a series of layers: the map of soils, the map of vegetation, the
|
BOX 8.2 Students from 10 Rhode Island communities used an ArcView extension, CITYgreen, to map and analyze trees at their schools. American Forests, a nonprofit citizen conservation organization, developed CITYgreen. Changes in Rhode Island’s state planning guidelines in the late 1990s required every Rhode Island town to include an urban forestry component in its comprehensive plan, but few communities were prepared to do so. Students used GIS to help their own communities meet this state mandate as they simultaneously learned about the urban ecosystem, trees, and the power of spatial analysis in addressing community issues. For example, students at Barrington Middle School prepared a map of trees conflicting with utility lines by digitizing the school building and trees on an orthophotograph of the school’s property. Trees in conflict with utility lines were assigned a different color from other trees to create a thematic map (Figure 8.5). 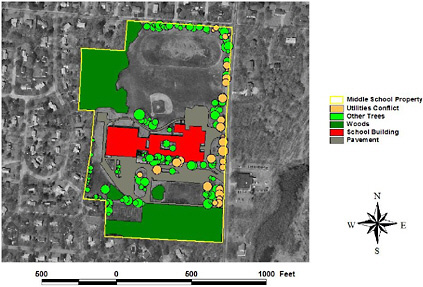 FIGURE 8.5 Trees conflicting with utility lines. |
map of population, and so forth. GIS is often seen, therefore, as an integrating technology, capable of bringing together disparate knowledge domains by means of a common georeferencing system. By overlaying maps, one can investigate the impact of groundwater contamination on residential populations or the influence of soils on vegetation and habitat. The concept of overlay integration can be applied as a metaphor for the processes studied by the different social sciences (Goodchild et al., 2000) Thus, GIS can be a software system to integrate knowledge of economic processes and demographic processes as they simultaneously impact an area or influence its future. However, although GIS can, in principle, facilitate learning transfer across school subjects, there is insuffi-
|
They also queried the data to select all trees that were in poor or dying condition and that conflicted with utility lines or the school building. They converted the selected trees to a new category called “hazardous trees.” With their symbol color changed to purple, the hazardous trees were easily visible on the map (Figure 8.6). The students presented their observations in class, but they also presented the results and made recommendations to the Barrington Town Council. With a new database of tree information and a list of recommendations, the Barrington Public Works Department came a step closer to developing a program of tree maintenance and replanting in the town. SOURCE: English and Feaster, 2003, pp.179–199. 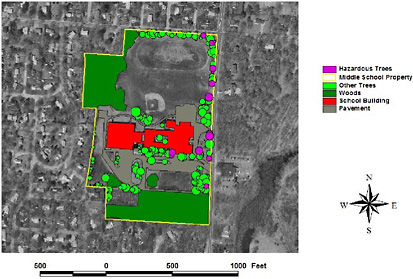 FIGURE 8.6 Hazardous trees: trees in poor or dying condition. |
cient research for us to make a definitive statement about the efficacy of GIS in fostering learning transfer from one subject to another (see also Chapter 4).
GIS has the potential to be a useful tool for learning in a surprisingly large range of disciplines, some of which apparently have no immediate link to Earth’s surface. For example, a chemistry teacher could use a GIS to make chemistry relevant to everyday life, through analysis of maps of hazardous chemicals and the impacts of spills and releases on human populations. Perhaps more powerful, however, is the lesson that students can learn through GIS about the value of interdisciplinary perspectives, as they integrate information from different disciplines. Because GIS are a
means to facilitate interdisciplinary and multidisciplinary learning, they have the potential to be a mainstay cross-disciplinary educational tool like the calculator or word processor.
4. Provide a Rich, Generative, Inviting, and Challenging Problem-Solving Environment. GIS has the potential to provide students in all grades with a rich, inviting, and challenging problem-solving environment. However, existing, professional-level GIS software packages, which take a long time to learn to use to their fullest extent, are too rich as a general tool for the K–12 context. Most of the activities that schools need to support, especially through the elementary and middle grades, could be achieved with software systems that are more lightweight, easier to deploy, easier to use, and free from distracting details. Above all, qualitatively different software packages that are easy to customize would enrich the K–12 learning environment. GIS can be inviting to students because of its potential for display and exploration. However, the lack of support for animation, which helps to illustrate important spatial processes, and the limited support for spatialization of nonspatial data may reduce the ability of GIS to captivate students. Twenty-first century students have grown up in a world of television, video games, and digital images; they are comfortable in the digital world and gravitate toward it. These students are used to computers that provide a high degree of interaction in terms of the display of geographic space (from computer gaming), and for them, GIS may pale in comparison. Educational applications of GIS that use animation software such as Flash or Director would likely have great appeal to many students. Unquestionably, the use of GIS can, with well-trained teachers and well-equipped schools, foster critical thinking and problem-solving skills among students especially when linked with other media and fieldwork. Of equal importance, GIS can also provide students with the IT skills needed in the twenty-first-century workplace (Chapter 5).
Discussion Summary
From this analysis, the committee can make the following observations about the ability of current versions of GIS to meet educational goals:
-
In principle, GIS reflects many of the ideals of exploration-driven, discovery-based, student-centered inquiry. Nonetheless, current GIS is less well equipped for data exploration and hypothesis generation than for data analysis and presenting information. In addition, current GIS is too cumbersome and inaccessible for effective use in K–12 education. User interfaces, the lack of reflective wizards, and multiple files contributing to a single data source are among concerns that diminish the ability of GIS to support inquiry.
-
GIS can enable K–12 students to address a broad range of real-world issues. Although GIS allows students to analyze and understand issues at all scales, it is probably the local and state levels that offer students the greatest opportunity for personal involvement and action.
-
In principle, GIS can foster learning transfer across subjects. However, insufficient research has been conducted to make a definitive statement about learning transfer from one subject to another.
-
GIS has the potential to provide students in all grades with a rich, inviting, and challenging problem-solving environment. However, existing, industrial-strength GIS software packages are too rich as a general tool for the K–12 context.
Table 8.4 gives the committee’s assessment of GIS as a support system for spatial thinking through its capacity to meet educational goals. Overall, GIS rates very well as a tool for students to address a wide range of real-world contexts. It rates least well as a software system that supports the
TABLE 8.4 Assessment of the Design of GIS to Meet Educational Goals
|
Criteria |
High |
Medium |
Low |
|
Be supportive of the inquiry process |
|
|
+ |
|
Be useful in solving problems in a wide range of real-world contexts |
+ |
|
|
|
Facilitate learning transfer across a range of school subjects |
|
+ |
|
|
Provide a rich, generative, inviting, and challenging problem-solving environment for the users of the support system |
|
+ |
|
inquiry process. In principle, GIS is supportive of the inquiry process, but it will become a more effective technology for that purpose when the user interface facilitates multistage GIS analysis.
8.3.2 Being Appropriate to Student Needs
This subsection considers the capacity of GIS to be appropriate to student needs (see Section 6.5): (5) be developmentally and educationally appropriate; (6) be accessible to and supportive of the full range of learners; and (7) be customizable. After considering each in turn, a summary and an overall assessment of the ability of GIS to meet these three needs are presented.
5. Be Developmentally and Educationally Appropriate. The GIS software built by the vendor community is industrial-strength. Designed almost entirely for and by experts, this professional-level software draws from many diverse, powerful technologies and sophisticated knowledge domains that include geography, database design, programming, statistics, remote sensing, geodesy, surveying, spatial analysis, and geometry. As a direct consequence of the history of its design, GIS software has been difficult to learn, complex to use, and difficult and expensive to customize. Appropriate use of GIS often requires at least a rudimentary understanding of many of these knowledge domains, explaining why many users take at least one higher-education course in
GIS and many have degrees or certificates in GIS. Therefore, it is no wonder that initial access to, let alone attainment of proficiency in, GIS technology can seem daunting to the novice user. The learning curve to become a proficient user of industrial-strength GIS software is steep. GIS education is, in many respects, an introduction to a language of specialized concepts. GIS trainees learn to decode such acronyms as DEM (digital elevation model) or DRG (digital raster graphic), and they learn the basis of common coordinate systems such as UTM (Universal Transverse Mercator) or SPC (State Plane Coordinate). While K–12 learners would not necessarily need to know all of these concepts to take advantage of the power of GIS to support thinking spatially, current GIS designs do little to protect users from them.
Developers and designers have thought long and hard about how to simplify GIS user interfaces, and the results are evident in special-purpose, GIS-based products designed for the general public. Consider, for example, ways to handle the idea of spatial scale. Users of MapQuest are shielded from any interaction with map projections or coordinate systems. They encounter scale not in the relatively complex and convention-bound sense of representative fraction (the ratio of dis-
tance on the map to distance on the ground), but as a simple point-and-click stepwise gradation from coarse to fine, labeled “zoom out” and “zoom in.” Microsoft’s Encarta implements the metaphor of a helicopter, inviting the user to raise the helicopter to reduce detail and lower the helicopter to increase it. Scale can also be implemented in terms of familiar objects by presenting the user with an ordered range, from detailed (“enough to see individual cars on the street”) to coarse (“enough to see major cities or lakes”). What is needed, then, is a GIS with a user interface that is built for “ease of learning and ease of use.” To provide a basis for the design of a user-friendly system, research is needed on the functions most frequently employed by teachers and students and on the ways in which those functions are best understood by students of different ages and different skill levels.
If GIS is to move beyond the preserve of the highly trained few, the geographic information software industry needs to respond to a wide range of potential users by developing software tools that are easy, flexible, and interesting to use. Ideally, a GIS designed for the K–12 community would manage, behind the scenes, all details except those of current interest to the user.
In addition to the ideal, at least three other options are possible:
-
A GIS that is a lightweight version of the industrial strength model, one that is specifically targeted to the needs of teachers and students: It would be stripped down in terms of the range of functions presented and the interface would be simplified and more supportive (e.g., through the addition of wizards). This option is unlikely to materialize because the K–12 education market, as currently constituted, is not a significant revenue producer for geographic information software developers.
-
A GIS that enables teachers to hide and expose functionality as needed: A GIS can be customized to remove details that might cause confusion to novice users. At the moment, customization technology (e.g., APIs) is not geared toward the needs of educators, and it is not easy to use without advanced training. However, customization is a place on which to focus future efforts. An example of a software product that is customized to gradually expose the functionality of the user interface is ESRI’s ArcVoyager system (see Box 8.3). This scalable system provides four graded levels of exposure to the user interface, progressively adding more functionality and more complexity in the analysis and display activities.
-
A GIS that uses a component-based system or open system architecture: In this option, applications would be composed of only the most frequently used functions identified by GIS practitioner educators, and data would be developed and deployed separately from the main product. The component-oriented approach offers potential for teachers or students to package GIS functionality into a series of separate miniprograms to meet specific needs. (See Box 8.4 for a description of some advantages of component-based system architectures.)
The component-oriented approach may make it easier to design developmentally and educationally appropriate GIS software for the K–12 context. Ideally, a component-oriented version of GIS would provide a self-contained software application complete with data, documentation, and assessment materials that can be easily accessed, deployed, and evaluated. It could be tailored for use by teachers and students and graded to support increasing levels of skill and experience. Also, it would have to be suitable for use by both secondary and primary school students. Currently, the use of GIS at the elementary level lags far behind its adoption in the middle and upper grades. Software designers should explore alternative interfaces that would be developmentally and educationally appropriate for elementary students. The problem is not that GIS is inherently too complex for younger learners, but that GIS designers have not addressed the needs of this audience. Appropriately designed GIS, which are capable of analyses from the most simple to the most complex, could facilitate the process of thinking spatially from the early through the upper grades.
|
BOX 8.3 ArcVoyager was created by the K–12 Education Group at ESRI in the mid-1990s, at a time when many teachers had little or no experience with computers. The ArcVoyager software program (http://www.esri.com/industries/K-12/voyager.html) is an application of ArcView GIS. Literally, it is a stripped-down version of the industrial-strength ArcView. It is customized in terms of its functionality to give novice users a graduated experience with some of the capabilities of GIS. Consisting of four ramped levels, ArcVoyager takes users from a simple beginner interface called “Exploring Key Concepts: Teach Me” to a fully functional GIS program called “Creating New Worlds: Turn Me Loose.” The program interface and its GIS functionality become gradually more complex as students move through the four levels, allowing learners the opportunity to increase their mastery and comfort level before progressing to the next level. ArcVoyager’s levels differ in terms of the number of buttons or options as well as the freedom users have to see maps versus create their own maps.
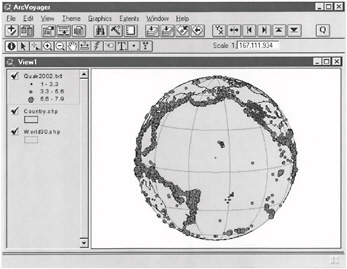 FIGURE 8.7 A screen display from a user-built map generated from Level 4 of ArcVoyager. The user has chosen to display the world data in an orthographic view, centered on 10 degrees north and 160 degrees west; earthquakes have been brought in as a text file and classified and symbolized. |
6. Be Accessible to and Supportive of the Full Range of Learners. GIS use in K–12 education is minimal. However, although the adoption of GIS in schools is in its very early stages, all students—in keeping with the purpose of the No Child Left Behind Act of 2001 (Public Law 107-110)—should have a fair, equal, and significant opportunity to use technology as it becomes available to them.
The general purpose of Public Law 107-110 is “to ensure equal educational opportunity for all children regardless of socioeconomic background and to close the achievement gap between poor and affluent children by providing additional resources for schools serving disadvantaged students” (Public Law 107-110, section 1001). Section 2402 of Public Law 107-110 focuses on improving the academic achievement of differently-abled students through the effective use of technology. The
|
minimal computer skills often have difficulty distinguishing the software installation component of the CD from its HTML-formatted directories of resources, links, and documents. Nonetheless, ArcVoyager was developed as a tool for those K–12 teachers with minimal computer skills. It is “GIS for the masses,” with a large number of potential users but limited functionality. It introduces users to some of the capabilities of GIS and permits them to conduct simple analyses. However, unlike its heavyweight parent, ArcView, ArcVoyager does not introduce users to many of the key GIS terms and concepts (e.g., shapefile, theme, view, table, chart, project) that are needed to understand the operations of a GIS. Thus, for work in the higher grades, students need to know that shapefiles store geographic features digitally as points, lines, and areas (polygons) if they are to use the on-screen tools to digitize real-world features. When advanced students start to use the data capture functionality of ArcView, they can create their own data for analysis and display (Figure 8.8) and then they can begin to use GIS as a powerful support system for spatial thinking. 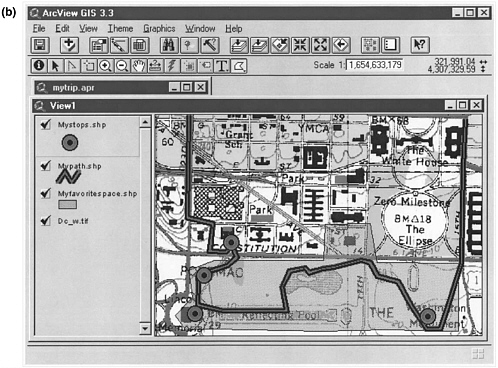 |
primary goal is “to improve student academic achievement through the use of technology in elementary and secondary schools” (Public Law 107-110, section 2402). An additional goal of the act is “to assist every student in crossing the digital divide by ensuring that every student is technologically literate by the time the student finishes the eighth grade, regardless of the student’s race, ethnicity, gender, family income, geographic location, or disability” (Public Law 107-110, section 2402).
The challenge of making GIS accessible to the full range of learners is daunting in its complexity and will require many initiatives including those that “provide school teachers, principals, and administrators with the capacity to integrate technology effectively into curricula and instruction that are aligned with challenging State academic content and student academic achievement stan
|
BOX 8.4 GIS and most other software systems that can support spatial thinking are industrial-strength, monolithic systems. As such, they are designed as stand-alone systems, perhaps with add-ons, but with tightly coupled data structures and control structures. It is usually not possible to break such systems apart into a number of independent components, because each piece is highly dependent on the other pieces. GIS are generally seen as having reached a critical point in their development. They now offer so much functionality and, like many other support systems, are trying to address an ever-broadening set of issues and application domains. Although this functionality allows broad support for a huge number of application areas, it also results in ever more complex APIs, steep learning curves for developers and users alike, and problems with legacy systems. Yet most users of these monolithic systems access only a small percentage of the functions available to them. Throughout the software industry there is a movement away from such monolithic engineering, where the resultant system is a single self-contained program, to a component model where functionality is broken down into small, independently deployable pieces that communicate through well-defined interfaces. This component-oriented model offers two advantages for the design, customization, and implementation of GIS. First, if interfaces are made public (i.e., published), it becomes easier for the value added reseller (VAR) to use the services that the components offer and to construct specific, focused applications that extend the basic functionality. Second, it offers the possibility, for vendors and resellers, to substitute one component for another as long as the new component adheres to the interface specification. Consequently it might be possible, for example, to swap the current map display tool for a new component that produces a highly stylized map or even a synthesized spoken description for the visually impaired. The new version of ArcGIS (9) takes this kind of component-oriented approach (http://www.esri.com), as does GeoVISTA Studio (http://www.geovistastudio.psu.edu). |
dards, through such means as high-quality professional development programs” (Public Law 107-110, section 2402). Nonetheless, progress toward meeting the accessibility goal can be made along several fronts. For example:
• Assisting Visually Impaired Learners. Current GIS rely heavily on visualization at all stages—from input to output. They are not yet amenable for use without sight. To enable such use, alternative access modes—touch, haptics, speech, and hearing—must be incorporated into the GIS interface. The most accessible technologies to facilitate interaction include a haptic mouse, software that converts text to speech, and voice input. Haptic mice, developed mostly for video game use, work on the principle of force-feedback. For example, a simple outline map of a country and its political divisions can be constructed using virtual boundaries consisting of lines of resistance (electronic “forces”) that act both as guides for shape tracing, and therefore learning, and as buffers to inhibit entry into an enclosed area. Therefore, force would have to be exerted on the haptic mouse to enter or exit a region (polygon). Interiors of polygons can be filled with vibratory or tactual shading (hachures, diagonal lines, and different densities of dots). The user feels the surface via the haptic mouse and compares the shading textures and patterns to a legend to identify the information being shown. This is a haptic version of the visual choropleth or isopleth map (Figure 8.9). Text-to-speech conversion software allows a user to listen to written descriptions of materials or to follow sequences of descriptions for comprehending what is being visually represented on screen. Voice interaction relies on speech recognition software that has become commonly available. This provides an alternative to using the keyboard or mouse to enter commands for search and exploration. For example, speech can be used to find locations using simple “up-down-left-right” instructions, or it can initiate requests such as “take me to place x.”
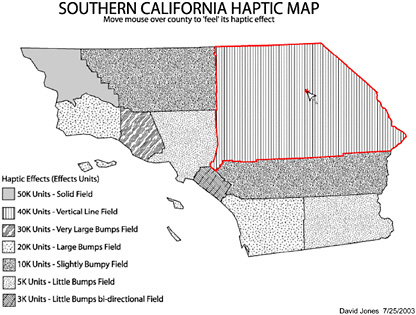
FIGURE 8.9 “On-screen” representation of a haptic choropleth map of southern California. County boundaries (dark lines) are defined by virtual walls to help locate them and to identify size and shape. Interiors are represented by different types of tactile surfaces, which provide vibratory feedback to the user via a haptic mouse. SOURCE: Generated by David Jones as part of the Haptic Soundscapes Project funded by NSF Grant #HRD-0099261. Principal Investigators R. Golledge and D. Jacobson.
Although both the hardware and the software to enable these nonvisual interfaces exist, no current GIS incorporate anything but keyboard or standard mouse interfaces or provide anything but tabular, numerical, text, or visual map-diagram output. Thus the potential exists to make GIS more accessible to the visually impaired. Research and development efforts should explore the capacity and complementarity of text, sound, and other communication channels as GIS input and output modes for those who are visually impaired. Everybody can use these channels, but they are indispensable for the visually impaired.
• Meeting the Needs of English Language Learners. While GIS is rigorous enough to challenge the most gifted students, it is also potentially accessible to students who are non-English speakers. As students whose first language is not English improve their proficiency in English, they are also learning academic content in subjects such as science and mathematics and can learn how to use technology such as GIS. However, if GIS technology is to support students whose command of English is limited, they might benefit from some changes in interface design. For example, first language guides could be provided on what buttons to push. Teachers of Spanish-speaking children in Conroe, Texas, who were introduced to Mapping Our World: GIS Lessons for Educators (Malone et al., 2002) did not want the book itself translated into Spanish. They wanted their students to become fluent in English and technologically literate. In their view, the right level of assistance for
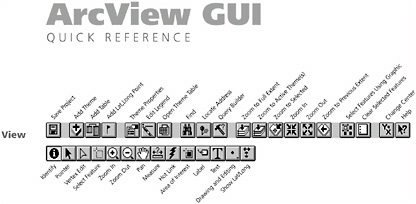
FIGURE 8.10 ArcView Quick Reference Graphical User Interface. SOURCE: ESRI ArcView Software. ArcView Graphical User Interface is the intellectual property of ESRI and is used herein with permission. Copyright © 2002 ESRI. All rights reserved.
students learning English and learning to use GIS is to translate only the ArcView Graphical User Interface (GUI) Quick Reference (Figure 8.10). The translation helped the Spanish-speaking students to know what a button would do and whether they were on the right track. For teachers who use Mapping Our World: GIS Lessons for Educators, this simple interface aid can provide English language learners with an opportunity to use GIS effectively as a support to the inquiry process.
Currently, GIS is not accessible to and supportive of the full range of learners. Few students in the primary grades use GIS. Most students with learning disabilities do not have opportunities to use GIS. In addition, there is an unequal distribution of computing resources among schools, and a critical lack of pre-service teacher training in areas such as spatial literacy, problem-based teaching techniques, and computer skills. Nonetheless, GIS does have the potential to accommodate the full range of learners and to do so in some creative and interesting ways.
7. Be Customizable. Current GIS software products were developed as specialist tools for use in government, industry, and higher education. In such environments, software vendors could assume that sophisticated users were willing to invest considerable time and money in learning how to use a software product and how to customize its interface and functionality as needed. These conditions do not hold generally in K–12 education. In the K–12 context, there is a lack of time and money to learn how to use industrial-strength GIS.
Out of necessity, however, most GIS software used in the K–12 context involves industrial-strength, heavyweight applications that were not designed with students and learning in mind. Exceptions include ArcVoyager (see Box 8.3), a customized version of ArcView, which is designed to help students begin to navigate the world of maps and geographic inquiry through GIS. Another exception is CITYgreen, which is a community forestry application for ArcView developed by American Forests (see Box 8.2). This customized program, which has built-in modeling, statistical, and analytical functions, provides learners with an opportunity to engage in ecological analyses that affect their communities: development, planning, alternative land-use proposals, and the preservation of green spaces.
To help K–12 teachers use ArcView in their classes, ESRI published Mapping Our World: GIS
Lessons for Educators (Malone et al., 2002). It provides customized lessons that lead students step-by-step to create maps. (See Appendix H for an example of students using GIS to understand spatial and temporal variations in rainfall in India.) Students are directed to hypothesize, investigate, analyze, and so on during the procedure of creating a series of maps. However, there is no explicit help for either teachers or students to complete the analysis of the maps and data. Evidence suggests that eighth-grade students, when given proper scaffolding and support, can make effective use of GIS (Baker and White, 2003).
The committee suggests that GIS software products be better adapted to users—both students and teachers—if they are to meet the needs of K–12 education. At present, the onus is on teachers to adapt to software products such as ArcView. If they have considerable knowledge of GIS, they can customize ArcView using its customizing options. If they can apply Avenue, ArcView’s object-oriented programming language, they can also customize ArcView’s GUI. However, the vast majority of teachers do not have the expertise, let alone the time, to use ArcView’s customization functions or Avenue.
Teachers and students would be better served by GIS software tools that are easy, flexible, and interesting to use. This view was shared by those who worked on the Technology in Education Research Consortium’s (TERC) Mapping Our City in the late 1990s. The objective was to apply GIS in various middle school settings. The project leaders concluded that the “out-of-the box” functionality of ArcView should be reorganized to meet the needs of the education community. They recommended organizing tools into three categories—drawing, questioning, and movement—using more intuitive naming conventions and visual cues to aid recognition. The Mapping Our City project employed a tiered format that gradually exposed all of the functionality, not unlike ArcVoyager.
For teachers and students to use GIS effectively, the industrial-strength technology should be simplified by vendors rather than users and third parties. In the committee’s view, the development of a component software application is an attractive option. Software developers in collaboration with the education community should investigate this option. The software must be designed for easy adoption by K–12 users with minimal training. Current versions of GIS, like much software, are too rich for teachers to integrate easily into their classes. Software should be designed to meet two needs. First it must accommodate what teachers need to know in order to feel comfortable teaching GIS. Second it must present what students need to be able to do in using GIS to solve problems. In both cases, the key is selectivity: software designers must distinguish between what is possible and what is necessary in the design of GIS for the K–12 context.
Discussion Summary
From this analysis, the following observations can be made about the capacity of current versions of GIS to fit student needs.
-
Existing professional-level GIS software products are not developmentally and educationally appropriate for the K–12 context. They are too complicated to use throughout all K–12 grades. The software industry should develop tools that teachers and different students find easy, flexible, and interesting to use.
-
Currently, GIS is not accessible to and supportive of the full range of learners, and making it so is daunting in its complexity. Nonetheless, GIS does have the potential to reach all learners, including the differently abled.
-
Existing professional-level GIS is customizable for the K–12 setting. For example, ArcView can be customized to fit student needs. With the use of Avenue, it is possible to customize ArcView’s interface, which opens up opportunities for organizing the data entry process, streamlining related
TABLE 8.5 Assessment of GIS in Terms of Its Appropriateness to Meet Student Needs
|
Criteria |
High |
Medium |
Low |
|
Be developmentally and educationally appropriate |
|
|
+ |
|
Be accessible to and supportive of the full range of learners |
|
+ |
|
|
Be customizable |
|
+ |
|
-
functionality, and creating a more intuitive interface. However, teachers have neither the time nor the expertise to undertake such major customization efforts to meet the needs of their students. Even if teachers had the time and expertise to customize the GIS software, customization would be occurring at the wrong scale, at the retail or school scale, not the wholesale or vendor scale. For wholesale, systemic change, GIS vendors have to develop products that can be readily deployed by the K–12 community.
Table 8.5 gives the committee’s assessment of GIS as a support system for spatial thinking in terms of its appropriateness to meet student needs. Existing GIS rate poorly on the criterion “be developmentally and educationally appropriate.” Because users can in principle customize GIS and because GIS has the potential to reach the full range of learners, it fares better on the other two criteria.
8.3.3 Matching the Educational Context
This subsection considers the capacity of GIS to match the needs and constraints of the educational context. The criteria considered are (see Section 6.5): (8) be flexible enough to be effective in a variety of school contexts and enable a range of modes of use; (9) be quick and intuitive for students and teachers to learn to use; and (10) be robust and realistic in terms of the expectations placed on teachers and the demands on school infrastructure. A summary and an overall assessment of the capacity of GIS to match the educational context follow the discussion.
8. Be Flexible Enough to Be Effective in a Variety of School Contexts and Enable a Range of Modes of Use. A system to support spatial thinking in the K–12 context must have the flexibility to be effective in a variety of configurations because there is no common or universal mode of use. While some students find themselves learning in classrooms with only one computer, others report to classrooms with multiple computer stations. Many schools have computer laboratories where teachers can take their classes for a single lesson, whereas other schools restrict laboratories for use by certain departments. With so many different possibilities, an effective support system must be adaptable in terms of delivery and use. GIS has this essential quality.
Before the popularization of the Internet and the web in the mid-1990s, the traditional mode of GIS use was a single user seated at a desk. The user treated the GIS as a calculating machine designed to perform the kinds of analyses that the user found too difficult, tedious, or time-consuming to perform by hand. However, collaborative technologies are now available to support the widespread sharing of spatial data, map views, and projects via the Internet.
Collaborative technologies raise interesting prospects for the support of interactions at a distance, between students in different locations, or between students and stakeholders interested in
particular problems. Students can exchange data or results and work collaboratively on large-scale projects. For example, one might think of supporting interaction between students and city officials, between students in different parts of the world sharing an interest in a particular environmental problem, or between students in the United States and students in countries that are the subject of instruction. In today’s global and interconnected economy, it would be prudent to consider the use of GIS in collaborative learning projects among geographically dispersed students, as is the case for KanCRN (http://www.pathfinderscience.org) and GLOBE (http://www.globe.gov). Such efforts would enable students to practice valuable workforce skills.
9. Be Quick and Intuitive for Students and Teachers to Learn to Use. An apparent obstacle to the implementation of GIS in American schools is the perception that the tool is a high-end software program requiring a heavy investment of time to learn to use in inquiry-based instruction. Although there is some truth to that perception, this impediment need not necessarily prevent the integration of GIS into the K–12 curriculum. There is a difference between the perception and the reality of the time it takes to learn how to use GIS.
The perception versus reality issue comes down to the question of whether or not a teacher has to have “mastered” GIS before integrating it into the curriculum. Many teachers feel uncomfortable teaching an industrial-strength technology—or any technology, for that matter—that they are just beginning to learn. They look at the range and capability of GIS software, and they find its power appealing. They look at its design, its interface, its specialized language, and they find them intimidating and confusing. They infer that because the learning curve is so steep, it will take them a long time—too long—to pick up the skills to use it on their own.
In reality, few GIS users—in education or any other field—would describe themselves as having mastered this technology. Instead, they would say that they have learned the particular skills they need to know in order to use GIS in a specific context, whether the context is municipal government, real estate, public health, or transportation. If teachers could adopt a similar need-to-know approach to learning to use GIS (and if we could guide them in this process), they would realize that they do not have to be GIS aficionados to use it in the classroom. They just need to know the specific GIS skills and functionalities required of a particular lesson or task. The challenge for designers of education-oriented GIS is to identify those skills and functionalities.
For the successful use of GIS in the classroom, teachers have to know the basic procedures of file navigation and management. In addition to these technical skills, they need to know how to use the basic tools (zoom, pan, identify, find, etc.) and functions (legend editing, querying, buffering, selecting by theme, etc.) of a GIS program. Taken one at a time, each of these skills can be learned rather quickly. Teacher training in GIS has to capitalize on this fact by dividing the many skills and functions into manageable and coherent subsets for teachers to use as a basis for meaningful analysis and problem solving in the classroom. With appropriately sequenced training, teachers can develop discrete GIS skill sets and feel confident that they have the expertise needed to teach a lesson based on those skills. Teachers must be liberated from the anxiety generated by the perception that GIS is a monolithic, highly technical, and very demanding software program that they do not have the time to learn.
At the same time, however, vendors should develop new GIS software packages that are more easily adopted with minimal training by teachers. With more intuitive and user-friendly software, teachers should grow more comfortable with using GIS to support inquiry-based instruction.
Students, like teachers, run into difficulties in using GIS (Box 8.5). Many of the problems involve computer file management. Some difficulties arise because of interferences between what the Microsoft operating system wants and what GIS wants. A systematic research program should be launched to identify the problems that teachers and students face when using GIS and to find
|
BOX 8.5 Four examples illustrate situations in which teachers and/or students encounter problems while working with ArcView software. Each example is keyed to a particular part of the software. A brief explanation of what goes wrong and why is presented, followed by a suggestion on how the problem has been or can be remedied. 1. On or Off Themes. ArcView 3 uses a “View” frame composed of a map space and a “Table of Contents” (TOC). Layers of data, known as themes in ArcView, are either on (and accessible) or off, according to a checkbox in the TOC. Newly added themes are not turned on automatically. Novice users will often wonder what they did wrong or why something fails to work, when all they have to do is turn on the data layer. Figure 8.11 shows the result of adding a theme in ArcView 3. It appears atop the TOC but is not turned on by default. For adults, this sometimes means that they will re-add the theme several times before saying, “Oh, I need to turn it on … duh!” with which students do not have nearly as much trouble. This problem is remedied in ArcView 8, which automatically turns on added features. 2. Active and Inactive Themes. In its mapping space, ArcView 3 relies on a concept of “active theme” (i.e., a data layer against which a process is to be accomplished). The active theme is established by clicking one time anywhere on the name or symbols of that data set within the TOC; an active theme looks somewhat raised or embossed. Novice users attempt to run a process without remembering to specify the active theme. When an unexpected result occurs, users are often baffled until they are reminded by more experienced users to check which theme is active. Figures 8.11, 8.12, and 8.13 show the condition of having 0, 1, or 2 specific themes active. Notice that many buttons and tools are grayed out when there is no active theme, because a process cannot be applied to nothing. ArcView 8 resolves this problem by introducing “right-click” operations, which require users first to identify a theme and then to choose an activity. Figures 8.12 and 8.13 show ArcView 3 after the user has made one theme (Figure 8.12) or two themes (Figure 8.13) active by clicking on their names. 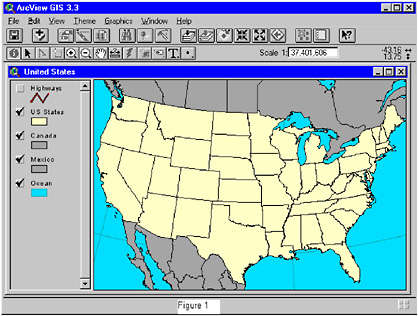 FIGURE 8.11 On or off themes: adding a theme in ArcView 3. The “Highway” theme has been added but is not turned on. No themes are active in this display. |

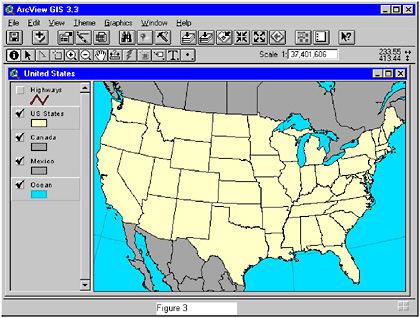
|
3. Logical Queries. In ArcView, a query is a logical statement used to select features or records. A simple query contains a field name, an operation, and a value. In constructing a logical query (e.g., highlight all countries with a birthrate above two per thousand), ArcView 3 provides a query builder tool that relies on carefully constructed independent clauses, in which precise use of punctuation and conjunctions is critical. The procedure typically involves selecting a field from the left column, an operation from the center column, and a value from the right column, thus building a statement in the box below the columns. Users often highlight fields and values without paying attention to the sequence of the phrase being constructed below. Efforts to repair the phrase through typing by hand, rather than selection, are often inaccurate, leading to a signal of “syntax error.” When this happens, novice users try to identify the “single tweak necessary,” even when they may have inappropriately specified logic statements. The recommended approach is always to do as much selection as possible with the mouse and to watch the box being filled in with a text statement. This problem is difficult to remedy without introducing even more opportunities for error. Logical queries can be complex and syntax is critical. Figure 8.14 shows an ArcView 3 logical query window that provides no formal assistance in construction of the query; in this case, the user has single-clicked in the field column at the left, generating the suite of alternative values at right, but there is no firm clue about the nature of the statement desired in the space below. Figure 8.15 shows an ArcView 8 logical query window that operates in a similar fashion but at least provides a modicum of formal assistance with the statement immediately above the box where the query is to be constructed. Contrast these options with a window such as Figure 8.16, in which the user is guided by the window to construct a logical sentence, in this case, “select features of active themes (here, highways) that <<intersect>> the selected features of <<choose: U.S. States>>” (which will generate a selection of highways in Texas). Because logical queries can range from extremely simple to extremely complex, with multiple conditionals and nested elements, attempting to program for simplicity may actually end up introducing confusion or reducing capacity. The ArcView 8 strategy of “beginning the English translation of the sentence” seems a reasonable compromise. 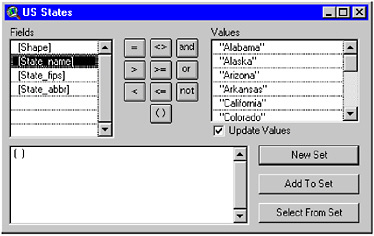 FIGURE 8.14 Logical queries: query window in ArcView 3. |
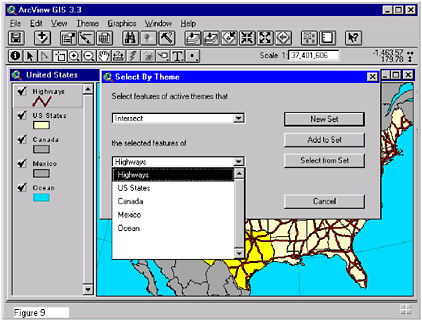
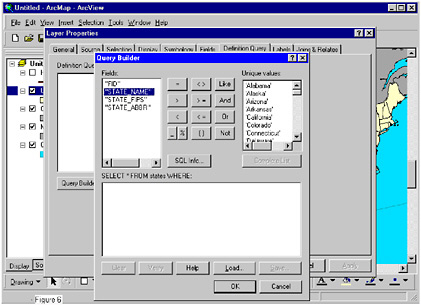
|
4. Zooming In. The “magnify/plus” tool in ArcView 3 operates like a zoom tool in many other software packages. Thus, users click once in the map space to zoom in a specified amount and move the clicked spot into the center. Users can also “click-hold-drag diagonally” to define a box into which to zoom. Attempting to use the “single-click” method, novice zoomers frequently “click-and-wiggle,” unknowingly creating a tiny square that becomes the whole of the rescaled map space, and wonder where their map went, or they create a zoom box nearly matching the size of the original map space, and wonder why no zooming takes place. To remedy this problem, some software packages permit zooms only in specified amounts, perhaps requiring use of a “pan” tool to select a desired site. However, the best remedy seems to be practice or familiarity with the zoom tool. Figure 8.17 shows the ArcView 3 zooming tool, and Figure 8.18 shows the standard procedure. Figure 8.19 shows what happens when a user clicks in a site (such as the center of a state) and accidentally wiggles before releasing the mouse, creating a tiny box, telling the software in effect to zoom into the tiny square. 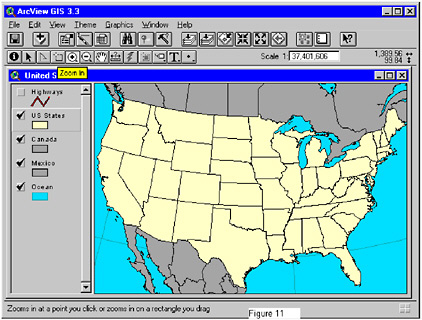 FIGURE 8.17 Zooming in: ArcView 3 zooming tool. |
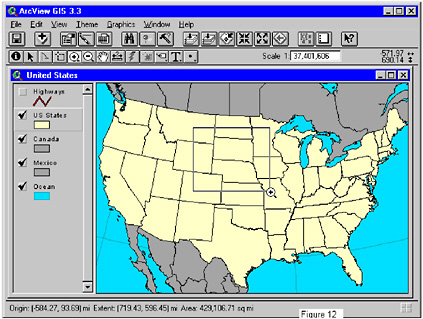
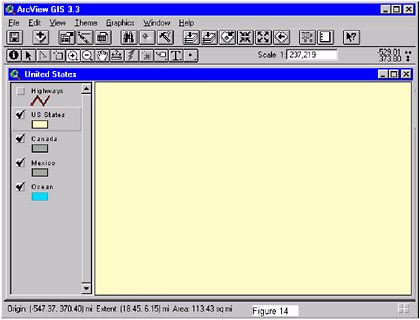
solutions to these problems that are sensitive to the different needs and abilities of teachers and students.
An essential way to spur the learning of GIS by teachers is to devise training programs that will enable them to learn fundamental GIS skills and integrate those skills into their classroom lessons. Such training should be built on teaching a sequence of basic GIS skill sets. Then, combined with the availability of lesson materials that utilize those basic skill sets, teachers would be able to import GIS into their classrooms. However, since the majority of teachers receive little or no training in either basic technology skills (NRC, 2002c) and integrating technology into the curriculum (Fatemi, 1999), it is not surprising that many teachers find out-of-the-box, industrial-strength GIS too complex to use effectively in K–12 education.
10. Be Robust and Realistic in Terms of the Demands Placed on Teachers and on the School Infrastructure. Today’s professional GIS is fully compatible with the standard office computer. However, the majority of schools tend to be considerably behind the cutting edge of computing technology and to have difficulty implementing the kinds of network connectivity typical of the modern office or even of many homes. GIS designers have responded quickly to new computing power, taking advantage of every increase in speed and capacity to increase the power of their products. Thus, there is a significant gap between the capacity of the computing environment available in the typical K–12 setting and the system demands of the latest generation of professional GIS.
A GIS designed to support thinking spatially in the K–12 context would have to address this issue. It would have to be able to run on earlier versions of operating systems that are less demanding of computer resources. It would also have to run on the outdated hardware that is prevalent in all but wealthy schools. Learning modules would have to be compatible with the kinds of network connectivity found in schools and the kinds of Internet access restrictions (for content and security) that schools have put in place.
GIS designers also have to deal with the problem of Windows versus Macintosh operating platforms. (To exemplify the differences between the two operating platforms, the computational requirements of Windows and Macintosh platforms for Idrisi and ESRI’s ArcView family of software are summarized in Table 8.6.) As with most software, the GIS industry favors the Windows platform, so that the latest versions of ESRI software and MapInfo are not available for the Macintosh platform. This is a major problem because many schools are still equipped with Macintosh computers. (ESRI supports both Macintosh and Windows platforms for the older ArcView 3.x system, which requires less computational resources, but offers less functionality.) One solution is to run Windows emulation software on the Macintosh, but this adversely affects system performance. Another option is to move away from locally hosted GIS software and to access GIS functionality via an Internet plug-in working with a remote application server. (ESRI’s Internet Mapping System and MapInfo’s MapExtreme are relevant examples.) Although expensive, remote application servers could be purchased at local or regional school levels.
Besides infrastructure needs, a support system has to be robust and realistic in terms of teacher expectations. In American schools today, several factors combine to impede the implementation of GIS in the classroom and across the curriculum. Among these impediments are ever-increasing expectations about teacher performance and frequently inflexible school infrastructures. Unless the GIS community can successfully address these impediments, the educational use of GIS will continue to be sporadic and unsystematic.
The movement to develop national content standards in core disciplines led to the identification and assessment of benchmark achievement levels at different grades—typically fourth, eighth, and tenth or twelfth grades. In many states and communities, such assessments have become high-stakes tests that can determine school funding, school accreditation, and even the jobs of adminis-
TABLE 8.6 Computational Requirements for Idrisi and ArcView Software
|
Software |
Requirements |
|
Clark Labs’ Idrisi Software (Kilimanjaro Edition) (http://www.clarklabs.org/IdrisiSoftware.asp?cat=2) |
Windows (Idrisi Kilimanjaro): Pentium III or faster PC computer, 128+ MB RAM, minimum XGA (1024 × 768) graphics resolution with 64,000+ colors, running Windows XP/2000/NT4/ME/98/95, 600 MB hard drive space for Idrisi software and data |
|
ESRI’s ArcView Software (http://www.esri.com/industries/k-12/bundle.html) |
Windows (ArcView 8.3): Pentium III or faster PC computer, 128+ MB RAM (recommend 256+), running Windows 2000/NT4/XP, 1 GB or more hard drive space for ArcView software and data |
|
|
Windows (ArcView 3.3): PC computer, Pentium (recommend Pentium III or better), with 32+ MB physical RAM (recommend 64+), running Windows 95 or higher, 200+ MB hard drive space for ArcView software and data |
|
|
Macintosh (ArcView 3.0a): G3, G4, or iMac computer, with 32+ MB physical RAM (recommend 64+ MB RAM), running MacOS 7.1 or higher, 200+ MB hard drive space for ArcView software and data |
trators and teachers. In such an atmosphere, teachers are under pressure to prepare their students for these tests and often feel that they cannot add GIS (or anything else) to the curriculum because it will take time away from essential test preparation tasks. It is imperative, therefore, that we find out whether GIS—in fact, all support systems for spatial thinking—enhance student learning across the curriculum. Thus, the committee advocates that a rigorous study be undertaken by the U.S. Department of Education’s Institute for Educational Sciences to determine whether or not the use of GIS in primary and secondary schools improves academic achievement across the curriculum.
Another issue for teachers is the increasing amount of time taken up with out-of-class responsibilities such as individual education plans, record keeping, conferences with guidance counselors and social workers, and student evaluations. These responsibilities consume nonteaching hours and leave little time for learning GIS or other support systems and for developing appropriate instructional applications. If GIS is to be implemented in school classrooms, teachers will need release time for training and curriculum development. Thus, a supportive professional development structure is essential if teachers are going to be able to incorporate GIS into their classrooms.
The concept of school infrastructure includes physical components such as school buildings, classroom configuration, computer labs, computer software and hardware, local area networks (LAN), wide area networks (WAN), and the Internet, as well as other technology support systems such as printers, scanners, and multimedia stations. It can also include nonstructural and intangible components such as technology support structures, school scheduling, and professional development practices and procedures. Because there are so many variations, it is difficult to generalize about school infrastructure. Thus, it is also difficult to generalize about the school infrastructure needed for the implementation of GIS.
A decade ago, problems related to the physical components of infrastructure were a major obstacle to the implementation of GIS in many schools; there were problems such as inadequate wiring for computer use and Internet access and lack of adequate computers to run the software programs. Although these physical infrastructural problems have not completely disappeared, they
do not pose an insuperable problem to the implementation of GIS in schools. To be sure, some configurations of physical infrastructure are better than others in making it possible for a school to realize the potential of GIS. Physical components that can enhance a school’s GIS capability, such as computer laboratories or plotters, may be beyond the reach of start-up users, but their absence should not prevent the school from the initial implementation of GIS. From the standpoint of physical infrastructure, GIS implementation is now a realistic possibility in most schools in the country. At the least, most schools have the hardware to run software systems such as ArcView 3. However, because of a major digital divide in technology investment, with poorer schools spending far less on technology than richer ones, it will be years before schools with high concentrations of lower-income students can be expected to invest in the hardware to run higher-end software tools. Without initiatives to bring appropriate hardware to schools in lower-income districts, students in poorer schools will continue to be left behind (PCAST, 1997).
If schools have appropriate high-speed access to the Internet, implementation of GIS in the K–12 context is unlikely, in most instances, to be stymied by issues of scalability. In situations where large numbers of students are engaged in collaborative work and are geographically dispersed, the Internet achieves scalability by linking users across a densely connected network, using protocols that ensure messages will pass along links with available capacity. Similarly, small groups of students collaborating over the Internet will not find their communications substantially affected. More problematic, however, are scalability issues associated with large numbers of students attempting to obtain service from a single host GIS or a single data archive, but such problems might arise only if the number of simultaneous users ran into the hundreds of thousands.
Today, it is the intangible part of a school’s infrastructure that is a key to the successful implementation of GIS. Administrative and institutional support is crucial to the integration of GIS into American K–12 education. All too often, GIS implementation in a school comes about because of an enterprising, pioneering teacher, who has invested personal time and effort to make this happen. This teacher becomes the school’s GIS expert, the one who trains and encourages other teachers to adopt the technology, and the one that other teachers look to for data, for solutions to technical problems, and for help in developing projects and lessons. In many instances, the implementation of GIS in a school is dependent totally on the support and guidance of one teacher. The positive benefits of peer support are counterbalanced by the fragility of the situation. If that teacher leaves the school, those roles are vacated and the use of GIS is apt to disappear. Lasting systemic integration of GIS in the school curriculum must be supported and fostered administratively at levels beyond the lone pioneering teacher.
Administrative support means making spatial technologies a priority for the school’s technology support system—from personnel to purchasing. Technology coordinators must be conversant with GIS technology, its requirements, and its use so they can provide the expertise and support that the pioneer teacher once provided and more. Administrative support means exploring flexible scheduling options to provide blocks of time for GIS implementation other than the traditional 45-minute period. Finally, administrative support means providing meaningful, ongoing professional development rather than one-shot training events. Professional development may take the form of peer coaching, released time for curriculum development, funding for on- and off-site training, or hiring spatial technology consultants to mentor new users. School administrators are the decision makers whose support means the difference between real and lasting change or temporary change that is wholly dependent on one or two individuals. Such real and lasting change is entirely possible if GIS proponents can educate administrators about the potential of GIS to enhance student learning.
TABLE 8.7 Assessment of GIS to Match the Educational Context
|
Criteria |
High |
Medium |
Low |
|
Be flexible enough to be effective in a variety of school contexts and enable a range of modes of uses |
+ |
|
|
|
Be quick and intuitive for students and teachers to learn to use |
|
|
+ |
|
Be robust and realistic in terms of the demands placed on teachers and on school infrastructure |
|
|
+ |
Discussion Summary
From this analysis, the following observations can be made about the capacity of GIS to be adapted to the educational context.
-
GIS is flexible and scalable enough to be used in a wide variety of school contexts from the one-computer classroom to classrooms or laboratories with multiple computer stations. The support system can serve the needs of a single user seated at a desk or act as a medium for collaborative networked learning among geographically dispersed students.
-
Professional-level GIS is neither quick nor intuitive for students and teachers to use as a support tool for spatial thinking. Teachers, more often than students, have a hard time learning how to use the software.
-
Most schools are behind the cutting edge of computing technology. Therefore, a GIS designed to support spatial thinking in the K–12 context would have to run on the types of hardware often found in schools. Besides the existing gap between the computing environment available in the typical K–12 setting and the demands of the latest generation of professional GIS, stumbling blocks to the implementation of GIS are the ever-increasing expectations about teacher performance and frequently inflexible school infrastructures. Increased demands placed on teachers leave them with little time to learn GIS and develop applications. All too often, GIS is implemented in a school because of a pioneering teacher rather than a supportive school administration.
Table 8.7 gives the committee’s assessment of GIS as a support system for spatial thinking through its ability to match the needs and constraints of the educational context. GIS rates well as a tool that can be used in a variety of school contexts and enable a range of uses, but it rates less well on the other two criteria. GIS is not a tool that is quick and intuitive to use. GIS is not robust and realistic in terms of the demands placed on teachers and the demands placed on the school infrastructure system.
8.4 THE IMPLEMENTATION OF GIS AS A SUPPORT SYSTEM FOR SPATIAL THINKING
Chapter 6 identifies five tightly linked and interdependent components that must be addressed if GIS is to be implemented successfully as a support system for spatial thinking. The five components are material support, logistical support, instructional support, curriculum support, and community support.
8.4.1 Material Support
Access to computers and telecommunication networks is essential for both teachers and students to make use of GIS as a learning tool for spatial thinking in K–12 education. Although instructional computers have been present in most American schools for nearly 20 years, their use was limited by the small number of computers compared to the number of students. Today, public schools have an average of one instructional computer for every six students, which is close to the ratio of four to five students per computer that “many experts consider to represent a reasonable level for the effective use of computers within the schools” (PCAST, 1997, p. 21). Nearly every public school—regardless of level, poverty concentration, and metropolitan status—is connected to the Internet, and two-thirds of them are connected to the Internet by dedicated-line network connections (NCES, 2000a). However, the use of these lines may well be for administrative rather than academic support.
Although nearly all public schools have access to instructional computers and the Internet, there is much variation in their availability. For example, medium to large schools have a greater number of students per computer with Internet access than small schools, and urban schools have a greater number of students per computer than rural schools. The largest variations occur in schools with varying degrees of poverty. Schools with the highest concentration of poverty have the most students per instructional computer (NCES, 2000a). Moreover, poorer schools spend far less on computer technology than richer ones, making them less likely to be able to acquire the latest computers as they emerge in the future (Anderson and Becker, 2001).
As the availability of computers and network connections in schools and classrooms has grown, so has the number of teachers and students using them and the frequency with which they use them (Levin et al., 1999). Despite such increases, only about 50 percent of the teachers with instructional computers available in their schools use digital software for instruction (Smerdon et al., 2000). This modest figure is attributed to the relative neglect of spending for software and technology support (Anderson and Becker, 2001). The types of software that teachers use most in their classes are word processing software for composing and editing text, CD-ROM reference software, and World Wide Web browsing software (Becker et al., 1999). Only the more computer-skilled and enterprising teachers in schools with above-average computing environments use technology in more innovative ways (e.g., using software to solve problems and to analyze and display data) (Becker et al., 1999).
For teachers to integrate GIS into instruction, they must have adequate numbers and types of computers. The majority of schools have adequate hardware and network connections to run current versions of GIS and the connectivity to download data. However, only a handful of schools have a laboratory dedicated to GIS. The majority of schools have dedicated writing laboratories or computer science laboratories, but it is difficult for classes in other subjects to gain access to them. With the growing importance of geospatial technologies in the workplace and in everyday life, consideration should be given to the creation of laboratories in schools that are dedicated to tools such as GIS.
If schools are to implement more than stripped-down versions of GIS, software designers have to depart from their normal assumptions. Typically, their assumptions are based on the ability of the user community to afford the latest computers and their willingness to replace existing ones every two to four years. These assumptions are invalid in the K–12 context for all but the wealthiest schools; so a change in mind-set will be needed if GIS is to be implemented in an equitable manner.
Most software packages (e.g., Idrisi, MapInfo, ArcView) have been developed for professionals in business and government and, in education, for the higher education market. The lack of GIS software designed for the K–12 market is perhaps not surprising given the relative lack of penetration of GIS into school education. Yet without the provision of software packages that are develop-
mentally and educationally appropriate for K–12 students, the effective use of GIS in and across the school curriculum will be stymied at all levels, especially the elementary level.
However, much learning about GIS—and indeed spatial thinking—can be achieved without the support of computers, network connections, and software. As argued in Chapter 6, spatial thinking must be supported by tools that range in character from low to high tech. Indeed, it can be asserted that tasks are learned better when first performed by hand (Linn and Hsi, 2000). Instructors in statistics and mathematics have commonly made this contention. They would insist that all calculations first be performed by hand in order to encourage students to learn and understand all aspects of the process. In principle, there is nothing a computer can do that a person cannot do by hand given enough time. Complex tasks such as inverting a matrix can be scaled down to be possible by hand within reasonable time limits (e.g., invert nothing larger than a 3 × 3 matrix to learn the process, and use a computer to invert everything larger).
On this same basis, all GIS operations can be emulated and should be learned without computers, but the full power of GIS will be evident only to students who can experience the real thing. Some GIS concepts and some aspects of thinking spatially can be learned with pencil and paper, and with overhead projectors and transparent maps. To date, however, little research has been conducted to identify such concepts and to design appropriate teaching materials.
8.4.2 Logistical Support
Computing equipment requires continuous maintenance, particularly in educational settings where it is often outdated and unreliable and where stress on it is greater than in the single-user professional office. Students are also, perhaps, less tolerant than professionals of the inevitable malfunctions and computer crashes, but instructors often assert that such failures are a valuable part of the learning experience. In principle, GIS applications should not be any more stressful on hardware than any other technology a school might implement.
However, in many school systems, the logistical support network is spread dangerously thin, with one or two people expected to provide assistance to multiple schools or designated classroom teachers expected to provide assistance to their building colleagues in one or two nonteaching periods during the school day. All too frequently, frustrated teachers cannot get a GIS program started because they do not have the appropriate technical support. In addition, security concerns result in delays and rules. For example, some teachers have to obtain permission to install GIS software and students must apply for permission to use certain directories on the computer in order to complete their work and save their personal settings. These kinds of stumbling blocks create barriers to the adoption and integration of technology into the school curriculum.
For successful GIS implementation, each school requires a technical support team that addresses two needs. One need is for a “nuts-and-bolts” technician, who is charged to make sure that hardware, software, and networks are operating correctly. The other need is for an educator to help teachers teach with technology through activities such as team teaching, peer coaching, software training, and resource management. A school that meets these needs will likely foster successful GIS implementation.
Technical support for GIS in schools is problematical. Industry pays hefty maintenance fees for access to graded service contracts for technical support. This support is labor intensive and, thus, expensive for vendors to provide. Schools cannot afford the maintenance fees that businesses can afford to pay. Consideration has to be given to increasing per-student technical support expenditures in American schools. Presently, an average of 20 percent of the technology budget is spent on support, compared to 73 percent for hardware and 7 percent for software (Anderson and Becker, 2001).
GIS vendors (especially ESRI through on-line training sessions, conferences, and the promotion of “GIS Day”) provide considerable logistical support to schools. Traditionally, they have been highly active in encouraging schools to adopt GIS and in offering heavy discounts on software. Several statewide agreements have been made to provide access to proprietary software and data for any school in the state. However, such agreements have occurred in the absence of GIS designed specifically for schools. A specialized GIS to support thinking spatially in K–12 would require a specialized business plan and continuous technical support that would provide an adequate return to the designers and developers and adequate performance for schools at affordable prices.
8.4.3 Instructional Support
Teacher training is fundamental to the successful implementation of GIS as a support system for spatial thinking. Pre-service and in-service teachers should acquire training in basic GIS skills (see Box 8.6) and how to use the technology effectively in the classroom. With this training, teachers are more likely to be comfortable using the technology in their instruction.
Given appropriate technical support and training, we can imagine the characteristics of a
|
BOX 8.6 To be successful with GIS in the classroom, teachers do the following:
|
successful GIS classroom teacher. Ideally, such teachers infuse the technology into the curriculum rather than making the technology an end in itself. They have training in both curriculum integration and basic technical skills. These well-trained teachers, who use GIS regularly in their classes, are comfortable with problem-based learning and inquiry-based learning and they are knowledgeable about the subject matter they teach. (GIS is not restricted to the geography classroom: indeed its greatest impact will be in school subjects such as science and mathematics.) In addition to appropriate teaching methods and subject matter competency, these teachers have acquired basic GIS skills. They are comfortable with file navigation and management and with databases. They are adept at visualizing, sorting, classifying, querying, selecting, subsetting, and combining data. They know about important GIScience issues such as data currency, data accuracy, data format, projection, scale, and representation issues. These teachers also appreciate that many students, even in early grades, may have more computing skills than they do.
Rarely do pre-service teachers have an opportunity to learn GIS and how to use it in class. Only about 10 percent of pre-service teachers are even introduced to GIS, and only a few institutions such as the University of Minnesota’s School of Education offer a teacher training course in GIS (Bednarz and Audet, 1999). Consequently, the most common way for teachers to learn GIS is through in-service teacher training courses. Although there is as yet no formula for successful professional development in GIS, there are lessons to be learned from the experiences of teachers who have become GIS users and from GIS teacher trainers. Teachers who have a one- or two-day GIS training experience and then return to their schools without receiving subsequent contact or support are unlikely to use GIS with their students. In one or two days, trainers can provide hands-on practice in basic GIS operations and can demonstrate examples of the power and potential of GIS in the classroom. However, trainers cannot provide the foundation that most teachers need in order to integrate GIS into the curriculum. To be successful, teacher-training courses in GIS have to combine training in basic technical skills with curriculum integration in content areas. Moreover, the training should be ongoing. Whether the initial experience is a short introduction to the technology or a lengthy training in GIS and curriculum integration, a key to successful teacher training is for participants to know that there will be instructional support for implementation and opportunities to address procedures and problems after the course ends.
Without effective teacher-training courses, most teachers are ill-prepared to incorporate GIS and other digital technologies into their classrooms. According to a survey conducted by the National Center for Education Statistics, only 1 in 10 teachers felt very well prepared to integrate technology into his or her teaching methods (NCES, 1999). Slightly more than half (53 percent) of the teachers surveyed felt somewhat prepared to integrate technology into their classes, and 13 percent stated that they were not at all prepared (NCES, 1999) (Figure 8.20). Whether teachers use GIS or other digital technologies in their classrooms depends heavily on the amount and type of professional development they receive. Teachers who receive 11 or more hours of curriculum integration training feel much better prepared to integrate technology into their lessons than do teachers who receive fewer hours of training. Teachers who receive both basic technology skills training and integration training tend to feel better prepared than those who receive only one type of training (Fatemi, 1999). While teacher training has a big impact on the use of computers in the classroom, the number of years of teaching experience appears to make little difference. Teachers with 5 or fewer years of teaching experience are no more likely to use computers in the classroom than teachers with 20 or more years of teaching experience (Fatemi, 1999).
In recent years, many efforts have been made to provide professional development opportunities for teachers and support for GIS use in the classroom. For example, the Earth System Science Internet Project (ESSIP) at the University of Wyoming provides teacher-training courses in the use of GIS technology. GIS vendors have been active in providing opportunities for K–12 teachers to acquire and use their software, and to present their results. Intergraph
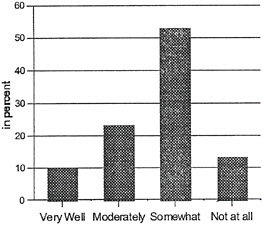
FIGURE 8.20 Teacher’s feelings of preparedness to incorporate digital content into their classrooms. SOURCE: NCES, 1999.
(http://www.intergraph.com/schools/), Idrisi (http://www.clarklabs.org/), and ESRI (http://www.esri.com/industries/k-12/atp/courses.html) are among software vendors that offer GIS teacher training courses. Organizations such as the National Center for Geographic Information and Analysis (NCGIA) (http://www.ncgia.ucsb.edu/) provide teacher workshops. The National Science Foundation (http://www.nsf.gov/) has a history of funding educational initiatives such as the Technology in Education Research Consortium (TERC) (http://www.terc.edu/) Mapping Our City project and the Extending Scientific Inquiry Through Collaborative Geographic Information Systems (http://www.gis.kuscied.org/) program to promote the use of geotechnologies in K–12 science education. The National Geographic Alliance network (http://www.nationalgeographic.com/education/) has been active in enhancing GIS opportunities in many states.
The professional development effort, however, has serious shortcomings. It tends to concentrate on technical skills and pay insufficient attention to curriculum integration. The focus is on higher grades. The effort is minuscule in relation to the size of the K–12 sector and the number of subject areas with potential interest in GIS. Moreover, the effort is uncoordinated, haphazard, and based largely on a few enthusiastic, pioneering champions. Clearly, the vast majority of teachers and, therefore, children are being left behind in terms of their exposure to GIS as a tool to support spatial thinking.
8.4.4 Curriculum Support
At present, there are no voluntary national or state spatial thinking content standards. Consequently, there is no leverage to integrate a suite of low- and high-tech tools to support spatial thinking as part of a larger mechanism for systemic change in American schools. If written, spatial thinking standards would provide an opportunity for spatial thinking to be recognized as crucial across the curriculum in K–12 education and would specify what students must know and be able to do throughout their school careers. Standards would offer an educational goal toward which all students would strive and a benchmark against which teachers could measure student performance. The standards must also be linked with the development of tools for assessing levels of student performance in spatial thinking. Although the standards would provide the basis for a scope and sequence document, they would not constitute a curriculum. The committee urges that consider-
ation be given to the development of spatial thinking standards and assessment tools. In their absence, the systematic incorporation of GIS and other support tools for spatial thinking across the K–12 curriculum will never occur.
Because of the absence of spatial thinking standards, there is little incentive to develop a curriculum and curriculum materials to support spatial thinking skills and abilities through the use of GIS. However, there are programs and projects that do generate GIS learning materials; these generally support the existing curriculum and are designed primarily for the middle and high school grades. These materials have come in part through a top-down process, in which experts develop and test learning modules, and in part from peer-to-peer exchange, in which teachers develop, test, and share materials among themselves. A sharing infrastructure exists to support both modes, through Access Excellence (http://www.accessexcellence.org) and the Digital Library for Earth System Education (DLESE; http://www.dlese.org). DLESE has more than 3,000 items indexed and described in terms of age applicability and subject, and most of the items are designed for K–12 education (Figure 8.21). In an initiative similar to DLESE, ESRI’s Geography Network site (http://www.geographynetwork.com) links a large number of resources, including data sets and functionality, but it is not specifically organized around educational needs (Figure 8.22). A welcome addition to these initiatives would be the creation of a central clearinghouse for GIS educational materials.
A variety of GIS-based curriculum materials, courses, and competitions are available, and they offer some support to middle and high school teachers who have implemented GIS. Examples follow.
Curriculum Materials. Examples of GIS materials for teachers and students that can be integrated into the existing curriculum include those developed by the Saguaro Project (http://saguaro.geo.arizona.edu), Kansas Collaborative Research Network (KanCRN; http://kangis.org/lessons), Missouri Botanical Garden (http://www.mobot.org), and ESRI (http://gis.esri.com).
The Saguaro Project has developed modules on cyclones, the dynamic Earth, and hurricane hazards. KanCRN provides two modules, one that spatially relates tornadoes and average jet stream positions and another that analyzes leaf samples for ozone assessments. The Missouri Botanical Garden has developed six natural science modules. Each module comes with a tutorial and data set as well as instructions on how to view data and conduct analyses using GIS. ESRI has developed materials that both promote its GIS software and support the teaching of science, social studies, and community-based studies through GIS. ESRI’s ArcLessons web site offers 110 downloadable lessons covering a range of topics from social studies to life sciences (http://gis.esri.com/industries/education/arclessons/titles_only.cfm), and the Explore your World web site offers 50 lesson plans for use in the classroom (http://www.esri.com/industries/k-12/download/docs/explore.pdf). Mapping Our World: GIS Lessons for Educators (Malone et al., 2002) teaches how to use GIS software through standards-based lesson plans. Community Geography: GIS in Action (English and Feaster, 2003), which assumes that teachers and students are already using ArcView, contains case studies of community projects completed by U.S. students.
Courses. Digital Quest’s (http://www.digitalquest.com) SPACESTARS program and the Looking at the Environment (LATE) project (http://www.worldwatcher.nwu.edu/late/LATEpublicpage/index.html) have developed courses for the upper school grades.
Digital Quest’s SPACESTARS curriculum consists of three turn-key GIS related courses for grades 9–12. The courses, which provide an introduction to GIS and working with GIS, are based on the terminology, key concepts, and core applications of social studies and science topics. The purpose of the SPACESTARS courses is to teach decision-making and problem-solving skills using GIS. The courses, which are tailored to the school and other regional contexts, are intended to
FIGURE 8.21 Browsing the DLESE library for educational resources by subject. The source of this material is the DLESE web site at http://www.dlese.org. All rights reserved.
prepare students for the “cross-curricular” world of work by implementing interdisciplinary teaching methods in three ways: through cross-disciplinary core subject matter, interoccupational skills instruction, and utilization of multidisciplinary data.
LATE has created and tested a one-year high school environmental science course that uses geographic visualization and data analysis tools to promote an inquiry-based approach to science education. The curriculum is designed to implement national content standards for science, geography, and technology. The curriculum is made up of four units that explore environmental issues at all scales. The first unit—populations, resources, and sustainability—introduces the techniques that students will use throughout the year. The second unit—meeting the demand for energy—focuses on electrical power generation, growing energy demand, and associated environmental consequences. The third unit deals with managing water resources. The final unit, investigating the local environment, provides students with an opportunity to conduct field work and to use geographic and attribute data from their own community to investigate a local environmental issue. Each unit has a culminating activity that allows students to analyze data and develop a set of recommendations using GIS.
Competitions. Community Atlas (http://www.esri.com/industries/k-12/atlas) and My Community,
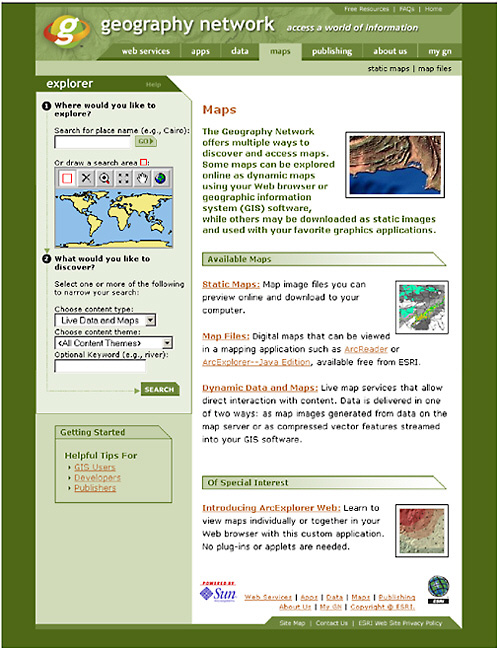
Our Earth: Geographic Learning for Sustainable Development (MyCOE; http://www.geography.org/sustainable/) are projects designed to encourage students and teachers to use GIS in pursuit of curriculum-related goals.
This description of some of the largest and best-known GIS education efforts by the private sector and academic institutions illustrates the diversity and creativity of efforts to infuse GIS into the existing school curriculum. These much-needed efforts, though uncoordinated, have produced some high-quality and challenging learning materials that are helpful to pioneering teachers. Enthusiastic teachers who have implemented GIS have done so through a reorganization of their curriculum and a shift to problem-based learning (Bednarz, 2000; Donaldson, 2001). However, because of the current emphasis on high-stakes testing in only a few school subjects, most teachers are reluctant to reorganize the curriculum for their students.
Clearly, it will be difficult to integrate GIS and other support tools into the instructional process without the muscle of national spatial thinking standards and assessments. If spatial thinking standards were enhanced by the addition of GIS content and performance benchmarks or indicators, it would reinforce the concept of teaching with GIS instead of teaching about GIS. Spatial thinking standards would legitimize GIS as a support tool that can foster and strengthen critical thinking, analysis, and problem-solving skills. Standards would lead to the development of new curricula that are appropriate in terms of scope and sequence and that use GIS as part of a suite of tools to support spatial thinking across a range of subjects.
8.4.5 Community Support
Before there can be community recognition of the educational value of GIS, there must be community recognition of the universal practical value of GIS. GIS is not yet a household word and it is often confused with GPS. At best, most people think of GIS as “map stuff,” a way of producing maps. A major task for proponents of GIS in K–12 education, then, is to find a way to raise awareness of the analytic power and utility of this technology among the general public.
One way to raise awareness of the power of GIS is for schools to undertake community service projects. The following examples illustrate how students working with GIS made a difference in their communities.
-
Reducing crime: Students in grades 10 through 12 at Bishop Dunne Catholic School in Dallas, Texas, put GIS to work to answer the simple questions of where and when the Dallas Police Department should assign task force patrols in order to reduce crime. After acquiring robbery data from the police department, students geocoded robberies to create points, calculated robbery surfaces, identified hot-spot areas, digitized task force patrol zones, and created daily robbery maps. Next, the students analyzed the geographic patterns. The analysis indicated the most effective patrol areas and times. Finally, recommendations were provided to the police department, and when they were applied, there was a reduction in crime. As a result of the success of the project, the students continue to work with the Dallas Police Department.
-
Monitoring river water quality: Students at Red River High School in Grand Forks, North Dakota, took part in a year-long study of the Turtle River to determine which parts of the river were healthy, which sites would support trout habitat restoration, and what influences the water quality of the river. The students obtained GPS locations for selected sites along the river, collected water quality data for each site throughout the year, and acquired base map data of the area. They explored the data by mapping water quality variables (e.g., alkalinity, hardness, dissolved oxygen, phosphates, turbidity). They analyzed the data to identify temporal and spatial trends. Following the analysis, students summarized the results and gave presentations to local television stations and campers in the Turtle River State Park. In their presentation to the campers, students explained why
-
different parts of the river are better for fishing than others. This presentation caught the attention of the Red River Regional Council (RRRC), a government organization conducting environmental projects that benefit the local economy. The RRRC was interested in evaluating the student data for a possible trout habitat restoration project.
-
Identifying point-source pollution: High school students at Crescent School in Toronto, Ontario, conducted a study of abandoned landfill sites in Toronto to answer the following questions: Is there a pattern to the location of abandoned landfill sites across the metropolitan region, and what levels of danger do these sites pose to public places and the environment and water resources? Students collected landfill location and attribute data. They also obtained base map data such as local street data for mapping major streets, rivers, lakes, landmarks (e.g., schools, hospitals), land use, and census information. They analyzed the proximity of abandoned landfills to rivers, schools, hospitals, and parks. Their analysis identified potential environmental hazards. The results of the study were presented to environmental groups such Lake Ontario Keeper, whose staff were interested in learning more from the school about how GIS can assist them in their own research.
These three studies demonstrate how GIS can be used by students to address community issues. Students asked questions. They gathered data, and they explored and analyzed them. Finally, they took the knowledge gained to their local communities. In this way, students learned how to use GIS to answer questions about real-world problems, and communities recognized that GIS is a tool that can be used by decision makers to make better decisions.
Community support in the form of recognition of the educational value of GIS is negligible in relation to the number of schools in the United States.
8.4.6 Discussion Summary
From this analysis, the following observations can be made about the implementation of GIS as a support system for spatial thinking (Table 8.8).
-
Nearly all schools have access to instructional computers and network connections to run some current versions of GIS and have the connectivity to download data. Most schools, especially poorer ones, have legacy computers and are in no position to upgrade their hardware every few years. Schools are forced to use software packages developed for the business, government, and higher education markets. Without software that suits the specific needs and constraints of K–12 education, the use of GIS in the curriculum will be severely limited.
TABLE 8.8 Assessment of Programs for the Implementation of GIS as a Support System
|
Criteria |
High |
Medium |
Low |
|
Material support |
|
+ |
|
|
Logistical support |
|
|
+ |
|
Instructional support |
|
+ |
|
|
Curriculum support |
|
+ |
|
|
Community support |
|
|
+ |
-
In nearly all school systems, the logistical support necessary to maintain computing equipment is spread dangerously thin. Successful implementation of GIS in schools requires a support team to ensure that the hardware, software, and networks are integrated and work properly.
-
A few pre-service teachers are taught how to teach GIS, but rarely are they taught how to teach with GIS. Professional development is the most common way in which teachers learn about GIS, and it is becoming more common through after-school classes, workshops, summer institutes, and on-line course work. Most of this training fails to develop spatial thinking skills for the participants. The professional development effort, which suffers from a lack of follow-through, is insignificant in relation to the size of the K–12 sector.
-
There is no standards-based approach to teaching spatial thinking, even though a suite of low- and high-tech tools is available. Consequently, there is no incentive to develop a curriculum or learning modules to guide the teaching of spatial thinking with GIS. Instead, there are many uncoordinated efforts that produce high-quality materials for use by teachers who wish to integrate GIS into the existing curriculum. These valuable efforts, though uncoordinated, have produced some challenging learning materials that are helpful to pioneering teachers. Clearly, it will be difficult for teachers to integrate GIS and other support tools into the instructional process without the muscle of national spatial thinking standards. Until there are spatial thinking standards, the implementation of GIS across the school curriculum will be unsystematic and unsuccessful.
Community support in the form of recognition of the educational value of GIS is negligible in relation to the number of schools in the United States. Because most communities are unfamiliar with GIS, they are unlikely to recognize the educational value of GIS before schools demonstrate what they can accomplish with GIS.
8.5 MECHANISMS FOR THE REDESIGN OF GIS EDUCATIONAL SOFTWARE
A redesign of GIS software is a key step if GIS is to succeed as a tool for supporting spatial thinking in the K–12 context. Among the GIS design issues that must be addressed are the following:
-
broadening its accessibility to the full range of learners;
-
strengthening the capacity to spatialize nonspatial data;
-
overcoming the visualization weaknesses;
-
providing graded systems of GIS that are age and/or experience appropriate;
-
redesigning interfaces to be more intuitive and to provide help and guidance; and
-
making the software customizable.
The committee recognizes that many of these design challenges are not specific to the K–12 context and that their solution may not occur with that context in mind. Should this be the case, then someone must take responsibility for adapting the solutions to the particular needs of teachers and students. Teachers and students should not be expected to adapt to a one-size-fits-all GIS that does not reflect their special needs.
In this section, the committee examines how a redesign of GIS to accommodate the needs of the K–12 education community might take place and suggests how it might be managed. The committee identified three mechanisms that led to the development of current versions of GIS software: the academic model, the commercial model, and the collaborative model. The academic model was based on researchers writing their own software. Changes in operating systems and hardware architectures led to the demise of many such systems, but Idrisi is one example that has flourished. It is priced for the academic market and for use by large classes at the college level. Its business model relies on sales as well as grants from agencies to pursue specific goals. The
commercial model, exemplified by companies such as ESRI, Intergraph, and Autodesk, is market driven with a business model that reflects the need to balance the costs of software development and support against income from the open market. The educational market plays little or no role in this model. The collaborative model views GIS software development as a collaborative process, underpinned by an open foundation of standards and basic functions. Thus, in the 1980s the U.S. Army Corps of Engineers developed the Geographic Resources Analysis Support System (GRASS ) package and fostered a community of users who contributed extensions to the package. In this model, there is no distinction between users and developers. GRASS was built as open software, with no proprietary restrictions on access or use. Despite its success, it was seen as competing unfairly with the commercial market and, therefore, its support was terminated in the early 1990s although a residual community continues to use it.
These three models offer distinct options for the redesign of GIS software for the K–12 context. For the collaborative mechanism to succeed, a community would have to be identified, comprising specialists with sufficient technical skills to share the development of appropriate software, and with sufficient scientific understanding of the needs in the K–12 context. An organization such as the University Consortium for Geographic Information Science (UCGIS) might be appropriate to facilitate collaboration, with sufficient funding from an appropriate federal agency. UCGIS has access to technical and intellectual expertise at each of its more than 60 member institutions and has sufficient experience in organizing large, distributed projects.
For the commercial mechanism to succeed, it would be necessary for an appropriate federal agency to request proposals and select a suitable developer. One major advantage of this mechanism is that much of the software foundation for a new GIS already exists in each vendor’s products. Because educational support for spatial thinking is somewhat distant from the normal domain of commercial applications, there would have to be strong and robust mechanisms for oversight of the design and implementation of the software, and for practical testing. Contracts would have to deal with issues of long-term maintenance, intellectual property, and long-term support. A careful study would be necessary to determine whether the K–12 sector could generate sufficient funds to pay for long-term maintenance.
For the academic model to succeed there would have to be a similar proposal solicitation process: it would require an appropriate federal agency to select and contract with one or more academic institutions for the basic software development. This mechanism might be more successful than the commercial one in ensuring the appropriate intellectual content, but stringent oversight would be needed to ensure quality control in software development and to ensure that the designs were practical and scalable in the educational context.
All three mechanisms appear to have merit, as well as potential pitfalls. The choice between them, therefore, should be made by the appropriate funding agency. In the committee’s view, the collaborative model appears to offer the most promise because it would involve all parties—software developers, government, academia, and the K–12 user community.
Based on the levels of investment being made by commercial vendors and on experience from many GIS development projects, it would be reasonable to assume that a suitable GIS could be developed over a period of three years by a team of ten programmers. Allowing for oversight and other costs, the initial development might require a total investment of $3 million to $5 million.
To coordinate the development of GIS software using the collaborative model, the committee recommends the creation of a “Federation of GIS Education Partners.” A federation is a bottom-up association of autonomous partners that agree to abide by specified interface standards, business practices, and expectations to achieve a common goal (Handy, 1992). Federations, such as the National Center for Atmospheric Research (NCAR), NASA’s Earth Science Information Partners (ESIPs), and the Association of Research Libraries, provide a means for representing the multiple interests of broad interest communities. In an ideal federation, partners come together to achieve
ends they could not achieve alone. The federation should consist of GIS developer and user partners, drawn from academia, government, the private sector, and the K–12 user community.
To be successful, the following should be considered in the design of a GIS educational software federation (NRC, 1998):
-
The federation should be a grass-roots, community-driven effort.
-
A bottom-up (rather than a top-down approach) should be the governance basis of the federation to ensure that the priorities of the broader community are honored. However, some centralized management would be necessary for making major decisions on behalf of the federation’s constituents, for representing the federation’s interests, and for conducting day-to-day operations. The instrument of centralized management should be used sparingly.
-
The federation should be flexible. Thus, the initial rules and procedures should not be overspecified.
-
A significant part of the responsibility of a federation is managing the tensions that may arise from constituents with differing expectations (e.g., software companies, teachers).
8.6 CONCLUSION
As might be expected with any piece of complex software that has evolved over time, GIS has both strengths and weaknesses as a system for supporting spatial thinking. The sets of criteria developed in Chapter 6 have allowed the committee to do two things: (1) explore, in detail, the capacity, design, and implementation of GIS as a support system for spatial thinking in the K–12 context; and (2) identify mechanisms for the redesign of GIS. Chapter 9 presents an overall assessment as to whether GIS provides a useful foundation for spatial thinking in the K–12 context.


