National Academies Press: OpenBook

Learning to Think Spatially (2006)

Chapter: Appendix H Seasonal Differences: A Customized Eighth-Grade GIS Module

« Previous: Appendix G The Introduction of GIS into K–12 Education
Suggested Citation:"Appendix H Seasonal Differences: A Customized Eighth-Grade GIS Module." National Research Council. 2006. Learning to Think Spatially. Washington, DC: The National Academies Press. doi: 10.17226/11019.
×

Appendix H
Seasonal Differences: A Customized Eighth-Grade GIS Module

This lesson explores the patterns of monsoon rainfall in South Asia and the relationships between precipitation, landforms, agriculture, and population density in that region.

In the first part of the lesson, students explore patterns of monthly and yearly rainfall in South Asia to identify seasonal changes and differences across the subcontinent. This exploration is accomplished by manipulation of a customized GIS view. The project opens to a view displaying a map of the region and a number of its major cities (see Figure H.1). When a city is selected, its monthly rainfall and yearly rainfall are displayed on two graphs that are also visible in the view. Two or more cities can be compared by holding down the shift key and making the appropriate selection as shown below. This customized project was created by arranging the project in such a way that multiple windows are displayed simultaneously: the view (South Asia) and two graphs (monthly rainfall and annual rainfall). By saving the project in this format, it will always open in the same display mode. The customized project design facilitates the accomplishment of the lesson’s objectives by highlighting key patterns and relationships within the data.

As students explore, they are asked to consider inquiry-based questions such as the following:

  • As you move northward along the subcontinent’s west coast, how does the pattern of rainfall change?

  • Although the monthly rainfall amounts differ, what similarities do you see among the overall rainfall patterns in these three cities?

  • What happens to the pattern of annual rainfall as you move from west to east across South Asia?

This customized project allows students to discover the patterns of rainfall in South Asia’s monsoon climate through their own investigation. As they explore they are encouraged to speculate on the causes and consequences of the patterns they observe through questions such as the following:

Suggested Citation:"Appendix H Seasonal Differences: A Customized Eighth-Grade GIS Module." National Research Council. 2006. Learning to Think Spatially. Washington, DC: The National Academies Press. doi: 10.17226/11019.
×
  • How do you think Afghanistan’s rainfall pattern will affect the way of life in that country?

  • How does the physical features theme help you explain the differences in patterns of rainfall between inland Bangalore and coastal Mangalore?

  • Which regions or countries of South Asia are suitable for agriculture and which are not? Explain.

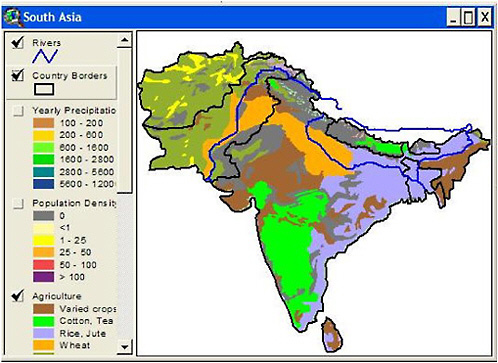
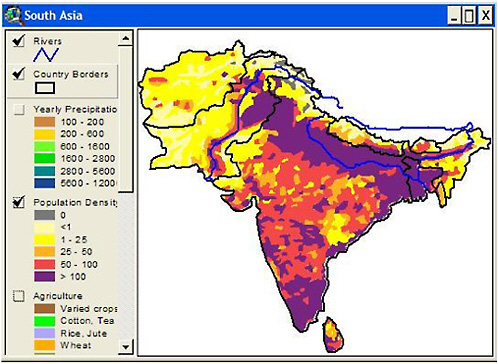
In the second part of the lesson, students compare South Asia’s yearly precipitation patterns with those of agricultural activities and population density by adding and observing shapefiles representing those data (see Figures H.2, H.3, and H.4). One customization evident in these maps is that the added themes, derived from global data, have been clipped to the political borders of the South Asia region. Each theme’s legend is also customized to facilitate easy analysis and comparison with other themes. Again, these customizations enable the student to focus easily on the content and objectives of the lesson.

In the final part of the lesson, students are guided through a synthesis of their discoveries about the monsoon’s impact on agriculture and population patterns with questions such as the following:

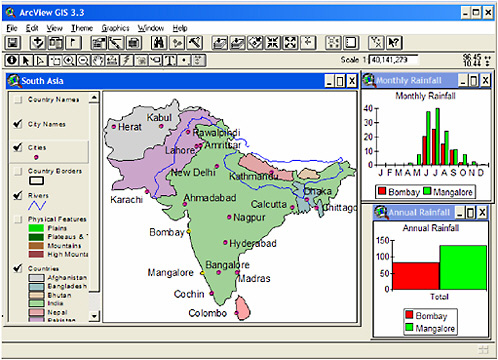
FIGURE H.1 Map of South Asia with countries, rivers, and major cities named with graphs contrasting total and annual rainfall for Bombay and Mangalore. SOURCE: Personal communication from Lyn Malone, 2003.

Suggested Citation:"Appendix H Seasonal Differences: A Customized Eighth-Grade GIS Module." National Research Council. 2006. Learning to Think Spatially. Washington, DC: The National Academies Press. doi: 10.17226/11019.
×

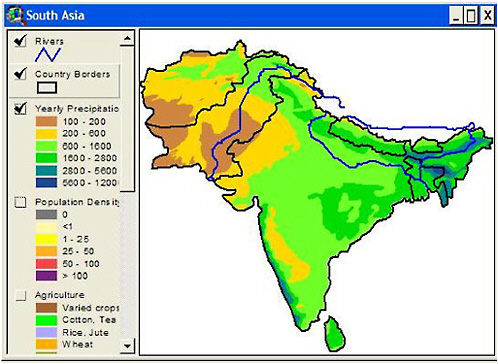
FIGURE H.2 Map of South Asia with countries, rivers, and annual precipitation. SOURCE: Personal communication from Lyn Malone, 2003.

  • What is the relationship between agricultural activities and patterns of precipitation in South Asia?

  • Why is Afghanistan’s population density so low?

  • Since most of Pakistan gets little or no rainfall, how do you explain the areas of agriculture and high population density in that country?

In this lesson, complex patterns and relationships become accessible and understandable in a GIS environment that has been customized to meet the needs of students working on particular tasks in a specific context.

Suggested Citation:"Appendix H Seasonal Differences: A Customized Eighth-Grade GIS Module." National Research Council. 2006. Learning to Think Spatially. Washington, DC: The National Academies Press. doi: 10.17226/11019.
×

FIGURE H.3 Map of South Asia with countries, rivers, and types of agriculture. SOURCE: Personal communication from Lyn Malone, 2003.

Suggested Citation:"Appendix H Seasonal Differences: A Customized Eighth-Grade GIS Module." National Research Council. 2006. Learning to Think Spatially. Washington, DC: The National Academies Press. doi: 10.17226/11019.
×

FIGURE H.4 Map of South Asia with countries, rivers, and population density. SOURCE: Personal communication from Lyn Malone, June 6, 2003.

Suggested Citation:"Appendix H Seasonal Differences: A Customized Eighth-Grade GIS Module." National Research Council. 2006. Learning to Think Spatially. Washington, DC: The National Academies Press. doi: 10.17226/11019.
×
Page 293
Suggested Citation:"Appendix H Seasonal Differences: A Customized Eighth-Grade GIS Module." National Research Council. 2006. Learning to Think Spatially. Washington, DC: The National Academies Press. doi: 10.17226/11019.
×
Page 294
Suggested Citation:"Appendix H Seasonal Differences: A Customized Eighth-Grade GIS Module." National Research Council. 2006. Learning to Think Spatially. Washington, DC: The National Academies Press. doi: 10.17226/11019.
×
Page 295
Suggested Citation:"Appendix H Seasonal Differences: A Customized Eighth-Grade GIS Module." National Research Council. 2006. Learning to Think Spatially. Washington, DC: The National Academies Press. doi: 10.17226/11019.
×
Page 296
Suggested Citation:"Appendix H Seasonal Differences: A Customized Eighth-Grade GIS Module." National Research Council. 2006. Learning to Think Spatially. Washington, DC: The National Academies Press. doi: 10.17226/11019.
×
Page 297
Next: Appendix I List of Acronyms »
Learning to Think Spatially Get This Book
×
Buy Paperback | $55.00 Buy Ebook | $43.99
MyNAP members save 10% online.
Login or Register to save!
Download Free PDF

Learning to Think Spatially examines how spatial thinking might be incorporated into existing standards-based instruction across the school curriculum. Spatial thinking must be recognized as a fundamental part of K–12 education and as an integrator and a facilitator for problem solving across the curriculum. With advances in computing technologies and the increasing availability of geospatial data, spatial thinking will play a significant role in the information-based economy of the twenty-first century. Using appropriately designed support systems tailored to the K–12 context, spatial thinking can be taught formally to all students. A geographic information system (GIS) offers one example of a high-technology support system that can enable students and teachers to practice and apply spatial thinking in many areas of the curriculum.

  1. ×

    Welcome to OpenBook!

    You're looking at OpenBook, NAP.edu's online reading room since 1999. Based on feedback from you, our users, we've made some improvements that make it easier than ever to read thousands of publications on our website.

    Do you want to take a quick tour of the OpenBook's features?

    No Thanks Take a Tour »
  2. ×

    Show this book's table of contents, where you can jump to any chapter by name.

    « Back Next »
  3. ×

    ...or use these buttons to go back to the previous chapter or skip to the next one.

    « Back Next »
  4. ×

    Jump up to the previous page or down to the next one. Also, you can type in a page number and press Enter to go directly to that page in the book.

    « Back Next »
  5. ×

    Switch between the Original Pages, where you can read the report as it appeared in print, and Text Pages for the web version, where you can highlight and search the text.

    « Back Next »
  6. ×

    To search the entire text of this book, type in your search term here and press Enter.

    « Back Next »
  7. ×

    Share a link to this book page on your preferred social network or via email.

    « Back Next »
  8. ×

    View our suggested citation for this chapter.

    « Back Next »
  9. ×

    Ready to take your reading offline? Click here to buy this book in print or download it as a free PDF, if available.

    « Back Next »
Stay Connected!