
5
Vehicle Technologies for Reducing Load-Specific Fuel Consumption
The technologies that can be used to reduce fuel consumption in medium- and heavy-duty vehicles vary by vehicle type, duty cycle, and the year the technology becomes available. For instance, a Class 8 tractor trailer operating on the interstate will benefit from technologies that improve aerodynamic performance and reduce rolling resistance, whereas a Class 2b pickup truck will benefit little from these technologies. This chapter first reviews the ways in which energy is lost in the operation of medium- and heavy-duty vehicles. It then reviews technologies and techniques for reducing the fuel consumption of these vehicles, including technologies that improve aerodynamic performance and that reduce rolling resistance, auxiliary loads, and idle. It also covers mass and weight reduction, and intelligent vehicle technologies.
VEHICLE ENERGY BALANCES
The potential efficiency improvements being considered in this study can be illustrated by reviewing the energy losses for the various vehicle classes. The U.S. Department of Energy (DOE) 21st Century Truck Partnership Technology Roadmap (DOE, 2006) provides the following tables for energy losses. The engine losses were calculated from a typical accounting of fuel energy usage, such as that shown in Figure 5-1. The engine losses are primarily a result of heat transfer to the coolant and heat loss through the exhaust. The remaining energy is used to power the vehicle and auxiliaries under the conditions set forth in the tables below. In Figure 5-1, engine accessories are components essential to engine operation, such as the fuel pump, water
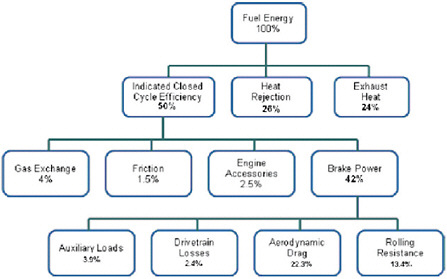
FIGURE 5-1 Energy balance of a fully loaded Class 8 tractor-trailer on a level road at 65 mph, representing the losses shown in Table 5-1. SOURCE: TIAX (2009).
pump, and oil pump, while auxiliary loads are accessories used in a vehicle’s operation, such as the power steering, air compressor, cooling fan, and air-conditioning compressor.
The energy losses for a Class 8 tractor with a 53-ft van trailer, fully loaded to 80,000 lb gross vehicle weight (GVW) and operating on a level road at 65 mph, for one hour, are shown in Table 5-1. The energy losses for a Class 3 to 6 medium duty truck, loaded to 26,000 lb GVW and operating on a level road at 40 mph for 1 hour, are shown in Table 5-2. (Note that this steady-state operating point is not typical of the duty cycle for a Class 3 to 6 medium-duty truck.) The energy losses for a 40-ft transit bus with one-half seated load (32,000 lb) and the air conditioning on, operating over the central business district cycle, for 1 hour, are shown in Table 5-3. Note the high percentage of energy devoted to auxiliary loads.
Vehicle energy balances such as those described in Tables 5-1 through 5-3 identify the energy required to propel a vehicle down the road at a specific speed and with a specific load. The following sections break down these areas of losses as follows: aerodynamics, auxiliary loads, rolling resistance, vehicle mass (weight), and idle reduction.
AERODYNAMICS
Truck Aerodynamics
Anyone comparing the commanding size of a tractor-van trailer combination to a small sedan or even a full-size sport utility vehicle (SUV) understands that the aerodynamic drag1 of these large vehicles exceeds that of any light-duty vehicle. Some quantitative comparisons of those differences will be made later. For now, consider again the energy summary for the tractor-van trailer given in Table 5-1 and Table 5-4. Clearly, for this class of truck, aerodynamic load reduction is a key for successful fuel consumption reduction.
Early Studies
K.R. Cooper of the Canadian National Research Council summarized some of the earliest heavy truck wind tunnel testing performed in 1953 at the University of Maryland (Cooper, 2004). Many of the aerodynamic design solutions now available or being developed for Class 8 tractors and box van trailers were evaluated in that 1953 study. Those devices were shown to reduce aerodynamic drag by about 50 percent as compared to the predominant truck configurations of the 1950s (the cab-over-engine tractor). The “near-practical” streamlined result is shown in Figure 5-2.
Airshield introduced a commercial cab roof-top air deflector in about 1965. This device received some trucking company interest, especially after the 1973 petroleum crisis.
TABLE 5-1 Energy Balance for a Fully Loaded Class 8 Vehicle Operating on a Level Road at 65 mph for One Hour
TABLE 5-2 Energy Balance for a Fully Loaded Class 3 to 6 Medium-Duty Truck (26,000 lb) Operating on a Level Road at 40 mph for One Hour
TABLE 5-3 Energy Balance for a 40-ft Transit Bus Operating over the Central Business District Cycle for One Hour
TABLE 5-4 Operational Losses from Class 8 Tractor with Sleeper Cab-Van Trailer at 65 mph and GVW of 80,000 lb
|
Operating Load |
Power Consumed (hp) |
Power Consumed (%) |
|
Aerodynamic |
114 |
53 |
|
Rolling resistance |
68 |
32 |
|
Auxiliaries |
20 |
9 |
|
Drivetrain |
12 |
6 |
|
Braking |
0 |
0 |
|
Total |
214 |
100 |
|
SOURCE: DOE (2008). |
||
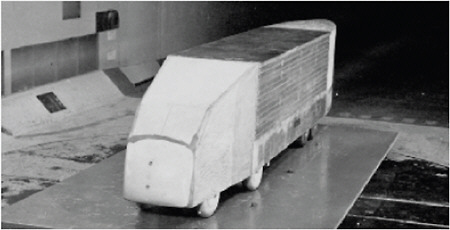
FIGURE 5-2 University of Maryland, streamlined tractor, closed gap, three-quarter trailer skirt, full boat tail. SOURCE: Cooper (2004), p. 15, Fig. 4, Case 8. Reprinted with kind permission of Springer Science and Business Media.
Industry interest was encouraged by the graphic illustrations produced by the National Research Council of Canada, as shown in Figure 5-3.
Recent History
The introduction of the Kenworth T-600 in 1985 marked the industry’s first serious attempt to incorporate aerodynamic improvements in truck tractors (see Figure 5-4). The T-600 included features such as a streamlined hood and fenders, an aerodynamic faired bumper, fuel tank fairings, and air filters mounted under the hood. These changes resulted in a significant reduction in aerodynamic drag compared to contemporary tractor models.
Continuing development led to additional improvements such as cab extenders to reduce the gap between tractor and trailer, more aerodynamic mirrors, and full-length side fairings. By 1990 all major truck/tractor manufacturers had introduced aerodynamic models, although “traditional” models continue to be available. See Figure 5-5 for identification of the common aerodynamic features.

FIGURE 5-3 National Research Council of Canada: Smoke pictures, cab with deflector (right). SOURCE: Cooper (2004), p. 11, Fig. 2. Reprinted with kind permission of Springer Science and Business Media.
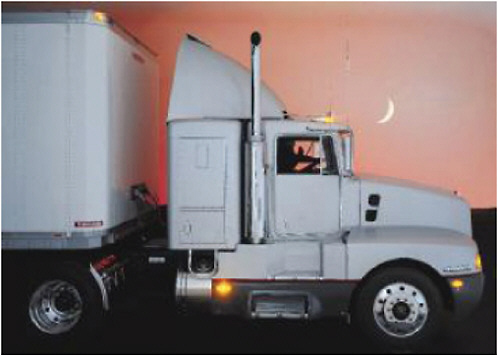
FIGURE 5-4 Kenworth 1985 T600 aerodynamic tractor. SOURCE: Photo courtesy of Kenworth Truck Company.
Early Efforts Toward Engineering Measurements
The development of aerodynamic features led to a need for test procedures that could quantify the performance of these features. Most industry standards were developed through a consensus process by the Society of Automotive Engineers (SAE). Some of the widely used standards are as follows:
-
Coast-down tests on a track. By 1976 SAE issued a procedure to quantify and standardize this test, SAE J1263. This standard allows estimation of both the coefficient of aerodynamic drag, Cd, and the rolling resistance coefficient, Crr. SAE J1263 was intended primarily for passenger car applications, and the accuracy and repeatability of this procedure may be inadequate for heavy duty vehicles.
-
Wind tunnel tests. Truck companies began performing wind tunnel evaluations. Since a limited number of wind tunnels are available that can handle full-size trucks, scale models were widely used. By 1981, SAE had developed a recommended practice, SAE J1252,
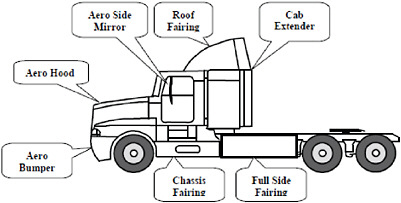
FIGURE 5-5 Aerodynamic sleeper tractor aerodynamic feature identification.
-
for wind tunnel tests. This procedure is the only accurate method of determining wind-averaged drag, by accounting for the effects of side wind. See Chapter 2 for a description of the SAE J1252 test procedure.
-
Fuel consumption measurement with full-size trucks. In 1986 the SAE and the Truck Maintenance Council (TMC) introduced the joint TMC/SAE Fuel Consumption Test Procedure—Type II, SAE J1321, which provides the in-service fuel consumption of one test vehicle compared to a control truck. This test allows for correction of parameters outside the control of the researchers performing the test, such as ambient conditions and wind.
SmartWay Partnership of the U.S. Environmental Protection Agency
The U.S. Environmental Protection Agency’s (EPA) partnership with the truck industry to reduce emissions (especially greenhouse gases) and fuel consumption alike is described in Chapter 3. The EPA’s SmartWay truck specification has a significant dependence on improved aerodynamic performance. It requires certain fuel consumption reducing aerodynamic design features to be applied on tractor-van trailer combinations (Figure 5-6):
-
The SmartWay tractor must be a high-roof aerodynamic sleeper cab, with aerodynamic bumper, mirrors, side truck fairings, side extender fairings, and roof fairings. All six domestic tractor manufacturers now supply SmartWay compliant tractors.
-
The SmartWay-certified van trailer must be equipped with side skirt fairings plus either a trailer boat tail or a tractor-trailer gap fairing. The combined trailer aerodynamic treatment is estimated to achieve at least a 5 percent fuel consumption reduction compared to a standard trailer. At least eight trailer manufacturers supply SmartWay-compliant trailers (EPA, 2009).
As noted in Chapter 3, California adopted the SmartWay specification and validation processes as integral to its Global Warming Solutions Act in December 2008. That adoption provided for a mandatory introduction schedule of these fuel-saving specifications for both tractors and trailers in the 2011-2013 period (CARB, 2008).
Technology of Aerodynamic Improvements
The standard metric for comparing aerodynamic losses is the drag coefficient, Cd (see in Chapter 2 the section “Truck Tractive Forces and Energy Inventory”). Vehicle designers seek to minimize the drag coefficient in order to reduce fuel consumption at higher vehicle speeds, where aerodynamic drag represents a substantial fraction of the energy needed to keep the vehicle moving.
Drag coefficients for current aerodynamically designed tractors with smooth-sided van trailers (T-T) are about 0.6 to 0.65, which is higher than the values normally found in light-duty vehicles. Most current automobile sedans achieve a Cd of about 0.3 to 0.4, and the Cd of SUVs is typically 0.4 to 0.5. The higher Cd values for tractor trailers is primarily due to the fact that they are essentially large boxes optimized for the movement of freight.
Drag coefficient values are usually measured in wind tunnel tests. The Cd of a vehicle directly facilitates the computation of aerodynamic energy loss. Further, the wind tunnel test can provide a relatively simple and precise method to evaluate the wind yaw2 effects on a vehicle’s Cd (Cooper, 2004). An accurate and repeatable process for establishing Cd values is essential for the successful application of whole-truck computer modeling to evaluate fuel consumption effectiveness of various drag-reducing devices.
Each truck tractor manufacturer has developed in-house processes to validate the technical performance of their aerodynamic solutions. Manufacturers do not publish Cd values, evidently because the procedures used by different manufacturers are not known to be directly comparable. Manufacturers have not agreed to use a common standard such as SAE J-1252.
Aerodynamic Energy Loss
As described in the Road Load Power paragraph in Chapter 2, the resisting aerodynamic horsepower is proportional to Cd × A × V3, where A = frontal area and V = forward velocity. This illustrates the important role of vehicle speed on aerodynamic horsepower loss. It is helpful to graphically display aerodynamic power consumption as a function of road speed. Consider Figure 5-7, where the blue (Cd = 0.625) curve is typical of today’s tractor-trailer combination. The green curve represents a 20 percent reduction in the Cd, and therefore in the aerodynamic power loss. A 20 percent reduction in Cd results in a fuel consumption reduction of about 10 percent at 65 mph (TMA, 2007, p. 10).
Figure 5-7 also shows the curve for power consumed by tire rolling resistance. As described in the Chapter 2 paragraph on road load power, the tires’ rolling resistance power loss is proportional to: Crr × W × V, where W = vehicle gross weight and V = forward velocity. The Crr value used in the figure is typical of those on current tractor trailers but not of the lower value required for SmartWay certification.
Heavy-duty tractors not only have higher Cd values than light-duty vehicles, they also have a frontal area that is 3 to 3.7 times larger than cars and SUVs. The large frontal area is driven by the need to package a large payload capacity. As a result, the Cd*A values (drag coefficient times frontal area) of heavy trucks are roughly 4.7 to 7.7 times higher than

FIGURE 5-6 2009 model year Mack Pinnacle (left) and Freightliner Cascadia (right) SmartWay specification trucks. SOURCE: Courtesy of Mack and Freightliner Cascadia.
light-duty vehicles, which results in an aerodynamic power consumption 4.7 to 7.7 times higher. The benefits of aerodynamic features are a strong function of both operating speed and annual vehicle miles traveled (VMT). As Figure 5-7 shows, aerodynamic drag is larger than rolling resistance at speeds above 48 mph for a typical current truck. At 32 mph, however, aerodynamic drag is only half of tire rolling resistance, and aerodynamic drag becomes insignificant at low speeds. The sensitivity to VMT applies to any fuel-saving feature: the more miles a vehicle travels, the larger the potential fuel savings becomes.
In determining whether to apply aerodynamic features to a vehicle, it may be appropriate to consider a duty cycle average road speed hurdle. A method to quantify a weighted aerodynamic-average speed (WAAS) has been established that provides for an average of the mileage-weighted velocity3 (V3). If it is deemed that a speed hurdle is appropriate, a numerical value for the hurdle speed must be established, and the WAAS must be verifiable. For example, will a tractor-container/trailer chassis operate at a low average mph by virtue of its operation over short distances between ports and rail terminals? CARB has taken this issue into account in its greenhouse gas (GHG) regulation, where drayage tractors are exempt if operated within 100 miles of the port. If this approach is applied in the general case, it would likely require use of electronic onboard data recorders to substantiate the short distance and/or below-speed-hurdle reality. The required record keeping and oversight could become very burdensome.
Details of Aerodynamic Solutions
There are four regions of the tractor-van trailer combination truck that are amenable to aerodynamic design improvements. These regions include the various tractor-related details, the tractor-trailer gap, the trailer skirt, and the trailer
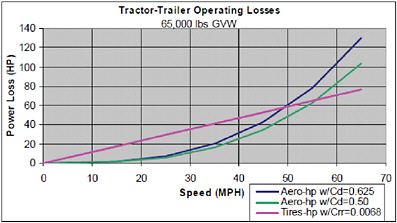
FIGURE 5-7 Aerodynamic and tire power losses for tractor-van trailer combination.
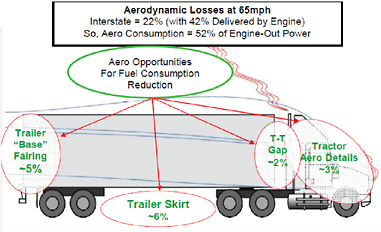
FIGURE 5-8 Tractor-trailer combination truck showing aerodynamic losses and areas of energy-saving opportunities. Percent changes refer to fuel consumption. SOURCE: Based on Wood (2006). Courtesy of Richard Wood.
“base” fairing, which are all illustrated in Figure 5-8, along with the approximate fuel consumption reductions that seem to be achievable in the near term.
Aerodynamics of the Truck Tractor
The contemporary image of aerodynamically optimized tractors is that of sleeper cab tractors equipped with many fairings, such as the SmartWay trucks shown in Figure 5-6 and the left-side image shown in Figure 5-9. These tractors are typically used in long-haul applications where the ability to provide “hotel” accommodations is important. However, many long-haul operators use a terminal-to-terminal system that does not require sleeper tractors. These operators use day cab tractors such as that shown on the right in Figure 5-9. Shorter-haul operators tend to avoid aerodynamic fairings because they provide limited fuel savings and are prone to damage in urban operations and during frequent stops at loading docks. Day cab tractors often are equipped with only a roof fairing, and for nonvan applications they may carry no fairings at all. Day cab tractors make up about one-third of all tractor sales, and so they are a significant portion of the market.
Most tractor manufacturers introduced tractor offerings in the 2003 to 2008 period that included purposeful, major improvements in their aerodynamic performance accomplished by attention to many details and utilizing most of the evaluation tools noted earlier. Reports of fuel consumption reductions of up to 6 percent were received during committee site visits.
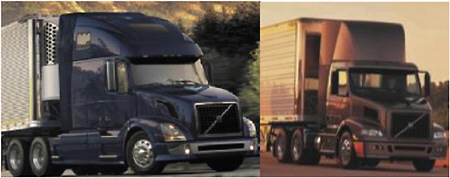
FIGURE 5-9 Volvo full sleeper cab (left) and day cab (right). SOURCE: Courtesy of Volvo.
TABLE 5-5 Class 8 Tractor Aerodynamics Technologies, Considering the 2012 Time Frame
|
Technology |
Fuel Consumption Reduction (%) |
Cd Improvement (%) |
Cost ($) |
Industry Adoption Rate (%) |
|
Day cab roof deflector |
4-7 |
13 |
1,000-1,300 |
Most |
|
Sleeper roof fairing |
7-10 |
15-20 |
500-1,000 |
Standard |
|
Chassis skirt |
3-4 |
4-7 |
1,500-2,000 |
50-60 |
|
Cab extender |
2-3 |
4-5 |
300-500 |
80-90 |
|
Next-generation package |
3-4 |
6-8 |
2,750 |
2012 Introduction |
|
SOURCE: TIAX (2009), p. 4-35. |
||||
Table 5-5 shows the market shares of various aerodynamic features on aerodynamic-style tractors. Roof shields have a very high market share, while the relatively damage-prone chassis skirts have a lower share. The side-of-cab extender works with the roof shield to minimize the gap between tractors and trailers. This gap has a major role in determining the overall vehicle Cd. The recommended maximum gap3 is typically 30 in. from the rearmost feature on the tractor to the trailer face. Smaller gaps do have drawbacks, however, in that they limit the ability of the vehicle to operate in tight spaces.
The next-generation aerodynamics package shown in Table 5-5 represents the forecast of tractor manufacturers for sleeper cab tractor aerodynamics improvement in the 2012 time frame. These features will be designed and optimized for long-haul applications. It is expected that many of these features may not be compatible with short-haul operations, and thus their application on day cab tractors will be limited. Characteristics of short haul operation include curb encounters, severe road-crossing humps, backing maneuvers, and tight street-side clearances. All of these combine to damage many of the aerodynamic surfaces that could be successful in long-haul duty.
There are two consequences of the fragility of tractor aerodynamic features that must be considered. One is that trucks specified with many aerodynamic features will not be attractive or cost-effective in short-haul operations, because of the fragility of aerodynamic features and because of restricted maneuverability. The other issue is that tractors specified for short-haul operations will be less efficient if they are pressed into long-haul service for any reason. Excessive specialization of tractors can lead to logistics problems for operators, as well as to lower used tractor values in cases where the original operating intent does not match the second buyer’s application. An example of this is sleeper cab tractors with full-height air deflectors pulling flat bed trailers. In this case the aerodynamic feature actually costs fuel rather than saves fuel, because the high roof sleeper increases the frontal area of the truck beyond what the trailer requires. In many cases the application of a high roof sleeper with a flat-bed trailer is just temporary, but in some cases this fuel-wasting combination may be long term.
Another marketplace factor in tractor design that delays full implementation of aerodynamic features is the preference for traditional styling. This preference for a traditional look is prevalent among owner-operators, and many small fleets use traditional styling as a driver retention feature. Notice the differences in traditional styling compared to aerodynamic styling in Figure 5-10. Traditional features known to have high drag-inducing effects include the large, flat bumper, along with features protruding into the airstream such as head lamps, air cleaners, and dual exhaust stacks, as well as “west coast” side mirrors. While manufacturers have made useful aerodynamic improvements to traditional models of years gone by, these traditional features are believed to invoke a fuel consumption increase of at least 5 percent compared to the aerodynamic model. (TIAX, 2009, Table 4-24). Some operators are well aware of the fuel consumption penalty, while others are likely to underestimate it.
Day cab tractors constitute roughly one-third of Class 8 tractors. So far it has not been possible to match the aerodynamic performance of the best sleeper models with day cabs. Fortunately, it appears that many of the day cab and other short-haul tractors accumulate fewer miles and thus consume less fuel than over-the-highway tractors. More specific data gathering is needed to quantify the fuel consumed by various applications of tractor trailers.
A 2-year collaborative study of a variety of design improvements that would reduce aerodynamic drag on tractor trailers was completed in 2007 by four members of the Truck Manufacturers Association (TMA) and DOE. Their research evaluated the effect of post-SmartWay designs on combination tractor-trailer aerodynamics. A number of potential tractor features were evaluated, including alternative rearview mirror designs, treatments of the tractor-trailer gap such as gap fillers and trailer gap flow control devices, and features to manage airflow under the vehicle and between the tractor and trailer. In addition to the tractor features, a number of trailer features also were evaluated.
The 2007 TMA/DOE study started with a computational fluid dynamics (CFD) modeling evaluation of potential aerodynamic feature concepts. The CFD models allowed the researchers to explore the effect of many design parameters on Cd (see in Chapter 2 the section “Computational Fluid Dynamics”). The most promising concepts from the analyti-

FIGURE 5-10 Peterbilt Traditional Model 389 (left) and Aerodynamic Model 387 2 (right) (SmartWay). SOURCE: Courtesy of Peterbuilt Motors Company.
cal study were then tested in either scale model or full-scale wind tunnels to validate the modeling, quantify the Cd improvements and further refine the concepts. Finally, full-scale prototype hardware was created for vehicle testing using the SAE J-1321 protocol (TMA, 2007, p. 5).
The 2007 TMA/DOE study successfully revealed improved aerodynamic design features, but it also served to spotlight the difficulties of achieving major new reductions in tractor and tractor-trailer Cd. This last point also confirms that today’s modern tractor designs already perform well aerodynamically, within constraints such as the need to provide payload capacity and to be compatible with existing infrastructure such as loading docks.
The heat management requirements present another vehicle design factor that influences the aerodynamic characteristics. Larger cooling packages limit the ability of designers to reduce vehicle Cd. The total heat rejection from the vehicle determines the size of the cooling package required. The heat rejection includes engine-related heat rejection from the engine radiator, charge air cooler, and exhaust gas recirculation (EGR) coolers, but there are other sources of heat rejection as well. The transmission and steering systems may have coolers, along with the air-conditioner condenser. The addition of charge air cooling in the early 1990s, and the addition of EGR in 2002, has led to increased cooling system size and heat rejection requirements. Certain engine efficiency design features are mentioned in Chapter 4 that might reduce the size of current truck cooling system components and/or basic engine size itself. For example, “light-hybrid” systems have been mentioned as very useful to reduce light-load engine operation in the tractor-trailer class. Unfortunately, a corresponding reduction of engine size and heat rejection does not seem likely, since peak power demand will still be fulfilled only from the engine under many conditions. Similarly, most “bottoming-cycle” concepts will demand additional underhood space and will greatly increase overall power train heat rejection, as opposed to heat rejected in the exhaust gases, further challenging frontal styling and possibly increasing Cd values.
Aerodynamics of the Truck Trailer (with Focus on Typical 53-Ft-Length Box Vans)
Significant progress has been made with aerodynamic components added to the trailer (see Table 5-6). Unfortunately, there are three major impediments to widespread incorporation of aerodynamic trailer features. One is that in many operations the tractor and trailer owners are not the same. As a result, the trailer owner does not benefit from the fuel consumption reduction achieved by pulling an aerodynamic trailer. The second issue is that there are many more trailers than tractors, since trailers are widely used as temporary storage. As a result, the investment in aerodynamic improvements must be amortized over many fewer miles than is the case for tractors. The third impediment is the reality that there are no aerodynamic-system integrators
TABLE 5-6 Current Van Trailer Aero-Component Performance
|
Trailer Aerodynamic Technology |
Skirts |
Boat Tails |
Nose Cone |
Vortex Stabilizer |
Bogie Cover |
|
Range of fuel economy improvement (% mpg) |
5.6-7.5 |
2.9-5.0 |
2.0->4.0 |
1.0 |
1.0 |
|
Range of costs |
$1,600-$2,400 |
n/a |
$800-$1,260 |
$500 |
n/a |
|
SOURCES: Based on responses to committee questionnaire and information on manufacturers’ websites. |
|||||
in the medium- and heavy-duty trucking industries. Trailer manufacturers are not owned by or related with tractor companies, and trailer aerodynamic-device manufacturers constitute yet a third layer of unaligned companies. For the most part it falls to the carriers themselves to sort through the emerging aerodynamic devices to find the most cost effective solutions.
Table 5-6 gives a partial summary of supplier-reported information obtained from responses to a committee questionnaire4 (see Figures 5-11 to 5-14). Data are typically reported from SAE J1321 full-vehicle tests, in mpg improvement. However, individual testing procedures are not consistent, average test speeds differ, and it is not known whether the statistical requirements of the test procedure are consistently adhered to. Also, the data are not adequate to conclude that benefits achieved by combining aerodynamic devices would be completely additive. In a section below, results from a combination of devices are presented, and these results show that simple addition of individual results does not provide the correct result.
Note that the combined effects of several aerodynamic features (Full Package, in Figure 5-15) provide an average fuel consumption reduction of 9.3 percent. The full package includes the partial gap filler, full or partial trailer skirt, and base flaps (base fairings and boat tails). Further, if it is assumed that individual performances at the 75th percentile would eventually be achieved by 2015-2020, then the combined full package (of partial gap, full skirt, and base flaps) would be 12.1 percent. This result is derived through a method of multiplication of fuel consumptions reductions.5 Although there are more than 10 independent manufacturers of trailer aerodynamic devices, at least eight trailer manufacturers have certified 53-ft van trailers in the EPA’s SmartWay Partnership (EPA, 2009). One trailer manufacturer, Wabash National Corp., announced in July 2009 the production availability of a trailer skirt of its design.
Pneumatic Blowing to Reduce Trailer Drag
One researcher has extensively studied this concept, where low-pressurized air is discharged across curved trailing surfaces used on the trailer’s rear face. Reported results indicate that a fuel consumption reduction of about 8 percent at 65 mph may be achievable with this process. (The 8 percent is net savings, after accounting for the energy to pressurize the required plenum, Englar, 2005, p. 12). Such a system would need to be integrated into the trailer design for effective packaging, including compatibility with loading docks. One trailer aerodynamics manufacturer, AT Dynamics, has recently initiated development for a production-viable active flow control system for trailer rear edges. The cost and complexity of a pneumatic blowing system would be a substantial challenge to production implementation.
Cost-Effectiveness
DOE remarked in a December 4, 2008, research solicitation that “there has not been a strong pull from fleets due to concerns about cost, return on investment, durability and maintenance requirements.” Much of this lack of demand stems from the reality of trailer quantities. Currently, the trailer-to-tractor ratio is about 2.8. Most larger trucking companies report individual ratios ranging from about 1.1 to 4.0. One large private carrier reported a trailer-to-tractor ratio exceeding 8 (Transport Topics, 2009).
This reality adds to the difficulty of adding aerodynamic devices within normal and favorable capital acquisition metrics, such as net present value (NPV). The NPV for trailer skirts is strongly dependent on fuel prices and can easily exceed a 3-year zero-cost hurdle at a 2.8 trailer-to-tractor ratio. The retrofit of trailer aerodynamic devices might be a useful fuel-savings strategy, due to the long lifetime of highway trailers, which is 20 years or more, as a result of their low on-road utilization (compared to tractors).
Another cost-effectiveness issue is the fact that trailer aerodynamic improvements in duty cycles with low average speeds must be judged as a particularly poor value. For example, the fuel consumption benefit decreases by nearly 90 percent if the average speed is 30 mph rather than 60 mph (see Figure 5-7).
Safety Issues for Trailer Aerodynamic Devices
Since damage in normal vehicle operation is a major issue with aerodynamic features, virtually all reporting skirt developers have placed a high priority on ensuring that their designs are significantly road damage tolerant. Many have video clips on their Web sites showing resistance to railroad grade crossing humps, steep loading dock accesses, and snow accumulation or snow piles, as well as low-speed collisions with equipment such as fork-lift trucks. Nevertheless, caution is appropriate, as a proliferation of such low-hanging devices may create a new source of on-road hazards similar to tire tread sections today. One manufacturer, AdamWorks,
|
4 |
Trailer Aerodynamic Component Performance. Private survey, NRC Committee on Medium and Heavy-Duty Vehicles, May to August, 2009. Respondents included AdamWorks, ATDynamics, Air Tab, Freight Wing, Inc., Laydon Composites Ltd., Nose Cone Manufacturing Co., Wabash National Corp., and Windyne, Inc. (remarks only). The committee also obtained material from the websites (accessed August 2009) of manufacturers that did not return the survey questionnaire, including Aerodynamic Trailer Systems (http://fuelsaverbyats.com/ats_company_info.htm), Nose Cone Manufacturing Co.(http://www.nosecone.com/apvan.htm), Transtex Composites (http://www.transtexcomposite.com/); and Windyne Inc. (http://www.windyne.com/). |
|
5 |
The fuel consumption reduction of the combined technology packages is calculated multiplicatively (not additively) according to the following equation: where % FCTech x is the percent reduction of an individual technology, and therefore (1 − % FTech x) is the consumption associated with the reduction (personal communication between TIAX consultant Matt Kromer and C. Salter). |
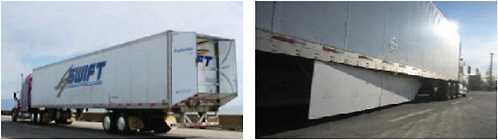
FIGURE 5-11 ATDynamics trailer tail (left) and FreightWing trailer skirt (right). SOURCE: Courtesy of Freight Wing.
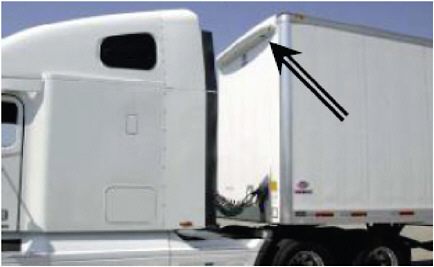
FIGURE 5-12 Nose cone trailer “eyebrow.” SOURCE: Photo provided with permission by FitzGerald Corporation, national marketer for Nose Cone Mfg. Co. Nose Cone is a registered trademark.
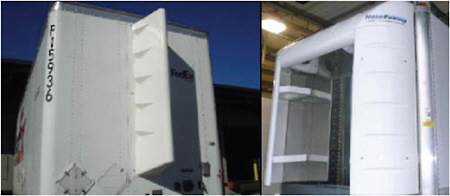
FIGURE 5-13 Laydon vortex stabilizer (left) and nose fairing (right). SOURCE: Courtesy of Laydon Composites.
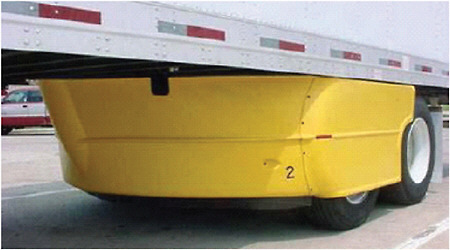
FIGURE 5-14 Trailer bogie cover. SOURCE: TMA (2007).
automatically lowers its trailer skirt as a function of road speed from 16 to 6 in. This strategy permits close proximity of the bottom of the skirt to the road which enhances its high-speed performance while avoiding deployment under more hazardous low-speed conditions.
Aerodynamic features may also provide safety benefits unrelated to their primary purpose of saving fuel. There are numerous testimonials that trailer skirts and boat tails substantially improve trailer tracking stability, especially in crosswinds, and significantly reduce road spray from trailer tires. One trailer skirt manufacturer, Laydon, claims that its devices have been verified to comply with the European heavy truck side under-ride regulation. European Council Directive 89/297/EEC (ECD, 1989) mandates side under-ride
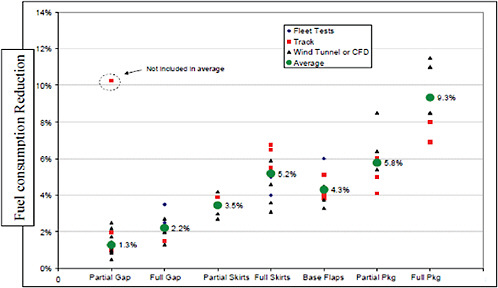
FIGURE 5-15 Summary of trailer aerodynamic device fuel consumption reduction. SOURCE: TIAX (2009).
protection on trucks to prevent pedestrians, bicycle riders, and motorcyclists from falling under the wheels of a vehicle when it turns.
Weight, Length, and Width Issues for Trailer Aerodynamic Devices
Weight
Trailer skirts can add 200 lb or more to a 53-ft trailer’s weight. Boat tails can add up to 200 lb to the trailer. Likewise, nose cones and/or vortex stabilizers can add up to 100 lb weight. Simulations have shown that about 1,000 lb of incremental truck weight incurs about 0.5 percent fuel consumption increase for a tractor trailer in over-the-road duty (NESCCAF/ICCT, 2009, p. 50). For operators running at the legal weight limit, payload is reduced by any empty weight increase, causing a load-specific fuel consumption increase of 2.2 percent per 1,000 lb added to the vehicle’s empty weight. Consideration should be given to allowing carriers to be permitted this increase in weight without penalty.
Length
Boat tails will also impose trailer length increases; again carriers should be permitted such length increase without penalty, even if the boat tail is structural. One boat tail manufacturer has advised receiving a U.S. Department of Transportation (DOT) length exemption under 23 CFR 658.16, Exclusion from Length and Width Determinations, for an additional 4 ft.
Width
Trailer skirts are often installed under the van, not exceeding a 102-in. width limit. Some manufacturers have experimented with side skirts that cover the trailer bogie (and also the tractor bogie). As these are usually non-structural components, it is believed they are permitted within the current width regulation, up to 106 in. width, also according to 23 CFR 658.16. Potential issues include docking in narrow confines and drivers who are unaccustomed to a truck that is potentially 2 in. wider on each side.
Aerodynamics of Tractor-Trailer Interface (Gap)
The gap between the tractor rear face and the trailer front face is filled with large vortices at high road speed. This air motion creates a low-pressure drag on the tractor’s rear face. The conditions worsen with oblique wind direction, which causes more air to get into the gap between the tractor and trailer, increasing trailer drag. The average wind velocity throughout the 48 contiguous states is 7 mph. This results in prevailing effective yaw angles of 7 to 11 degrees on the East and West coasts, and up to 14 degrees in the Midwest. Such conditions combine to increase drag by 30 to 55 percent on tractor trailers (Wood, 2009, pp. 2, 3).
The considerable air turbulence in the gap has been ameliorated by the use of cab extenders. Manufacturers typically recommend that a gap not to exceed 30 inches, as measured from the trailing edge of the extender to the trailer face. Indeed, cab extenders are integral to the SmartWay specification.
Several developers offer a “nose” fairing and vortex stabilizer for installation on the trailer front face, as noted earlier. Several developers have prototyped partial and even complete gap closure devices, with somewhat limited improvement in system performance (1 percent fuel savings for full gap closure on an SAE J1321 test at 65 mph; TMA, 2007, pp. 56, 64).
One developer combined three design elements to manage the gap flows: a smoothed tractor underside (from bumper to back of engine), a vertical airflow blocker on the front face of the trailer, and a significantly increased cab extension. Together, these features achieved a 1.3 percent fuel consumption reduction (J1321 at 65 mph; TMA, 2007, p. 78). However, the effect of these features in the presence of a side wind (which was not reported) may be greater.
Aerodynamics of Trailers, Double Vans, and Trailers with Shorter Than 53-ft Lengths
There are a variety of current and former industry standard van-length trailers: 28-ft trailers (also 27-ft), which are usually used as doubles, plus 45-ft and 48-ft trailers.
It is expected that gap treatments and boat tails will perform on any length single trailer equally as well as with 53-ft trailers. Likewise, 45-ft and 48-ft trailers equipped with skirts should have benefits only slightly smaller than the 53-ft results. While single 28-ft trailers surely can be equipped with skirts, data are not available to quantify that benefit. Further, it is expected that on double trailers some form of gap treatment between the two trailers would be effective, but again no data are available.
There is some aerodynamic data for multiple trailers. Cooper has reported results for standard trailers without aerodynamic treatments. These results, shown in Figure 5-16, compare a single 27-ft trailer with 27-ft doubles and a 45-ft single. Note that these are Cd data. The 27-ft doubles have a Cd that is 33 percent greater than the single 27-ft trailer, but only 17 percent greater than the single 45-ft. Finally, the 45-ft trailer’s drag is 12 percent greater than the 27-ft trailer’s (these are zero yaw results; Cooper, 2004, p. 17). These data suggest that there is a significant aerodynamic drag penalty for doubles, which is likely to increase under the effect of crosswinds.
Cooper clarifies that, even though the double trailers have 33 percent higher drag than a single trailer, the freight capacity increases by 100 percent (both in terms of weight and cubic volume). So the freight-hauling efficiency provides a net 38 percent drag reduction per unit freight quantity carried and thus a nearly 20 percent fuel consumption reduction per unit freight quantity (Cooper, 2004, p. 17). Cooper’s drag
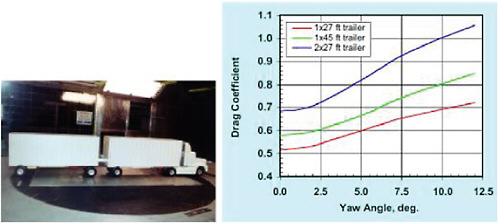
FIGURE 5-16 Drag coefficient for aerodynamic tractor with single or double trailers. SOURCE: Cooper (2004), p. 17. Reprinted with kind permission of Springer Science and Business Media.
and fuel consumption results bolster arguments that favor the increased use of long combination vehicles (LCVs), as perhaps the most cost-effective vehicle design feature available to reduce fuel consumption in the heavy-duty truck industry.
Laydon Composites Ltd. has recently completed scalemodel wind tunnel tests on double 28-ft trailers equipped with forward-looking skirts, plus a vortex generator on the trailer’s faces. These skirts included trailer and tractor axle skirts. The fuel consumption reduction of the combination shown in Figure 5-17 is 9.9 percent at 60 mph, compared to a standard 28-ft double vehicle configuration. These results are based on yaw averaged and weighted winds, using the National Aeronautics and Space Administration procedure for estimating consumption from the drag results.
Aerodynamics of Trailers Other Than Dry Vans
While the dry van constitutes the largest portion of body styles in the U.S. fleet of trailers, there is a proliferation of
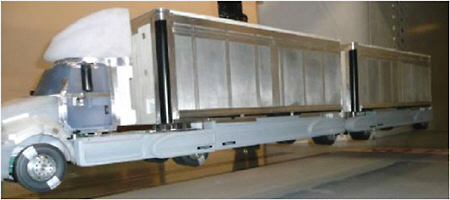
FIGURE 5-17 Laydon double trailer arrangement with trailer skirts and vortex stabilizers on both trailers; SOURCE: Courtesy of Laydon Composites.
other styles. The design of many of these non-dry vans is far less amenable to incorporation of all or even some of the aerodynamic devices found helpful on the dry van. Polk has provided a dataset for all trailers by body style for the state of Florida (Table 5-7). The results are summarized here as a surrogate for the national averages.
Aerodynamics of Van Refrigerated
The trailer-face-mounted refrigeration unit will dictate different gap treatment solutions than those used with the dry van. The refrigeration unit requires an airflow to provide engine combustion air, engine cooling air, and refrigeration condenser cooling air. On the other hand, the refrigeration unit itself may provide an aerodynamically significant reduction in drag, by virtue of providing some vortex control and associated pressure increase on the tractor rear face. Of course, the trailer skirt and trailer base areas are similar to those on a dry van, so similar aerodynamic features can be used. Freight Wing, Inc. has fitted skirts to a refrigerated van (see Figure 5-18), but test results for this trailer type are not yet available.
Aerodynamics of Flatbed Trailers
This trailer body style is among the most problematic of the semitrailer family because the space above the deck carries an endless assortment of products and implements, many with grossly unsymmetrical geometries. The trailer skirt area is judged to be as amenable to aerodynamic treatment as the dry van. One trailer aerodynamics supplier, Freight Wing, has fitted a flatbed with a skirt but has not yet tested the configuration. Note that the trailer model in Figure 5-19 also has a spread axle, which somewhat complicates skirt addition and may limit its potential effectiveness.
TABLE 5-7 Florida Trailer Population by Body Style
|
Body Style |
Population (%) |
|
Auto transporter |
0.4 |
|
Beverage |
1.4 |
|
Container chassis |
4.3 |
|
Dump |
2.3 |
|
Flatbed |
10.6 |
|
Grain |
0.2 |
|
Livestock |
0.3 |
|
Lowbed |
2.0 |
|
Tank |
4.1 |
|
Transfer |
1.4 |
|
Van |
60.9 |
|
Van refrigerated |
11.8 |
|
Other |
0.3 |
|
Total |
100 |
|
SOURCE: Personal communication between L. Hart and C. Salter, committee member, June 2, 2009. |
|
Aerodynamics of Container Chassis
This body style appears substantially similar to a van trailer. A removable container box is attached to a skeleton chassis consisting of a frame, a king pin, and an axle bogie. The difference from an aerodynamic point of view is that this style is equipped with square corners and many external ribs. These ribs provide the requisite strength to the container box to deal with the handling forces when loaded containers are lifted on and off the chassis frame but also can add to the trailer Cd (see Figure 5-20). The trailer skirt area is judged to be amenable to aerodynamic treatments, similar to those of the dry van. One trailer aerodynamics supplier, Freight Wing, has fitted a container chassis with a skirt but has not yet tested the configuration (see Figure 5-21). Unfortunately, typical empty-chassis handling and stowage practices will put trailer skirts at high risk of damage.
Aerodynamics of Tank Trailer
Since tanker trailers are normally operated at the maximum legal weight limit, the design is constrained to achieve minimum tare weight within the structural demands of the unit. While the tank itself is typically cylindrical, often with a hemispherical or somewhat rounded front face, the functional needs often result in an external skeleton of pipes, tubes, and so forth, to facilitate product loading/discharge and personnel protection when accessing certain operational devices. Further, the rear shape of the leading tractor poorly matches the trailer face in aerodynamic terms. Standard high-roof sleepers or day cab air deflectors are too high for tanker-trailer applications. Trailer skirts can be fitted as the dry van. One trailer aerodynamics supplier, Freight Wing, has fitted a tank trailer with a skirt, but has not yet tested the configuration (see Figure 5-22). Because any weight added for aerodynamics will reduce the load that a tanker can carry, these features are not likely to be financially attractive to any operator unless regulatory allowances are made.
Aerodynamics of Auto Transporter Trucks
The population of this body style is relatively small. This design style also has a complex nonaerodynamic array of structural tubes deploying the moving floors. Interestingly, one transport company, Precision Motor Transport Group (PMTG), has created a variety of trailer configurations incorporating curtain sides, rounded noses, and boat tails. This carrier specializes in transport of upscale sedans, and the auto capacity is inferior to the more standard designs. PMGT’s trailer system can hold six to eight sedans, compared to nine to eleven for a typical transporter trailer. The aerodynamic performance must be substantially superior to the traditional design, but no data are available at this time.
PMGT’s solutions raise the question of what could be done to improve other current body styles that have poor
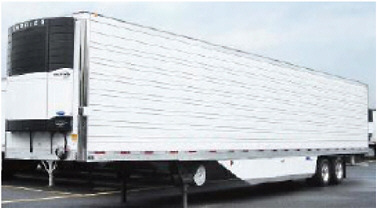
FIGURE 5-18 Refrigerated van trailer with Freight Wing skirts. SOURCE: Courtesy of Freight Wing.
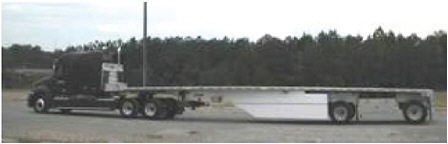
FIGURE 5-19 Freight Wing skirts on flatbed trailer. SOURCE: Courtesy of Freight Wing.
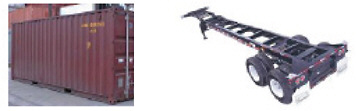
FIGURE 5-20 New 40-ft-long container built by TRS Containers (left) and container chassis (right). SOURCE: Courtesy of TRS Containers, Avenel, New Jersey.
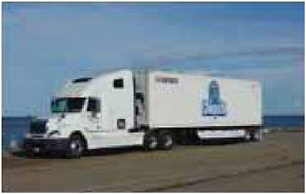
FIGURE 5-21 Container chassis with Freight Wing trailer skirt. SOURCE: Courtesy of Freight Wing.
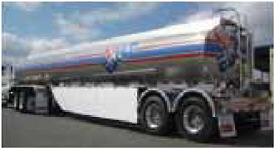
FIGURE 5-22 Tank trailer with Freight Wing skirts. SOURCE: Courtesy of Freight Wing.
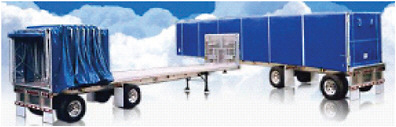
FIGURE 5-23 Sturdy-Lite curtain side design for flatbed trailers. SOURCE: Courtesy of Sturdy-Lite.
aerodynamics. For example, could many of the normal flatbed/lowboy styles accommodate a curtain side/roof frame to achieve a major improvement in aerodynamics with accompanying fuel savings? At least two companies, Edscha Trailer Systems and Sturdy-Lite, market a rolling tarp system that allows any conventional flatbed or lowboy trailer to be converted into a van-style unit and back to a flatbed in minutes. The system works by rolling the fabric tarp on a track that is attached to the side of the trailer. No aerodynamic performance data are available at this time, and a great deal of testing would be required to determine the benefits of this approach compared to normal loading of freight on a flatbed, since so many freight configurations are possible. Notice that the Sturdy-Lite solution incorporates a full-height vertical nose plate, where many flatbed trailers have none, and a rear curtain frame (see Figure 5-23).
Combination of Solutions
In 2005, Walmart initiated a program with a stated goal of doubling the fuel economy of its (then) 7,200-tractor private carrier fleet from 6.5 mpg to 13 mpg by 2015 (see Figure 5-24).
Collaborating with suppliers Peterbilt and Great Dane, evaluated components included an 12-ft 6-in. trailer height (down from industry standard 13-ft 6-in.), 12-in. trailer drop belly (to recover internal volume except over the tractor axles), an aerodynamic tractor with matching lower roof fairing and cab extenders, trailer skirts (as well as the drop box), a rigid 2-ft boat tail, and an auxiliary power unit (for idle management) (italics indicate aerodynamic features).
Walmart reports a 12 percent improvement in fuel economy with this first-generation package of components and design alterations, using the SAE J1321 test procedure. Interestingly, the trailer height reduction of 12 in. reduced the frontal area by 7 percent in this combination; correspondingly, a 3 to 4 percent fuel consumption reduction would be expected from this change alone. Note that some loss of cargo capacity results from Walmart’s changes, and the new trailer height is not compatible with existing loading docks. Components still being evaluated in subsequent generations include a hybridized diesel-electric system and auto-deploying trailer skirts.
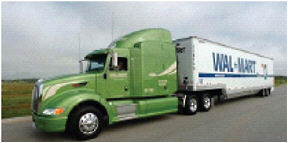
FIGURE 5-24 Walmart’s 2008 low fuel consumption tractor trailer. SOURCE: Courtesy of Walmart.
As part of the TMA-DOE collaborative study on tractor-trailer aerodynamics, Mack Trucks studied the separate and combined effects of the three aerodynamic technologies shown in Figure 5-25. The three features were a 24-ft long trailer skirt with 9-in. of road clearance, a pair of boat tail options (2-ft and 4-ft), and a unique flexible gap-closing system. The performance of this combined set of features was evaluated using the SAE J1321 on-road procedure at 65 mph. A fuel consumption reduction of 7.75 percent was measured, which suggests a 15 percent reduction in Cd. While the test parameters met all the precision criteria of the procedure, the prevailing winds and yaw conditions were not reported.
A recent DOE initiative includes a project valued up to $2 million for the development, evaluation, and deployment of advanced aerodynamic trailer technology. The DOE has selected Navistar International Corporation (Fort Wayne, Indiana) for the 30-month project with a goal to design, demonstrate, and bring to market a tractor-trailer combination and tire package that can reduce the fuel consumption of a heavy vehicle by at least 15 percent. Following development, a commercial fleet will evaluate the benefits of the new technology package through real-world use. After the term of the project, the team members will make this fuel-efficient technology package available for sale. Team members on the program include Frito Lay, Kentucky Trailer, Freight Wing, Michelin, and DOE’s Lawrence Livermore National Laboratory.
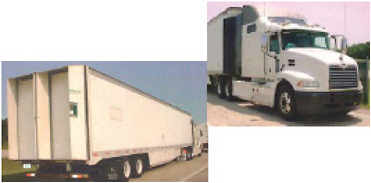
FIGURE 5-25 Mack truck with aerodynamic device combination. SOURCE: TMA (2007), pp. 57, 58, 60.
Straight Trucks with Aerodynamic Treatment
Trucks with box van bodies are most amenable to the solutions found on van trailers. Nose cones have been widely applied, but little or no SAE J1321 data are available (see Figure 5-26). Many straight trucks operate in urban and suburban settings, where aerodynamic treatments are unlikely to offer a significant fuel savings, but those few straight trucks used routinely in highway operations could see significant benefits.
One trailer aerodynamics manufacturer, Freight Wing, has fitted skirts to a van body straight truck, but no performance data are available (see Figure 5-27).
Aerodynamics of Motor Coach
Because of their frequent high-speed operation, some motor coaches may benefit significantly from aerodynamic drag reduction. However, there is limited information available in the literature, and little additional data were provided during the committee’s site visits that speak directly to motor coach aerodynamics. As such, the estimates of motor coach aerodynamic drag reduction potential in this report are based on extending results of the line-haul analysis to the motor coach segment (see Table 5-8).
The following approaches were considered for optimizing the aerodynamics of the tractor trailer: cab streamlining, boat tailing, underbody treatments, gap treatments, wheel fairings, removal of the mirrors, and active flow control. Of these, gap treatments are clearly not applicable to motor coaches; and given the already-low ride height, skirts and underbody treatments likely do not offer a significant benefit. Active flow control has not yet been demonstrated; moreover, it is most beneficial on streamlined, as distinguished from bluff, bodies (Salari, personal communication, 2009).
Of the remaining options, cab streamlining and boat tails would appear to offer the best prospects for reducing aero-
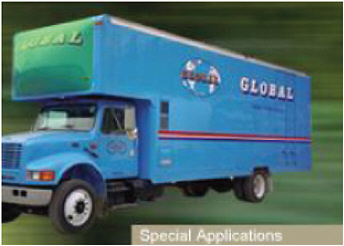
FIGURE 5-26 Nose Cone fairing on face of straight truck. SOURCE: Photo provided with permission by FitzGerald Corporation, national marketer for Nose Cone Mfg. Co. Nose Cone is a registered trademark.
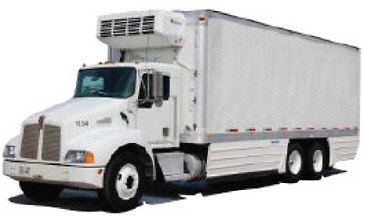
FIGURE 5-27 Laydon skirt on straight truck. SOURCE: Laydon Composites.
dynamic drag. Boat tails on a tractor trailer are assumed to reduce drag by 6 to 9 percent and to offer fuel consumption benefits of 3 to 5 percent. Additional cab streamlining in the line-haul segment is estimated to reduce drag by 6 to 8 percent and to reduce fuel consumption by 3 to 4 percent. In combination, these approaches would reduce drag by 12 to 18 percent and could offer a 6 to 9 percent reduction in fuel consumption (if average speeds are >60 mph). It is assumed that these benefits come at a similar cost to those assumed for the line-haul segment: $2,750 for streamlining and $1,500 to $2,000 for boat tails. Given the very low manufacturing volumes for motor coaches, the committee expects that actual costs are likely to be higher.
Aerodynamics of Class 2b Pickups and Vans
The potential for aerodynamic drag reduction in the Class 2b segment is estimated based on analysis conducted during the National Highway Traffic Safety Administration (NHTSA) rulemaking for the light-duty Corporate Average Fuel Economy (CAFE) standard published in 2009. Although the NHTSA analysis extends only to Class 2a vehicles (<8,500 lb GVW), it is assumed that similar aerodynamic improvements can be implemented in Class 2b. In general, Class 2b vehicles have form factors similar to that of their smaller counterparts considered in the NHTSA rulemaking, which suggests that this is a reasonable approximation.
TABLE 5-8 Motor Coach—Applicable Aerodynamic Technologies
|
Technology |
Fuel Consumption Reduction (%) |
Cd Improvement (%) |
Cost ($) |
|
Boat tail |
3-5 |
6-9 |
1,500-2,000 |
|
Vehicle streamlining |
3-4 |
6-8 |
2,750 |
The NHTSA rulemaking considered underbody treatments; streamlined hood, windshield, fenders, and grill; reduced ride height (analogous to trailer side skirts); low-drag side mirrors; optimized airflow pathways; and wheels or wheel wells. All together, the NHTSA rulemaking assumes that a 10 percent reduction in Cd is feasible. As in heavy trucks, this level of drag reduction is assumed to result in a 4 to 5 percent reduction in fuel consumption (see Table 5-9). Caution is necessary in the use of these fuel consumption estimates since they apply to a 60 to 65 mph average speed. If these trucks are used principally in a pickup/delivery duty where average speed is about 40 mph, the fuel consumption benefit of the aerodynamic component will shrink by 70 percent. At speeds below 40 mph, the benefit becomes insignificant.
These benefits are estimated to range from $60 to $116 in added cost. These cost estimates were applied independent of vehicle class, so no adjustment was applied to translate these to Class 2b vehicles.
Aerodynamic Summary by Sector
TIAX, in its report for the committee, summarized the aerodynamic fuel consumption potential reduction by time frame and application (see Table 5-10).
The committee believes the potential for aerodynamic improvement for the tractor-trailer application is under-
TABLE 5-9 Class 2b Van and Pickup—Applicable Aerodynamic Technologies
|
Technology |
Fuel Consumption Reduction (%) |
Cd Improvement (%) |
Cost ($) |
|
Vehicle streamlining |
4-5 |
10 |
60-116 |
|
SOURCE: TIAX (2009), p. 4-50. |
|||
TABLE 5-10 Aerodynamic-Related Fuel Consumption Reduction Packages by Sector and by Time Frame
|
Sector |
2013-2015 (%) |
2015-2020 (%) |
|
Tractor trailer |
5.5 |
11.5 |
|
Class 6 box truck |
3 |
6 |
|
Class 6 bucket truck |
0 |
0 |
|
Motor coach |
0 |
8 |
|
Class 2b pickup/van |
3 |
3 |
|
SOURCE: TIAX (2009). |
||
stated by TIAX. In 2013 to 2015 a 9 percent reduction in fuel consumption is achievable versus 5.5 percent based on the “full-package” average in Figure 5-15. In 2015 to 2020 a 15 percent reduction in fuel consumption is achievable versus 11.5 percent at 65 mph. This estimate is based on improved full-package trailer performance (as described in Figure 5-15), plus a next-generation tractor performance of 3 to 4 percent (see Table 5-5). These two performance values are combined and confirmed by the method of multiplication of consumptions.
Also, the committee has recognized the Class 6 Box Truck aerodynamic design features in Table 6-6 that are currently available for implementation and has adopted them in Table 5-10 to report a 3 percent fuel consumption reduction for the 2013 to 2015 period. The 3 percent fuel consumption reduction is achievable provided that such box trucks have an average speed significantly higher than the 30 mph typical for pick-up and delivery duty. At a 30 mph average, the fuel consumption would be about 1 percent.
AUXILIARY LOADS
In addition to driving the wheels, power from the engine cylinders is used for many requisite auxiliary loads. Compressed air is needed for the braking systems; air conditioners are used for driver and passenger comfort; and power-steering systems require power to drive the associated pumps, compressors, and fans; and finally an alternator is used to charge the vehicle’s battery. The power to operate these systems comes from the engine cylinder and represents a use of fuel energy for functions other than putting power to the wheels. (The power required for running the coolant pump, fuel pump, and lubricating pumps is classified under the category of accessories, as shown in Figure 5-1.) The impact that driving these auxiliaries has on an engine’s fuel consumption will be highly dependent on the engine’s speed and the duty cycle on which the vehicle operates. Estimates that approximately 1.7 to 4.5 percent of fuel energy could be saved through the use of dedicated auxiliary power units (APUs) have been reported to the committee.6
Tables 5-1, 5-2, and 5-3 show the power consumption for auxiliaries for different vehicles operating under representative operating conditions. The power consumed by auxiliaries can be significant, approximately 25 percent of the total power in the case of a transit bus with the air conditioner operating. The extent to which these auxiliaries are used is very dependent on the vehicle and its duty cycle, as shown in Tables 5-11 and 5-12.
TABLE 5-11 Examples of Power Requirement for Selected Auxiliary Loads
TABLE 5-12 Auxiliary Use for Line-Haul Duty Cycles
|
Component Name |
Line-haul Duty Cycle (% of time on) |
Local-haul Duty Cycle (% of time on) |
|
A/C compressor |
50 |
50 |
|
Power steering |
10 |
60 |
|
Air brake compressor |
5 |
30 |
|
Engine fan |
5 |
10 |
|
Alternator |
100 |
100 |
|
Oil pump |
100 |
100 |
|
Coolant pump |
100 |
100 |
|
SOURCE: Society of Automotive Engineers (SAE) J1343, “Information Relating to Duty Cycles and Average Power Requirements of Truck and Bus Engine Accessories,” August 2000. |
||
Improvement in these auxiliary systems and the use of electric drives instead of direct mechanical drives from the engine offer potential to reduce fuel consumption. However, the fuel consumption reduction will be very application specific. Hendricks and O’Keefe (2002) suggest that reduction of fuel consumption by optimizing the handling of auxiliary loads is indeed highly dependent on the vehicle and its driving cycle. Also, it is important to realize that reducing the mechanical power requirement from the engine to drive auxiliaries will not necessarily be a one-to-one reduction in fuel consumption. In general, reducing the load on the engine will also result in a decrease in the engine’s thermal efficiency. To gain the maximum benefit from reducing auxiliary power requirements and optimizing their operation, the engine will need to be re-optimized for the new duty cycle. This will need to be done for each vehicle application under consideration. However, it is technically feasible to save a portion of this 2.5 percent of the fuel’s energy.
ROLLING RESISTANCE
Technologies for Reducing Rolling Resistance
Tire rolling resistance accounts for roughly one-third of the power required to propel a line-haul truck at highway speeds on level roads (Bradley and Nelson, 2009; Kenworth, 2008). The force resisting a rolling tire is primarily due to the inelastic cyclic tire deformation when rolling and the shear and compressive forces at the contact patch. The resistive force has been found to be nearly linearly proportional to the load on the tire, and hence it is convenient to define a coefficient of rolling resistance, Crr, as follows:
For a given tire, Crr is mildly dependent on temperature, tread wear, and velocity (LaClair, 2005), which would need to be accounted for in vehicle models and must be considered in on-road comparative testing. Inflation pressure has a pronounced impact on Crr, as does wheel alignment (slip angle). Opportunities for managing these items are discussed below, along with tire technology.
Crr is highly dependent on tire technology, and large reductions in Crr have been seen in the past few decades. Crr is dimensionless, with typical values for modern truck tires of 0.004 to 0.008. For convenience the Crr is often expressed in values of kilograms of force of rolling resistance per metric ton of load (kg/T), which converts the values to 4.0 to 8.0 kg/T.
Improved Tires
The historical trend in Crr reduction as presented by Melson (2007) is shown in Figure 5-28. A significant recent advancement in tire technology is the New Generation Wide-Base Single (NGWBS) truck tire. With this technology, one NGWBS tire (e.g., 455/55R22.5 and 445/50R22.5 dimensions) replaces two conventional dual tires, as shown in Figure 5-29. In today’s tire usage, conventional dual tires have Crr ranging typically from 5 to 8 kg/T, depending on the design. One of the significant benefits of the current NGWBS tire is its lower rolling resistance coefficient, with a range of 4 to 5 kg/T. As seen in Figure 5-30, dual tires span a range of Crr and can also qualify as low rolling resistance per the SmartWay definition.7
Replacement of typical dual tires with NGWBS tires can give fuel economy improvements approaching 10 percent for combination trucks, based on modeling as well as real-world studies (LaClair, 2005; Capps et al., 2008). Furthermore, U.S. EPA studies (Bachman et al., 2005, 2006) have demonstrated reductions in oxides of nitrogen emissions. The range of fuel economy improvements from tests is 5 to 10 percent, influenced by the vehicle type, driving cycle, and baseline tire (see Figure 5-30). Tire rolling resistance is further impacted noticeably by wear (tread depth), an additional variable in test results (Goodyear, 2003, p. 73). An additional confounding factor to test would be the amount of circumference mismatch in dual tires to minimize scrubbing losses. Typical results from a modeling study of a Class 8 truck show how the impact of tire Crr varies depending on drive cycle and load (see Table 5-13).
Modest further reductions in Crr are projected. Melson (2007) shows the Crr of trailer tires in particular is expected to drop slightly below 0.004. The Aerospace Corporation, in a 1982 study for the DOE, projected that Crr would reach 0.0045 in the following decade, which has proven accurate. Consistent with these sources, Reinhart8 reported to the committee that the NESCAFF/ICCT study team had determined that a Crr of 0.0045 was an appropriate estimate for future technology.
Despite recent advances in tire technology, it should be noted that NGWBS tires, which provide the lowest levels of Crr, are presently not available in tire dimensions used on many Class 3 to 6 vehicles, and tires with the very lowest rolling resistance levels may not be practical for all applications. Tires, like most products, must satisfy a range of performance criteria (e.g., rolling resistance, wear, noise, traction, durability, cost), and several inherent design tradeoffs exist when balancing the tire performance for a particular use. For example, tires designed for optimal mud or
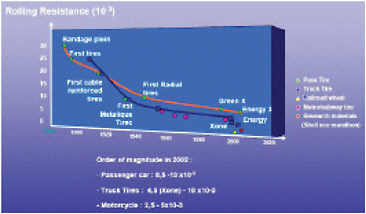
FIGURE 5-28 Rolling resistance technology, 1910-2002. SOURCE: MNA (2007). Courtesy of Michelin North America.
snow traction typically have more void in the tread pattern. This generally provides a tire with a higher Crr than for tires with lower void content, since the reduced rigidity results in increased tread rubber deformation, in both compression and sheer, thereby increasing the hysteretic losses responsible for rolling resistance. Particular needs for individual consumers and tire uses will make it very challenging to have uniformly low rolling resistance for all vehicle applications, and it is likely that some vehicle applications will always use tires with Crr values greater than the lowest levels available on the market. Also, fleet operating practices of running out partially worn tires from steer and drive axles on the trailer will often result in less than fully optimized rolling resistance at different stages of tire life. And even in long-haul vehicles, the practice of retreading steer tires (which legally cannot be operated on the steer axle after retreading) will assure that nearly 10 percent or more of tires in use will always be dual tires. Finally, retreaded tires generally have a somewhat higher level of rolling resistance than new tires. These factors must be taken into consideration when establishing any regulation regarding tire rolling resistance, and it should be well understood that fleet practices will have a very direct impact on the average level of rolling resistance for tires in actual use.
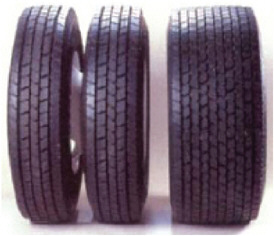
FIGURE 5-29 New-generation wide-base single tire (right) to reduce the rolling resistance of conventional dual tires (left). SOURCE: Presentation to the committee by C. Bradley and S. Nelson, Michelin Tire North America, “Truck Tires and Rolling Resistance,” February 4, 2009. Courtesy of Michelin Tire North America.
Recent proposals have been made to create a tire fuel efficiency rating system for replacement tires and to allow point of sale information to be displayed to inform consumers of the role that tires have on fuel efficiency. The approach is similar to the Energy Star program and EnergyGuide labeling used for household appliances and other products. Pursuant to the Energy Independence and Security Act of 2007, a national tire fuel efficiency consumer information program was developed for passenger car tires by NHTSA (NHTSA, 2009b). The NHTSA proposed rulemaking proposes to require tire manufacturers to rate the fuel efficiency of their tires using the International Organization for Standardization (ISO) 28580 standardized test method for tire rolling resistance measurement. The tire industry has been working recently to develop this test standard, which is applicable to new passenger car, truck, and bus tires. EPA is considering this same standardized test method for future SmartWay definitions.
NGWBS tires also give a weight savings of roughly 340 kg in a typical combination tractor-trailer rig, allowing for an increase in payload capacity, which can further improve freight efficiency. Barriers to the adoption of NGWBS tires have included concerns relative to the following:
-
Perceptions of the difficulty/downtime associated with flats
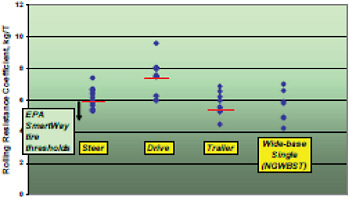
FIGURE 5-30 Example rolling resistance coefficients for heavy-duty truck tires. SOURCE: Presentation to the committee by C. Bradley and S. Nelson, Michelin Tire North America, “Truck Tires and Rolling Resistance,” February 4, 2009. Courtesy of Michelin Tire North America.
-
Safety/stability in the event of a tire failure
-
Availability of replacement tires
-
Increased road damage
Various studies have been conducted recently to address these above concerns for NGWBS tires, however, and results have demonstrated performance similar to that of dual tires. Furthermore, tire manufacturers have made efforts to minimize or mitigate any inconveniences that could be experienced on the road when using NGWBS tires.
Several of the concerns stated above can be attributed to past experiences and studies of the original 65-series on/off-road and regional single tires (e.g., 385/65R22.5 and 425/65R22.5). These tires are normally operated at elevated service inflation pressures, with consequently reduced tire footprint size and peak tire-road contact stresses that surpass those of traditional tires. Studies of the original “65-series singles” concluded that increased road damage could be attributed to these tires, and this naturally generated concern for state and federal departments of transportation when NGWBS tires were developed and placed into use. Although differences have been observed in various metrics of roadway stresses for dual and NGWBS tires, pavement damage is expected to be similar for these two types of tires for primary roads (Al-Qadi, 2007a,b).
TABLE 5-13 Results of Truck Model Showing Effect of Coefficient of Rolling Resistance, Crr, on Fuel Economy for Several Drive Cycles
|
Heavy Truck (40 ton) 12.01 Diesel Engine |
Fuel Consumption (gal/100 miles) |
Fuel Savings (gal/100 miles) |
Percent |
|
|
Crr = 5.5 kg/t |
Crr = 4.5 kg/t |
|||
|
Suburban use, half loaded |
16.53 |
15.98 |
0.55 |
3.3 |
|
Regional use, half loaded |
15.13 |
14.53 |
0.59 |
3.9 |
|
Long-haul use, half loaded |
12.62 |
11.94 |
0.68 |
5.4 |
|
Suburban use, fully loaded |
21.29 |
20.57 |
0.72 |
3.4 |
|
Regional use, fully loaded |
19.76 |
19.04 |
0.72 |
3.7 |
|
Long-haul use, fully loaded |
14.92 |
14.02 |
0.89 |
6.0 |
|
SOURCE: C. Bradley and S. Nelson, Michelin Tire North America, “Truck Tires and Rolling Resistance,” presentation to the committee, February 4, 2009. Courtesy of Michelin Tire North America. |
||||
For safety concerns, testing has shown that rapid air loss events on NGWBS tires do not compromise the stability and behavior of the vehicle (Bradley and Nelson, 2009). Additionally, rollover performance with NGWBS tires has been shown to be similar to or improved relative to dual-tire rollover performance (Knee et al., 2008).
Regarding flat tires, a vehicle cannot continue driving with a flat NGWBS tire without risking serious damage to the tire and wheel. Although it may be possible to continue to drive a vehicle for tire replacement if one dual tire goes flat, this practice is not recommended and may not be legal. (Federal Motor Carrier Safety Administration Regulation Title 49 Code of Federal Regulations Part 393.75 (a), states, “No motor vehicle shall be operated on any tire that … is flat or has an audible leak.”)
In the United States, the use of NGWBS tires is legal in all 50 states on nonpermit-required vehicles (e.g., for loads up to 80,000 lb). There currently exist some state restrictions on NGWBS tire use where a state oversize or overweight permit is required for vehicle operation. These restrictions are premised on the studies of the original 65-series single tires. Furthermore, the use of NGWBS tires in Canada may require a special permit to operate at the Canadian dual-tire maximum load of 9,000 kg per axle in some provinces. Since
many vehicles operate in both the United States and Canada, an amendment was passed in May 2008 to the Canadian Ministers of Transportation and Highway Safety memorandum of understanding on vehicle weights and dimensions approving the U.S dual-tire load parity of 7,700 kg axle (15,400 kg per tandem axles) for the NGWBS single tires.
Tire Pressure Maintenance and Effects
Rolling resistance is strongly affected by the pressure in a tire, increasing steadily as tire pressure decreases below the recommended inflation pressure. For truck tires, rolling resistance can be expected to increase by about 5 to 8 percent for a 20 percent reduction in pressure. This will typically yield a 2 to 3 percent loss in fuel economy in a Class 8 truck if all tires are underinflated (SmartWay; Goodyear, 2003, p.72). While trucking fleets generally monitor tire pressure more frequently than do personal car owners, substantially underinflated tires are likely responsible for a relatively large level of unnecessary fuel consumption. For passenger cars and light trucks, the NHTSA conducted a study following the passage of the Transportation Recall Enhancement, Accountability, and Documentation Act of 2000 in which tire pressure was measured on 11,530 cars and light trucks. The study found that 27 percent of passenger cars and 33 percent of light trucks have at least one tire significantly underinflated (by 20 percent or more). For truck tires a separate NHTSA study (Woodrooffe et al., 2008) found that tire underinflation is one of the three main causes of truck tire casing removals. The level of underinflation on truck tires across the U.S. fleet is not precisely known; however, the impact on fuel economy can be rather significant.
Given these facts, it is clear that tire pressure monitoring systems (TPMSs) can help improve the fuel consumption and safety of heavy trucks by ensuring that adequate pressure is maintained and, consequently that the rolling resistance is at the design level. There is already a moderate usage of TPMS in fleets, although a detailed quantification of the percentages of trucks equipped with TPMS is not available at this time. Automatic tire inflation (ATI) systems are also commercially available that maintain tire pressure at the desired level.
Use of nitrogen instead of air for tire inflation has been found to reduce pressure loss rate (NHTSA, 2009a). In static laboratory tests the inflation pressure loss for new tires inflated with nitrogen was approximately two-thirds of the loss rate of new tires inflated with air. Similar differences between nitrogen and air permeation rates in new tires were found under dynamic, loaded laboratory testing. This is attributed primarily to the higher diffusion rate of oxygen through rubber compared to nitrogen, which was observed and characterized decades ago. In certain fleet operations the use of nitrogen fill would be effective in place of or in addition to TPMS and would lessen the need for ATI systems. The same NHTSA study reported that inflating tires with nitrogen in place of air had no direct effect on laboratory rolling resistance performance. Walmart reported to the committee that it found a 1.0 to 1.5 percent reduction in fuel use after instituting nitrogen inflation protocols.
Tire/Wheel Alignment
The alignment of each axle has a direct impact on rolling resistance. Misalignment effects that result in a slip angle on a truck’s tires (both toe settings and out-of-perpendicular (thrust) or out-of-parallel (scrub) tandem-axle alignment—see Figure 5-31) can strongly impact rolling resistance, in addition to negatively affecting tire wear and possibly vehicle handling. Camber effects, by comparison, are relatively small on rolling resistance, and the slip angle impact is thus the only alignment effect considered here. For a given slip
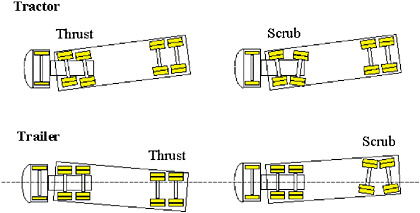
FIGURE 5-31 Tractor-trailer tandem-axle misalignment conditions. SOURCE: Kreeb and Brady (2006).
angle, α, on the tire, the added rolling resistance is given by the following relationship (Schuring, 1977):
where Cα is the cornering stiffness of the tire.
An estimation of the impact of misalignment on fuel consumption can be made by assuming that the average misalignment on each wheel of the truck is approximately 0.1°. (This level is consistent with standard practices and recommendations for tandem axle alignment in the industry and typical toe settings.) Based on a cornering stiffness of 3 kilonewtons (kN) per degree, the increase in rolling resistance per tire is about 0.5 N, which for an average rolling resistance coefficient of 7 kg/T with a fully loaded vehicle represents about 0.4 percent of each tire’s rolling resistance. Again assuming that rolling resistance accounts for about one-third of the mechanical energy needed to propel a long-haul truck, the average fuel economy impact is about 0.1 percent. Note that the quadratic dependence of rolling resistance on slip angle means that if the average slip angle is 0.2°, the fuel-savings potential increases by a factor of 4. In any case this analysis indicates that the loss in fuel economy on heavy trucks resulting from wheel alignment is on the order of 0.1 percent. It should be noted once again that these estimates in fuel consumption are intended to provide only order-of-magnitude assessment and that the assumptions used to make this evaluation are generalizations and large variations can exist among different vehicles.
Impact of Reduced Rolling Resistance for Different Truck Classes
Given the large fuel use in Class 8 trucks, coupled with the large impact of rolling resistance, most information about tire effects has been quantified only for this class. Lower vehicle loads result in a reduction in the total rolling resistance, and the relative impact that tires have on fuel economy therefore decreases for vehicles with lower mass (see estimates of relative energy losses among different vehicle applications in previous sections of this chapter). Also, reductions in rolling resistance do not generate the same level of fuel savings for drive cycles that include frequent stops and starts as for drive cycles with minimal amounts of braking, at least for traditional vehicles that do not employ regenerative braking. As a result of these factors, the contribution of rolling resistance to truck fuel use is less in delivery trucks and still less in refuse haulers or buses, roughly 10 percent of total energy consumed (the energy balances shown in Figure 5-1 and in Chapter 4). Hence, the potential improvements in truck fuel consumption are less for truck classes other than Class 8 line haul. As reported in site visits by the committee, the choice of low rolling resistance tire design for urban operation must consider the tire scrub caused by smaller turning radii. Increased probability of damage from curb impacts also was noted. Accordingly, it was reported to the committee that wide single tires were less desirable for this type of use (based particularly on the committee’s site visits to Walmart). Tires for refuse haulers are often designed for resistance to cuts and rough or soft terrain encountered at dump sites and would not likely have the lowest levels of Crr.
NHTSA has recently proposed new fuel-economy labeling for passenger car tires as well as recommended standard test procedures (NHTSA, 2009b). While the regulation would only apply to passenger car tires, this labeling can be voluntarily applied to tires for light trucks and Class 2b vehicles. The proposal for labeling stemmed from the 2006 Transportation Research Board (NRC, 2006) study of passenger car tires, which concluded that a 10 percent reduction in rolling resistance was technically and economically feasible, and that this would improve fuel economy by 1 to 2 percent. This is consistent with analysis available in the existing literature (LaClair, 2005). The committee believes these findings are applicable to Class 2b pickups and vans.
Rolling Resistance Summary
TIAX, in its report for the committee, summarized the rolling resistance fuel consumption potential reduction by range of years and by application in Table 5-14. The committee believes that a lower Crr is achievable (i.e., 0.0045)
TABLE 5-14 Rolling Resistance Fuel Consumption Reduction Potential by Class
on more axles in this time frame (2016), which would result in an 11 percent reduction in fuel consumption.
VEHICLE MASS (WEIGHT)
Truck weight (empty weight plus payload weight) affects fuel consumption (gallons per mile) primarily by reducing tire rolling resistance and unrecovered energy used when accelerating or grade climbing. The energy needed to overcome these resistances is essentially linearly dependent on truck weight. Truck weight effects are more conspicuous and dominate fuel consumption over duty cycles with frequent stops and accelerations, or on roads with notable grade. As an illustration of the significance of powering a vehicle of 80,000 lb GVW, maintaining 50 mph on a mere 3 percent grade triples the engine power demand compared to a level road (from 150 hp on a level road to 450 hp on the 3 percent grade; Caterpillar, 2006).
Reducing the unloaded (empty) weight of the truck and trailer, at a fixed payload, always benefits the metric of gallons per payload ton-mile and directly reduces fuel consumption in gallons per mile. This depends on whether the carrier adds payload to take advantage of the tare weight reduction while staying within the legal weight limit (80,000 lb for Class 8), or whether the carrier is at maximum cargo volume (“cubed-out”). For example, for a 35,000-lb truck/trailer that carries 45,000 lb of cargo, reducing weight by 1,000 lb increases capacity, and hence reduces the payload-specific fuel consumption, by 2.2 percent.
Vehicles with maximum GVW loads may still operate at reduced loads on the same trip after off-loading at stops, to the extreme example of tankers running empty on a return trip. During reduced-load vehicle miles traveled, the fuel consumption (gallons per mile) will conspicuously improve with reduced weight. For vehicles that are at maximum volume capacity, vehicle weight savings will always provide the more conspicuous reduction in fuel use.
Truck Weight and Payload Characteristics
In considering the fuel-savings opportunity through light-weighting technology, it is necessary to review the empty truck weight, maximum payload, and then the typically used payload weight in commerce. The range of truck weights and payload capacities is shown in Table 5-15. Focusing on Class 8 combination trucks for now, more specifically, a representative Class 8 sleeper cab tractor will weigh 16,000 to 19,000 lb, and a van trailer (nonrefrigerated) will typically weigh about 14,000 lb. The distributions of weight among the major components of the tractor are shown in Figures 5-32 and 5-33 (Smith and Eberle, 2003).
Truck Weights on the Road
How many trucks on the road are running at the maximum GVW and thus would benefit from lightweighting by increasing payload? With the demise of the VIUS report,9 the most recent data are derived from truck scale reporting and weigh-in-motion devices and reporting from surveyed fleets. Figures 5-34 through 5-36 show the distribution of truck weights on the road, again focused mostly on five-axle Class 8 combination trucks. The data in Figures 5-34 through 5-36 were corroborated by direct input from DOT, which reported the following average weights from WIM stations (M. Onder, personal communication, U.S. Department of Energy, May 2009):
TABLE 5-15 Typical Weights of Trucks, Empty Versus Gross Weight
|
Truck Class |
Gross Weight Range (lb) |
Empty Weight Range (lb) |
Payload Capacity Maximum (lb) |
Payload Capacity Maximum (% of empty) |
|
1c |
0(3,200)-6,000 |
2,400-5,000 |
1,000 |
20 |
|
1t |
0(4,000)-6,000 |
3,200-4,500 |
1,500 |
33 |
|
2a |
6,001-8,500 |
4,500-6,000 |
2,500 |
40 |
|
2b |
8,501-10,000 |
5,000-6,300 |
3,700 |
60 |
|
3 |
10,001-14,000 |
7,650-8,750 |
5,250 |
60 |
|
4 |
14,001-16,000 |
7,650-8,750 |
7,250 |
80 |
|
5 |
16,001-19,500 |
9,500-10,800 |
8,700 |
80 |
|
6 |
19,501-26,000 |
11,500-14,500 |
11,500 |
80 |
|
7 |
26,001-33,000 |
11,500-14,500 |
18,500 |
125 |
|
8a |
33,001-80,000 |
20,000-26,000 |
54,000 |
200 |
|
8b |
33,001-80,000 |
20,000-26,000 |
54,000 |
200 |
-
Single-unit truck, 18,728 lb GVW
-
Single tractor trailer truck, 54,145 lb GVW
-
Multi tractor trailer truck, 59,091 lb GVW
These sources are consistent in concluding that a relatively modest fraction of trucks on the road are near the maximum GVW. Hence, with lightweighting technology, the reduction in fuel consumption will be very apparent as reduced gallons per mile (and per ton-mile).
Impact of Vehicle Weight on Fuel Consumption
As described elsewhere in this study, the truck weight impacts the power needed to propel the truck through rolling resistance, grade climbing, and accelerations. Clearly the duty cycle will influence the degree to which weight savings will reduce fuel consumption. It is also expected that the impact of weight reduction as a percentage of fuel consumption depends on the base weight of the truck.
For the heavier weight classes, a commonly used metric is the percentage change in fuel consumption per 1,000 lb of weight reduction. Data from a recent on-road study were analyzed to illustrate the impact of weight on real-world fuel consumption, shown in Figure 5-37.
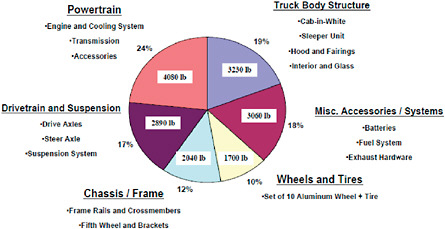
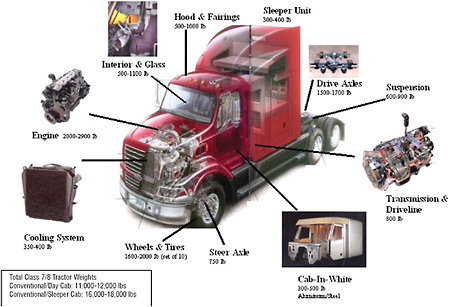
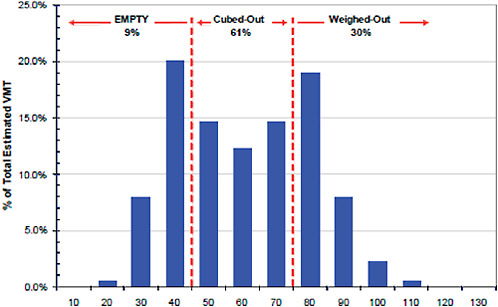
FIGURE 5-34 Truck weight distribution. SOURCE: M.J. Bradley and Associates (2009).
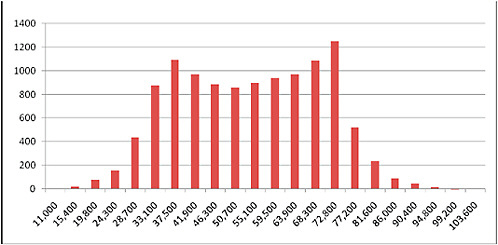
FIGURE 5-35 Truck weight distribution from 2008 weigh-in-motion. SOURCE: New West Technologies.
These data and similar information from numerous other sources are summarized in Table 5-16 for a wide range of vehicle classifications. Published tests on weight effects merely vary the payload for the most part and do not convey the potential fuel savings that could be achieved if engines were downsized or gear ratios changed. Typically, models are very effective and would be needed in examining those effects.
Another advantage of weight reduction technology is the ability afforded the truck manufacturer to maintain the axleload limits imposed by regulation. There is a legal load limit of 34,000 lb for a tandem axle, and 20,000 lb for a single axle on interstate roads, without a special permit (or some higher levels in specific states). With the 80,000-lb limit for maximum gross weight on most U.S. roadways, trucks usually will target about 12,000 lb on the steer axle and 34,000 lb
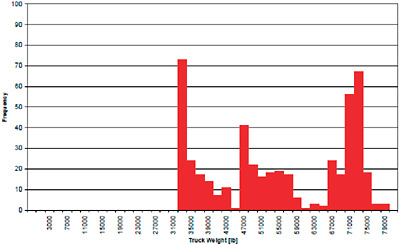
FIGURE 5-36 Truck weight versus trip frequency for six trucks of a single fleet operator. SOURCE: Capps et al. (2008).
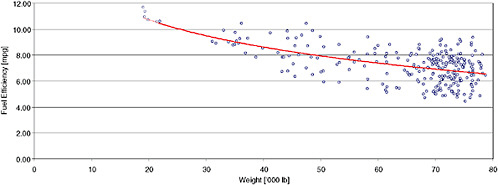
FIGURE 5-37. Effect of weight on truck fuel economy for a monitored fleet of six trucks with combination of dual and wide single tires for a variety of drive routes. SOURCE: Capps et al. (2008).
combined on each of the twin axle pairs for drive and trailer axles.
Potential for Lightweighting Trucks
Trucks, trailers, and buses are benefiting from greater use of lightweight materials and structures. Components already making use of aluminum include the cab structure, wheels, fifth wheel, bellhousing, and more (see Table 5-17).
Aluminum composite panels have been introduced on trailers, and the use of wood in trailers is diminishing. The barrier to additional use of aluminum or carbon composites is primarily cost effectiveness, with carbon fiber composites, for example, costing several times more per unit mass than aluminum. Some technical and cost-effectiveness issues with carbon composites and have been studied in DOE programs with industry (Rini, 2005). An illustration of the possible weight savings with the use of aluminum is shown in Figure 5-38. Some of the measures shown in the illustration are already entering commercial use.
While progress is being made in weight reduction through materials and design, certain weight-adding components have been necessary. Emissions control components are adding roughly 400 lb, and aerodynamic devices another 200 lb, but are deemed a positive tradeoff with aerodynamic drag reduction. Similarly, the weight addition from efficiency technologies such as waste heat recovery are projected to provide net benefits. In hybrid applications, batteries and
TABLE 5-16 Summary of Impacts of Weight on Fuel Consumption of Trucks by Class
|
Truck Class |
Weight Range Studies |
Reported Fuel Efficiency Impact |
Comments |
Source |
|
Combination Class 8 |
65-80k |
0.5% per 1000 lb reduction |
5.96 mpg at 65k 5.4 mpg at 80k Highway drive cycle with some grade change |
NESCCAF/ICCT (2009) |
|
Combination Class 8 |
20-80k |
0.7-1.0% per 1000 lb level terrain 1.2-1.5% on upward grade route <0.1% on downward grade |
Derived from monitored operation of six similar trucks, combination of dual and single tire data |
Capps et al. (2008) |
|
Class 8 |
Not specified |
0.4-1.0% fuel savings per 1000 lb weight reduction |
|
EPA SmartWay presentations and fact sheet |
|
Class 8 |
21-80k |
2.0-2.4% per 1000 lb over hill climb and rolling terrain 1.0% on level terrain 1.6% in stop/go |
Single truck driven over routes of different terrain at different weights |
Strimer et al. (2005) |
|
Class 6 hybrid |
Not reported |
Fuel economy increase 2.4% per 1000 lb |
Model result, using CILCC drive cycle; mostly city and suburb, favors hybridization |
NREL (2004) |
|
Bus, 40 ft |
35k baseline, conventional drivetrain |
~2.0% fuel consumption reduction per 1000 lb |
Central business district cycle |
NREL (2002, 2004) |
|
|
|
1.66 percent fuel economy gain per 10 percent mass reduction |
Hybrid |
IFEU (2003) |
|
|
Conventional bus |
3.75-7.5 percent per 10 percent wt reduction |
Urban operation. Wt effects less inter-city |
|
|
Class 2b pickup or van |
~8000-9000 lb |
3-6% fuel economy improvement per 10% weight reduction;b higher values cited in urban delivery, 7.5% per 10% wt reduced |
Adjusting rear axle ratio also done to give higher impact |
Scheps, 2009a TIAX (2009) IFEU (2003) |
|
aRandall Scheps, Aluminum Association, “The Aluminum Advantage: Exploring Commercial Vehicles Applications,” presentation to the committee, Ann Arbor, Michigan, June 18, 2009. bLarger impact assumes engine is resized. |
||||
other hybrid components add 300 to 1000 lb for trucks and even more in bus applications. Hybrid components are described elsewhere in Chapter 4.
Weight Reduction Summary
TIAX in its report for the committee summarized weight reduction fuel consumption reduction potential by ranges of years and application, as shown in Table 5-18.
IDLE REDUCTION
Idle reduction10 technologies use a portion of a vehicle’s engine output to power auxiliary systems, which are better suited to the functions they are designed for. Idle reduction technologies that reduce in-use idling in traffic or at work sites using electrification of auxiliaries and engine off at idle are discussed in the Diesel Engine and Hybrid Vehicle paragraphs of this chapter. Creep devices are discussed in the Transmission and Driveline Technology paragraph. This paragraph focuses on approaches to reduce the overnight hotel loads in Class 8 long-haul tractor trailers. The assessment of the technologies comes from the study TIAX conducted for the committee (TIAX, 2009).
Truck idle reduction technologies fall into five categories:
-
Automatic shut-down/start-up systems
-
Battery-powered
-
Fuel perated heaters
-
Auxiliary power units or generator sets
-
Truck stop electrification
Each idle reduction technology targets a specific set of operational requirements. Benefits will depend on the amount of idling, climate, time of year, and types of auxiliary loads. There is not one solution that fits the northern (high heating loads) and southern (high cooling loads) climates. There is a great deal of information on idle reduction strategies, fuel economy, and costs on EPA’s SmartWay Web site.
Automatic Shutdown/Startup Systems
Automatic engine idle management systems monitor cabin and engine temperatures and turn the engine on/off as
TABLE 5-17 Summary of Weight-Reduction Estimates and Weight-Increase Offsets
|
Truck Class |
Weight Reduction Potential |
Weight Increase Potential |
Comments |
Source |
|
Class 8 combination trucks |
Wide singles with aluminum wheels afford up to 340 kg total weight savings over duals with steel; 100 lb savings, aluminum fifth wheel |
300 lb, urea; 450 lb, APU; + 60-80 lb, DPF; EGR cooler systems, 40 lb |
Some of these changes already on trucks in 2007 |
Michelin |
|
|
|
|
Rhein report |
|
|
|
3000 lb weight savings said achievable by tag axle, engine downsize, wide single tires, lighter trailer |
|
|
Ogburn et al. (2008) |
|
|
|
Bottoming cycles and other waste heat recovery, 240 lb and up |
|
NESCAFF/ICCT (2009) |
|
|
Hybridization can eliminate transmission and mechanical pumps and alternator |
Batteries offset weight savings, 200-2000 lb |
|
|
|
|
21st Century Truck Partnership agreed on goal of 20% weight reduction |
|
|
Sullivan, 2007a |
|
|
Recent Volvo press release says 20% reduced weight feasible in 10 years |
|
|
FleetOwner (2009) |
|
|
25% weight reduction estimate by American Iron and Steel Institute |
|
|
Transport Topics (2009) |
|
Trailers for Class 8 |
Latest trailers with new materials and composite structures are ~1,000 lb lighter than previous generation |
Aerodynamic devices for trailers weigh about 50-200 lb |
Lightweighting already under way |
Etrucker.com, June 2006 utility trailer press release; Great Dane |
|
Class 3-6 delivery |
|
|
Already in place except urea; not much change 2007 and beyond |
|
|
|
Engine; Navistar reports its engine up to 800 lb lighter than competitors’ engines |
|
Navistar does not use SCR for 2010 |
Navistar (2009) |
|
Bus |
Use of lightweight materials and designs has shown path to reduce bus weight by ~10,000 lb, an ~50 percent reduction |
|
Fisher Coachworks, used advanced stainless steel |
Gibbs, 2009b Wall et al. (2006) |
|
|
Use of aluminum demonstrated 3,000 lb reduction |
|
China Scheps, 2009c |
|
|
Class 2b |
Similar to passenger cars |
|
|
See NAS reports on autos |
|
aR. Sullivan, “Parasitic Energy Loss Reduction,” presentation to the Committee on Review of the 21st Century Truck Partnership, Washington, D.C., February 8, 2007. bJ. Gibbs, Presentation to Calstart by the U.S. Department of Energy, Vehicle Technologies Program. March 2009. cRandall Scheps, Aluminum Association, “The Aluminum Advantage: Exploring Commercial Vehicles Applications,” presentation to the committee, Ann Arbor, Michigan, June 18, 2009. |
||||
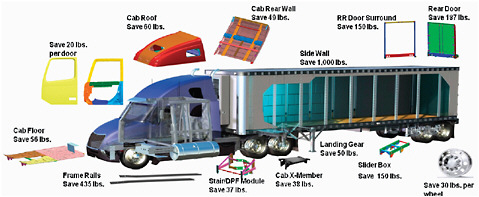
FIGURE 5-38 Weight reduction opportunities with aluminum. SOURCE: Randall Scheps, Aluminum Association, “The Aluminum Advantage: Exploring Commercial Vehicle Applications,” presentation to the committee, Ann Arbor, Mich., June 18, 2009.
TABLE 5-18 Weight-Reduction-Related Fuel Consumption Reduction Potential (percentage) by Class
|
|
2013-2015 |
2015-2020 |
|
Tractor trailer |
0.8 |
1.25 |
|
Class 6 box truck |
2.0 |
4 |
|
Class 6 bucket truck |
1.6 |
3.2 |
|
Refuse truck |
— |
1 |
|
Urban bus |
3.0 |
6.25 |
|
Motor coach |
0.7 |
1.05 |
|
Class 2b pickup and van |
0.4 |
0.75 |
needed to maintain the desired temperatures. Several engine manufacturers offer electronically controlled optimized idling control devices. Higher end integrated systems include thermal storage. More advanced systems run the engine at higher load to maximize engine efficiency when it is on. Table 5-19 characterizes several such systems. Duleep11 estimates that these systems reduce fuel consumption by 3 percent.
Battery-Powered
Battery-powered idle reduction systems incorporate the use of either the vehicle’s battery or a separate battery pack to power the heating and/or cooling of the cab and powering of onboard appliances. A few systems also offer shore power connections. Each of these systems provides 8 to 12 hours of runtime. Because of this limited duration, they may not be ideal for applications that require longer term (weekend) heating or cooling. Table 5-20 compares a variety of systems currently available as identified by the U.S. EPA’s SmartWay Web site.12 As shown, each system offers various features and each retails for $575 and $7,500. Both Kenworth and Peterbilt have introduced idle reduction systems on their products. The Kenworth system is called Clean Power, and operators could see as high as 8 percent reduction in fuel consumption. The system, however, depends greatly on the application. Operators with substantial heating requirements could see the benefit reduced to 1 to 2 percent. Both systems depend on the current battery capacity. Current systems use lithium-ion batteries, and manufacturers are looking at various chemistries for future generations. There is an expectation that the passenger car market will drive economies of scale and lower battery costs.
Fuel-Operated Heaters
Also known as direct-fired heaters, fuel-operated heaters are available to heat the cab, engine, or both. These heaters use significantly less fuel than the primary engine by supplying heat from either a combustion flame or a small heat exchanger, which is more energy efficient than using an engine cycle to achieve a heating affect. In model year (MY) 2007, there was about 10 percent market penetration for the direct-fired heater option. Table 5-21 shows a comparison of several fuel-operated heaters.
TABLE 5-19 Comparison of Automatic Shutdown/Startup Systems
|
Feature/Supplier |
BBW IdleSmart |
Cummins ICON™ Idle Control |
TAS Temp-A-Start |
|
Monitors temperature inside and out |
|
|
|
|
Auto starts engine |
|
|
|
|
Increases engine speed for maximum efficiency |
|
|
|
|
Monitors system (i.e., oil and cab temperatures, battery voltage) |
|
|
|
|
Heats and cools cab |
|
|
|
|
Idles down |
|
|
|
|
Shuts down engine |
|
|
|
|
Transferable to successive trucks |
|
|
|
|
Weight (lb) |
30 |
na |
14 |
|
Retail price |
$3,750 |
$1,325 |
$2,500 |
|
SOURCE: TIAX (2009), p. 4-90. |
|||
Auxiliary Power Units
Auxiliary power units (APUs) provide electricity and heat with the help of a small internal combustion engine equipped with a generator and heat recovery device. Cooling can be provided with the installation of an electric air conditioner in the cab. Many APU devices are available. In addition to those APUs compared in Table 5-22, Navistar announced in a press release:13
Operating at 4.2 kW, the MaxxPower APU equates to best-in-class fuel consumption of 0.18 gallons per hour. It features EPA Tier IV certification and is in the process of acquiring CARB ’08 emissions compliance. Several states currently offer incentives for trucks with idle reduction systems. Production is slated for later this year.
(Note that APUs need to be emissions compliant to operate in California, which can be accomplished with the installation of a $3,000 diesel particulate filter.)
APUs can also be fuel cell powered. This technology requires hydrogen for fuel or a reformer system for carbon-based fuels and the system can achieve the same fuel consumption improvement as conventional APUs.
|
11 |
K.G. Duleep, Energy and Environmental Analysis, “Heavy Duty Trucks Fuel Economy Technology,” presentation to the committee, Washington, D.C., December 5, 2008. |
|
12 |
See http:eps.gov/smartway/transport/what-smartway/idling-reduction-available-tech.htm. |
|
13 |
See http://www.rueters.com/article/pressRelease/idUS213209+07-May-2008+BW20080507. |
TABLE 5-20 Idling Reduction Technologies
|
Feature/Supplier |
Autotherm T-2500 Energy Recovery System |
Bergstrom NITE |
Dometic |
Driver Comfort System |
Glacier Bay ClimaCab |
Idle Free Systems Reefer Link System |
Kenworth Clean Power |
Peterbilt ComfortClass |
Safer Viesa |
Sun Power Technologies |
|
Heats cab |
|
|
|
|
|
|
|
|
|
|
|
Cools cab |
|
|
|
|
|
|
|
|
|
|
|
Powers on-board appliances |
|
|
|
|
|
|
|
|
|
|
|
Circulates heated coolant from engine to heater coils |
|
|
|
|
|
|
|
|
|
|
|
Runs off of vehicle battery |
|
|
|
|
|
|
|
|
|
|
|
Runs off separate battery pack |
|
|
|
|
|
|
|
|
|
|
|
Shore power connection |
|
|
|
|
|
|
|
|
|
|
|
Automatic start |
|
|
|
|
|
|
|
|
|
|
|
Automatic shut down |
|
|
|
|
|
|
|
|
|
|
|
Monitors system (coolant temperature, battery voltage) |
|
|
|
|
|
|
|
|
|
|
|
Run time (hours) |
na |
10 |
10-15 |
|
10 (heating) 12 (cooling) |
|
10 (cooling) |
10 |
8 |
8-12 |
|
Thermal storage cooler |
|
|
|
|
|
|
|
|
|
|
|
Direct fueled heater |
|
|
|
|
|
|
|
|
|
|
|
Weight (lb) |
5 |
210 |
na |
520 |
161 (not including batteries) |
200 |
550 |
126 |
440 |
|
|
Retail price |
$575 to $710 |
$3,495 |
$3,500 to $7,500 |
$6,895 |
|
$7,995 |
|
|
$1,600 |
$6,900 |
|
SOURCE: TIAX (2009), p. 4-91. |
||||||||||
TABLE 5-21 Comparison of Fuel-Operated Heaters
|
Feature/Supplier |
Automotive Climate Control |
Espar Heater System |
Webasto Product North America |
||
|
Cab |
Engine |
Cab |
Engine |
||
|
Heats cab |
|
4 models |
|
2 models |
|
|
Manual or automatic control |
Yes |
Auto |
Auto |
Auto |
|
|
Battery-powered fuel-fired heaters |
|
|
|
|
|
|
Heats engine |
|
|
2 models |
|
3 models |
|
Fuel use |
1 gal/24 hr |
1 gal/20 hr |
1 gal/4-6 hr |
1 gal/20 hr |
0.03-0.24 gal/hr |
|
Retail price |
$920-$1,200 |
$1,000-$3,000 |
|
$1,000-$3,000 |
|
|
SOURCE: TIAX (2009), p. 4-92. |
|||||
Truck Stop Electrification
There are currently 138 truck stops equipped with truck stop electrification identified in the Alternative Fuel Data Center Truck Stop Electrification database.14 Located in 34 states, these sites provide truckers the opportunity to “plug-in” to power heaters, air conditioners, lights, and other accessories. There are generally two types of electrified parking spaces: dual system and single system. A dual system requires equipment on both the truck and the ground. A single system requires equipment only at the truck stop. Table 5-23 shows a comparison of several truck stop electrification systems. As discussed in the National Research Council’s (NRC’s) review of the DOE 21st Century Truck Partnership (NRC, 2008), continuing efforts to standardize the electrical systems on trucks and at truck stops are needed.
TABLE 5-22 Comparison of Auxiliary Power Units
|
Supplier |
Heats Cab |
Cools Cab |
Heats Engine |
FC (gal/hr) |
110V AC |
Auto-on |
Shorepower |
Cost |
|
Auxiliary Power Dynamics |
Yes |
Yes |
Yes |
0.25 |
Yes |
Yes |
|
|
|
Black Rock Systems |
26,000 Btu |
26,000 Btu |
|
0.20 or 0.30 |
|
|
|
$7,499 to $8,100 |
|
Carrier Transicold |
Yes |
Yes |
Yes |
0.2 |
Yes |
Yes |
Yes |
|
|
Comfort Master |
31,000 Btu |
31,000 Btu |
|
0.25 |
Yes |
Yes |
Yes |
$7,200 to $8,100 |
|
Craufurd Manufacturing |
22,000 Btu |
22,000 Btu |
|
|
|
|
|
|
|
Diamond Power Systems |
14,500 Btu |
14,500 Btu |
|
0.26 |
Yes |
Yes |
Yes |
$6,500 |
|
Double Eagle Industries |
Yes |
Yes |
Yes |
0.3 |
DC |
|
|
$7,000 to $9,000 |
|
Flying J |
Yes |
Yes |
Yes |
|
Yes |
Yes |
Yes |
$6,999 |
|
Frigette Truck Climate System |
Yes |
Yes |
|
|
Yes |
|
|
$6,000 to $7,500 |
|
Idlebuster |
Yes |
Yes |
Yes |
|
Yes |
Yes |
Yes |
$6,900 to $7,750 |
|
Kohler |
10,000 Btu |
12,000 Btu |
|
|
Yes |
Yes |
|
|
|
Kool-Gen Optional |
|
Yes |
|
|
Yes |
|
|
$6,925 |
|
Mechron Power Systems |
5,000-10,000 Btu |
10,000-14,000 Btu |
|
0.21 |
Yes |
|
|
|
|
Pony Pack |
Yes |
Yes |
Yes |
0.2 |
DC |
|
|
$7,500 |
|
Rig Master Power |
Yes |
Yes |
Yes |
0.2 |
Yes |
|
|
$6,300 |
|
Star Class |
|
|
|
|
|
|
|
$5,995 to $6,500 |
|
Thermo King |
13,000 Btu |
Yes |
Yes |
0.04 to 0.14 |
Yes |
Yes |
|
$8,000 to $10,000 (+$3,000 DPF for California) |
|
TRIDAKO Energy Systems |
30,000 Btu |
24,000 Btu |
Yes |
0.4 |
|
|
|
$8,499 |
|
Truck Gen |
Yes |
Yes |
0.2 |
Yes |
Yes |
$6,000 to $7,000 |
||
|
SOURCE: TIAX (2009) p. 4-94. |
||||||||
Idle Reduction System Comparison
Idle reduction systems differ in a number of respects. Some of the key discriminators are fuel use per time; functionality (heating ability, cooling ability, and electric loads); infrastructure requirements; and cost. These features are summarized in Table 5-24 for each of the five idle reduction strategies examined. Cells that are shaded light green correspond to favorable attributes; cells that are shaded yellow correspond to mild drawbacks; and cells that are shaded dark orange correspond to major drawbacks. The fuel-savings benefits in Table 5-24 are estimated using the following assumptions:
-
An idling engine consumes 0.8 gallons of fuel per hour. This is based on a SmartWay estimate for idle engine fuel consumption, and is consistent with a 4-kW accessory load with an engine operating at 15 percent efficiency. The 21st Century Truck Partnership estimates a typical accessory load of 3 to 5 kW for a line-haul truck (NRC, 2008). It is possible that current engines have lower idle fuel consumption rates.
TABLE 5-23 Comparison of Truck Stop Electrification Systems
|
Supplier |
Cost ($) |
Service Fee ($) |
|
Dual Systems |
|
|
|
Phillips and Temro |
125 |
|
|
Shurepower |
200-2,000 |
0.50 per hour |
|
Teleflex (Proheat) |
2,500 |
|
|
Xantrex |
1,500, inverter/charger 1,500, electric HVAC |
2,500 per space |
|
Single Systems |
|
|
|
Cabaire |
|
|
|
Craufurd Manufacturing |
|
8,550 per space |
|
IdleAire Technologies |
10, adapter |
2.18 per hour retail 1.85 per hour fleet |
|
SOURCE: TIAX (2009), p. 4-93. |
||
-
A line-haul truck is assumed to operate under hotel loads for between 1,500 to 2,400 hours per year. This range is meant to bracket the range between a medium-and high-mileage vehicle.
-
A line-haul truck is assumed to use 20,000 gallons of fuel per year.
-
It was assumed that a direct-fire heater is in use for 600 to 800 hours per year. SmartWay estimates 800 hours per year of heater fuel use.15
INTELLIGENT VEHICLE TECHNOLOGIES
IVT combines information about the state of the vehicle, the environment around the vehicle, and Telematics to provide assistance to the driver. Telematics refers to the integration of Global Positioning System (GPS) technology with computers and mobile communications technologies. Although IVT is commonly applied to active safety systems (i.e., crash avoidance and crash mitigation), for purposes of this report the definition is broadened to specifically address fuel consumption reduction.
TABLE 5-24 Comparison of Idle Reduction Systems
|
|
|
SOURCE: TIAX (2009), p.4-95. |
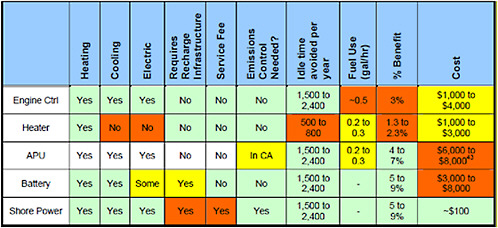
IVT-Enabling Technologies
Although computing technologies have advanced greatly over the past decade, the most significant enablers for IVT are the advances in GPS and mobile communications. The first step in the GPS modernization program occurred in May 2000 when the U.S. Department of Defense ended the use of Selective Availability (SA). SA was an intentional degradation of civilian GPS accuracy implemented on a global basis from the GPS satellites. Prior to its deactivation, civil GPS readings could be off by up to 100 m. After SA was turned off, civil GPS accuracy instantly improved by an order of magnitude, thereby benefiting civil and commercial users worldwide. In 2004 about 1 million fleet vehicles in the United States were equipped with GPS devices (Murphy, 2004).
Mobile communications, particularly cell phone usage, has grown immensely in recent years. Cell phone users in the United States have increased from 50 million a little over a decade ago to more than 250 million in 2007 (CIA, 2007). Many cell towers are located along the interstate system, which allows mobile travelers to have cellular service even in the more remote rural regions of the United States.
Dedicated Short Range Communications (DSRC) is a block of spectrum in the 5.850 to 5.925 GHz band allocated by the Federal Communications Commission in 2003 to enhance the safety and productivity of the transportation system. The DSRC service involves vehicle-to-vehicle and vehicle-to-infrastructure communications, helping to protect the safety of the traveling public. The band is also eligible for use by nonpublic safety entities for commercial or private DSRC operations.
Adaptive Cruise Control
Description. Adaptive cruise control (ACC) augments conventional cruise control by sensing the traffic ahead with a radar or laser sensor mounted on the front of the vehicle. When there is no vehicle ahead, ACC operates the same as conventional cruise control. However, when the forward-looking sensor detects a vehicle ahead that is traveling at a slower speed, the vehicle speed is slowed to the speed of the preceding vehicle through actuation of the throttle or mild brake action. The appropriate separation distance between vehicles is then maintained automatically. The desired separation distance can be set by the driver within limits and is a function of the vehicle speed. Typically, this is the distance the vehicle would travel in the range of 2 to 3 seconds. Anything significantly larger than that would likely result in “cut-ins” by a third vehicle.
Applications. All vehicles that regularly travel on urban and rural interstate roads. Adaptive Cruise Control systems are available on current vehicles (primarily as a safety feature) but are not widely adopted.
Cost. $1,100 to $3,000, depending on application and included features.
Benefit. Cruise control is a driver aid that relieves driver workload and provides smooth acceleration and deceleration for navigating grades. In traffic, conventional cruise control is little used because a constant speed cannot be maintained. The driver must therefore revert to manual control. ACC has fuel economy benefits because, even in traffic, all accelerations and decelerations are smaller and have a smooth profile
and there is little accelerator pedal “dither” compared to manual driving. A field operational test using 108 nonprofessional drivers and 10 passenger cars equipped with ACC in southeast Michigan (Koziel et al., 1999) indicated a 10 percent fuel consumption reduction compared with manual driving. For professional drivers, the benefit is more likely to be around 1 percent (TIAX, 2009, p. 4-99).
Predictive Cruise Control
Description. Predictive cruise control is an enhancement of conventional cruise control whereby the current vehicle location and topography of the upcoming road provided by a GPS receiver are used to calculate the target cruise speed within an upper and a lower limit. When a truck approaches a hill, the truck accelerates prior to beginning the climb. During the climb, the target cruise speed is continuously calculated and the truck is allowed to slow to the lower limit. When approaching a downhill, the truck slows down prior to beginning the descent but is allowed to increase to the upper limit during the descent. Fuel savings accrue because there is less need to accelerate while on the uphill climb and less time spent in the lower gears. In addition, less fuel is consumed compared to conventional cruise control during the downhill phase because the truck is allowed to slow to a lower limit prior to the descent of a hill rather than maintaining a fixed cruise speed.
Applications. All vehicles that regularly travel on rural interstate roads. Daimler Trucks of North America will be offering this feature in 2009.
Cost. $861 to $1,561, depending on type of vehicle.16
Benefit. The reduction in fuel consumption will vary depending on the topography the truck is traveling. For example, traveling on relatively flat terrain would yield little benefit. Traveling in the hills of Tennessee, on the other hand, could yield significant fuel savings. Experimental results reported by Hellstrom et al. (2007) show a 3.5 percent fuel use reduction without an increase in trip time for a Class 8 truck traveling 150 km between Norrkoping and Sodertalje, Sweden, compared to conventional cruise control. Simulation results reported by Lattermann et al. (2004) of a 75,000 lb class 8 truck traveling on a 25 km stretch of I5 around Portland, Oregon, showed a 4 to 5 percent reduction in fuel consumption with an increase in trip time of 0.3 to 1.4 percent compared to conventional cruise control. Other estimates would suggest an improvement of 1 to 3 percent (TIAX, 2009, p. 4-99).
Adaptive Cruise Control with Real-Time Traffic Information
Description. This concept utilizes real-time traffic information to anticipate changes in traffic speed and then adjusts the set cruise speed accordingly to reduce large accelerations and decelerations. The real-time traffic data can come from imbedded loop detectors in the highway such as the Performance Measurement System (PeMS) used in California17 or traffic probe vehicles that carry special cell phones able to communicate their position and velocity in real time. PeMS provides average traffic speed and density every 5 minutes at a resolution of 0.3 to 3 miles. A communications link, such as cell phones or SRDC, is required for the vehicle to acquire the traffic information from nearby vehicles or the infrastructure.
Applications. All vehicles that regularly travel rural and urban interstate roads. There is some usage in California, but its low. There are currently no other commercial applications in existence.
Cost. No cost data are available.
Benefit. In research reported by Kohut et al. (2009), simulations were run using real traffic speed data for a trip from Palo Alto to San Jose, California, and validated vehicle and engine models of a passenger car. The simulations calculated the reduction in fuel used when varying the look-ahead distance of traffic flow. The simulations showed a 5 to 7 percent reduction of fuel for a trip time that changes 3 percent or less when the look-ahead distance was varied from 1,200 to 2,000 m.
Predictive Control of Hybrid Electric Vehicles
Description. Real-world optimal fuel consumption for hybrid electric vehicles (HEVs) is possible using predictive control based on GPS with a topographical database of the road ahead and, possibly, real-time traffic information, and then controlling the power split ratio (PSR) of the internal combustion engine and the electric motor. The main controller uses current operating information such as battery state of charge, engine efficiency, and emission maps, to establish the PSR at each instant. A navigation controller uses traffic and GPS information to predict the future driving state of the vehicle and modifies the PSR to charge the battery (if, for example, it is predicted that the vehicle will change from highway to city driving, where the electric motor will be required) or to deplete the battery for improved fuel economy in anticipation of a downgrade, where regeneration may be expected (Kessels, 2007).
|
16 |
David Kayes, Daimler Trucks, personal communication, June 23, 2009. |
|
17 |
California Performance Measurement System, http://pems.eecs.berkeley.edu. |
Applications. All HEV applications. Current commercial usage is unknown.
Cost. Similar to that cost of predictive cruise control.
Benefit. Simulation results reported by Rajagopalan and Washington (2002), Johannesson et al. (2007), and Kim et al. (2008) show a fuel economy improvement of 3 to 9 percent versus nonpredictive control. The SENTIENCE program described by Walker (2008), which is underway, is intended to provide much-needed validation of simulation results.
Electronic Tow Bar
Description. The electronic tow bar is a concept whereby a lead vehicle is driven manually and a following vehicle is driven automatically by a vehicle controller that maintains a set distance between the two vehicles. In a sense, it is similar to ACC except that the gap between the lead and trailing vehicles is much smaller to take advantage of the aerodynamic drag reduction from the slipstream effect. Because of this small separation distance, typically one-half to one truck length, precise control must be maintained by the trailing vehicle to prevent the vehicles from contacting if the lead vehicle suddenly brakes. Although this concept is not yet commercially available, the experimental hardware configurations described by Fritz (1999), Fritz et al. (2004), and Lu et al. (2004) generally use radar, laser, or optical sensors on the trailing vehicle to measure the separation distance. In addition, vehicle-to-vehicle communications are used to provide information on the state of lead vehicle (e.g., vehicle speed, acceleration, pedal position) to the vehicle controller in the trailing vehicle. This gives additional lead time to the trailing vehicle to respond to sudden accelerations or braking of the lead vehicle.
Applications. The electronic tow bar would be most applicable to line-haul trucks using the interstate system. Although it is possible to extend the concept to more than two vehicles, it is unlikely that this would be allowed, with the possible exception of truck-only lanes.
Cost. Anticipated costs of around $500 to $2,600 for additional sensors and active safety features (Baker et al., 2009).
Benefit. Bonnet and Fritz (2000) conducted experiments on two heavy-duty semitrailer Mercedes-Benz trucks of type ACTROS 1853 LS, both having cab-over-engine design. The lead truck was 32,000 lb and the trail truck was 62,000 lb. For the trail truck with the separation distance varied between 8 and 16 m, the fuel consumption reduction ranged from 15 to 21 percent at 80 km/hour and from 10 to 17 percent at 60 km/hour when compared with the truck driving in isolation. For the lead truck, the fuel consumption reduction was between 5 and 10 percent at 80 km/h and between 3 and 7 percent at 60 km/hour.
Browand et al. (2004) report on experiments conducted on two Freightliner 2001 Century Class trucks with 53-foot van trailers. The tractors were engine-forward design. One vehicle was 32,000 lb and the other was 64,000 lb. At a constant speed of 55 mph, the measured fuel savings at a spacing of 10 m were 10 percent and 6 percent, respectively, for the trail and lead truck. In the spacing range of 3 to 10 m, fuel consumption savings were in the range 10 to 12 percent for the trail truck and 5 to 10 percent for the lead truck, with the larger values of savings occurring at the shorter spacing.
Navigation and Route Optimization
Description. In its simplest form, navigation and route optimization consists of an in-vehicle device that contains a GPS receiver, a database that includes map information and points of interest, and a display that allows the driver to enter a desired destination and view the map. The device then calculates a route based on one of several criteria, such as fastest time or shortest distance. While en route, the driver receives visual and verbal turn-by-turn instructions to the destination. Navigation devices specially designed for the trucking industry may have features that will inform the driver about tolls, road restrictions, hazmat routes and preferred truck routes (e.g., parkways that do not allow trucks, directions that do not require right-hand turns). In addition, it may include points of interest such as truck stops, rest stops, weigh stations, and other services useful to the driver.
For the fleet operator, the route is usually planned in the back office using route optimization software and downloaded to the vehicle either before the vehicle leaves the terminal or while the vehicle is on the road. The route optimization software may reside on a single personal computer, the fleet’s central computer, or a Web-based application and has sophisticated algorithms that take into account historical traffic data as a function of time of day and up-to-date speed limits on the planned route. The planned route will yield a path with minimum fuel consumed. It is also possible for the fleet operator to provide immediate changes to its routes in case of incidents such as road construction or weather-related road closures.
Dynamic vehicle routing differs from the static routing previously described in that it includes real-time traffic information in addition to historical traffic data for computing the optimized route. Real-time traffic information from imbedded loop detectors or traffic probe vehicles using smartphones allow the route planning software to do en route rerouting to avoid traffic congestion. This concept, relatively new, has potential drawbacks in that the driver may not receive the new route in a timely manner to avoid the congestion or the alternate route may itself become congested due to the additional traffic.
Applications. Pickup and delivery applications, regional and long-haul operations, fleet operators.
Cost. Navigation device, between $400 and $800 plus monthly service fees that range from $20 to $40 (TIAX, 2009, p. 4-98). Route optimization software starts at $10,000 (Bennett, 2008).
Benefit. Bennett (2008) reports the case of a fleet operator where route optimization software reduced fleet mileage between 5 percent and 10 percent annually. For line-haul operations, which spend a comparatively small amount of time in congested driving conditions, the estimated fuel-savings potential is up to 1 percent (TIAX, 2009, p. 4-98).
FINDINGS AND RECOMMENDATIONS
Aerodynamics
Finding 5-1. At highway speeds, aerodynamic loads consume more power than any other load on current tractor-trailer vehicles. Aerodynamic features can significantly reduce these loads, but their value diminishes rapidly as average vehicle speed goes down. In low-speed operation, aerodynamic features have little value.
Finding 5-2. Four areas of the tractor-trailer combination have been identified as critical for achieving aerodynamic improvements:
-
Tractor streamlining
-
Management of airflow around the tractor-to-trailer gap
-
Management of airflow under the trailer
-
Management of airflow at the rear of the trailer
Finding 5-3. By the 2015 to 2020 time frame, the use of aerodynamic features can provide fuel consumption reductions of about 15 percent for tractor-van trailer vehicles operating at 65 mph. The potential benefits for other classes of vehicles are significantly less.
Finding 5-4. Many tractor and trailer aerodynamic features are damage prone in low-speed operation. The cost of repairing these features may be a significant barrier to implementation for some applications, and broken aerodynamic components could become road hazards.
Recommendation 5-1. Regulators should require that aerodynamic features be evaluated on a wind-averaged basis that takes into account the effects of yaw. Tractor and trailer manufacturers should be required to certify their drag coefficient results using a common industry standard.
Auxiliary Loads
Finding 5-5. Auxiliary loads can consume up to 2.5 percent of fuel, so fuel consumption reductions of 1 percent to 2.5 percent are feasible. Electrification of these auxiliaries, mostly in hybrid vehicles, will reduce some of this loss.
Rolling Resistance
Finding 5-6. Technological advances have lowered the co-efficient of rolling resistance of tires by roughly 50 percent since 1990, but further reductions are expected to be less dramatic. The use of low rolling resistance tires, such as wide-based singles, show 4 percent to 11 percent reductions in fuel consumption with models and on-road tests, depending on terrain, weight, and choice of baseline tire.
Finding 5-7. Tire pressure monitoring, automatic inflation systems, and nitrogen inflation are all effective in avoiding wasting fuel due to underinflation and improve vehicle safety.
Recommendation 5-2. There are numerous variables that contribute to the range of results of test programs. An industry standard (SAE) protocol for measuring and reporting the coefficient of rolling resistance is recommended to aid consumer selection, similar to that proposed for passenger car tires.
Vehicle Mass (Weight)
Finding 5-8. Results from tests and computer models summarized in this chapter show that the impact of weight on truck fuel consumption will range from 0.5 to 1.0 percent per 1000 lb on level roads to over 2 percent per 1,000 lb on hilly terrain and for driving cycles with frequent accelerations. These results are primarily for Class 8 combination trucks. For Class 8 trucks at full weight capacity, the payload-specific fuel consumption is reduced by about 2 percent per 1,000 lb.
Finding 5-9. Design progress and the use of lightweight materials for major components, such as the engine, drive-train, wheels and tires, and chassis, have been estimated to save weight up to 20 percent beyond current technology by the 21st Century Truck Partnership and separately by one manufacturer. This could amount to as much as 5,000 lb over the next decade. A fuel consumption reduction of about 5 percent could be achieved.
Idle Reduction
Finding 5-10. There are a number of technologies and products available for reducing idle fuel use in class 8 heavy-duty vehicles. It is reported that up to 9 percent fuel consumption reduction is available, but it is dependent on the hotel power load factor. The committee has used 5 percent to 9 percent and TIAX used an average of 6 percent fuel consumption reduction potential.
Intelligent Vehicle Technologies
Finding 5-11. In general, intelligent vehicle technologies provide fuel consumption reductions by taking advantage of knowledge of the vehicle’s location, terrain in the vicinity of the vehicle, congestion, location of leading vehicles, historical traffic data, and so forth, and altering the speed of the vehicle, the route the vehicle travels, or, in the case of hybrid electric vehicles, altering the power split ratio. This fuel savings may not show up in any fuel consumption test.
Finding 5-12. A number of the technologies—adaptive cruise control, predictive cruise control, and navigation and route optimization—are being applied by the trucking industry without any regulation because the owners and operators view the reduction in fuel costs as good business.
Finding 5-13. Based on experiments to date, the electronic tow bar concept of trucks traveling closely spaced in tandem can provide significantly lower fuel consumption, 8 percent to 15 percent, compared with the same vehicles traveling separately.
BIBLIOGRAPHY
Al-Qadi, I. 2007a. New generation of wide-base tire and its impact on trucking operations, environment, and pavements. Transportation Research Board 86th Annual Meeting, Paper No. 07-2432, January 21-25, Washington, D.C.
Al-Qadi, I. 2007b. Impact of wide-based tires on pavement and trucking operation. Presented at the International Workshop on the Use of Wide-Base Tires, Federal Highway Administration, Turner-Fairbank Highway Research Center, October 25-26, McLean, Virginia.
Bachman, L., A. Erb, and C. Bynum. 2005. Effect of single wide tires and trailer aerodynamics on fuel economy and NOx emissions of Class 8 line-haul tractor-trailers. SAE Paper 2005-01-3551. Warrendale, Pa.: SAE International.
Bachman, L., A. Erb, B. Anthony, C. Bynum, B. Shoffner, H. De La Fuente, and C. Ensfield. 2006. Fuel economy improvements and NOx reduction by reduction of parasitic losses: Effect of engine design. SAE Paper 2006-01-3474. Warrendale, Pa.: SAE International.
Baker, H., R. Cornwell, E. Koehler, and J. Patterson. 2009. Review of Low Carbon Technologies for Heavy Goods Vehicles. Prepared by Ricardo for the U.S. Department of Transportation. RD.09/18261.6. June.
Bennett, S. 2008. Smart routing to save fuel. Light & Medium Truck Magazine. August.
Bonnet, C., and H. Fritz. 2000. Fuel consumption reduction in a platoon: Experimental results with two electronically coupled trucks at close spacing. SAE Paper 2000-01-3056. Warrendale, Pa.: SAE International.
Bradley, C., and S. Nelson. 2009. Truck Tires and Rolling Resistance: Modeling and Impact on Fuel Consumption. Presentation by Michelin Tire North America to the committee, February 4.
Bradley, M.J., and Associates LLC. 2009. Setting the Stage for Regulation of Heavy-Duty Vehicle Fuel Economy and GHG Emissions: Issues and Opportunities. Washington, D.C.: International Council on Clean Transportation. February.
Browand, F., J. McArthur, and C. Radovich. 2004. Fuel Savings Achieved in the Field Test of Two Tandem Trucks. California PATH Research Report UCB-ITS-PRR-2004-20.
Capps, G., O. Franzese, B. Knee, M.B. Lascurain, and P. Otaduy. 2008. Class-8 Heavy Truck Duty Cycle Project Final Report. Report No. ORNL/TM-2008/122. Oak Ridge, Tenn.: Oak Ridge National Laboratory. December.
CARB (California Air Resources Board). 2008. Final Regulation Order to Reduce Greenhouse Gas Emissions from Heavy-Duty Vehicles. Available at http://www.arb.ca.gov/regact/2008/ghghdv08/ghgfro.pdf.
Caterpillar. 2006. Understanding Tractor-Trailer Performance. Brochure. Available at http://ohe.cat.com/cda/files/867819/7/LEGT6380.pdf. Peoria, Ill.: Caterpillar.
CIA (Central Intelligence Agency). 2007. CIA World Fact Book.
Cooper, K. 2004. Commercial vehicle aerodynamic drag reduction: Historical perspective as a guide. Pp. 9-28 in The Aerodynamics of Heavy Vehicles: Trucks, Buses, and Trains (R. McCallen, F. Browand, and J. Ross, eds). New York: Springer.
DOE (U.S. Department of Energy). 2006. 21st Century Truck Partnership Roadmap and Technical White Papers. Doc. No. 21CTP-003. Washington, D.C.: DOE. December.
DOE. 2008. Areas of Loss in Typical On-Highway Vehicles, and/or Review. Washington, D.C.: DOE.
ECD (European Council Directive 89/297/EEC). 1989 Underride Protection for Unprotected Road Users. April13. Available at http://eur-lex.europa.eu/LexUriServ/LexUriServ.do?uri=CELEX:31989L0297:EN:NOT.
Englar, R. 2005. The application of pneumatic aerodynamic technology to improve drag reduction, performance, safety, and control of advanced automotive vehicles. Proceedings of the 2004 NASA/ONR Circulation Control Workshop, Part 2, pp. 957-995. June. Available from http://ntrs.nasa.gov/search.jsp?R=421681&id=4&as=false&orfalse&qs=Ne%3D25%26Ns%3DHarvestDate%257c0%26N%3D255%2B32
EPA (U.S. Environmental Protection Agency). 2009. Websites for the EPA SmartWay Program, including http://www.epa.gov/smartway/transport/what-smartway/tractor-trailer-tech.htm (accessed 13/09/09) and http://www.epa.gov/smartway/transport/what-smartway/tractor-trailer-markuse.htm (accessed September 13, 2009).
FleetOwner. 2009. Superlight trucks are coming. FleetOwner Web Magazine. June 25. Available at http://fleetowner.com/trucking_around_world/building-lighter-trucks-0625/.
Fritz, H. 1999. Longitudinal and lateral control of heavy duty trucks for automated vehicle following in mixed traffic: Experimental results from the CHAUFFEUR Project. Proceedings of the 1999 IEEE International Conference on Control Applications. Kohala Coast-Island of Hawaii, State of Hawaii, August.
Fritz, H., A. Gern, H. Schiemenz, and C. Bonnet. 2004. CHAUFFEUR Assistant—A Driver Assistance System for Commercial Vehicles Based on Fusion of Advanced ACC and Lane Keeping. IEEE 2004 Intelligent Vehicles Symposium. Parma, Italy. June.
Goodyear (Goodyear Tire and Rubber Company). 2003. Radial Truck Tire and Retread Manual. Manual No. 700-862-932-505.
Hellstrom, E., M. Ivarsson, J. Aslund, and L. Nielson. 2007. Look Ahead Control for Heavy Trucks to Minimize Trip Time and Fuel Consumption. Presented at the Fifth IFAC (International Federation of Automatic Control) Symposium on Advances in Automotive Control, Aptos, Calif., August 20-22.
Hendricks, T., and M. O’Keefe. 2002. Heavy Vehicle Auxiliary Load Electrification for the Essential Power System Program: Benefits, Tradeoffs, and Remaining Challenges. Golden, Colo.: National Renewable Energy Laboratory.
IFEU (Institut für Energieund Umweltforschung, Heidelberg GmbH). 2003. Energy Savings by Lightweighting. Heidelberg, Germany: IFEU.
Johannesson, L., M. Asbogard, and B. Egardt. 2007. Assessing the potential of predictive control for hybrid vehicle powertrains using stochastic dynamic programming. IEEE Transactions on Intelligent Transportation Systems, Vol. 8, No. 1. March.
Kenworth. 2008. White paper on fuel economy. Paper No. WP-FE08. Kenworth Truck Company. August. Available at http://www.kenworth.com/FuelEconomyWhitePaper.pdf.
Kessels, J. 2007. Electronic Horizon: Energy Management Using Telematics Information. Presented at the IEEE 2007 Vehicle Power and Propulsion Conference, September.
Kim, T., C. Manzie, and H. Watson. 2008. Fuel economy benefits of look-ahead capability in a mild hybrid configuration. Proceedings of the 17th World Congress of IFAC, Seoul, Korea, July.
Knee, B., O. Franzese, N. Wood, M. Arant, D. Hall, S. Nelson, R. Hathaway, M. Keil, P. Pollock, D. Pape, S. Yeakel, and J. Petrolino. 2008. Heavy Truck Rollover Characterization (Phase A) Final Report. National Transportation Research Center, Inc., Knoxville, Tenn.
Kohut, N., K. Hedrick, and F. Borrelli. 2009. Integrating Traffic Data and Model Predictive Control to Improve Fuel Economy. Presented at the 12th 2009 IFAC Symposium on Transportation Systems, Redondo Beach, Calif., September.
Kreeb, R., and S. Brady. 2006. Tractor-Trailer Dynamic Alignment and Research. Report No. FMCSA-PSV-06-002. February.
LaClair, T. 2005. Rolling Resistance. Pp. 475-532 in The Pneumatic Tire (J.D. Walter and A.N. Gent, eds.). Washington, D.C.: U.S. Department of Transportation, National Highway Traffic Safety Administration.
Lattermann, F., K. Neiss, S. Terwen, and T. Connolly. 2004. The predictive cruise control: A system to reduce fuel consumption of heavy duty trucks. SAE Paper 2004-01-2616. Warrendale, Pa.: SAE International.
Lu, X., S. Shladover, and J. Hedrick. 2004. Heavy-duty truck control: Short inter-vehicle distance following. Proceedings of the 2004 American Control Conference, Boston, Mass., June.
Melson, J. 2007. Progress in Tires. Presentation by Michelin at the International Workshop on the Use of Wide-Base Tires, Federal Highway Administration, Turner-Fairbank Highway Research Center, McLean, Virginia, October 25-26.
MNA (Michelin Tires North America). 2007. International Workshop on the Use of Wide-Base Tires, Federal Highway Administration, Turner-Fairbank Highway Research Center, McLean, Virginia. October.
Murphy, S. 2004. How to choose a GPS fleet management system: What features are right for you? Management Quarterly, Vol. 45.
Navistar. 2009. MaxxForce 9 & 10. Brochure No. CGE 634 3/2009. Available at http://www.navistar.com/InternationalTrucks/PageContent/2010Emissions/pdf/MaxxForce9.pdf.
NESCCAF/ICCT, Southwest Research Institute, and TIAX. 2009. Reducing Heavy-Duty Long Haul Combination Truck Fuel Consumption and CO2 Emissions. Washington, D.C.: International Council on Clean Transportation (ICCT). October.
NHTSA (U.S. Department of Transportation, National Highway Traffic Safety Administration). 2009a. The Effects of Varying the Levels of Nitrogen in the Inflation Gas of Tires on Laboratory Test Performance. Report No. DOT HS 811 094. Washington, D.C.: U.S. Department of Transportation. March.
NHTSA. 2009b. Notice of Proposed Rulemaking, Tire Fuel Efficiency Consumer Information Program, 49 CFR Part 575 [Docket No. NHTSA-2008-0121]. RIN 2127-AK45. June.
Nose Cone. 2009. Nose Cone Manufacturing Co. See http://www.nosecone.com/aptruck.htm. Accessed September 16, 2009.
NRC (National Research Council). 2006. Transportation Research Board Special Report 286: Tires and Passenger Car Fuel Economy. Washington, D.C.: The National Academies Press.
NRC. 2008. Review of the 21st Century Truck Partnership. Washington, D.C.: The National Academies Press.
NREL (National Renewable Energy Laboratory). 2002. Milestone Report MP-540. Prepared for the U.S. Department of Energy by NREL. Golden, Colo.: NREL.
NREL. 2004. Milestone Report 20040901. Prepared for the U.S. Department of Energy by NREL. Golden, Colo.: NREL.
Ogburn, M., L. Ramroth, and A. Lovins. 2008. Transformational Trucks: Determining the Energy Efficiency Limits of a Class-8 Tractor-Trailer. Snowmass, Colo.: Rocky Mountain Institute. July. Available at http://www.rmi.org/rmi/Library/T08-08_TransformationalTrucksEnergyEfficiency.
O’Keefe, M., and K. Vertin. 2002. Analysis of Hybrid Electric Propulsion Systems for Transit Buses. Report No. NREL/MP 540-32858. Golden, Colo.: National Renewable Energy Laboratory. October.
Peterbilt, Inc. 2009. Images from “Peterbilt Model 389” (http://www.peterbilt.com/trad389.2.aspx) and “Peterbilt Model 387” (http://www.peterbilt.com/aero387.2.aspx). Accessed October 10, 2009.
Rajagopalan, A., and G. Washington. 2002. Intelligent control of hybrid electric vehicles using GPS information. SAE Paper 2002-01-1936. Warrendale, Pa.: SAE International.
Rini, N. 2005. Carbon Fiber SMC for Class 8 Vehicle Hoods, FY 2005 Progress Report for High-Strength Weight Reduction Materials. Prepared by Volvo for the U.S. Department of Energy, Washington, D.C.
SAE (Society of Automotive Engineers). 2000. Recommended Practice J1343, Information Relating to Duty Cycles and Average Power Requirements of Truck and Bus Engine Accessories. Warrendale, Pa.: SAE International. August.
SAE Recommended practices SAE J1252, SAE J1263, and SAE J1321.
Schuring, D. 1977. A new look at the definition of tire rolling loss. Presentation at the Tire Rolling Losses and Fuel Economy—An R&D Planning Workshop, SAE Conf. Proc. P-74, 31-37. Warrendale, Pa.: SAE International.
Smith, M., and C. Eberle. 2003. Heavy Vehicle Mass Reduction Goals and Manufacturing Challenges. Presentation at the U.S. Department of Energy Workshop on Tooling Technology for Low Volume Vehicle Production, October 28, 2003, Seattle, Wash.
Strimer C., D. Carder, M. Gautam, and G. Thompson. 2005. Impact of vehicle weight on truck behavior and emissions, using on-board measurement. SAE Paper 2005-01-3788. Warrendale, Pa.: SAE International.
Sturdy-Light. 2009. Vango Rolling Tarp Systems. Bristol, Tenn.: Sturdy-Light. Available at http://www.sturdy-lite.com/files/vangospg.php. Accessed August 25, 2009.
TIAX. 2009. Assessment of Fuel Economy Technologies for Medium- and Heavy-Duty Vehicles. Report prepared for the National Academy of Sciences by TIAX LLC, Cupertino, Calif., July 31.
TMA (Truck Manufacturers Association). 2007. Test, Evaluation, and Demonstration of Practical Devices/Systems to Reduce Aerodynamic Drag of Tractor/Semitrailer Combination Unit Trucks. Prepared for the National Energy Technology Laboratory (NTEL) under contract number DE-FC26-04NT42117. Morgantown, W. Va.: NTEL. April.
TMC (Technology and Maintenance Council). No date. A guide to improving commercial fleet fuel efficiency. TMC Fuel Economy Digest. Available at http://tmc.truckline.com.
Transport Topics. 2009. Financial and Operating Information for America’s 100 Largest For-Hire and Private Fleets. Available at http://www.ttnews.com/tt100/TT100_web_FH09.pdf. Accessed September 14, 2009.
Volvo. 2009. Volvo Trucks Website: http://www.volvo.com/trucks/na/ens/products/vn/vn.htm. Accessed September 13, 2009.
Walker, J. 2008. SENTIENCE: Using Electronic Horizon Data to Improve Hybrid Vehicle Fuel Economy. Road Transport Information and Control, RTIC 2008 and ITS United Kingdom Members’ Conference, May.
Wall, E., et al. 2006. Progress Report for High Strength Weight Reduction Materials, FY 2006. Washington, D.C.: U.S. Department of Energy. March.
Wood, R. 2006. A Discussion of a Heavy Truck Advanced Aerodynamic Trailer System. Presented at the International Forum for Road Transport Technology (IFRTT) 9th International Symposium on Heavy Vehicle Weights and Dimensions, June 18-22, 2006. Pennsylvania State University, State College, Penn. Available at http://www.mne.psu.edu/ifrtt/ConferenceProceedings/ISHVWD_9_2006/docs/pdfs/session%209/s9-4%20140.pdf.
Wood, R. 2009. Aerodynamic Yaw, Drag and Fuel Economy. SOLUS-Solutions and Technologies LLC and Old Dominion University. August.
Woodrooffe, J., O. Page, D. Blower, and P. Green. 2008. Commercial Medium Tire Debris Study. Report prepared by Virginia Polytechnic Institute and State University for the U.S. Department of Transportation, National Highway Traffic Safety Administration (NHTSA). Report number DOT HS 811 060. Washington, D.C.: NHTSA.


