
6
Beyond the Next Few Centuries
6.1
LONG-TERM FEEDBACKS AND EARTH SYSTEM SENSITIVITY
Earth System Sensitivity: On the Brink of the Anthropocene
Settled agricultural civilization arose during the interglacial period known as the Holocene, which has extended over the past 10,000 years. To geologists of the future, the evolution of the present interglacial will look different from that of the previous major interglacial—the Eemian, which set in 130,000 years ago. During other interglacials (which have occurred about every 100,000 years for more than the past 1 million years), CO2 reached a peak value of about 300 ppm and thereafter began to fall; in this interglacial, CO2 will instead rise by an amount that will be determined by human activities. We are now entering a new geological epoch, called the Anthropocene, during which the evolution of Earth’s environment will be largely controlled by human activities, notably emissions of carbon dioxide from deforestation and fossil fuel burning. The Anthropocene will leave an imprint in the geological record as distinctive as other events that today’s geologists find significant enough to merit a name. Actions taken within this century will determine whether the Anthropocene climate anomaly represents a small deviation from the Holocene climate, or a major shift with a duration of many thousands—perhaps even hundreds of thousands—of years. Over such long time scales, determining the climate response requires consideration of Earth System Sensitivity.
Earth System Sensitivity involves a number of processes that are less well understood than those involved in fast-feedback climate sensitivity or transient climate response. The challenges are compounded by the slow nature of these feedbacks, which makes them difficult to study through current observations of the changing climate. Study of paleoclimate provides a window into the operation of these slow processes, but the endeavor there
is hampered by imprecision in our knowledge of past climate and past greenhouse gas concentrations. The principal known processes involved in Earth System Sensitivity are:
-
The carbon cycle, including ocean carbon uptake and release, terrestrial carbon uptake or release, and release of methane by destabilization of clathrates stored in permafrost or in sea-floor sediments
-
Major land ice sheets (such as those of Greenland and Antarctica)
-
Vegetation changes affecting albedo and the hydrological cycle
-
Changes in atmospheric chemistry that may affect aerosol formation and methane concentration
-
Changes in atmospheric dust loading
Because the climate system is being pushed into uncharted territory without any precise past analogue, it is possible that the Earth system is subject to additional as-yet unidentified feedbacks. Although all of the above feedbacks have been implicated in past climate changes (as reviewed, e.g., in Lunt et al., 2010), the following discussion will focus on the first two.
As net cumulative CO2 emissions increase, the amount by which the global temperature exceeds the peaks of the past 2 million years increases. Moreover, the length of time over which the climate is substantially warmer than previous interglacials becomes longer, allowing more time for slow components of the climate system to respond. The very long-term human imprint on climate can be assessed by computing the warming remaining after many centuries, taking into account only the climate sensitivity applied to the CO2 remaining after allowing for uptake of carbon emissions by land and ocean. The resulting warming would be affected further by the additional feedbacks involved in Earth System Sensitivity, but examining the basic long-term warming gives an indication of the magnitude of climate change upon which these feedbacks act.
The uncertainty in the future course of climate is affected both by uncertainties in climate sensitivity and uncertainties in the carbon cycle. The joint effects of these uncertainties are presented in Figure 6.1. Some of the carbon cycle models included in the calculation sequester a moderate amount of carbon in land ecosystems during the early centuries, but none produces a significant long-term carbon release from land or marine sedimentary carbon pools. The effect of such a release would need to be taken into account by explicitly adding it in to the cumulative emissions directly produced by fossil fuel burning and land-use changes.
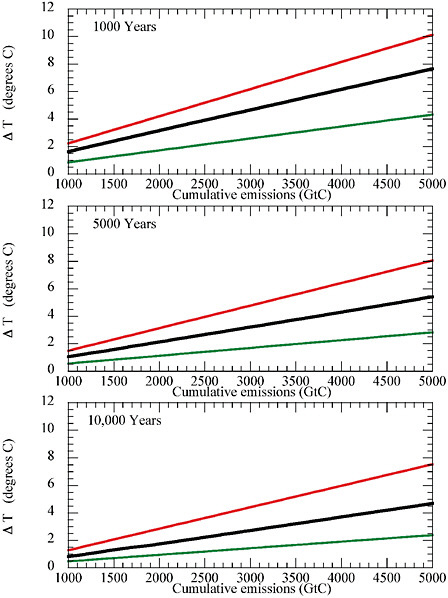
FIGURE 6.1 Range of very long-term warming obtained by applying the range of equilibrium climate sensitivity in Table 3.1 to the LTMIP ensemble of carbon-cycle models discussed in Archer et al. (2009). The upper red curve gives the maximum, the heavy black curve the median, and the lower green curve the minimum warming over all combinations of climate sensitivity and carbon-cycle models. These results incorporate the uptake of CO2 by land and ocean, but do not include other Earth System Sensitivity feedbacks such as vegetation change or ice sheet response. See Methods appendix for details of the calculation.
With 1,000 GtC cumulative emissions the median estimate of the warming falls to 1.6ºC at 1,000 years. The high end warming is still above 2ºC at this time, though it falls below 2ºC by 5,000 years. With 2,500 GtC cumulative emissions the median warming is still 2.7ºC at 5,000 years, while the high-end warming exceeds 4ºC. If cumulative emissions reach 5,000 GtC, even the lowest estimated warming remains above 2ºC after 10,000 years, while the high end is above 7.5ºC. In all cases, the warming decays very little between 5,000 years and 10,000 years, and in fact the warming remaining after 10,000 years would take 100,000 years or more to recover under the slow action of silicate weathering processes, even in the absence of destabilizing long-term Earth System feedbacks.
The large range of possible very long-term warming exhibited in the preceding discussion is due in large measure to the uncertainty in climate sensitivity. To what extent do past climate variations help to constrain this spread? The study of the instrumental record of climate provides, at best, a window into transient climate sensitivity. To obtain observational constraints on equilibrium climate sensitivity or Earth System Sensitivity, one must look into the more distant past. There are many ways to make use of the past climate record as a guide to the future, and in evaluating the published results, one must take care to distinguish the kind of climate sensitivity being estimated, which categories of climate forcings are regarded as feedbacks, and which categories of climate forcings are regarded as known or diagnosed forcings to be used in determining the sensitivity of the rest of the climate system.
Part of the cooling during the Last Glacial Maximum was due to a reduction in atmospheric CO2, and this can be used to estimate climate sensitivity. To accomplish this, one must estimate and subtract out the portion of climate change forced by changes in Earth’s orbit, by growth of the Northern Hemisphere ice sheets, and by dust radiative effects. In the end, this provides an estimate of climate sensitivity rather than Earth System Sensitivity, because the non-CO2 forcings are treated diagnostically instead of as feedbacks. On this basis, Hargreaves and Annan estimate a most likely climate sensitivity corresponding to Δ T2x = 2.5C, with low likelihood that Δ T2x exceeds 6ºC. When additional observational constraints are incorporated, the maximum likely value is reduced to 4ºC, in line with the range seen in the IPCC ensemble of models. Crucifix (2006) cautions, however, that the sensitivity of Earth’s climate to reductions in CO2 may not be a good indication of the sensitivity to increases.
The warm climates of Earth’s more distant past provide our most important guide as to Earth System Sensitivity. There are three times of particular
interest: the Pliocene period extending from 5.3 to 2.6 million years ago and preceding the initiation of the Pleistocene glacial/interglacial cycles; the Miocene period from 23 to 5.3 million years ago, during which Antarctic glaciation was initiated; and the Paleocene/Eocene boundary about 56 million years ago, at which point a massive release of carbon dioxide (presumably from land ecosystems) caused a massive warming of an already warm and largely ice-free climate.
The importance of the Pliocene is that the carbon dioxide concentrations at the time were only moderately greater than at present (380-425 ppm), but the climate was substantially different from today’s climate (Lunt et al., 2010). Antarctica was already glaciated, but the Northern Hemisphere (particularly Greenland) was free of large ice sheets. Northern Hemisphere mid-latitude and high-latitude temperatures were considerably greater than today’s. Tropical temperatures were not much warmer than modern values, although the characteristic east-west temperature gradient of the Pacific may have been much weaker, consisting of a permanent El Niño pattern (Wara et al., 2005). It is difficult to estimate global mean temperatures directly from proxy data, but using a combination of simulations and marine proxies, Lunt et al. (2010) estimate that the Pliocene global mean temperature was 3ºC warmer than at present. The Pliocene provides at least a hint that the Earth System Sensitivity is such that a doubling of atmospheric CO2, or perhaps even less, could cause a transition to a largely ice-free Northern Hemisphere, provided the CO2 remains high long enough. In a model-based diagnosis of Pliocene climate feedbacks, Lunt et al., 2010 estimate that Earth System Sensitivity (not counting carbon cycle feedbacks) is 1.45 times the basic climate sensitivity.
The Paleocene-Eocene Thermal Maximum (PETM) provides one of the most worrying indicators of Earth System Sensitivity. This event begins at the end of the Paleocene, during which Earth was already in a warm, globally ice-free state. Carbon isotope data indicate that at this time a rapid release of isotopically light carbon occurred, and that the climate warmed globally by about 4ºC. The most consistent picture at present is that the isotopically light carbon comes from a release of about 3,000 GtC of presumably land-based organic carbon, rather than from a destabilization of methane clathrates. For a review of the PETM and estimates of the amount of organic carbon release, the reader is referred to Zeebe et al., 2009. The essential challenge posed by the PETM is that one must explain an already warm Paleocene climate (presumably caused by elevated CO2), at the same time as accounting for the additional warming caused by release of additional carbon, which must not exceed the limits allowed by data. The problem is that the radiative ef-
fect of CO2 is logarithmic in CO2 concentration, so that if one starts with a high level of CO2 in order to explain the warm Paleocene, one needs an unrealistically large amount of additional CO2 to double or quadruple CO2 and give the requisite warming. On the other hand, if the sensitivity of climate to CO2 is very high, then one can explain the Paleocene temperature with a smaller CO2 concentration, and also get the required PETM warming from the release of a smaller amount of carbon to the atmosphere. This appears to demand a very high climate sensitivity, at least at the top of the IPCC range, and perhaps beyond (Pagani et al., 2006). Methane or other, currently unknown, radiative forcing agents may have affected the Pliocene climate and the PETM warming, but for now the simplest explanation of the PETM would appear to be that climate sensitivity is very high.
Impacts of anthropogenic global warming are quite sensitive to tropical warming, and the warm climates of the past shed some light on this issue as well. It has occasionally been proposed that the tropics are subject to a thermostat of one sort or another that limits tropical warming, but such proposals have been found to have no basis in physics (Williams et al., 2009). Moreover, the paleoclimate record of the Eocene and Paleocene provides direct support for the possibility of tropical temperatures considerably in excess of those prevailing today (Huber, 2008). Uncertainties in past CO2 concentrations, however, make it impossible to say whether current general circulation models overestimate or underestimate tropical climate sensitivity. It is generally recognized, however, that general circulation models have difficulty reproducing the low meridional temperature gradient prevailing in past warm climates (Pierrehumbert, 2002; Huber and Sloan, 2001). This suggests that the Earth system is subject to feedbacks amplifying polar warming, which are not adequately represented in current models (Abbot et al., 2009a).
The Potential for Large Biogeochemical Emissions: Evidence and Time Scales
Emissions of greenhouse gases could be augmented in a warmer world due to releases of gases from biogeochemical processes, such as methane from methane hydrates both in permafrost at high latitudes and under the deep ocean, enhanced nitrous oxide emissions from soils, and increased release of carbon dioxide from warming peat, soils, and the biosphere (Denman et al., 2007). Some of these sources could be very large, raising the issue of the risk of substantial contributions to climate change. For example, some estimates suggest that the carbon reservoir in the form of methane stored
in permafrost is of the order of 7.5-400 GtC (Brook et al., 2008), while that under the sea floor could amount to 500-2,500 GtC (Buffett and Archer, 2004; Milkov, 2004; Brook et al., 2008). Field studies have demonstrated remarkably large local emissions of methane in association with warming and melting of permafrost at particular Arctic sites, and there is evidence for substantial trace gas emissions at some times in the distant past in the paleoclimatic record (e.g., Walter et al., 2006).
Thus there is a potential for great risk, and this attracts the interest of scientists, the public, media, and policy makers. At present, our assessment is that it is not possible to quantify these risks. A challenge for climate science is not only to evaluate the physics and chemistry of the underlying processes, but also to explain why local observations or evidence from past climates do not necessarily imply that these factors are important for current and future anthropogenic climate changes.
Methane concentrations are currently about twice their pre-industrial levels; they were nearly stable for about a decade in 1997-2006, but began to increase again in 2007 (Rigby et al., 2008; Dlugokencky et al., 2009). Many studies establish ongoing permafrost retreat (Lemke et al., 2007) as well as considerable warming in the Arctic in both 2007 and 2008. But while global methane observations suggest a contribution from an increased source in the Arctic in 2007, there was no significant Arctic contribution to the methane increase in 2008 (Dlugokencky et al., 2009). Thus the currently warm Arctic does not seem to be a consistent source of methane that is significant on the global scale compared to other sources (which include wetlands, agriculture, animal husbandry, and waste processing, see Denman et al., 2007). One factor influencing methane release from permafrost is the amount of liquid water present, which controls whether decomposition is aerobic or anaerobic. This implies that not only thermal but also hydrological conditions are involved in whether or not conditions favor methane releases reaching the atmosphere on a large enough scale to be significant; similarly methane released from the sea floor can be degraded by bacteria before reaching the surface (Brook et al., 2008). Therefore, methane observations from particular sites, while sometimes dramatic and suggestive, may be insufficient for characterization of the much larger scales needed to understand global methane increases.
The large increase in methane observed at the time of the Younger-Dryas transition about 11,600 years ago is an example of a methane-climate feedback that has attracted significant interest. One recent study using isotopes suggests that the primary methane source at that time was from wetlands rather than permafrost (Petrenko et al., 2009). Several studies suggest a
potential to increase current methane concentrations in a warmer world through wetland emissions (by perhaps as much as a doubling for 3ºC warming, see Denman et al., 2007, and references therein); such a change, although significant, is far smaller than the potential reservoir in permafrost and illustrates that understanding the suite of contributing sources of trace gases is key to future projections.
A recent study by Fyke and Weaver (2006) studied the potential for significant methane emissions from the sea floor in a warmer world, and showed that the magnitude of the methane source depends upon thermal diffusivity (i.e., how rapidly warmth can be transmitted through the deep ocean and sediments), how large the warming is, and how long it lasts. That study suggests the potential for significant methane-climate feedbacks (up to 10% enhancement in the climate feedback parameter for warming pulses lasting 1,000 years). However, the total calculated methane release was limited, due to the very slow time scales involved compared to the likely duration of human-induced climate changes.
The effect of the release of clathrate methane on climate depends on the form and the time scale of the release of the stored carbon. When methane concentrations are much lower than CO2 concentrations, as they are at present, the release of a GtC in the form of methane results in much greater radiative forcing than the release of a GtC in the form of CO2; the precise ratio depends on the atmospheric methane and CO2 concentrations at the time of release. Although release as methane would lead to a strong transient warming spike, the methane oxidizes to CO2 on a decadal time scale, reducing the radiative forcing. Nonetheless, the clathrate reservoir is large enough that if a substantial portion of it is released, it would have a substantial radiative effect even after being converted to CO2.
As an example, let’s suppose that 100 GtC is released suddenly into the atmosphere as methane. This would increase the atmospheric methane concentration by 46 ppm over its present value of 1.8 ppm, leading to a radiative forcing of 6 W/m2, which would cause a transient climate warming of 2.1 to 3.6ºC, based on the likely range of transient climate sensitivity. Once oxidized to CO2, however, the radiative forcing subsides to only 0.6 W/m2 when applied on top of an ambient CO2 concentration of 390 ppm. On the other hand, release of, say, 1,000 GtC of clathrate methane would add significantly to the long-term radiative forcing even if the release were slow enough that the carbon accumulated in the atmosphere in the form of CO2. A slow release of methane would further add to the long-term warming since the release would sustain higher steady-state methane concentrations during the time when the release was occurring.
In addition to carbon stored in the form of methane clathrates there is also a substantial reservoir of organic carbon in near-surface land deposits. The standard estimate of the amount of carbon in the top meter of the land surface, plus living biomass, is about 2,100 gigatonnes of carbon, equivalent to nearly 1,000 ppm of atmospheric CO2 concentration before allowing for ocean uptake (Trumper et al., 2009). This figure is probably an underestimate of terrestrial organic carbon storage, as it doesn’t fully account for carbon storage in peatlands, and there is considerable potential that permafrost systems may store an additional 1,000 GtC or more of organic carbon (Schuur et al., 2008). At all times, microbial respiration is oxidizing some of this carbon and turning it to CO2, while photosynthesis is storing new carbon in the terrestrial pool. Currently, it is the photosynthetic storage that wins, so that the terrestrial ecosystem provides a moderate net sink of anthropogenic carbon. Are there circumstances when the balance can change and the terrestrial ecosystem instead becomes a net source of atmospheric CO2?
Terrestrial carbon-cycle modeling was discussed in detail in Section 2.4. Many models predict that terrestrial ecosystems will continue to be a modest sink of anthropogenic carbon, but this conclusion is dependent on highly contested aspects of the CO2 fertilization effect, and in particular the possible role of nutrient limitation in inhibiting fertilization. At least one carbon-cycle model predicts that terrestrial ecosystems can become a net CO2 source of carbon by 2050, with eventual releases of up to 5 GtC per year (Cox et al., 2000). The best evidence that the Earth system can indeed release several thousand GtC of organic carbon in the context of a warming environment is provided by the Paleocene-Eocene Thermal Maximum.
The PETM event demonstrates that the Earth system can succumb to destabilizing carbon-cycle feedbacks, in which an organic carbon pool (presumably on land) begins to oxidize rapidly and becomes a source rather than a sink of atmospheric carbon dioxide. In the case of the PETM, the release amounted to 3,000 GtC (Zeebe et al., 2009), which is eight times as much carbon as has been released by all fossil burning to date, and comparable to the higher range of estimates of what might be released by future fossil-fuel burning. The processes that led to the PETM carbon release are not at all understood, and so the risk that anthropogenic global warming could trigger a similar catastrophic release cannot at present be quantified, save to say that the risk is a real one. Estimates of carbon-cycle feedback based on Pleistocene or Holocene carbon dioxide fluctuations suggest much smaller carbon-cycle feedbacks than the PETM (Frank et al., 2010), but the PETM provides the closest analogue to what might happen to the carbon cycle in a climate substantially warmer than the present.
In summary, there is potential for biogeochemical feedbacks to climate change through emissions of trace gases but it cannot be quantified at present. Such releases could add 2,000 GtC or more to the carbon directly put into the atmosphere by fossil-fuel burning and land-use change. If some of this stored carbon is released rapidly in the form of methane, it could lead to a pronounced transient warming spike above and beyond the more persistent warming caused by increases in atmospheric CO2. Local measurements of releases are important in understanding processes but are currently insufficient to characterize the significance of sources for the global atmosphere. Thresholds for large effects are difficult to establish from paleoclimatic information, since key processes may become important over very slow time scales of many thousands of years in a warmer world, but may take place too slowly to be important on the time scales of relevance for human perturbations (i.e., the very long time scales required for the process to act may exceed the Anthropocene period over which human carbon emissions are expected to significantly warm the atmosphere).
Ice Sheets Beyond 2100
The extent to which the great ice sheets of Greenland and Antarctica will survive the Anthropocene is a question of paramount importance. Paleoclimate reconstructions provide some information regarding the conditions for initiation of these ice sheets, but there are no known instances of complete deglaciation of these ice sheets that could provide ground-truth for estimates of the temperature thresholds for deglaciation and the time required for deglaciation to take place. Therefore, estimates of temperature and duration thresholds must be drawn from ice sheet models, past partial deglaciations of Greenland and Antarctica, and past total deglaciations of the Laurentide or Fenno-Scandian ice sheets. It should be kept in mind that there are many important physical processes that are not well represented in current ice-sheet models, so that any thresholds based on models should be taken as only a general indication of what ice sheets can do, rather than precise, definitive values.
The waxing and waning of large land ice sheets has a profound effect on sea level. Moreover, the major categories of past climate states are often distinguished by the presence of ice near both poles (the Pleistocene and Holocene), near the South Pole only (the Pliocene), or by ice-free conditions in both the Arctic and Antarctic (the Eocene). The glacial/interglacial transitions of the Pleistocene involve the growth and decay of the Laurentide and
Fenno-Scandian ice sheets, but going forward into warmer climates, it is the fate of the Greenland and Antarctic ice sheets that is of prime interest.
The loss of Greenland would make the Anthropocene look something like the Pliocene world, before the Pleistocene glacial/interglacial cycles set in, and there is strong evidence that this could happen in response to anthropogenic CO2 emissions. Using coupled GCM/ice-sheet models, Ridley et al. (2005) find that Greenland deglaciates almost completely when the global mean warming exceeds 5ºC for 1,500 years, and (Vizcaino et al., 2008) find near-total deglaciation when the global mean warming remains above 3.5ºC for 4,000 years. Gregory et al. (2004) argue that even lesser warming could lead to deglaciation and cite indications that, once deglaciated, the Greenland ice cap might not recover even if CO2 were restored to pre-industrial levels. The deglaciation of Greenland is primarily sensitive to Greenland regional summer warming, and models differ greatly as to the relationship of global mean temperature to the local summer warming. Estimates of the global mean warming needed for deglaciation range from a low of 1.9ºC to a high of 4.6ºC (Meehl et al., 2007). The vulnerability of Greenland found in models is consistent with the absence of Northern Hemisphere glaciation in the Pliocene. Calculated Greenland melt is shown in Figure 6.2. During the Eemian about 130,000 years ago, Arctic temperatures were about 3-5ºC warmer than present, and it has been estimated that the loss of ice from Greenland and other Arctic ice fields contributed up to 4 m to sea level rise (Jansen et al., 2007).
In protracted warm conditions, the deglaciation of Greenland proceeds from robust melt ablation, with little need to involve the less well understood aspects of ice flow. Various aspects of ice dynamics that are not currently well represented in glacier models have the potential to allow the deglaciation to proceed much more rapidly, but nothing definitive can be said about the minimum time scale at present.
It is sometimes asserted that anthropogenic CO2 emission would be beneficial because it could avoid an impending ice age, but this is incorrect. In fact, Berger et al. (2003) and Berger and Loutre (2002) project that Earth’s current orbital configuration would make the Holocene interglacial unusually long even without bringing anthropogenic CO2 into the mix. Earth’s orbit would not be expected to produce another ice age for at least 30,000 years (Jansen et al., 2007). Anthropogenic warming is piling warming on top of an interglacial that is already projected to be unusually long, and moreover doing it at a time when the precessional cycle will be swinging into a hot Northern Hemisphere phase over the next 5,000 years. This adds to the prospect that anthropogenic CO2 emissions could lead to a major
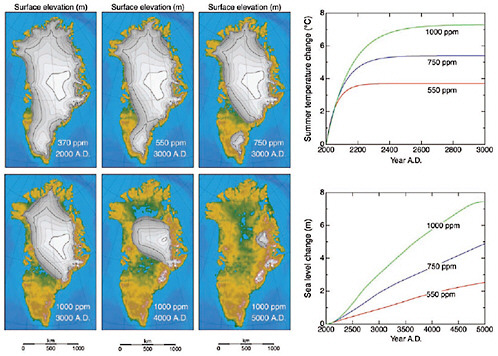
FIGURE 6.2 Future evolution of the Greenland Ice Sheet calculated from a 3D ice-sheet model forced by three greenhouse gas stabilization scenarios. The warming scenarios correspond to the average of seven IPCC models in which the atmospheric CO2 concentration stabilizes at levels between 550 and 1,000 ppm after a few centuries (Gregory et al., 2004) and is kept constant after that. For a sustained average summer warming of 7.3°C (1,000 ppm), the Greenland Ice Sheet is shown to disappear within 3,000 years, raising sea level by about 7.5 m. For lower CO2 concentrations, melting proceeds at a slower rate, but even in a world with twice as much CO2 (550 ppm or a 3.7°C summer warming) the ice sheet will eventually melt away apart from some residual glaciation over the eastern mountains. The figure is based on the models discussed in Huybrechts and de Wolde (1999). Source: Alley et al. (2005).
climate transition. Berger et al. (2003) and Berger and Loutre (2002) note that the Anthropocene may initiate a 50,000-year interruption of Northern Hemisphere glaciation, during much of which time the Northern Hemisphere may be almost ice-free.
During the last interglacial period (the Eemian), global sea level was at least 3 m, and probably more than 5 m, higher than at present. But some studies suggest that the high sea levels during the last interglacial period have been proposed to result mainly from disintegration of the West Antarctic ice sheet, with model studies attributing only 1-2 m of sea level rise to meltwater from Greenland. Cuffey and Marshall (2000) suggest that the Greenland ice sheet was considerably smaller and steeper during the Eemian, and plausibly contributed 4-5.5 m to the sea level highstand during that period. New results from ice cores indicate that a significant ice sheet was covering Greenland during the warm Eemian period and that the reduction of the Greenland ice sheet at most contributed a sea level rise of 1-2 m of the observed 5 m (Dahl-Jensen et al., 2005).
Total loss of the Antarctic ice sheet would make the Anthropocene look something like the largely ice-free pre-Miocene climates that prevailed more than 30 million years ago. Antarctica is less subject to direct ablation by melting than is Greenland, and so the conditions for deglaciation of Antarctica are much more dependent on poorly understood aspects of ice dynamics. Many important processes, including ice streams and ice shelves, are not represented at all in the models used to study the problem. There have been few modeling studies, and little confidence can be placed in the few that have been done. Conventional thinking has it that the current East Antarctic ice sheet would be very difficult to get rid of by anthropogenic warming (Huybrechts, 1993). Indeed, Vizcaino et al. (2008) find that the Antarctic ice sheet grows in volume even when the global mean warming exceeds 4ºC for 1,000 years. In a study of Antarctic glacial fluctuations, Pollard and Deconto (2005) find that substantial portions of Antarctica deglaciate in under 10,000 years in response to CO2 concentrations on the order of 840 ppm, but express doubt that their results are applicable to the more extensive Antarctic glacier of today. Modeling studies, however, support the possibility of deglaciation of the West Antarctic ice sheet if subjected to local oceanic warming of as little as 5ºC over a few thousand years, and there is moreover good support for episodic deglaciation of the West Antarctic Ice Sheet in Pliocene conditions (Pollard and DeConto, 2009). Based on the pattern scaling given in Section 4.1, this would correspond roughly to a 5ºC global mean warming, but much caution should be exercised in applying these transient climate response patterns to long-term climate behavior,
especially in view of the great difficulties models have with reproducing Antarctic regional climate.
A great deal of public attention has focused on 350 ppm as a target for CO2 concentration. The identification of 350 ppm as a danger threshold for CO2 (Hansen et al., 2008) rests largely on the study of the Miocene initiation of Antarctic glaciation. The assumption here is that Antarctica would deglaciate at CO2 concentrations similar to those which permitted the initiation of Antarctic glaciation. The CO2 concentration at the time of Antarctic glacier initiation is not very well known, and 350 ppm is drawn from the lower end of estimates of the concentrations prevailing at the time of initiation of Antarctic glaciation. Beyond that it is likely that the East Antarctic ice sheet, once formed, can survive considerably higher temperatures than those prevailing at the time of its initiation. The paleoclimate argument for 350 ppm as a danger threshold must be considered speculative, but the essential difficulty is that there are no past analogues in which a massive East Antarctic ice sheet has been subjected to temperatures as warm as those that may prevail in the Anthropocene.
It is important to recognize that the hypothetical dangers from a CO2 concentration of 350 ppm reside in the very long-term climate feedbacks. Therefore, the CO2 would have to remain above this level for thousands of years in order for these feedbacks to be a major concern. The concentration can exceed 350 ppm at its peak without incurring a risk of triggering the long-term feedbacks, so long as it subsides to 350 ppm or less over a few thousand years. In the carbon cycle model of Eby et al. (2009), cumulative carbon emissions of 850 GtC or less are required to allow the CO2 concentration to subside to 350 ppm within 5,000 years, but over the range of carbon cycle models with long-term climate and sediment dissolution feedbacks discussed in Archer et al. (2009), two-thirds of the models recover to under 350 ppm in 5,000 years when the cumulative emissions are 1,000 Gt.
If uncompensated by increase in water storage in East Antarctica, the total loss of the Greenland ice sheet would lead to a sea level rise of 7.5 m (Bamber et al., 2001), while the total loss of the West Antarctic Ice Sheet would lead to an additional rise of 5 m (Bamber et al., 2009). The latter is comparable to the contributions of the West Antarctic Ice Sheet to Pliocene and Pleistocene sea level fluctuations as modeled by Pollard and DeConto (2009). Melting of all mountain glaciers and ice caps would add at least 0.7 m to sea level (Bahr et al., 2009), although it should be noted there is considerable uncertainty regarding the thickness of many ice caps in mountainous regions. This would be added to the long-term sea level rise due to thermal
expansion (estimated to be 0.2 to 0.6 m per degree C of global warming in IPCC, 2007a), which would amount to 0.6 to 1.8 m for a long-term warming of 3ºC or 1.2 to 3.6 m for a long-term warming of 6ºC.
6.2
LONG TERM SOCIETAL AND ENVIRONMENTAL ISSUES
Over the coming millennia, some impacts of climate change may settle into new patterns of climate variability with the successful implementation of stabilization policies that cap cumulative emissions and therefore limit increases in global mean temperature. Climate variability could then be distributed around different means (with perhaps different higher moments), but it is possible that societies could become accustomed to these new environments. That world would be different than today, but new conditions could become routine to people living on Earth one or two thousand years from now. Other impacts, however, could continue for many centuries past the date of temperature stabilization.
Rising seas and melting glaciers and/or ice sheets easily fit into this second category of persistent and growing very long-term significance. Figure 6.3 displays, for example, contours of 1 m of sea level rise for Florida, which could occur by 2100 based on Section 4.8. In the longer term, much larger sea level rise is possible over millennia (see Section 6.1). Clearly, increases in risks from inundation, repeated flooding, and coastal erosion that have already been documented in some places for modest sea level rise could therefore continue as the future unfolds and could well be amplified over the long term depending upon the rate at which they occur as the climate system changes.
To get a better understanding of what associated vulnerabilities might look like as the long-term future unfolds, one might contemplate tracking widespread migration over recent time away from areas of exacerbated climate risk, but attribution would be extremely difficult. As noted in Wilbanks et al. (2007: Box 7.2), observed environmental migration is often a temporary reaction to the calamitous ramifications of one extreme event or another. WDR (2010) reports that displaced people (the estimated 26 million people who have moved permanently during recent years) constitute less than 10% of the world’s international migrants and that most of these people relocate still live within the same country or, at worst, somewhere in the same region of the world.
IPCC (2007e) reported, in words that were unanimously approved in the plenary as part of the Summary for Policymakers, that
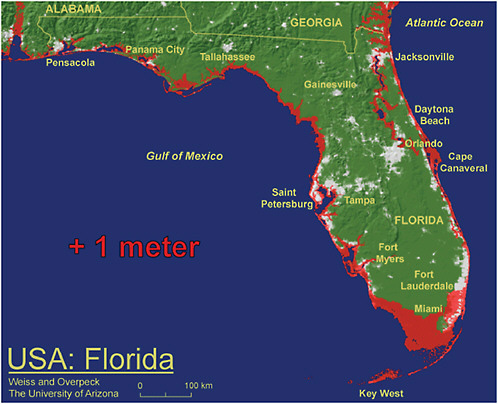
FIGURE 6.3 Effect of sea level rise of 1 m in the area of Florida. Red regions would be subject to inundation at this sea level rise. Source: University of Arizona, see http://www.geo.arizona.edu/dgesl/research/other/climate_change_and_sea_level/sea_level_rise/sea_level_rise_technical.htm.
There is high confidence that neither adaptation nor mitigation alone can avoid all climate change impacts; however, they can complement each other and together can significantly reduce the risks of climate change. Adaptation is necessary in the short and longer term to address impacts resulting from the warming that would occur even for the lowest stabilization scenarios assessed. Unmitigated climate change would, in the long term, be likely to exceed the capacity of natural, managed and human systems to adapt. The time at which such limits could be reached will vary between sectors and regions. (p. 19).
This finding, drawn in large measure from Yohe et al. (2006), refers to aggregate measures of vulnerability projected over a one-century time scale; it cannot be interpreted as meaning that every sector and every person would be incapable of adapting to preserve their standards of living. It does, however, suggest that responding to climate change and associated climate variability over the very long term could become increasingly more difficult and expensive across developed and developing countries, alike.
To summarize, more nuanced analyses of some sources of vulnerability to climate change that would persist and, indeed, continue to grow over the coming millenia are required to provide useful insight into the consequences of stabilization over the very long term. Since rising seas are the source of one such persistent and growing threat across the world, though, it is entirely plausible that displaced people may be forced to migrate even if temperature increases are capped. They may move within a country or region (like, as reported in Kates et al. [2006], the tens of thousands of people who moved to communities across the United States after Hurricane Katrina and have decided not to return), but they may not.


