
Summary
Society faces important choices in the coming century regarding future greenhouse gas emissions and the resulting effects on Earth’s climate, ecosystems, and people. Atmospheric concentrations of several important greenhouse gases have increased markedly since the start of the 20th century because of human activities, and the increased concentrations of these gases very likely1 account for most of the globally averaged warming of the past 50 years. Carbon dioxide is responsible for more than half of the current impact of human emissions of greenhouse gases on Earth’s climate, or radiative forcing,2 and its influence is projected to grow. Its atmospheric concentration has increased by more than 35 percent since 1750, and is now higher than at any time in at least 800,000 years. Looking to the future, the concentration of carbon dioxide could undergo a further doubling or tripling by the end of the century, greatly amplifying the human impact on climate.
Because of the long atmospheric lifetime of carbon dioxide and the time lags in the climate system (particularly slow processes in the ocean, see Section 3.2), human choices in the near-term have long-term ramifications on Earth’s climate not only for the rest of the century but also for the next sev-
eral millennia. Indeed, some effects of 21st century human choices would contribute to climate change for more than 100,000 years. {2.1, 3.2}3
One way of informing these choices is to consider the projected climate changes and impacts that would occur if greenhouse gases increase to particular concentration levels and then stabilize, as highlighted in the Statement of Task (see Appendix A). Alternative futures then can be represented by a broad range of atmospheric concentration “target” levels (hereafter referred to as stabilization targets). The committee was charged to evaluate different stabilization targets with particular emphasis on the avoidance of serious or irreversible impacts on Earth’s climate system. This report does not evaluate the plausibility of any stabilization target, nor does it make any recommendations regarding desirable or “safe” targets.
It should be emphasized that choosing among different targets is a policy issue rather than strictly a scientific one, because such choices involve questions of values, e.g., regarding how much risk to people or to nature might be considered too much. Some climate changes could be beneficial for some people or regions, while being damaging to others.
The primary challenge for this study is to quantify, insofar as possible, the outcomes of different stabilization targets using analyses and information drawn from the scientific literature. Expected changes based on broad scientific understanding are discussed, as well as projected values based upon models. Where there is sufficient understanding to be quantitative, numerical values for projected climate change and impacts are provided as a function of stabilization target. A number of important aspects of climate change that are currently understood in a qualitative manner, or for which the time horizon of the response is poorly constrained, are also reviewed. The report represents a brief summary of a vast scientific literature and seeks to be illustrative and representative rather than comprehensive. Special emphasis is placed on climate changes and impacts in North America and the United States.
The report focuses on human forcing of the climate system from carbon dioxide emissions and rising atmospheric concentrations because of the dominant role and unique influences of carbon dioxide on long-term climate change. The role of other anthropogenic greenhouse gases, such as methane, nitrous oxide and halocarbon, and aerosols are also briefly discussed. For many purposes, the total radiative forcing of the suite of anthropogenic greenhouse gases and aerosols can be cast in terms of an
equivalent level of atmospheric carbon dioxide, also known as the CO2-equivalent concentration.
APPROACH
The goal and implications of stabilizing climate change are most often discussed in terms of stabilizing atmospheric concentrations of CO2. This report takes a different approach by (1) using global temperature change as the frame of reference and (2) focusing in part on the relationship between accumulated carbon emissions and global mean temperature change.
The motivation for this approach is both practical and conceptual. Available data and modeling suggest that the magnitudes of many key impacts can be quantified for given amounts of global warming through scaling of local to global warming and through coupled linkages to warming (such as alterations in the water cycle that scale with warming). But although published analyses of future climate impacts can be tied to specific warming levels in particular studies, this information often cannot readily be linked to CO2-equivalent concentrations (because, for example, of lack of information on aerosol forcing used in many future climate impact studies based on emission scenarios).
Moreover, using warming as the frame of reference provides a picture of impacts and their associated uncertainties in a warming world—uncertainties that are distinct from the uncertainties in the relationship of CO2-equivalent concentrations to warming. Use of warming as a metric of change also permits coverage of the transient climate changes and impacts while concentrations increase, as well as the lock-in to further changes after stabilization. Further, the approach taken here facilitates cataloging ranges of impacts that should be expected for 1ºC, 2ºC, 3ºC, or other levels of warming. The reader can thus consider how much warming s/he considers to be an appropriate target. Information is also provided to translate warming into best estimates of associated CO2-equivalent target concentrations with these best estimates accompanied by estimated likely uncertainty ranges derived from uncertainty in climate sensitivity.
Furthermore, this report also describes the cumulative carbon framework, a perspective that has recently received considerable attention. Rather than CO2-equivalent concentration levels, this approach considers the amount of carbon emissions accumulated over time and the implications of different accumulated emissions targets. Models consistently suggest a persistent temperature response to a given level of cumulative carbon emissions. Accumulated carbon emission targets link to impacts through temperature (or
warming) and are clearly relevant to policy aimed at controlling emissions and reducing the risk of dangerous impacts. The approaches used here thereby provide additional policy-relevant information that would be lost in an analysis that only related impacts to CO2-equivalent concentration levels.
KEY FINDINGS
There are three key findings of this report, which correspond to the structure of this summary:
-
Climate change in the very long term: Future stabilization targets correspond to altered states of Earth’s climate that would be nearly irreversible for many thousands of years, even long after anthropogenic greenhouse gas emissions ceased. The capacity to adapt to slow changes is generally greater than for near-term rapid climate change, but different stabilization levels can lock the Earth and many future generations of humans into large impacts that can occur very slowly over time, such as the melting of the polar ice sheets; similarly, some stabilization levels could prevent such changes.
-
Climate change in the next few decades and centuries: Understanding the implications of future stabilization targets requires paying attention to the expected climate change and to the emissions required to achieve stabilization. Because of time lags inherent in Earth’s climate, the observed climate changes as greenhouse gas emissions increase reflect only about half of the eventual total warming that would occur for stabilization at the same concentrations. Moreover, emissions reductions larger than about 80% (relative to whatever peak global emission rate may be reached) are required to approximately stabilize carbon dioxide concentrations for a century or so at any chosen target level (e.g., 450 ppmv, 550 ppmv, 650 ppmv, 750 ppmv, etc.).4 Even greater reductions in emissions would be required to maintain stabilized concentrations in the longer term. It should be emphasized that this finding is not linked to any particular policy choice about time of stabilization or stabilization concentration, but applies broadly, and is due to the fundamental physics of the carbon cycle presented in Chapter 2.
-
Climate changes, impacts, and choices among stabilization targets: A number of key climate changes and impacts for the next few decades and
-
centuries can now be identified and estimated at different levels of warming. Many impacts can be shown to scale with warming (see Figure S.5). Scientific progress has resulted in increased confidence in the understanding how global warming levels of 2ºC, 3ºC, 4ºC, 5ºC, etc. (see Figure S.1) affect precipitation patterns, extreme hot seasons, streamflow, sea ice retreat, reduced crop yields, coral bleaching, and sea level rise. This increased confidence provides direct scientific support for evaluating the implications of different stabilization targets. However, other climate changes and impacts are currently understood only in a qualitative manner. Many potential effects on human societies and the natural environment cannot presently be quantified as a function of stabilization target (see Figure S.6). This shortcoming does not imply that these changes and impacts are negligible. Some of these impacts, such as species changing their ranges or behavior, could be very important; indeed, some may dominate future risks due to anthropogenic climate change. Uncertainty in the carbon dioxide emissions and concentrations corresponding to a given temperature target is large, and choices about stabilization targets depend upon judgments regarding the degree
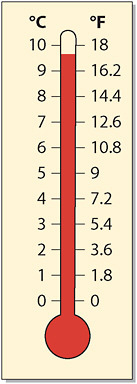
FIGURE S.1 Illustration of how temperature change in degrees Celsius (left side of thermometer) relates to temperature change in degrees Fahrenheit (right side of thermometer). For example, a warming of 5ºC is equal to a warming of 9ºC. In this report estimates of temperature change are made in degrees Celsius in accordance with international scientific practice.
-
of acceptable risk associated with both quantifiable and non-quantifiable impacts and changes.
SUPPORTING EVIDENCE
1.
Cumulative Carbon Dioxide Emissions and Climate Change over Millennia
Climate changes that occur because of carbon dioxide increases are expected to persist for thousands of years5 even if emissions were to be halted at any point in time. Recent scientific literature has shown that the contribution to global warming caused by anthropogenic CO2can be directly related to the cumulative emissions of carbon dioxide.
For example, our best estimate (see Figure S.2) is that 1,000 gigatonnes of anthropogenic carbon (GtC) (Box S.1) emissions lead to about 1.75ºC increase in global average temperature,6 implying that approximately 1,150 gigatonnes of carbon (or 4,200 Gt CO2) would lead to a global mean warming of 2ºC (the stated aspirational goal of the “group of eight” nations). Based on current understanding, this warming is expected to be nearly irreversible for more than 1,000 years (Figure S.3). Figure S.2 shows best estimates and likely uncertainty ranges for cumulative carbon emissions leading to a range of warming levels, along with cumulative emissions to date (about 500 GtC). Carbon dioxide alone accounted for about 55 percent of the total CO2-equivalent concentration of the sum of all greenhouse gases in 2005. The contribution of carbon dioxide increases to between 75 and 85 percent of total CO2-equivalent by the end of this century based on a range of current emission scenarios. Some anthropogenic carbon dioxide is removed by the oceans and biosphere in decades to centuries, but the slow time scales of the long-term uptake of carbon in the ocean means that some is expected to persist in the atmosphere for many thousands of years. This behavior is unique to carbon dioxide among major radiative forcing agents. Choices regarding continued emissions or mitigation of other warming agents such
|
5 |
Approaches to “geoengineer” future climate, e.g., to actively remove carbon from the atmosphere or reflect sunlight to space using particulate matter or mirrors are topics of active research. If effective, these may be able to reduce or reverse global warming that would otherwise be effectively irreversible. This study does not evaluate geoengineering options, and statements throughout this report regarding the commitment to climate change over centuries and millennia from near-term emissions should be read as assuming no geoengineering. Reforestation or other methods of sequestration of carbon are also not considered. |
|
6 |
The quasi-linear response of temperature to cumulative carbon is discussed in detail in Section 3.4. |
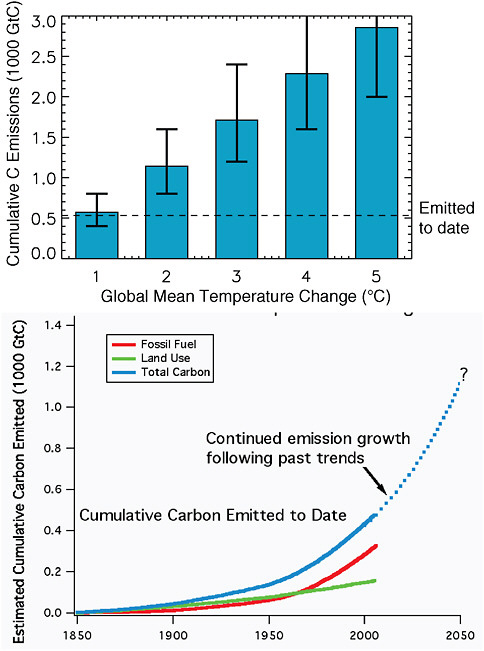
FIGURE S.2 (top) Best estimates and likely range of cumulative carbon emissions that would result in global warming of 1ºC, 2ºC, 3ºC, 4ºC, or 5ºC (see Figure S.1), based on recent studies that have demonstrated a near linearity in the temperature response to cumulative emissions (see Section 3.4). Error bars reflect uncertainty in carbon cycle and climate responses to CO2 emissions, based on both observational constraints and the range of climate-carbon cycle model results (see Section 3.4). (bottom) Estimated global cumulative carbon emissions to date from fossil fuel burning and cement production, land use, and total. The figure also shows how much cumulative carbon would be emitted by 2050 if past trends in emission growth rates were to continue in the future, based upon a best fit to the past emission growth curve. {3.4}
|
BOX S.1 GTC (GIGATON OF CARBON) One gigaton of carbon is 1 billion tons of carbon, where “carbon” refers literally to the mass of carbon, not the mass of a molecule as a whole (i.e., all the atoms), but just the mass of carbon atoms. Example: Burning 1 gallon of gasoline emits approximately 19.6 lbs of CO2 (http://cdiac.ornl.gov/pns/faq.html), so if you assume a typical American vehicle gets 20 miles per gallon and it travels 15,000 miles per year, then the typical American vehicle emits about 1.8 tons of carbon per year. Stated differently, about 550 million average American vehicles would emit 1 GtC per year. |
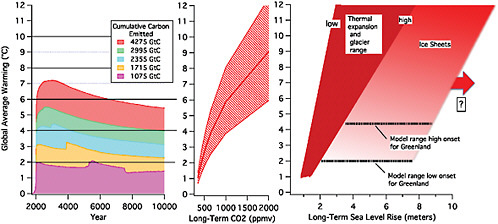
FIGURE S.3 Commitments to global warming over thousands of years, expressed as best estimates depending upon the cumulative anthropogenic carbon emitted (direct human emission plus possible induced feedbacks such as release of carbon from clathrates, see below) by the end of the next few centuries from a model study (left, from the calculations presented in Eby et al., 2009), the corresponding long-term carbon dioxide concentrations, shown as best estimates and likely ranges (middle, from Table 3.1 of this report), and estimated range of corresponding global average sea level rise (right, see Section 6.1; the adopted equilibrium long-term thermal sea level rise is 0.2-0.6 m per degree as noted in Meehl et al., 2007). The “low” and “high” onset values in the right panel reflect differences between available climate models in the global mean temperature at which the Greenland ice sheet will disappear after thousands of years since the accumulation cannot sustain the ice loss by melt in the ablation area and rapid ice flow-related loss along the margins. This depends not only on increased ice loss from warming but also on increased accumulation from greater snowfall in a warmer world, and the balance between these terms differs from model to model. The range across models is taken from Meehl et al. (2007) based on a detailed analysis of the models evaluated in the Intergovernmental Panel on Climate Change (IPCC) report. Additional contributions from rapid ice discharge are possible (see Chapters 4 and 6). The climate sensitivity used to construct the likely ranges shown in the middle panel is discussed in Chapter 3 where it is noted that larger or smaller warmings than the estimated likely value for a given carbon dioxide concentration cannot be ruled out. Bumps in the warming curves in the left panel are because of adjustments in ocean circulation in response to warming in this particular climate model and should be thought of as illustrative only. {3.2, 6.1}
as methane, black carbon on ice/snow, and aerosols can affect the global warming of coming decades but have little effect on the lock-in to longer-term warming of Earth over centuries and millennia; that commitment is primarily controlled by carbon dioxide. {2.1, 2.2, 2.3, 3.4}
Earth is now entering a new geological epoch, sometimes called the Anthropocene, during which the evolution of the planet’s environment will be largely controlled by the effects of human activities, notably emissions of carbon dioxide. Actions taken during this century will determine whether the Anthropocene climate anomaly will be a relatively short-term and minor deviation from the Holocene climate, or an extreme deviation extending over many thousands of years.
Higher cumulative carbon emissions result in both a higher peak warming and a longer duration of the warming (see Figure S.4). The duration of the warming is critical, because an extended period of warming provides more time for the components of the Earth system that may respond very slowly (such as the deep oceans and the great ice sheets) to assert themselves, even very long after anthropogenic emissions have ceased. {6.1}
The sea level rise implications of the Anthropocene could lead to major changes in the geography of the Earth over the coming millennia. Model studies suggest that a cumulative carbon emission of about 1,000 to 3,000 GtC would lead to eventual sea level rise due to thermal expansion and glacier and small ice cap loss alone of the order of 1 to 4 meters. Additional contributions from Greenland could contribute as much as a further 4 to 7.5 m on multi-millennial time scales, for a possible total of order 5 to 11.5 meters from thermal expansion, glaciers and small ice caps, and Greenland.
Widespread coastal inundation would be expected if anthropogenic warming of several degrees is sustained for millennia; although these slow changes allow time for adaptation, they are essentially irreversible. The projected fragility of the Greenland ice sheet is in accord with studies suggesting that Greenland was essentially free of ice during the Pliocene era (which was probably about 3ºC warmer than pre-industrial times in the mid-Pliocene, about 3-3.3 million years ago). Changes in Antarctica are less clear, in part because both the West and East Antarctic ice sheets must be considered: one study suggests that cumulative carbon emission of about 2,000-5,000 GtC could also contribute up to 5 meters of additional sea level rise from West Antarctic ice sheet loss. Future changes in East Antarctica could offset at least part of West Antarctic changes. While carbon emissions in the 21st
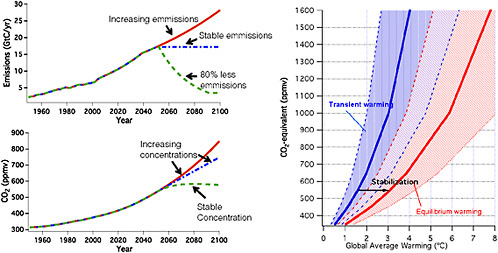
FIGURE S.4 The left panel shows illustrative examples (from calculations using the Bern Earth Model of Intermediate Complexity, see Chapter 2 and Methods) of how carbon dioxide concentrations would be expected to evolve depending upon emissions. Stable emissions (blue lines) do not result in stable concentrations because the source of carbon is much larger than the sink. Emission reductions larger than about 80% are required if concentrations are to be stabilized (green lines). The right panel shows the best estimates and likely ranges of global warming projected for various levels of carbon dioxide concentration in the transient (blue) and equilibrium states, or climate sensitivity (red); see Table 3.1. As carbon dioxide emissions increase, average global warming is projected to follow the blue curve. If concentrations of carbon dioxide were to be stabilized, the global warming is expected to increase from the blue to the red curve, as depicted by the arrow. Note that the equilibrium warming indicated in the figure incorporates only feedbacks from water vapor, clouds, sea ice, or snow changes; the slower acting feedbacks incorporated in Earth System Sensitivity may increase the warming (by about 50% over the values shown according to one study by Lunt et al., 2010) {2.1, 3.2, 3.3}
century are expected to determine the commitments to these eventual future changes, the sea level rise expected to occur in the 21st century is considerably smaller, in the range of 0.5 to 1.0 m. Some semi-empirical models predict sea level rise up to 1.6 m by 2100 for a warming scenario of 3.1ºC, a possible upper limit which cannot be excluded. {4.8, 6.1}
Some slow climate components could act as amplifiers that would greatly increase the size and duration of the Anthropocene.
If elevated global temperatures were to persist for a thousand years or more, some studies suggest that the resulting warming of the deep ocean
could release deep-sea carbon stored in the form of methane clathrates7 in marine sediments. Other contributions could come from the substantial reservoir of near-surface organic carbon in soils and permafrost, whose stability is poorly understood. For example, a release rate of a half GtC per year from such sources would add 2,500 Gt of carbon over 5,000 years to the carbon emitted directly by humans. For reference, paleoclimate studies suggest that during the Paleocene-Eocene Thermal Maximum (about 55 million years ago), similar amounts of carbon were released in less than 10,000 years. A number of recent studies show that large methane releases from particular local sites have been observed, but these are too limited to imply that globally significant changes are already occurring or will occur for warming levels in the near term. {6.1}
2.
Stabilization and Climate Change of the Next Few Decades and Next Several Centuries
Because the global anthropogenic source of carbon dioxide greatly exceeds the net global sink (through removal mechanisms in the ocean, land, and biosphere), stabilization of carbon dioxide concentrations at any selected target level would require reductions in total emissions of at least 80 percent (relative to any peak emission level).
Unless the source matches the sink, concentrations of carbon dioxide (and resulting warming influences) will continue to rise, much like the water in a bathtub when water is coming in faster than it is going out. Because current carbon dioxide emissions exceed removal rates, stabilization of carbon dioxide emissions at current rates will not lead to stabilization of carbon dioxide concentrations (see Figure S.4). A robust consequence of the stock and flow nature of atmospheric carbon and the physics of the carbon cycle is that emissions reductions larger than about 80% (relative to whatever peak emission level occurs) are required to approximately stabilize carbon dioxide concentrations for a century or so and even greater reductions in emissions would be required in the longer term; this applies for any chosen stabilization target.
Observed climate responses in coming decades will be smaller than the longer-term temperature response to any given stabilization level. If carbon dioxide equivalent concentrations were to be stabilized at some point
in the future, there would be a lock-in to further warming of comparable magnitude to that already occurring at the time of stabilization.
The instantaneous response of Earth’s atmosphere and oceans to increases in greenhouse gases and net radiative forcing represents a transient climate change, which can be linked to “transient climate response.”8 The transient climate response is smaller than the longer-term “climate sensitivity” that includes adjustments by the oceans to the added heat (Table S.1). For example, if carbon dioxide equivalent concentrations (including aerosols and other gases) were to increase from today’s best estimate levels of about 390 parts per million by volume (ppmv) to 550 ppmv at rates of growth similar to those occurring today, averaged warming would be expected to increase in a manner that scales with the change in radiative forcing relative to the transient climate response; for 550 ppmv the best estimate total warming since pre-industrial times is about 1.6ºC (within a likely uncertainty range of 1.3-2.2ºC). In the hypothetical case where concentrations are then immediately stabilized at 550 ppm, further warming would subsequently occur over the next several centuries, reaching a best estimate “climate sensitivity” of about 3ºC (likely in the range of 2.1-4.3ºC). The horizontal arrow in Figure S.4 depicts such a transition from transient to equilibrium warming. {2.2, 2.4, 3.2, 3.3}
Climate sensitivity remains subject to considerable uncertainty. The estimated “likely” range presented in this report corresponds to the range of model results in the CMIP3 global climate model archive, and it is roughly consistent with paleoclimate evidence. However, the possibility of climate sensitivities substantially higher than this range cannot at present be ruled out. This report should be read with this proviso in mind, as these high sensitivities, if realized, would amplify many of the impacts discussed and associated risk. {3.2, 3.3, 6.1}
3.
Climate Changes, Future Impacts, and Choices among Stabilization Targets
Increases in global mean temperature caused by higher anthropogenic greenhouse gas concentrations would be expected to lead to a diverse range
TABLE S.1 Estimated Likely Ranges and Best Estimate Values for Transient and Equilibrium Global Averaged Warming Versus Carbon Dioxide Equivalent Concentrations.
|
CO2-Equlvalent Concentration (ppmv) |
Best Estimate Transient Warming (ºC) |
Estimated Likely Range of Transient Warming (ºC) |
Best Estimate Equilibrium Warming (ºC) |
Estimated Likely Range of Equilibrium Warming (ºC) |
|
350 |
0.5 |
0.4-0.7 |
1 |
0.7-1.4 |
|
450 |
1.1 |
0.9-1.5 |
2.2 |
1.4-3.0 |
|
550 |
1.6 |
1.3-2.1 |
3.1 |
2.1-4.3 |
|
650 |
2 |
1.6-2.7 |
3.9 |
2.6-5.4 |
|
1000 |
3 |
2.4-4.0 |
5.9 |
3.9-8.1 |
|
2000 |
4.7 |
3.7-6.2 |
9.1 |
6.0-12.5 |
of changes in potentially damaging climate-related parameters and impacts, affecting many aspects of human society and the natural environment.
The magnitude of some near-term (next few decades and centuries) climate changes and impacts can be estimated for specific levels of global mean temperature change experienced, illustrating how stabilization at different levels of greenhouse gas forcing would be expected to alter our world (see Figure S.5). Approximate estimates of these effects, per degree C of global warming, include:
-
5-10% changes in precipitation in a number of regions
-
3-10% increases in heavy rainfall9
-
5-15% yield reductions of a number of crops10
-
5-10% changes in streamflow in many river basins worldwide, including several in the U.S.
-
about 15% and 25% decreases, in the extent of annually averaged and September Arctic sea ice, respectively
In addition, effects at particular levels of warming include:
-
Increases in the number of exceptionally warm summers (i.e., 9 out of 10 boreal summers that are “exceptionally warm” in nearly all land areas for about 3ºC of global warming, and every summer “exceptionally warm” in nearly all land areas for about 4ºC, where an “exceptionally warm” summer is defined as one that is warmer than all but about 1 of the 20 summers in the last decades of the 20th century).
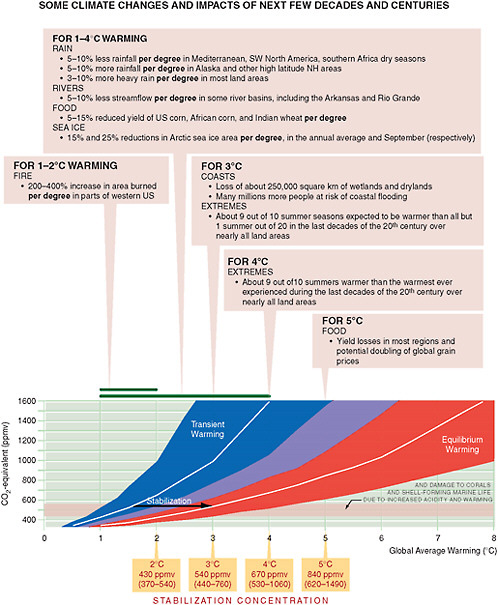
FIGURE S.5 Climate changes and climate impacts as a function of global warming (not in priority order or implied importance). These anticipated effects are projected to occur in the 21st century following the transient warming for a given CO2 equivalent concentration, followed by further warming to the equilibrium value for stabilization at a given target concentration. As in previous figures, for discussion of transient and equilibrium warming see Chapter 3, where it is noted that the probability distribution of climate sensitivity is uncertain; larger or smaller warmings than the estimated likely value for a given carbon dioxide equivalent concentration cannot be ruled out. Ranges are shown for climate impacts over the globe or over large regions; specific regions, crops, river basins, etc. and their uncertainties are discussed in detail later in the report. {3.2, 3.3, 4.2, 4.5, 4.6, 4.7, 4.8, 4.9, 5.1, 5.2, 5.3, 5.4, 5.7, 5.8}
-
200-400% increases per degree in wildfire area burned in several western North American regions for 1-2ºC
-
Increased coral bleaching and net erosion of coral reefs, due to warming and changes in ocean acidity (pH) for carbon dioxide levels corresponding to about 1.5-3ºC of global warming.
-
Sea level rise in the range of 0.5 to 1.0 m in 2100 (reached in a scenario corresponding to about 3±1ºC of global warming) and an associated increase in the number of people at risk from coastal flooding by 5-200 million11 as well as global wetland and dryland losses of more than 250,000 square kilometers. {4.1, 4.2, 4.5, 4.6, 4.7, 4.8, 4.9, 5.1, 5.2, 5.3, 5.4}
Many important impacts of climate change are difficult to quantify for a given change in global mean temperature, but the risk of adverse impacts is likely to increase with global mean temperature change.
For some impacts, this difficulty arises because temperature is a primary, but not necessarily the only, driver of change. Quantification can also be difficult due to uncertainty in observing and modeling the response of a given system to temperature changes or other climate and non-climate factors, and additional complexity due to the influence of multiple environmental and other anthropogenic factors. It is clear from many scientific studies documenting projected impacts across numerous sectors and regions, however, that a number of impacts do scale approximately with global temperature. Hence, these are expected to intensify in response to a greater temperature change. An illustrative set of temperature-dependent impacts are summarized in Figure S.6. These include shifts in terrestrial and marine species ranges and abundances (including die-off in some cases), increased risk of heat-related human health impacts, loss of infrastructure in coastal regions (due to sea level rise) and the Arctic (due to sea level rise, retreat of sea ice and associated coastal erosion, and permafrost loss). This summary of temperature-related impacts is intended to be indicative rather than comprehensive. Figure S.6 does not include all possible temperature-sensitive impacts, such as projected extinctions due to climate change and increased risks to national security. {4.7, 4.9, 5.5, 5.6, 5.7, 5.8}
Uncertainty in the cumulative carbon or stabilized carbon dioxide concentration that corresponds to a given temperature target is large. It follows
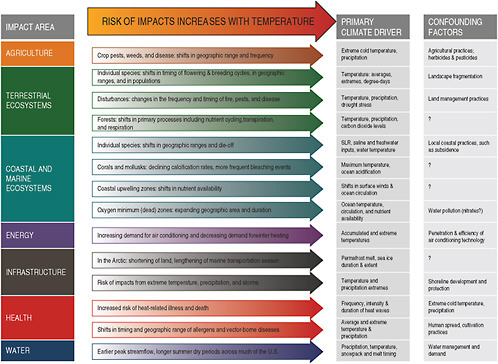
FIGURE S.6 Our understanding of the impacts of climate change is still evolving, and quantitative information is currently too limited to provide numerical estimates of the scale, scope, and timing of some impacts. This figure illustrates a number of such possible impacts along with their primary drivers, as well as available information on confounding factors. {2.4, 5.1-5.8}
that choices about stabilization targets depend upon judgments regarding the degree of acceptable risk.
The likely range of cumulative carbon emissions corresponding to a given warming level is estimated to lie between –30% to +40% of the best estimate. This range is due mainly to uncertainties in the carbon cycle response to emissions and the climate response to increased radiative forcing. For a cumulative anthropogenic emission of 1,000 GtC, our best estimate of the warming remains below 2ºC, but there is an estimated 17% probability that the warming could exceed 2ºC for more than 1,500 years. When cumulative emissions are increased to 1,500 GtC, the best estimate of the anthropogenic warming remains above 2ºC for more than 3,500 years, and the very likely upper end warming is still above 2.5ºC for more than 10,000 years. Higher values cannot be excluded, implying additional risk that cannot presently be quantified. On the other hand, at the lower end of carbon-climate likely uncertainty range, there may be about a 17% chance that warming could remain below 2ºC even if as much as 1,700 GtC are emitted. Figures S.3 and S.5 provide some scientific reasons why global warming of a few degrees could be considered dangerous to some aspects of nature and society, but the corresponding uncertainty ranges should be emphasized here. For example, while the best estimate of a stabilization target corresponding to a long-term warming of 2ºC is 430 ppm, the likely uncertainty range for this value spans from 380 ppm (below current observed levels) to 540 ppm (almost a doubling of carbon dioxide relative to pre-industrial times). {3.4, 6.1}
Many important aspects of climate change and its impacts are expected to be approximately linear and gradual, slowly becoming larger and more significant relative to climate variability as global warming increases.
This report highlights the importance of 21st century choices regarding stabilization targets and how they can be expected to affect many aspects of Earth’s future. Progressively warmer temperatures are expected to slowly lead to larger and more significant changes for impacts including wildfire extent, decreases in yields of some (but not all) crops, streamflow changes, decreased Arctic sea ice extent, increases in heavy rainfall occurrence, and other factors presented. However, it should be noted that many climate changes and impacts remain poorly understood at present. For example, the record of past climates suggests that major changes such as dieback of the Amazon forests or substantial changes in El Niño behavior can occur. This report identifies some areas where recent science suggests reduced effects compared to earlier studies (including e.g., projected future changes in
hurricane activity). This report does not identify any specific projections of abrupt climate changes that the committee considers to be robustly established, e.g., based on clear physical understanding of processes and multiple models. However, it is clear that the risk of surprises can be expected to increase with the duration and magnitude of the warming. Finally, this report shows throughout that present emissions represent commitments to growing current and future impacts, including the very long-term future over many thousands of years. {2.4, 3.4, 4.3, 4.4, 5.8, 6.1, 6.2}


