
10
Global Biogeography of Microbial Nitrogen-Cycling Traits in Soil
MICHAELINE B. NELSON,* ADAM C. MARTINY,*† AND JENNIFER B. H. MARTINY*‡
Microorganisms drive much of the Earth’s nitrogen (N) cycle, but we still lack a global overview of the abundance and composition of the microorganisms carrying out soil N processes. To address this gap, we characterized the biogeography of microbial N traits, defined as eight N-cycling pathways, using publicly available soil metagenomes. The relative frequency of N pathways varied consistently across soils, such that the frequencies of the individual N pathways were positively correlated across the soil samples. Habitat type, soil carbon, and soil N largely explained the total N pathway frequency in a sample. In contrast, we could not identify major drivers of the taxonomic composition of the N functional groups. Further, the dominant genera encoding a pathway were generally similar among habitat types. The soil samples also revealed an unexpectedly high frequency of bacteria carrying the pathways required for dissimilatory nitrate reduction to ammonium, a little-studied N process in soil. Finally, phylogenetic analysis showed that some microbial groups seem to be N-cycling specialists or generalists. For instance, taxa within the Deltaproteobacteria encoded all eight N pathways, whereas those within the Cyanobacteria primarily encoded three pathways. Overall, this trait-based approach provides a baseline for investigating the relationship between microbial diversity and N cycling across global soils.
__________________
* Department of Ecology and Evolutionary Biology, University of California, Irvine, CA 92697; and †Department of Earth System Science, University of California, Irvine, CA 92697. ‡To whom correspondence should be addressed. Email: jmartiny@uci.edu.
A grand challenge for this century is to predict how environmental change will alter global biogeochemical cycles. The field of biogeography has an important role to play in this effort (Violle et al., 2014). Environmental change is altering the distribution of biodiversity, which in turn is a key driver of biogeochemical processes (Naeem and Wright, 2003; Cardinale et al., 2012). Historically, biogeography has viewed biodiversity through a taxonomic lens, primarily resolving species distributions. However, a focus on traits—particularly those involved in ecosystem processes—may offer a clearer link between biodiversity patterns and biogeochemistry (Diaz and Cabido, 2001; McGill et al., 2006; Reichstein et al., 2014).
These ideas are particularly relevant for microorganisms. Microbes catalyze most of the biological transformations of the major elements of life (Falkowski et al., 2008), and because of their sheer abundance they account for a large pool of elements in living matter (Whitman et al., 1998). Furthermore, like plants and animals, microbial taxonomic composition varies over space (Martiny et al., 2006; Fierer et al., 2012), and this variation can influence ecosystem processes (van der Heijden et al., 2008; Strickland et al., 2009; Schimel and Schaeffer, 2012; Reed and Martiny, 2013). Thus, a consideration of microbial traits should improve efforts to connect biogeographic patterns and ecosystem processes (Green JL et al., 2008).
Here, we provide a first characterization of the global biogeographic patterns of microbial nitrogen (N) cycling traits in soil. Microbially driven transformations regulate biologically available N through exchange with the atmosphere (via N fixation and denitrification) and loss by nitrate leaching. They also influence the forms of N available for plant uptake. At the same time, human activities have altered, and continue to alter, the N cycle by increasing the amount of reactive N in the biosphere (Vitousek et al., 1997; Fowler et al., 2013). At local scales, N addition consistently shifts microbial composition in soils and other ecosystems (Allison and Martiny, 2008; Ramirez et al., 2012). The distribution of microbial traits might therefore be relevant for understanding current and future N cycling.
The taxonomic composition of soil microorganisms is correlated with spatial variation in climate, plant diversity, pH, disturbance, and many other factors (Lauber et al., 2009; Philippot et al., 2009; Tedersoo et al., 2014; Prober et al., 2015). These biogeographic patterns help to identify factors that select on the entire suite of microbial traits. In this study, we reverse this direction of inquiry. We first characterize the patterns and drivers of just a handful of traits associated with N cycling and then ask which taxa comprise these functional groups.
To quantify the abundance and composition of N-cycling traits, we analyzed ~2.4 billion short-read sequences from 365 soil metagenomes sampled from around the globe. From this dataset, we identified sequences
that indicate the potential for a microorganism to perform one of eight N pathways that convert inorganic N to other inorganic forms or microbial biomass. We then quantified the frequency and taxonomic association of microorganisms carrying these pathways in each sample. If a gene from a pathway was detected, we assumed the presence of the entire pathway in the organism. To compare the frequencies among the N pathways, we standardized for the number of genes (2–20) in each pathway. Although metagenomic sequences provide a measure of a community’s trait diversity (Barberán et al., 2012), the presence of a trait does not indicate how it is being used in the community. Thus, we cannot determine whether genes in the N pathways are expressed or the rate at which N is being transformed. However, assaying traits based on metagenomic sequences are parallel to other trait metrics used to describe an organism’s functional potential, such as nutrient uptake affinity or temperature optimum for growth.
The global N trait dataset allowed us to address four main questions. First, what are the overall frequencies of the different N pathways in soil? We expected the frequencies to vary greatly by pathway. Indeed, the ability to perform nitrification is restricted to few microbial taxa, whereas ammonia assimilation is probably present in almost all taxa. Second, what drives variation in the frequencies of N pathways among soil samples? We hypothesized that N pathway frequencies would vary primarily by habitat type, which reflects major differences in plant communities and therefore N inputs into soils. Third, what are the main taxa encoding each N pathway? Surprisingly little is known about the dominant lineages encoding N-cycling traits across global soils. We therefore expected to find previously unrecognized, prominent players, particularly for the less-studied pathways such as dissimilatory nitrate to ammonium (DNRA). Finally, what underlies compositional variation among soil samples in microorganisms encoding N pathways? We hypothesized that the taxa responsible for each pathway would vary greatly by habitat type, because the habitat would select for specialized taxa. We further predicted that soil pH—previously identified as an important driver of soil composition (Rousk et al., 2010; Tsiknia et al., 2015)—would also influence compositional variation within microorganisms encoding N-cycling traits.
RESULTS
Metagenomic data from surface soil samples were retrieved from the metagenomics analysis server (MG-RAST) (Meyer et al., 2008). After curating the samples for sequence and metadata quality, the final 365 samples represented 118 unique locations from 10 distinct habitat types covering natural and human-dominated systems (Fig. 10.1 and
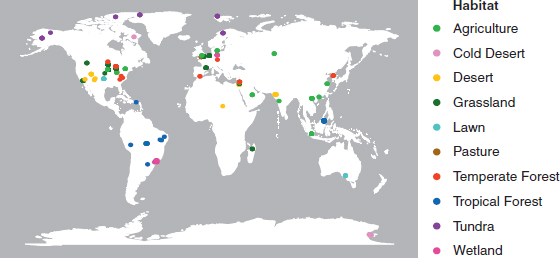
Dataset S11). Sequencing depth varied greatly among the samples but was not overtly biased toward any particular habitat type (Fig. S1). To standardize for sequencing depth, we report the abundance of each N pathway as its frequency in a sample. The trends observed were similar whether pathway frequency was normalized as the number detected per annotated sequence or per marker gene (based on 30 conserved, single-copy genes) (Fig. S1).
Bacteria dominated the metagenomic libraries, comprising 95% of all sequences, followed by 3% for Fungi and only 2% for Archaea. The fraction of fungal sequences in metagenomic libraries is known to be lower than their contribution to soil microbial biomass (Fierer et al., 2012). We therefore concentrate our analyses on Bacteria and Archaea and report only general trends for Fungi. For instance, the proportion of total sequences of Bacteria, Archaea, and Fungi varied across habitat type (G-test of independence; P << 0.001) (Fig. S2). Archaea ranged from 0.9 to 11% of all sequences by habitat, with the highest percentage detected in deserts. The ratio of fungal to bacterial sequences was particularly high in temperate forest soil, as previously observed (Fierer et al., 2009).
__________________
1 Supporting information for this chapter, which includes Dataset S1, Figs. S1 through S6, and Table S1, is available online at www.pnas.org/lookup/suppl/doi:10.1073/pnas.1601070113/-/DCSupplemental.
Frequency of Soil N Pathways
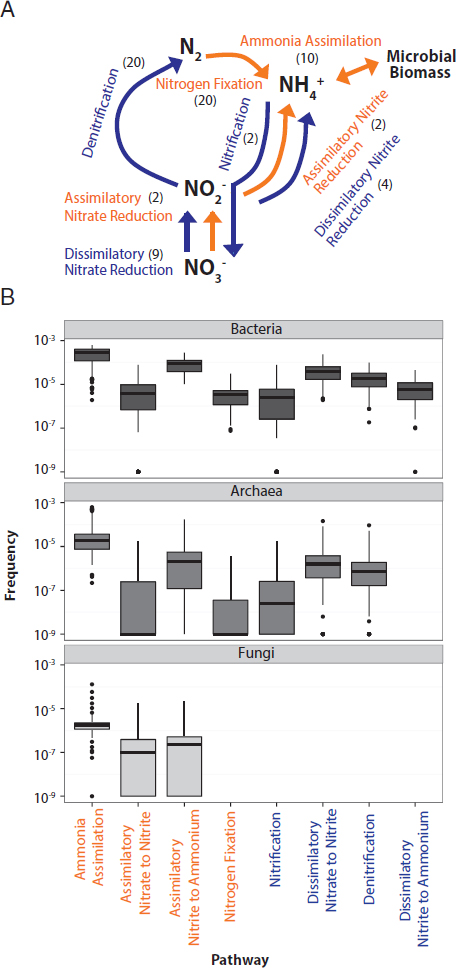
On average, 0.5% of all annotated sequences in a soil sample were associated with one of the eight N pathways (Fig. 10.2A), or an average of 3.3 and 4.7 N pathways per marker gene for Bacteria and Archaea, respectively. The frequency of the individual pathways varied by several orders of magnitude (one-way ANOVA P < 0.001; F = 74.21, df = 7) (Fig. 10.2B). Bacteria and Archaea displayed similar trends in their relative frequency of N pathways except for the absence of the dissimilatory nitrite reduction to ammonium pathway in Archaea. Fungal sequences were only associated with assimilatory pathways, including ammonia assimilation, assimilatory nitrate to nitrite, and assimilatory nitrite to ammonium.
Across all domains, the most common pathway was ammonia assimilation (Fig. 10.2B). For instance, among the Bacteria, an average of 280 ammonia assimilation pathways was detected for every million annotated bacterial sequences. In comparison, nitrification and N fixation were the least common pathways and detected only 6.1 and 4.6 times per million sequences, respectively. Notably, the relatively unstudied dissimilatory nitrite reduction to ammonium pathway was slightly more common than these two pathways, detected on average 9.3 times per million sequences.
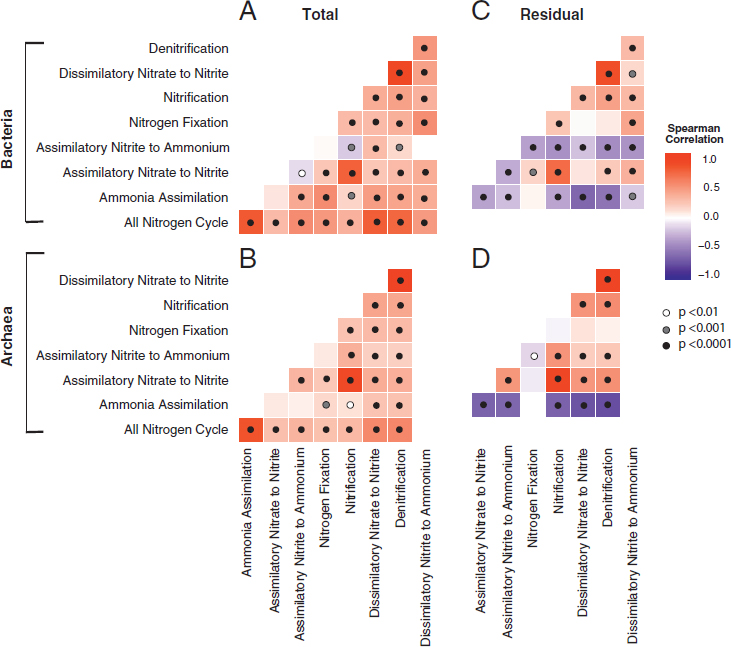
Across all soil samples, N pathway frequencies were overwhelmingly positively correlated for both the Bacteria and Archaea (Fig. 10.3A and B). To examine differences in pathways beyond the trends shared by all, we calculated the residuals of the frequency of each pathway regressed against the frequency of all N pathways in a sample. This residual variation was also significantly correlated among many of the N pathways (Fig. 10.3C and D). For instance, denitrification was highly positively correlated with dissimilatory nitrate reduction to nitrite within both Bacteria and Archaea (R2 = 0.86 and 0.97, respectively; P ≤ 0.001). This relationship is expected, because dissimilatory nitrate reduction to nitrite is the first step of the complete denitrification process; however, we separated the two steps here, because nitrate reduction to nitrate is also the first step in DNRA (Yoon et al., 2015). Similarly, we separated DNRA into its two pathways: dissimilatory nitrate reduction to nitrite and dissimilatory nitrite reduction to ammonium (Fig. 10.2A). Among Bacteria, the assimilatory nitrite to ammonium pathway residual was negatively correlated with all other pathways. Likewise, the residual frequency of the ammonia assimilation pathway was negatively correlated with all other N pathways in both Bacteria and Archaea. N fixation generally showed weak or no correlation with other pathways.
Drivers of N Pathway Frequencies
The frequency of all N-cycling traits (summing across all pathways) varied greatly among soil samples, and initial analyses revealed broad biogeographic patterns. On average, the highest frequencies of total N pathways were detected in tropical forest and human-dominated (pasture, lawn, and agriculture) soils, whereas the lowest frequency was observed in cold deserts (Fig. S3). Total N pathway frequency also tended to decrease with increasing latitude (R2 = 0.22, P < 0.05; Fig. S4).
To disentangle the drivers behind these patterns, we performed a multivariate regression analysis including habitat type and environmental
parameters known to influence microbial abundance and composition (Fierer and Jackson, 2006; Bru et al., 2011). Local measurements were not available for most samples; instead, we estimated these variables from secondary sources. For Bacteria, the regression model explained a large and significant proportion of the variability in the frequency of total N pathways (R2 = 0.58, P < 0.001; Table 10.1). Habitat type contributed most to this model, both directly (positively related to total N pathways) and through interactions with soil carbon and N. The regression model for Archaea explained less variability in total N pathway frequency than for Bacteria (R2 = 0.43, P < 0.001; Table 10.1). An interactive effect between carbon and N contributed the most to the model, and habitat was only important through an interactive effect with temperature.
We next examined the drivers of individual N pathway frequencies. Due to high covariance between pathways (Fig. 10.3A and B), we fitted regression models to the total-frequency-corrected residuals for each pathway. These models varied greatly in their ability to explain this additional variation (Table 10.1). For example, the models for the N fixation pathway explained 80% and 63% of the variation among samples in Bacteria and Archaea, respectively (P < 0.001). In contrast, the same parameters did not explain any variation in the frequency of the dissimilatory nitrite reduction to ammonium pathway in Bacteria.
Among the significant models, habitat type was an important predictor of the individual pathway frequencies (Table 10.1). Habitat also interacted with other factors including precipitation, temperature, and soil N to influence the frequency of some pathways. For instance, denitrification frequency increased with temperature in deserts but decreased with temperature in tropical forests. Similarly, ammonia assimilation frequency increased with soil N in temperate forests but decreased with soil N in tropical forests. Soil carbon, which seemed to be a primary driver of total N pathway frequency, did not explain differences in the frequency of individual pathways in Bacteria. Including estimates of N deposition in these models only improved the denitrification model (R2 increased from 0.41 to 0.48); denitrification frequency increased with increasing N deposition.
The models for individual pathway frequencies in Archaea generally explained less variation than those for Bacteria, perhaps due to the lower number of sequences per sample (Dataset S1). However, for the significant models, the individual N pathways were often best explained by the same parameters as the Bacteria. For instance, habitat type and habitat by temperature were the most important predictors of N fixation frequency within both domains. Likewise, habitat, habitat by precipitation, and habitat by temperature contributed to the variation in assimilatory nitrate to nitrite frequency in both Archaea and Bacteria.
Taxonomic and Phylogenetic Distribution of N Pathways
A diverse range of microorganisms, encompassing 402 bacterial and 53 archaeal genera, encoded the N pathways. We first investigated the association of pathways within the same genera (Fig. 10.4 and Fig. S5). All genera for which we detected over 10 sequences carried the ammonia assimilation pathway. Genera carrying the pathway to complete the second half of denitrification also generally carried the first half of the pathway, dissimilatory nitrate to nitrite reduction. The same genera carrying these denitrification pathways sometimes, but not always, carried the dissimilatory nitrite reduction to ammonium pathway, or the second part of the complete DNRA process (Fig. 10.4 and Fig. S5). Some genera within the Gamma-, Delta-, and Epsilonproteobacteria (e.g., Edwardsiella, Wolinella, and Anaeromyxobacter) contained all three pathways. Indeed, denitrification and DNRA has recently been shown to be present and functional in the same bacteria (Mania et al., 2014; Yoon et al., 2015). We also detected genera that only carried the dissimilatory nitrite to ammonium pathway (in addition to ammonia assimilation), as was the case for five genera within the phylum Bacteriodetes.
More broadly, soil genera, and the phyla they fall into, varied in their degree of pathway specialization. Genera within the Cyanobacteria seemed to be specialists, carrying primarily the assimilatory nitrite to ammonium and N fixation pathways. In contrast, genera within the Deltaproteobacteria seemed to be N-cycling generalists, harboring up to six pathways (in addition to ammonia assimilation). Note, however, that these patterns do not distinguish between whether these genera are made up of generalists that encode many pathways or multiple specialists that encode specific pathways.
Focusing on each pathway individually revealed the most prominent taxa carrying the pathway across all soil samples. Here we consider two contrasting pathways, both in terms of their taxonomic distribution and the degree to which they have been studied. First, the abundance of the N fixation pathway in the soil samples was distributed broadly among both Archaea and Bacteria (Fig. 10.4 and Fig. S5). The most abundant N fixers detected were concentrated within the phylum Proteobacteria, with notable exceptions among the Chlorobi, Firmicutes, and Cyanobacteria (Fig. 10.5A). Most sequences were closely related to N-fixing genera that might be predicted to be common in soil, such as Bradyrhizobium and Burkholderia. Other abundant genera were less expected. For example, Azoarcus is an organism studied for its abilities to degrade soil contaminants (Sun and Cupples, 2012), and Pectobacterium (Gammaproteobacteria) is known primarily as a plant pathogen (Ma et al., 2007). Indeed, although it is known that Pectobacterium encodes the suite of N fixation genes, it remains unclear whether they are functional (Toth et al., 2015).
TABLE 10.1 Variation Explained by the Environmental Variables in the Regression Models of the Frequency of All (Total) and Individual N Pathways
| Environmental Variables | Individual Pathways (Residuals) | |||
|---|---|---|---|---|
| Total | Ammonia Assimilation | Assimilatory Nitrate to Nitrite | Assimilatory Nitrite to Ammonia | |
| Bacteria | ||||
|
Habitat (H) |
0.14 | 0.02 | 0.23 | 0.07 |
|
Precipitation (P) |
<0.01 | |||
|
Temperature (T) |
<0.01 | |||
|
pH |
||||
|
Organic Carbon (C) |
0.12 | |||
|
Total N |
0.05 | |||
|
H × P |
<0.01 | 0.07 | ||
|
H × T |
0.09 | 0.23 | ||
|
H × pH |
<0.01 | 0.09 | ||
|
H × C |
0.1 | |||
|
H × N |
0.17 | 0.49 | 0.06 | |
|
P × T |
0.02 | |||
|
C × N |
||||
| Adjusted R2 | 0.58 | 0.51 | 0.5 | 0.36 |
| Archaea | ||||
|
Habitat |
0.08 | |||
|
Precipitation |
||||
|
Temperature |
||||
|
pH |
||||
|
Organic Carbon |
||||
|
Total N |
0.05 | |||
|
H × P |
0.21 | |||
|
H × T |
0.09 | 0.18 | ||
|
H × pH |
||||
|
H × C |
||||
|
H × N |
||||
|
P × T |
||||
|
C × N |
0.34 | |||
| Adjusted R2 | 0.43 | NS | 0.52 | NS |
NOTES: The models for the individual pathways are based on the residual frequencies of the pathway after correcting for the Total N pathway frequency (see text). Estimates of the fraction of explained variation are only reported for significant variables (P < 0.05). Samples were only included when all environmental variables could be obtained for that location (n = 99). NA, not assessed; NS, not statistically significant.
| N Fixation | Nitrification | Dissimilatory Nitrite to Nitrite | Denitrification | Dissimilatory Nitrate to Ammonia |
|---|---|---|---|---|
| 0.29 | 0.11 | 0.06 | 0.09 | |
| 0.02 | 0.02 | |||
| <0.01 | ||||
| 0.13 | ||||
| 0.08 | 0.32 | |||
| 0.31 | 0.21 | 0.03 | 0.31 | |
| 0.05 | ||||
| 0.05 | <0.01 | |||
| <0.01 | ||||
| 0.8 | 0.45 | 0.41 | 0.41 | NS |
| 0.09 | 0.03 | 0.12 | ||
| <0.01 | ||||
| 0.02 | 0.03 | |||
| <0.01 | ||||
| 0.04 | ||||
| 0.09 | ||||
| 0.33 | 0.13 | |||
| 0.12 | 0.06 | |||
| 0.63 | 0.22 | NS | 0.21 | NA |
Second, the pathway encoding dissimilatory nitrite reduction to ammonium was also broadly distributed across soil bacteria (Fig. 10.4), as noted before (Welsh et al., 2014). However, the dominant soil taxa were restricted to two phyla, the Deltaproteobacteria and Verrucomicrobia (Fig. 10.5B). Verrucomicrobia are known to be abundant in soils, but their ecological role remains unclear (Bergmann et al., 2011; Fierer et al.,
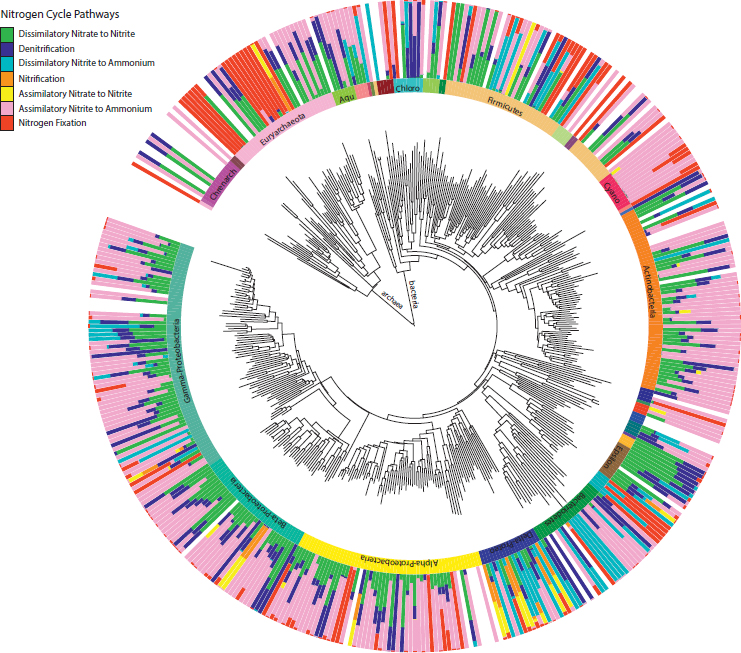
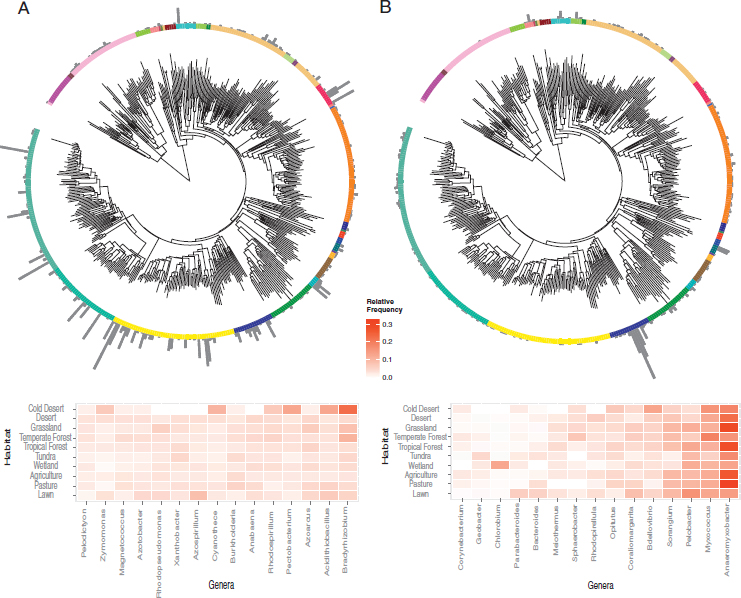
2013). The pathway’s most abundant genus, Anaeromyxobacter (phylum Deltaproteobacteria), is common in agricultural soil and has recently been shown to carry out a previously unrecognized process of nondenitrifying N2O reduction to N2 (Sanford et al., 2012). The relative abundances of genera encoding the other six N pathways in the soil samples are reported in Fig. S6.
Drivers of Taxonomic Composition by N Pathway
The same environmental variables that explained the overall frequency of the N pathways well explained much less of the variation in the taxonomic composition of the organisms encoding the pathways. For the eight pathways, the models only explained 7–19% of the composition variation of the individual N pathways (Table S1). However, as for pathway frequency, habitat type was the best predictor of composition, explaining up to 14% of the compositional variation in the assimilatory nitrite to ammonium pathway. Temperature also explained 11% of the compositional variation for the nitrification pathway. All other predictors, including pH, explained at most 3% of the variation for any pathway.
A closer examination of two pathways confirms weak compositional differences between the habitats. The 15 most abundant genera carrying the N fixation pathway were similarly abundant across all habitats except in cold deserts (Fig. 10.5A). The most abundant genera encoding the dissimilatory nitrite reduction to ammonium pathway displayed greater variability among habitats (confirming the model results in Table S1), but of these only one genus (Chlorobium) seemed specialized on a habitat (wetland) (Fig. 10.5B).
DISCUSSION
Here, we used metagenomic data to characterize the biogeographic patterns of microbial N cycling traits in soil. The advantage of this approach is that it allows us to identify the traits—and the organisms harboring them—involved in many key functions at once. Specifically, the analysis provides a comprehensive map of the dominant lineages involved in eight N processes. The approach also allowed us to search all known genes in a pathway, while avoiding primer biases toward particular lineages (Myrold et al., 2014).
The overall structure of microbial N traits—the relative frequency of the eight pathways—seems to be quite consistent across soils. This is not unexpected but had not been previously tested. For instance, the ammonia assimilation pathway was relatively common, and the pathways for N fixation and nitrification were relatively rare, as observed previously in soil and other environments (Varin et al., 2010; Martiny et al., 2013; Quinn et al., 2014; Souza et al., 2015). Less expected, however, was that N pathway frequencies within a soil sample were overwhelmingly positively correlated (Fig. 10.3). This result suggests that soil communities with high numbers of cells able to use one N pathway also generally support higher numbers of cells that can use other N pathways. Greater numbers of metagenomic sequences associated with nutrient cycles have previously been interpreted to be indicative of faster nutrient cycling rates
(Fierer et al., 2012). The positive correlations between pathways within the N cycle would seem to support this hypothesis. We also found a high frequency of Bacteria encoding the dissimilatory nitrite reduction to ammonium pathway, which leads to recycling of N in soils. The balance between DNRA and denitrification, which leads to the loss of N to the atmosphere, is thought to be key to soil N budgets. Our results confirm previous studies suggesting that this pathway may be more common than previously thought (Rutting et al., 2011; Nelson et al., 2015), but the taxa encoding the process in soil environments remain to be carefully characterized (Kraft et al., 2011).
The frequency of N traits further displayed clear biogeographic patterns. At the broadest scale, N trait frequency in Bacteria tended to decrease at higher latitudes, perhaps reflecting a general trend in N limitation in high-latitude ecosystems (Yergeau et al., 2007). Beyond latitude, the frequency of N cycling traits in soil communities depended largely on habitat type as well as soil carbon and N concentrations. N traits were highest in human-dominated habitats, where N inputs tend to be high, and tropical forests, which are generally thought to be less limited by N than temperate ecosystems (Vitousek, 1984). In contrast, N traits were lowest in cold deserts (Antarctic and Arctic), which are highly nutrient-limited (Jonasson et al., 1999; Yergeau et al., 2007). However, given the low sample numbers for some habitat types, it will be important to retest these patterns as more data accumulate.
Contrary to our hypothesis, the taxa responsible for each N pathway did not vary greatly by habitat type. Within a pathway, genera that were dominant in one habitat tended to be dominant in all habitats. More generally, the environmental variables in our analyses were poor predictors of the compositional variation of the N functional groups. One possible reason for this result is that environmental preferences are conserved below the genus level and therefore would not be detected by our analysis. However, this reasoning does not explain why soil pH seems to have little influence on composition, because pH preference seems to be conserved at a broader taxonomic level (Lauber et al., 2009; Martiny et al., 2015). Perhaps N functional groups are less specialized for a particular pH environment than microorganisms with other functional roles, but distinct pH-associated lineages in ammonia-oxidizing Archaea indicate that this is not always the case (Gubry-Rangin et al., 2011). Alternatively, the estimates of soil pH might have been too spatially coarse to detect a pattern.
A well-recognized issue in calculating the frequencies of genes or pathways from metagenomic data is how to normalize for overall genome abundance in the library (Manor and Borenstein, 2015). This normalization step is prone to uncertainties related to variation in mean genome size among communities. To address this issue, we estimated the frequencies
of N pathways in two ways: using a set of conserved marker genes as well as the total number of annotated sequences within a domain. The first approach should be sensitive to differences in genome size, whereas the second approach includes more sequence reads and is thus more statistically robust. Because the two approaches led to similar findings, we conclude that the overall patterns in N pathway frequencies are likely not an artifact of normalization.
In sum, this study provides a foundation for future trait-based investigations of soil N cycling but also highlights two major challenges. First, we still know very little about how variability in the frequency and composition of microbial N traits will affect process rates in soil environments (Prosser, 2015). Indeed, a recent review found little correlation between an individual gene’s abundance and the process rates that such genes encode. However, assessment of these links using metagenomic datasets is still needed (Rocca et al., 2015). Second, assigning function and taxonomy from short-read sequences is limited by genomic databases where annotations in some cases may be sparse and/or erroneous (Wu et al., 2009; Thomas et al., 2012). The N cycle is an archetype of this problem, because new N processes and lineages continue to be identified (Strous et al., 1999; Könneke et al., 2005; Farnelid et al., 2011; Sanford et al., 2012; van Kessel et al., 2015). Despite these challenges, the application of metagenomic data to a trait-based framework offers a powerful avenue for elucidating the role that microbial communities play in regulating biogeochemical processes (Barberán et al., 2012; Fierer et al., 2014).
MATERIALS AND METHODS
Dataset and Curation
Metagenomic samples (sequencing type “whole genome sequencing” and environmental package “soil,” n = 809) in the MG-RAST database (Meyer et al., 2008) were classified into one of 10 habitat types (desert, cold desert, grassland, temperate forest, tropical forest, tundra, wetland, agriculture, pasture, and lawn). Samples that could not be classified into these habitats (e.g., oil spill, mines, and microbial mats) were not considered further.
Global Positioning System coordinates and sample date associated with each metagenome identification were downloaded from MG-RAST via the R package matR (R Core Team, 2011; Braithwaite and Keegan, 2013). To minimize the problem of pseudoreplication, we only considered samples from one date per location (the date with the most samples). Based on the statistics provided by MG-RAST, we further removed samples if (i) the number of uploaded sequences was equal to the number of post-QC
sequences, which seemed to indicate a preprocessing step; (ii) the number of identified protein features was <10,000; or (iii) the total bacterial reads was <10,000. The remaining metagenomic libraries (n = 365) encompassed 118 unique locations. These were downloaded using the MG-RAST API version 3.2 with KEGG database annotations. Each sequence was assigned to the closest related genus in the database using an e-value of ≤10–5.
Data Standardization Across Metagenomic Libraries
Because sequencing effort varied greatly among samples, we standardized the bacterial and archaeal sequences by a suite of conserved, single-copy (i.e., marker) genes to control for possible variation in average genome size among samples (Nayfach and Pollard, 2015) (Fig. S1). The Kegg orthology numbers for 30 Bacteria and Archaea marker genes (Nayfach and Pollard, 2015) were matched to MD5 IDs using the non-redundant M5nr database. We then searched for these MD5 IDs in the samples annotated by the MG-RAST server.
The number of marker genes was also highly correlated with the total number of annotated sequences in a sample (R2 = 0.86; Fig. S1). Thus, when comparing across Archaea, Bacteria, and Fungi, we standardized the samples by total annotated sequences. Sequencing effort varied greatly among the samples but was not overtly biased toward any particular habitat type (Fig. S1).
Identification of N Cycle Pathways
In each metagenomic library, we searched for sequences from eight N pathways, defined previously in Nelson et al. (2015). These pathways included nitrification (number of genes targeted: n = 2), N fixation (n = 20), denitrification (n = 20), dissimilatory nitrate to nitrite reduction (n = 9), dissimilatory nitrite to ammonia reduction (n = 4), assimilatory nitrate to nitrite reduction (n = 2), assimilatory nitrite to ammonia reduction (n = 2), and ammonia assimilation (n = 10) (Fig. 10.2A). If a gene from a pathway was detected, we assumed the presence of the entire pathway.
Environmental Metadata
Environmental data were retrieved from a variety of publically available sources. In all cases, gridded spatial data files were downloaded, and data were extracted using the R packages raster, rdgal, and sp (Hijmans and van Etten, 2012; Bivand et al., 2013). The data included average precipitation (millimeters) and temperature (degrees Celsius) from the month of sampling (Hijmans et al., 2005), soil pH (Batjes, 2000), total organic
carbon (kilograms per square meter) (Batjes, 2000), total organic N (grams per square meter) (Group GSDT, 2000), and N deposition (milligrams of N per square meter per year) (Dentener et al., 2006). Approximate data grid resolution for precipitation and temperature was 0.01°, for soil pH and organic carbon was 0.5°, for total organic N was 0.1°, and for N deposition was 4.0°. Environmental metadata were assigned to each sample using the associated latitude and longitude coordinates. Where data were categorized into ranges (soil pH and total organic carbon), the average value from the range was used.
Statistical Analyses
To compare the relative abundance of N pathways across samples, we calculated the frequency of each pathway in a sample for both the Bacteria and Archaea. This frequency is the estimated number of times the pathway was detected per marker gene detected, or [number of pathway reads/ number of pathway genes searched]/[number of marker gene reads/30]. Thus, a pathway’s frequency of detection was also standardized for the number of genes in the pathway.
To test for differences in the frequency across pathways, we used a one-way analysis of variance, using the aov function in R. To test for correlations between the frequencies of the individual pathways within a sample, we used Spearman’s correlation coefficient. To calculate the total N pathway frequency of each sample, we summed the frequency of all eight pathways. We used lm in R to calculate the residuals of each N pathway against a sample’s total N pathway frequency.
To tease apart the relative importance of environmental variables on the frequency of N pathways, we used a multiple regression model (lm function in R) including the following variables: habitat type, temperature, precipitation, soil pH, organic carbon, and total N. For this analysis, we averaged data across multiple samples from the same location at just one sampling time, yielding 118 datasets. Based on a priori expectations (Ramette, 2007), we also included the following interaction terms: habitat by temperature, habitat by precipitation, habitat by soil pH, habitat by organic carbon, habitat by total N, precipitation by temperature, and organic carbon by total N. To determine the relative importance of the various significant environmental factors from our model in contributing to variation in the frequency of N pathways across samples, we used a backward selection procedure (Mac Nally, 2002; Ramette, 2007). Starting with the significant terms (P < 0.01) from our original model, we removed variables one at a time; the differences in R2 values between each step were used to calculate the relative importance of the independent variable removed from the model. If there was no change or only a marginal
change in R2 when the term was removed, the term was assigned a relative importance of <0.01. After the initial analysis, N deposition was added to test whether this parameter improved the model.
To analyze the composition within each pathway, we calculated the proportional abundance of the genera in a sample and averaged these proportions across multiple samples from the same location. We then calculated a Bray–Curtis distance matrix for all sample locations. We used a distance-based linear model [DISTLM; PRIMER v6; PERMANOVA++ (Clarke and Warwick, 2001; Anderson et al., 2008)] to test the significance and importance (an estimate of the proportion of R2 explained) of the predictor variables for each pathway’s composition, using a forward selection procedure.
Phylogenetic Visualization
We constructed a phylogenetic tree including a representative species from all genera encoding N sequences using 16S rRNA amplicon data (chosen for their sequence quality and length of ~1,400 bp) from the SILVA database (Quast et al., 2013). We aligned the sequences using SINA (Pruesse et al., 2012) and created a neighbor-joining tree with the default parameters in Geneious v9.0.5. We used the Interactive Tree of Life (iTOL) (Letunic and Bork, 2007) to plot (i) the proportion of N pathways (excluding ammonia assimilation) detected within each genus and (ii) the relative abundance of genera encoding each individual pathway across the unique sampling locations (n = 118). For the N fixation and dissimilatory nitrate reduction pathways, we used the ggplot2 package (Wickham, 2009) in R to plot heat maps of the relative frequencies of the 15 most abundant genera by habitat.
ACKNOWLEDGMENTS
We thank John Avise, Francisco Ayala, and Brian Bowen for the invitation to participate in this colloquium and Alex Chase for helpful feedback on earlier drafts of the manuscript. This work was supported by a U.S. Department of Education Graduate Assistance in Areas of National Need Fellowship (to M.B.N.) and U.S. Department of Energy, Office of Science, Office of Biological and Environmental Research Grant DE-PS02-09ER09-25.


