
3
Inferring Responses to Climate Dynamics from Historical Demography in Neotropical Forest Lizards
IVAN PRATES,*†** ALEXANDER T. XUE,*†JASON L. BROWN,*‡DIEGO F. ALVARADO-SERRANO,*§MIGUEL T. RODRIGUES,||MICHAEL J. HICKERSON,*†# AND ANA C. CARNAVAL*†
We apply a comparative framework to test for concerted demographic changes in response to climate shifts in the Neotropical lowland forests, learning from the past to inform projections of the future. Using reduced genomic (SNP) data from three lizard species codistributed in Amazonia and the Atlantic Forest (Anolis punctatus, Anolis ortonii, and Polychrus marmoratus), we first reconstruct former population history and test for assemblage-level responses to cycles of moisture transport recently implicated in changes of forest distribution during the Late Quaternary. We find support for population shifts within the time frame of inferred precipitation fluctuations (the last 250,000 years) but detect idiosyncratic responses across species and uniformity of within-species responses across forest regions. These results are incongruent with expectations of concerted population expansion in response to increased rainfall and fail to detect out-of-phase demographic syndromes (expansions vs. contractions) across forest regions. Using reduced genomic data to infer
__________________
* Department of Biology, City College of New York, New York, NY 10031; †Department of Biology, Graduate Center, City University of New York, New York, NY 10016; ‡Cooperative Wildlife Research Laboratory, Department of Zoology, Southern Illinois University, Carbon-dale, IL 62901; §Department of Ecology and Evolutionary Biology, University of Michigan, Ann Arbor, MI 48109; ||Departamento de Zoologia, Instituto de Biociências, Universidade de São Paulo, São Paulo, SP 05508-090, Brazil; and #Division of Invertebrate Zoology, American Museum of Natural History, New York, NY 10024. **To whom correspondence should be addressed. Email: ivanprates@gmail.com.
species-specific demographical parameters, we then model the plausible spatial distribution of genetic diversity in the Atlantic Forest into future climates (2080) under a medium carbon emission trajectory. The models forecast very distinct trajectories for the lizard species, reflecting unique estimated population densities and dispersal abilities. Ecological and demographic constraints seemingly lead to distinct and asynchronous responses to climatic regimes in the tropics, even among similarly distributed taxa. Incorporating such constraints is key to improve modeling of the distribution of biodiversity in the past and future.
Nearly three decades have passed since Avise (Avise et al., 1987; Avise, 2000) first inspired tropical biologists to study community-level responses to regional changes through the lens of population genetics. However, despite the high species richness, endemism, and genetic structure observed in tropical regions (Moritz et al., 2000), comparative phylogeographic approaches are relatively unexplored in the tropics. To date, most available phylogeographic comparisons report spatial patterns of organelle DNA variation, primarily mitochondrial, across a handful of tropical taxa (Schneider et al., 1998; Pastorini et al., 2003; Nicolas et al., 2008; Carnaval et al., 2009; Moritz et al., 2009; Avila-Pires et al., 2012; Dolman and Joseph, 2012). Although addressing different regions and organisms, these studies have centered on two major topics: the role of climatic discontinuities (Schneider et al., 1998; Dolman and Joseph, 2012) or rivers (Pastorini et al., 2003; Avila-Pires et al., 2012) as barriers to dispersal and the influence of glacial–interglacial temperature oscillations on species ranges, a topic originally explored in studies of Northern Hemisphere taxa (Hewitt, 2000) but widely embraced by tropical phylogeographers worldwide (Nicolas et al., 2008; Carnaval et al., 2009; Moritz et al., 2009). This first generation of comparative studies indicated pervasive geographic structure of mitochondrial lineages (Carnaval et al., 2009; Moritz et al., 2009; Avila-Pires et al., 2012) and either congruent spatial patterns of genetic diversity across species of broadly similar ecologies (Schneider et al., 1998; Carnaval et al., 2009) or differences in ways largely expected, given their life history traits (Crawford et al., 2007; Nicolas et al., 2008). However, as tropical phylogeographers began to sample loci (Lorenzen et al., 2012; d’Horta et al., 2013; Demos et al., 2014) and taxa (Moritz et al., 2009; Dolman and Joseph, 2012; Bagley and Johnson, 2014) more widely, reports of asynchronous lineage diversification and distinct demographic syndromes among codistributed taxa (such as population expansions and contractions) became commonplace.
If idiosyncratic responses to common landscape changes characterize ecological communities in the tropics (Colwell and Rangel, 2010; Smith et al., 2014b) and beyond (Papadopoulou and Knowles, Chapter 8, this
volume; Zamudio et al., Chapter 11, this volume), their incorporation in phylogeographic methods can significantly improve our understanding of the impacts of former environmental shifts on regional species pools. Methods that build upon coalescent theory to account for historical heterogeneity across taxa under a single statistical framework (Hickerson et al., 2007; Xue and Hickerson, 2015) provide increased power to test concerted demographic responses at the level of ecological assemblages. These highly flexible approaches have profited from novel bench and analytical methods that build on genomic or reduced genome data, resulting in improved estimates of demographic parameters and histories (Pinto et al., 2014; Streicher et al., 2014; Rittmeyer and Austin, 2015). Although still rare, studies that combine coalescent-based demographic simulations and broader genomic sampling across taxa are unquestionably deepening our understanding of how tropical diversity came to be distributed (Smith et al., 2014b).
Improved knowledge of species responses to climate and landscape shifts will also strengthen forecasts of community responses to future global changes. Going beyond predictions of geographic ranges under future climates (Hijmans and Graham, 2006; Sinclair et al., 2010), molecular data can guide the parameterization of plausible species-specific models of the distribution of genetic diversity, and hence evolutionary potential, under predicted scenarios of global change (Brown et al., 2016). This as yet underexplored application of comparative phylogeography is especially promising and timely given today’s threats to tropical ecosystems (Moritz et al., 2000).
Using reduced genome data of codistributed Neotropical forest taxa, we apply a comparative phylogeographic framework to address two major goals. First, we ask whether present-day patterns of genomic diversity reflect congruent, multitaxa responses to historical environmental shifts documented within and across rainforest systems (Cheng et al., 2013). Then, using the distribution of suitable habitats and the molecular data to gain insight about species-specific demographical parameters (dispersal rates and population densities over time), we develop plausible models of the spatial distribution of genetic diversity under future climates. To do so, we analyze SNP data from Anolis punctatus and Anolis ortonii (Dactyloidae) and from Polychrus marmoratus (Polychrotidae). These codistributed arboreal lizard species occur in both Amazonia and the coastal Atlantic Forest of South America but are absent from the intervening open and drier scrublands and savannahs of the Caatinga and Cerrado domains.
Instead of examining the effects of temperature fluctuations associated with glacial–interglacial cycles commonly addressed by phylogeographic studies, we focus our historical study on the influence of a recently hypothesized spatial dynamics of moisture transport in tropical South
America over the last 250,000 years (Cheng et al., 2013). Paleoecological studies indicate that precipitation patterns have been the major constraining element of tropical rainforest distribution during the Quaternary (Ledru et al., 2015). Through a compilation of proxy data based largely on geochemical analyses of cave deposits, it has been proposed that levels of precipitation in the eastern portion of Amazonia dynamically matched those in the northern portion of the Atlantic Forest, whereas precipitation patterns in western Amazonia have been linked to those in the southern Atlantic Forest (Cheng et al., 2013). These two macroclimatic systems presumably have been acting as a dipole, with multiple cycles of inversion of precipitation regimes between regions that followed the precession component of Earth’s orbital cycles. For instance, although decreased rainfall has been inferred to impact eastern Amazonia and the northern Atlantic Forest ~20,000 ya, an opposite pattern (increased precipitation) is recorded for western Amazonia and the southern Atlantic Forest at that time (Cheng et al., 2013). The possibility that environmental drivers other than glacial–interglacial temperature oscillations have impacted tropical biotas worldwide has important implications for phylogeographic investigations, suggesting that at least some regions in the tropics are subjected to processes fundamentally different from those in the better-known temperate regions. We ask whether these proposed out-of-phase precipitation dynamics led to contrasting phylogeographic patterns between rainforest regions, testing recently proposed hypotheses about linked biological responses to synchronous but contrasting climatic regimes in South American forests.
Our approach tests for temporal congruence of demographic trends, using coalescent simulations under a hierarchical demographic model in combination with approximate Bayesian computation (ABC) to test for synchronous shifts in population sizes (Xue and Hickerson, 2015). We examine the timing and magnitude of population changes in different forest regions occupied by a single species as well as codistributed species within the same region. Given the geographic distribution of the three target lizard species, which are largely absent from the southern Atlantic Forest (A. punctatus and P. marmoratus occupy a limited extent of the southern Atlantic Forest in the states of Rio de Janeiro and São Paulo), we focus on concerted demographical shifts between western Amazonia, eastern Amazonia, and the northern Atlantic Forest.
Further exploring the molecular data and their potential contribution to conservation, we then expand on a recently proposed framework (Brown et al., 2016) to model the plausible distribution of genomic diversity of the two focal Anolis species under future climates. To illustrate this approach, we use a 2080 climate model based on the Representative Concentration Pathway (RCP) 6.0 emission scenario, which has been used
extensively to represent a medium carbon emission trajectory (Van der Linden and Mitchell, 2009) and results in mid-range estimates of average global changes (IPCC, 2015). For this analysis, we infer species-specific demographic parameters from a combination of species distribution models, forward-in-time demographic simulations, and backward-in-time coalescent simulations that are compared with the empirical SNP data. To avoid potential modeling limitations imposed by Amazonia’s sparsely distributed weather stations (Waltari et al., 2014), we restrict our forecasts to the highly endangered Atlantic Forest hotspot (Carnaval et al., 2009).
RESULTS AND DISCUSSION
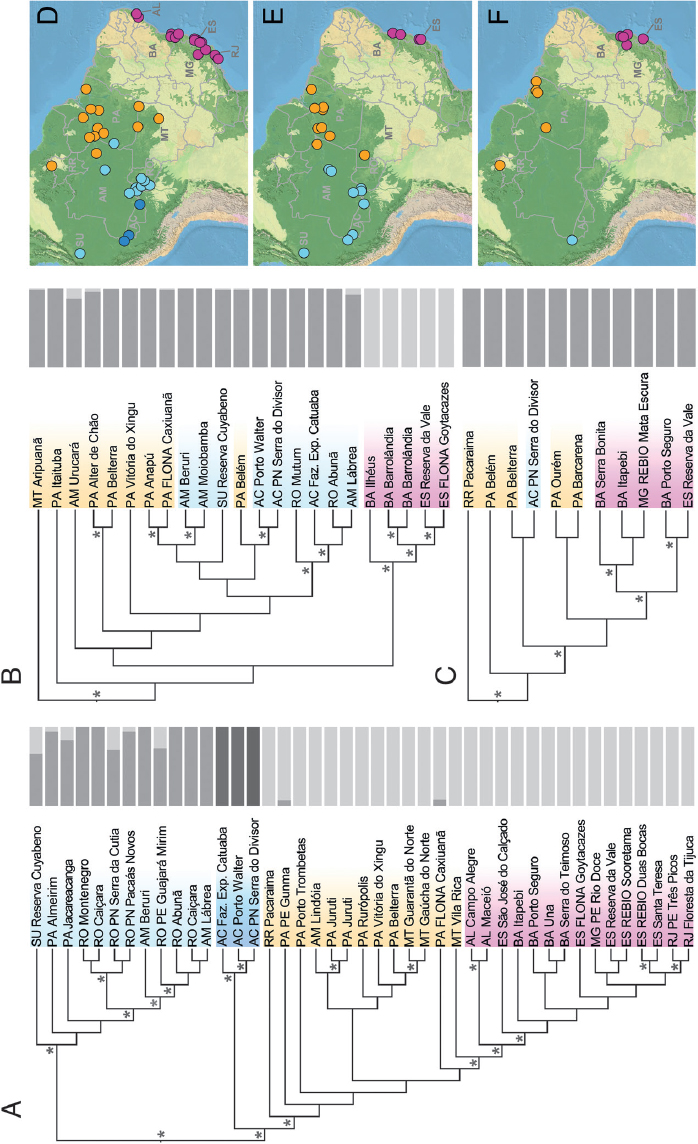
The spatial distribution of phylogenetic structure within all three species supports a scenario of colonization of the Atlantic Forest from the Amazonian domain (Fig. 3.1 and Datasets S1–S31). This pattern is consistent with the hypothesis that former increase in precipitation promoted rainforest expansion and facilitated biotic exchange between Amazonia and the Atlantic Forest during the Quaternary (Cheng et al., 2013). It also agrees with patterns of phylogeographic structure reported for other vertebrate taxa (Costa, 2003; Batalha-Filho et al., 2013; Prates et al., 2015). In all species, we found that samples from the Atlantic Forest are monophyletic and are nested among Amazonian lineages, and more closely related to lizards from eastern than from western Amazonia (although the relationship is weakly supported for A. ortonii and P. marmoratus; Fig. 3.1). Nonetheless, spatial patterns of population genetic structure, inferred by a clustering algorithm (Frichot et al., 2014), differ across taxa (Fig. 3.1): P. marmoratus is recovered as largely panmictic, A. ortonii is composed of two genetic clusters (Atlantic Forest and Amazonia), and three clusters are recognized within A. punctatus (western Amazonia near the Brazil–Peru border, southwestern and central Amazonia, and eastern Amazonia plus the Atlantic Forest).
Species Show Different Historical Demographic Syndromes
Demographic analyses across spatial groups within each species recover signals of population size shifts in western Amazonia, eastern Amazonia, and the northern Atlantic Forest. However, the demographic scenarios that best fit the genomic data, as well as the estimated time of demographic change, differed across species. These observations are in
__________________
1 Supporting information for this chapter, which includes Datasets 1 through 8, Figs. S1 through S6, and Table S1, is available online at http://www.pnas.org/lookup/suppl/doi:10.1073/pnas.1601063113/-/DCSupplemental.
disagreement with the expectations of biological responses to out-of-phase climate dynamics as described above (Cheng et al., 2013). In the case of A. punctatus, the best-fit demographic syndrome (Excoffier et al., 2013) infers a scenario of population expansion [posterior probability (PP) ≥ 0.98] in each of the three regions, with an ~8- to 17-fold expansion dating to ~62 kya in western Amazonia [95% credibility interval (CI) = 15–124 kya; see Dataset S4 for posterior estimates of all model parameters; posterior estimates of all model parameters had well-defined peak-shaped distributions; see plots in Figs. S1–S4], to ~120 kya in eastern Amazonia (CI = 34–207 kya), and to ~60 kya in northern Atlantic Forest (CI = 14–118 kya). The analyses of A. ortonii support an ~10- to 12-fold population contraction in all three regions (PP ≥ 0.88) dating to ~240 kya in western Amazonia (CI = 12–907 kya), to ~204 kya in eastern Amazonia (CI = 9–863 kya), and to ~81 kya in northern Atlantic Forest (CI = 10–300 kya). A scenario of an ~14-fold population contraction at ~72 kya (CI = 11–256 kya) was supported for P. marmoratus in the Atlantic Forest (PP = 1.0), the only region with sufficient sampling of SNPs per individual to enable historical demographic inference in this species.
Shifts in Population Size Are Asynchronous
Extending beyond region-specific inferences of population size change within each species, we applied hierarchical demographic models to combine data across regions and species and test for assemblage-wide synchrony in population shifts. To implement this multiregion, multitaxon framework, we used the aggregate site frequency spectrum (aSFS) to
summarize patterns of genetic variation across groups and coupled it with coalescent simulations and a hierarchical approximate Bayesian computation (hABC) approach that allows species-specific parameters to vary independently (Xue and Hickerson, 2015). In an analysis that combined data from both A. punctatus and A. ortonii in all regions (western Amazonia, eastern Amazonia, and northern Atlantic Forest), we recovered a signal of largely asynchronous demographic change [dispersal index, the variance/mean of the time of population size change (DI) = 76,549; proportion of groups in a synchronous pulse (ζ) = 0.50; Dataset S5 and Fig. S5]. A joint analysis restricted to the northern Atlantic Forest, where sufficient sampling of SNPs per individual is also available for P. marmoratus, supports a scenario of partially synchronous population size changes across the three lizard taxa (DI = 17,361; ζ = 0.67). These asynchronous or partially synchronous responses across species are consistent with the results of multiregion analyses conducted within each taxon separately. In a multiregion analysis restricted to A. ortonii, the data are consistent with a pattern of partially synchronous contractions, suggesting that two of the three regions responded in synchrony (DI = 41,314; ζ = 0.67). In A. punctatus, however, we detected a strong signal of synchronous population size shifts across all geographic regions, with coexpansion happening at ~119 kya [DI = 0.0; ζ = 1.0].
Although the population-level analyses largely support the occurrence of population changes within the time frame of documented atmospheric moisture shifts over the past 250 ky (Cheng et al., 2013), the contrasting syndromes among species (e.g., expansions in A. punctatus vs. contractions in A. ortonii and P. marmoratus) and the uniformity of demographic responses across forest regions and within species (in A. punctatus and A. ortonii) are inconsistent with the hypothesis that these lizards similarly tracked out-of-synchrony contractions and expansions of South America’s lowland forests (Cheng et al., 2013). The general similarity of within-species population responses may indicate that demographic patterns are largely determined more by species-specific biological attributes than by spatial patterns of environmental variation across time. Future analyses of biological responses to the recently proposed South American macroclimatic zones (Cheng et al., 2013) will benefit from a more extensive spatial sampling, particularly in underexplored regions such as the extreme west of Amazonia and the Andean foothills, and also will profit from the inclusion of additional species.
Genetic Diversity Under Future Climates
The distinct responses to environmental shifts observed across these broadly codistributed taxa, as shown by the historical analyses, are also
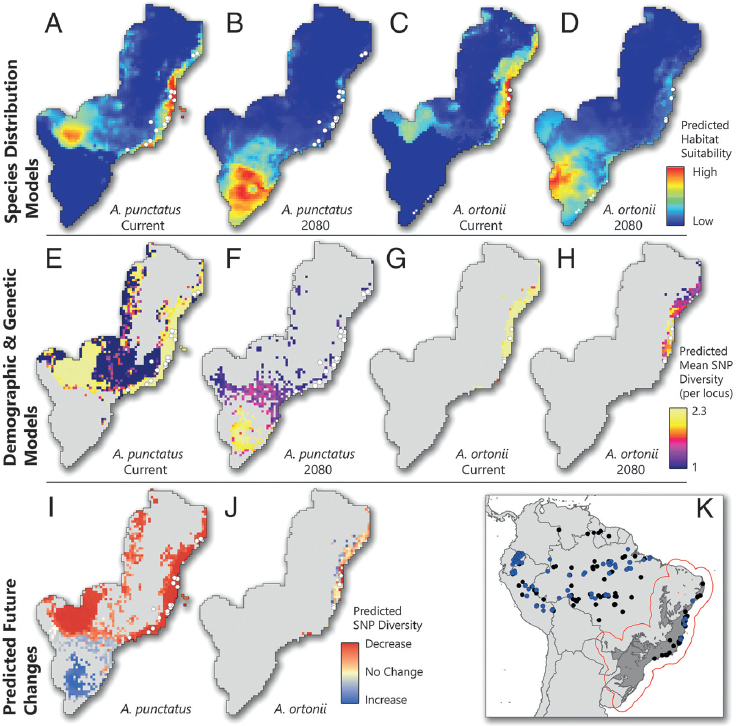
prevalent in predictions of the distribution of genetic diversity under future climates. Although forecast models predict severe loss of genetic diversity for both A. punctatus and A. ortonii by 2080, the projected spatial distribution of genetic diversity in these two species is markedly distinct (Fig. 3.2I and J). To develop models of the plausible future spatial distribution of allelic diversity, we adapted a recently proposed framework (Brown et al., 2016) that takes into account not only the distribution of suitable habitats under future climates but also species-specific ecological and demographic constraints inferred from molecular data. This framework first uses carefully parameterized species distribution models (SDMs) to approximate the spatial distribution of suitable habitats and landscape permeability to dispersal. Then empirical genetic (here reduced genomic) data are used to approximate the maximum density of individuals and the dispersal rates across the landscape (Brown et al., 2016).
Projection of present-day SDMs (Fig. 3.2A and C) onto 2080 climate predicts a dramatic decrease of suitable habitat along the current range of both species (Fig. 3.2B and D), including areas where present-day levels of genetic (SNP) diversity are high (Fig. 3.2E and G). On the other hand, the SDM projections into the future predict high suitability in presently cold areas of southern Brazil, where both species currently are absent. Despite such similar predicted habitat suitability, models of the plausible distribution of genetic diversity of the two species by 2080 differ dramatically (Fig. 3.2F and H). For A. punctatus, genetic diversity is predicted to decline strongly across the northern Atlantic Forest but to increase in the south (Fig. 3.2F). A. ortonii is expected to maintain some genetic diversity in the northern Atlantic Forest but is not expected to colonize the potentially new suitable habitats arising in the south (Fig. 3.2H).
Although models of species distribution under future climates have been widely used to guide conservation (Hijmans and Graham, 2006; Sinclair et al., 2010), these results suggest that relevant insight can be gained by incorporating genomic data in predictive studies. A naive interpretation of the SDMs of the two Anolis could flag southern Brazil as highly suitable for both species by 2080 (Fig. 3.2B and D), potentially preventing future loss of genetic diversity. However, our spatial demographic models indicate that these regions may in fact hold genetic diversity for A. punctatus (Fig. 3.2F) but not for A. ortonii (Fig. 3.2H). Such different predictions result from contrasting population densities and capacities for dispersal: When tied to the spatial data, SNP variation in A. punctatus indicated that, on average, 9.97% of each grid cell’s occupants may emigrate at every generation, compared with 1.23% for A. ortonii. Our estimates of maximum carrying capacities further suggest that A. punctatus can attain much higher densities of individuals than A. ortonii (5,563 vs. 1,181 individuals per 30 km2; for all parameters, PP = 1). (Fig. S6 and Table S1). These results
correlate well with differences in body size and perceived abundances in the field: A. punctatus is much larger and also is observed much more frequently than A. ortonii in most of the areas we sampled. Importantly, these differences are consistent with the notion that dissimilar ecological and demographic constraints lead to distinct species responses to shared environmental change and are relevant for understanding demographic trends (Brown et al., 2016), even in species that occupy broadly similar climatic niches. Although challenging, the incorporation of species-specific ecological traits appears central to models of community responses to ongoing global change, both in the past and in the future.
CONCLUDING REMARKS
Through a comparative analysis of widely ranged and codistributed Neotropical forest lizards, we find concordant spatial patterns of phylogeographic structure across taxa, an observation consistent with previous mitochondrial DNA-based studies throughout the tropics (Schneider et al., 1998; Carnaval et al., 2009). Similar to the relatively few studies targeting multiple loci and tropical taxa (Lorenzen et al., 2012; d’Horta et al., 2013; Demos et al., 2014), we nonetheless find that the demographic processes underscoring those patterns vary across species. This view is supported by tests of synchronous population size shifts that allow for species-specific parameters as well as by plausible models of the distribution of genetic diversity under future carbon emissions. Taxa associated with broadly similar climatic conditions exhibit contrasting responses to common environmental changes, a scenario also supported by simulation-based macroecological studies (Zamudio et al., Chapter 11, this volume).
By combining genomic data with knowledge of the distribution of past, present, and future climates, we learn that species responses to environmental shifts are likely mediated, at least in part, by taxon-specific features that can be approximated through demographic simulations and molecular inference. The use of biological data to document or refine our understanding of the geological and climatic history of the Earth (Baker et al., 2014)—topics so fundamental to the description of the evolution of tropical biodiversity—will benefit from the incorporation of ecological differences among species. As we embark on a new genomic era, comparative phylogeography brings novel insights and exciting advances that bridge ecology and evolution and strengthens their links with the environmental sciences and conservation.
MATERIALS AND METHODS
Sequencing Protocols and Phylogenetic Analyses
We generated SNPs from 43 A. punctatus and 23 A. ortonii (Dactyloidae) and from 11 P. marmoratus (Polychrotidae) individuals (Dataset S6). For phylogenetic inference, we included one individual of Anolis dissimilis, Anolis fuscoauratus, Anolis phyllorhinus, Anolis tandai, Anolis trachyderma, Anolis transversalis, and Polychrus liogaster as outgroups. Genomic DNA was extracted from liver or tail fragments preserved in 100% ethanol through high-salt extraction and RNase treatment. Extractions were verified on agarose gels to ensure that the DNA was not degraded. DNA concentration was measured in a Qubit 2 fluorometer (Invitrogen) to ensure a final concentration of 30–100 ng DNA/µL in a total volume of 30 µL [in Tris EDTA buffer (Thermo Fisher Scientific, Waltham)].
We generated a restriction site-associated DNA library through genotype-by-sequencing (Elshire et al., 2011) at the Institute of Biotechnology at Cornell University. Genomic DNA was first reduced to a representation library using the EcoT22I restriction enzyme. Resulting fragments were tagged with individual barcodes, PCR-amplified, multiplexed, and sequenced in an Illumina HiSeq platform (Excoffier et al., 2013). The number of total single-end reads per individual ranged from ~300,000 to 6.3 million. We used a Pyrad 3.0.6 pipeline (Eaton, 2014) to demultiplex and assign reads to individuals based on sequence barcodes, to perform de novo read assembly (clustering similarity threshold > 0.9), to align reads into loci, and to identify SNPs and genotypes. We enforced a minimum Phred quality score (Waltari et al., 2014) and minimum sequence coverage (10×) to filter out poor-quality reads and reduce base-calling error. To reduce potential paralogs, we enforced a maximum number of heterozygous individuals per DNA site (n = 5). Final locus length ranged from ~50 to 150 bp. A single SNP per locus was randomly selected to reduce linkage disequilibrium across sites and ensure sampling of independent SNP histories. The final dataset was composed of 18,672 (A. ortonii), 15,421 (A. punctatus), or 4,589 (P. marmoratus) unlinked SNPs. Genetic datasets used in all analyses were deposited in Dryad (available at dx.doi.org/10.5061/dryad.2v1p6).
Phylogeographic Structure and Demographic Syndromes
We first inferred phylogenetic relationships with singular value decomposition scores for species quartets (SVD quartets) (Chifman and Kubatko, 2014), sampling all possible quartets and allowing for up to 30% of missing data. Node support was estimated with 1,000 bootstrap replicates. We then used sNMF 1.2 (Frichot et al., 2014) to test the best-fit
number of genetic clusters within each species (k) and to assign individuals to populations. We tested multiple k values (1–10), with 20 replicate runs for each k value, and allowed a maximum of 30% missing data (each site was present in at least 70% of individuals). Robustness of the results was assessed by testing four values of the alpha regularization parameter (10, 100, 1,000, and 10,000).
Once we ensured that individuals from each spatial group (eastern Amazonia, western Amazonia, and northern Atlantic Forest) for each species did not violate the assumption of panmixia (based on the sNMF test of genetic clustering), we tested which historical demographic syndrome—instantaneous population expansion, instantaneous contraction, or constant size—best describes lizards in each region. For downstream site frequency spectrum (SFS)-based analyses, we used dadi 1.7 (Gutenkunst et al., 2009) to convert individual SNP data to an unpolarized SFS that summarizes patterns of site polymorphism across all sampled individuals within a population. The SNP data of each spatial group were down-projected to an SFS with equivalent sampling sizes across groups, allowing downstream aSFS analyses of groups composed of different numbers of sampled individuals (see below) while decreasing the effect of different levels of missing data between groups. Depending on the analysis, spatial groups of A. punctatus were down-projected to 10, 5, or 4 diploid individuals, A. ortonii groups were down-projected to five and four diploid individuals, and the P. marmoratus northern Atlantic Forest group was down-projected to four diploid individuals (see below and Dataset S4 for the number of SNPs and down-projection scheme used in each analysis). The number of individuals in each down-projecting scheme was chosen to maximize the number of sampled individuals while minimizing levels of missing data in each group.
To estimate best-fit demographic syndromes, we used fastsimcoal2 2.5 (Excoffier et al., 2013) to simulate 100,000 coalescent simulations per demographic syndrome (for a total of 300,000 simulations) for each sampling level per spatial group. We then used an ABC procedure to compare each observed SFS with the appropriate simulations. Prior distributions used were time of instantaneous change ~uniform (U)(5 k, 1 million) generations ago, size change magnitude ~U(0.04, 0.2), with subsequent conversion to inverse in the case of contraction, current effective population size change for expansion ~U(100 k, 1 million), current effective population size change for constant size ~U(50 k, 500 k), and current effective population size change for contraction ~U(5 k, 100 k). An ABC model selection procedure was accomplished using the R package abc (Csilléry et al., 2012), using the model selection function postpr() to estimate the best-fit syndrome and the parameter estimation function abc() to infer posterior distributions for time, magnitude of population size change, and effective
population size. Under ABC simple rejection sampling, we accepted the 1,500 (0.5%) simulations with the shortest Euclidian distance between the simulated and the empirical SFS. The model with the greatest posterior distribution then was selected as the best-fit demographic syndrome for each spatial group. To determine qualitatively whether tested models were discriminable based on the SFS, we visually inspected principal component analysis (PCA) plots based on a random selection of 100 simulated SFS under each model (for a total of 300 simulations). Moreover, to confirm that the best-fit model could generate the observed data, we conducted a PCA on the posterior-accepted simulated SFS, projected the empirical SFS into the principal components (PCs), and plotted the empirical data point, along with the accepted simulated data, on axes PC2 vs. PC1.
Estimating Magnitude of Synchronicity in Population Size Change
We tested the degree of synchronicity in population size changes across spatial groups through three sets of analyses. In analysis 1, we tested the degree of synchronicity in population size changes at a species level, comparing the three spatial groups within the better-sampled species A. punctatus and A. ortonii separately. Given the substantially greater sampling of A. punctatus, we down-projected the data of this species to 10 diploid individuals. In the case of A. ortonii, the data were down-projected to five diploid individuals. In analysis 2, we combined data from A. punctatus and A. ortonii spatial groups, all projected to five diploid individuals, to estimate the degree of synchronicity in population size shifts across all three geographic regions in both species. In analysis 3, we inferred the degree of synchronicity in demographic responses across the three species within the northern Atlantic Forest, a region for which enough sampled SNPs per individual of P. marmoratus were available. For this analysis, all three species in the northern Atlantic Forest were down-projected to four diploid individuals. In each analysis, we combined the empirical (observed) SFS of the spatial groups under consideration into an aSFS (Xue and Hickerson, 2015).
We then used an hABC procedure, which compares the observed aSFS with aSFS simulated under a hierarchical demographic model with varying degrees of synchronicity, to estimate (i) the proportion of groups in synchrony, ζ; (ii) the variance/mean of demographic change timing across spatial groups (with lower values signaling greater synchronicity), DI; and (iii) the timing of synchronous population size change (Xue and Hickerson, 2015). We performed 1 million coalescent simulations of the aSFS using fastsimcoal2, implementing the same prior distributions as the demographic syndrome analysis; the exception was the prior for ε in the expander populations, set to ~U(0.02, 0.2), and for current
effective population size, set to ~U(500 k, 2 million) for expanders and ~U(50 k, 250 k) for contractors, because single-population analyses often had L-shaped posterior distributions for these parameters. The hyper-prior for ζ was distributed according to a discrete uniform prior across all possible values from a single spatial group (i.e., completely idiosyncratic) to all spatial groups (i.e., complete synchrony) within a synchronous pulse. We also implemented a time buffer to ensure that asynchronous or idiosyncratic spatial groups responded at >20,000 generations apart from the synchronous time. This strategy aimed to increase the identifiability of ζ by reducing the temporal proximity of asynchronous responses to spatial groups in synchrony. In analyses in which the spatial group-level analyses supported expansion in some spatial groups but contraction in others (Dataset S4), we built the aSFS in three steps. First, an aSFS was built based only on the SFS of the spatial groups found to have expanded. Then another aSFS was built based only on the SFS of groups found to have contracted. Lastly, these two aSFS were concatenated to form a single summary statistic vector. Simulated aSFS were constructed accordingly to each respective empirical aSFS. With this method we were able to reduce statistical noise resulting from improper model specification and conflicting population signals.
Following hABC hyper-parameter inference, we accepted the 1,500 simulations whose aSFS had the shortest Euclidian distance from the empirical aSFS, using the R package abc. The function postpr() was used to infer ζ, with each discrete value treated as a separate model, and the function abc() was used to estimate the remaining parameter summaries (i.e., DI and synchronous time). Posterior distributions then were estimated based on the values of the retained simulations. As in the procedure for the spatial group-specific demographic syndrome analysis, we performed a PCA on the accepted simulations and plotted the simulated data with the empirical aSFS along the first two PCs to assess if the proposed scenarios could have generated the empirical aSFS. Furthermore, to assess hABC performance using the aSFS, we performed 50 leave-one-out cross-validations for the set of simulations per each empirical aSFS, with each cross-validation involving the extraction of a single simulation to act as a pseudo-observed dataset (POD) and using the remaining simulations for hABC estimation. This procedure was conducted using the functions cv4postpr() for ζ and cv4abc() for the parameter summaries, both contained in the R package abc. For each set of cross-validations, we calculated Pearson’s correlation and the rms error between the known and estimated values across the 50 leave-one-out PODs. PCA plots based on the simulated SFS confirmed that the scenarios tested by the demographic analyses were generally discriminable (Figs. S1–S4). The PCA plots of the aSFS vectors calculated from the hABC rejection-sampled posterior,
as well as from the aSFS calculated from the observed data, confirmed that best-fit models could generate the observed data. The leave-one-out cross-validation experiment indicated few biases and adequate accuracy in parameter estimates and model testing based on hABC analyses and the aSFS (Dataset S5).
Species Distribution Models to Inform Analyses of the Future Distribution of Genetic Diversity
To parameterize predictive models of future shifts in the spatial distribution of genomic diversity, we estimated migration rates and maximum carrying capacity at occupied sites from spatial demographic simulations that used friction and carrying-capacity layers derived from SDMs projected into former climates. We used the empirical SNP data to validate the simulated demographic scenarios (and hence to enable the estimation of demographic parameters) by following multiple forward-in-time spatial demographic simulations with a corresponding backward-in-time genetic simulation. The simulations closest to the empirical genetic data were retained for estimation of posterior distributions of model parameters. Given the complexity of the analysis, we restricted this inference to the Atlantic Forest and to the two best-sampled species, A. punctatus and A. ortonii.
Species distribution models were generated in MaxEnt 3.3.3k (Phillips et al., 2006), as implemented in SDMtoolbox 1.1c (Brown, 2014). We used museum records, data from collaborators, and data from our own fieldwork to compile occurrence records of A. punctatus and A. ortonii, which then were vetted for spatial and taxonomic accuracy. We then randomly selected one of multiple occurrence records per species within a 10-km radius using SDMtoolbox (Brown, 2014). The final dataset for SDM building was composed of 129 records of A. punctatus and 72 records of A. ortonii (Dataset S7). All models used eight standard bioclimatic variables summarizing patterns of precipitation and temperature, at a 2.5-arc-minute resolution (Bio1, 4, 10–12, 15–17 available at www.worldclim.org) (Hijmans et al., 2005). Models were built with occurrence points from the entire range of the species and later were clipped to the Atlantic Forest (–2.126 N, –59.567 W to –36.076 N, –34.717 W). Pseudoabsence (background) points were sampled from a minimum convex polygon defined as a 100-km buffer drawn around the occurrence localities (Barbet-Massin et al., 2012).
To parameterize the SDMs properly, we evaluated the performance of various combinations of five feature classes (linear; linear and quadratic; hinge; linear, quadratic, and hinge; and linear, quadratic, hinge, product, and threshold), and 10 regularization multipliers (from 0.5 to 5, in increments of 0.5) (Shcheglovitova and Anderson, 2013). To this end, we evalu-
ated the performance of SDMs built under each combination of model parameters through a geographically structured k-fold cross-validation (i.e., the occurrence records were partitioned into k equal geographically clustered subsamples, here k = 5, and the models were trained with four of the groups and then evaluated with the excluded group until all group combinations were run). Model fit was assessed through inspections of the omission rate, area under the curve (AUC), and model feature class complexity (Brown, 2014). After optimum model parameters were determined (those leading to the lowest omission rate, highest AUC, and lowest complexity, in the order listed), a final SDM was built with all occurrence sites. For both A. punctatus and A. ortonii, the best-fit models were parameterized with linear, quadratic, and hinge feature classes and a regularization multiplier of 0.5 and 1, respectively. The best resulting SDMs for A. punctatus and A. ortonii (of 250 SDMs with alternative parameter combinations for each species) show high predictive accuracy (average omission rates 0.320 and 0.243, respectively) and high average AUCs (0.758 and 0.918). These final models were used to infer the range of each anole into the past and future. When projecting to variable values outside the observed range, all projections of the response curves were reset (“clamped”) to match the upper or lower values found in the study area (Phillips et al., 2006).
Models of the paleodistribution of the species were derived with snapshot simulations of climate spanning the last 70 ky (at 1-ky time intervals back up to 22 kya, and before that at 2-ky time intervals, with 46 time periods in total) derived from the Hadley Centre Climate model (HadCM3) (Fuchs et al., 2013; Carnaval et al., 2014). To project species ranges and genetic diversity under future climates, we used bioclimatic variables estimated from the Hadley Center model for the years 2030, 2050, 2070, and 2080 (HadGEN2-ES) (IPCC, 2015), which is based on the RCP 6.0 emission scenario (Van der Linden and Mitchell, 2009).
Estimating Carrying Capacity and Friction from SDMs
The SDMs generated under each former climatic period were rendered into two landscapes, friction and carrying capacity, for use in spatial demographic simulations (Knowles and Alvarado-Serrano, 2010; Brown and Knowles, 2012). The carrying capacity represents the maximum number of individuals that can occupy a grid cell at that time and is proportional to the suitability values given by the SDM. The friction values depict the relative difficulty of movement of individuals across different points in the landscape and are inversely proportional to the suitability inferred for the adjacent cells. To convert the SDMs into these friction and carrying-capacity landscapes, we tested five transformation functions:
linear, sigmoid (with two different inflection points), and binary (with two different cutoffs) (Brown and Knowles, 2012). The sigmoid function best matched current distribution data. Conversion was performed with a normal cumulative distribution function, where the inflection point of the sigmoidal curve was 0.5 and the slope of the curve was 0.091 for A. punctatus and 0.073 for A. ortonii. These values were defined based on suitability values (from the SDM) measured at sites with known occurrences, where half of the SD equaled the slope of the curve (Brown and Knowles, 2012).
Spatial Demographic Simulations for the Past
A total of 200,000 forward-in-time simulations of dispersal were performed under different migration rates and maximum carrying capacities. These 2D stepping-stone demographic colonizations (Kimura and Weiss, 1964) were simulated based on the per-deme maximum carrying capacity and migration limitations imposed by the friction and carrying capacity landscapes, using the program SPLATCHE 2 (Ray et al., 2010). In the demographic modeling, the colonization of the landscape proceeded in a generation-by-generation manner, from a predetermined ancestral source area(s) (see below). In each generation, population growth in each deme (i.e., an occupied cell) followed a logistic model characterized by a per-generation intrinsic growth rate (set to 0.2) and the time-specific SDM-informed maximum carrying capacity. This step was followed immediately by migration of individuals into neighboring demes, conditioned by the time-specific SDM-based friction of the landscape. The number of emigrants (dispersers) per generation from a given deme was modeled as a function of the migration rate (m, the proportion of individuals of a deme emigrating at each generation) and of the total number of occupants in that deme (which in turn depends on the local carrying capacity and on the population growth rate, under a logistic growth trend). A spatial resolution of ca. 30 km2 (~0.35°) was used for the demographic modeling because the spatial autocorrelation of the observed genetic data approached zero at this resolution [measured in SAM 4.0 using a spatial correlogram (Rangel et al., 2010)].
To define the ancestral area from which spatial simulations would start, as well as the initial population density in those cells, we considered cells whose suitability score corresponded to the top 0.1 quartile of suitability values from the SDM projected to 70 kya [the oldest time period considered in our spatial demographic analyses (Knowles and Alvarado-Serrano, 2010)]. At the start of the simulations, each cell in which the species was considered to be present was assigned the maximum number of individuals (i.e., the maximum per deme carrying capacity). If the cell’s actual carrying capacity, as informed by the corresponding projected SDM,
was lower than the maximum capacity (i.e., if its suitability was lower than the maximum), the remaining individuals were distributed in neighbor cells. Because of computational limitations on the number of generations and on spatial resolution, a generation time of 10 years was used in the spatial demographic simulations. To adjust the results of the simulations to the more biologically plausible generation time of 1 year for anole lizards (Tollis et al., 2012; Muñoz et al., 2013), we multiplied the mutation, recombination, and growth rates by 10.
Spatial Genetic Simulations for the Past
To use the empirical data to validate the simulated demographic scenarios, and hence enable estimation of demographic parameters, each forward-in-time spatial demographic simulation was followed by a corresponding backward-in-time genetic simulation. The latter was parameterized by the spatially explicit demographic conditions simulated first. Specifically, the record of the per-generation movement of individuals and deme population sizes provided by the demographic simulations informed the probability of within-deme coalescent events and the probability of backward-in-time movement to neighboring demes of each sampled SNP. SNPs from focal populations were sampled from the resulting genealogies (Knowles and Alvarado-Serrano, 2010; Brown and Knowles, 2012). The simulated genetic data matched the empirical genetic dataset used in this analysis: We simulated and sampled the same number of markers (4,000 SNPs) and the same number of individuals per sampled cell (15 sampling localities for A. punctatus and 4 for A. ortonii) (Dataset S8). Given the uncertainty in mutation rates for SNP data, we simulated SNPs into four equal groups (1,000 SNPs each) with mutation rates at each order between 1 × 10⁻⁵ to 1 × 10⁻⁸ mutations per site per generation. Rates of recombination were set to 0.822 cM/Mb based on genomic averages (Dumont and Payseur, 2008). Prior distributions were set as 3 to 5 for maximum landscape carrying capacity (maxK) and −3 to −0.5 for m (values in log10). Simulations were summarized into a total of 243 summary statistics for A. punctatus and 45 for A. ortonii with Arlequin v3.5 (Excoffier and Lischer, 2010), including the statistics for between-site comparisons [e.g., mean number of alleles (r), r SD, mean heterozygosity (H), H SD, mean total H, mean number of pairwise differences, number of private polymorphic sites, and mean number of sites with segregating substitutions] and global descriptions (over all sites, e.g., total number of alleles, total number of polymorphic sites, total H). Because the use of a large number of summary statistics may reduce the accuracy of the ABC estimation as a result of high dimensionality (Blum, 2012), summary statistics were transformed into partial least squares (PLS) components
(Boulesteix and Strimmer, 2007) using the first 10,000 simulations as random calibration. After exploring the reduction of the rms errors associated with each additional PLS component for each parameter (Wegmann et al., 2009), we retained only the first nine PLS components. The 1,000 simulations (0.5%) closest to the empirical genetic data were retained for estimation of posterior distributions of model parameters (Beaumont et al., 2002), after adjustment with a general linear model (Leuenberger and Wegmann, 2010). The fit of the model to the empirical data was evaluated by assessing the fraction of retained simulations that had likelihood smaller than or equal to that of the observed data (a small fraction suggests that the model does not fit well with the empirical data) (Wegmann et al., 2010). Accuracy of parameter estimation was assessed by calculating the coefficient of determination (R2) between each parameter and the nine retained PLS components (Neuenschwander et al., 2008).
Estimating the Genetic Consequences of Future Climate Change
Once we estimated the demographic parameters for each species, we proceeded to map the distribution of genomic diversity currently and in the face of projected future climate change. To do so, we ran a final demographic simulation starting at 70 kya, which was run forward until two points in time: the present (ca. 2010) and the year 2080. For each past time period, the posterior estimates (modes) of ancestral population size, migration rate, and carrying capacity derived from the historical analyses were used to parameterize the simulations. All other parameters, including growth rate, were kept at the values used for the initial spatial demographic simulations. Genetic constitution of every occupied locality was sampled at the end of each model run (on average, 1,560 and 183 grid cells for the present time and 1,508 and 172 cells for 2080, for A. punctatus and A. ortonii, respectively). Demographic and genetic simulations were repeated 100 times for each temporal scenario, through 20 replicate demographic models, each with five genetic simulation replicates (Gehara et al., 2013). To measure predicted changes compared with present-day spatial patterns of genetic diversity, the genetic landscape predicted for 2080 was subtracted from that for the present day. Because output summary statistics of the simulated genetic data were highly correlated (r = 0.81, P < 0.001), we chose to present only mean allelic diversity here, which depicts the average allelic diversity (r) among the 4,000 simulated SNPs.
ACKNOWLEDGMENTS
We thank all the Brazilian collectors who made this study possible and particularly students in the M.T.R. laboratory for field support. Dis-
cussions with the A.C.C. and M.J.H. laboratories greatly improved this manuscript. Ana Prudente provided samples deposited at the Museu Paraense Emilio Goeldi. Frederick H. Sheldon provided samples deposited at the Louisiana State University Museum of Natural Science. The Instituto Chico Mendes de Conservação da Biodiversidade issued Sistema de Autorização e Informação em Biodiversidade (SISBIO) collection permits 36753-1, 36753-4, and 27290-3. This work was largely cofunded by São Paulo Research Foundation (FAPESP) Grant BIOTA 2013/50297-0, National Science Foundation (NSF) Grant DEB 1343578, and the National Aeronautics and Space Administration through the Dimensions of Biodiversity Program. Additional funding included NSF Doctoral Dissertation Improvement Grant DEB 1601271 and a City University of New York (CUNY) Graduate Center Doctoral Student Research Grant (to I.P.), NSF DEB Grant 1253710 (to A.T.X., D.F.A.-S., and M.J.H.), FAPESP Grants 03/10335-8 and 11/50146-6 (to M.T.R.), and NSF-DEB Grant 1120487 and a CUNY Junior Faculty Research Award in Science and Engineering (to A.C.C.). CUNY’s High Performance Computing, used in data analyses, is supported by NSF Grants CNS-0855217, CNS-0958379, and ACI-1126113.


