
12
Geogenetic Patterns in Mouse Lemurs (Genus Microcebus) Reveal the Ghosts of Madagascar’s Forests Past
ANNE D. YODER,*†§§C. RYAN CAMPBELL,* MARINA B. BLANCO,†MARIO DOS REIS,‡JÖRG U. GANZHORN,§STEVEN M. GOODMAN, ||#KELSIE E. HUNNICUTT,* PETER A. LARSEN,* PETER M. KAPPELER,** RODIN M. RASOLOARISON,**††JOSÉ M. RALISON,††DAVID L. SWOFFORD,* AND DAVID W. WEISROCK‡‡
Phylogeographic analysis can be described as the study of the geological and climatological processes that have produced contemporary geographic distributions of populations and species. Here, we attempt to understand how the dynamic process of landscape change on Madagascar has shaped the distribution of a targeted clade of mouse lemurs (genus Microcebus) and, conversely, how phylogenetic and population genetic patterns in these small primates can reciprocally advance our understanding of Madagascar’s prehuman environment. The degree to which human activity has impacted the natural plant communities of Madagascar is of critical and enduring interest. Today, the eastern rainforests are separated from the dry deciduous forests of the west by a large expanse of presumed anthropogenic grassland savanna, dominated by the
__________________
* Department of Biology, Duke University, Durham, NC 27708; †Duke Lemur Center, Duke University, Durham, NC 27705; ‡School of Biological and Chemical Sciences, Queen Mary University of London, London E1 4NS, United Kingdom; §Tierökologie und Naturschutz, Universität Hamburg, 20146 Hamburg, Germany; ||Field Museum of Natural History, Chicago, IL 60605; #Association Vahatra, BP 3972, Antananarivo 101, Madagascar; **Behavioral Ecology and Sociobiology Unit, German Primate Centre, 37077 Goettingen, Germany; ††Département de Biologie Animale, Université d’Antananarivo, BP 906, Antananarivo 101, Madagascar; and ‡‡Department of Biology, University of Kentucky, Lexington, KY 40506. §§To whom correspondence should be addressed. Email: anne.yoder@duke.edu.
Family Poaceae, that blankets most of the Central Highlands. Although there is firm consensus that anthropogenic activities have transformed the original vegetation through agricultural and pastoral practices, the degree to which closed-canopy forest extended from the east to the west remains debated. Phylogenetic and population genetic patterns in a five-species clade of mouse lemurs suggest that longitudinal dispersal across the island was readily achieved throughout the Pleistocene, apparently ending at ~55 ka. By examining patterns of both inter- and intraspecific genetic diversity in mouse lemur species found in the eastern, western, and Central Highland zones, we conclude that the natural environment of the Central Highlands would have been mosaic, consisting of a matrix of wooded savanna that formed a transitional zone between the extremes of humid eastern and dry western forest types.
Madagascar is one of the most enigmatic landmasses on Earth and has long been identified as a unique biodiversity hotspot (Myers et al., 2000). Current estimates hold that close to 100% of the island’s land mammals and native amphibians, 92% of its reptiles, and >90% of its plants are found nowhere else on Earth (Vences et al., 2009; Callmander et al., 2011). Best estimates indicate that the island harbors nearly 5% of Earth’s species-level biodiversity even though it comprises only a little more than 0.01% of the planet’s land-surface area. The mechanisms by which so much biodiversity arose on such a relatively small and remote corner of the Earth beg for phylogeographic and biogeographic investigation (Wilmé et al., 2006; Samonds et al., 2013).
Presently, Madagascar exhibits a remarkable east–west trend in precipitation, which is primarily the result of eastern trade winds coming off the Indian Ocean and the orographic effect of the island’s eastern mountain range (Gautier and Goodman, 2003). An evergreen humid forest biome covers portions of the eastern lowlands and extends ~100 km inland along the north–south aligned eastern chain of mountains. At elevations above 800 m, and extending well into the island’s interior, the humid forest transitions to the Central Highlands, which are dominated by moist montane forest. At higher elevations (generally above 1,900 m), the montane forest habitat gives way to an Ericaceae thicket. Along the western half of the island, below 800 m elevation and to the west of the Central Highlands, the montane forests shift to dry deciduous forest dominated by drought-adapted trees and shrubs. All these habitats have been extensively degraded and fragmented by human activities over the past few hundred years (Green and Sussman, 1990; Harper et al., 2007), and in most areas, particularly in the Central Highlands, little of the former natural vegetation remains. Although there is uniform consensus that human activities dramatically transformed the landscape at about 1,000 y BP (Dewar, 2014;
Goodman and Jungers, 2014; McConnell and Kull, 2014; Vorontsova et al., 2016), the prehuman condition remains debated. Interpretation of the prehuman vegetation via current phytogeographic classification of the island is constrained by the extant floristic affinities of plants (Perrier de la Bâthie, 1921; Humbert, 1955), with little data on natural formations from the Central Highlands remaining. Thus, the present classification separating the eastern and western biomes as extreme endpoints ignores the possibility that the Central Highlands might naturally have formed a vast zone of transitional vegetation.
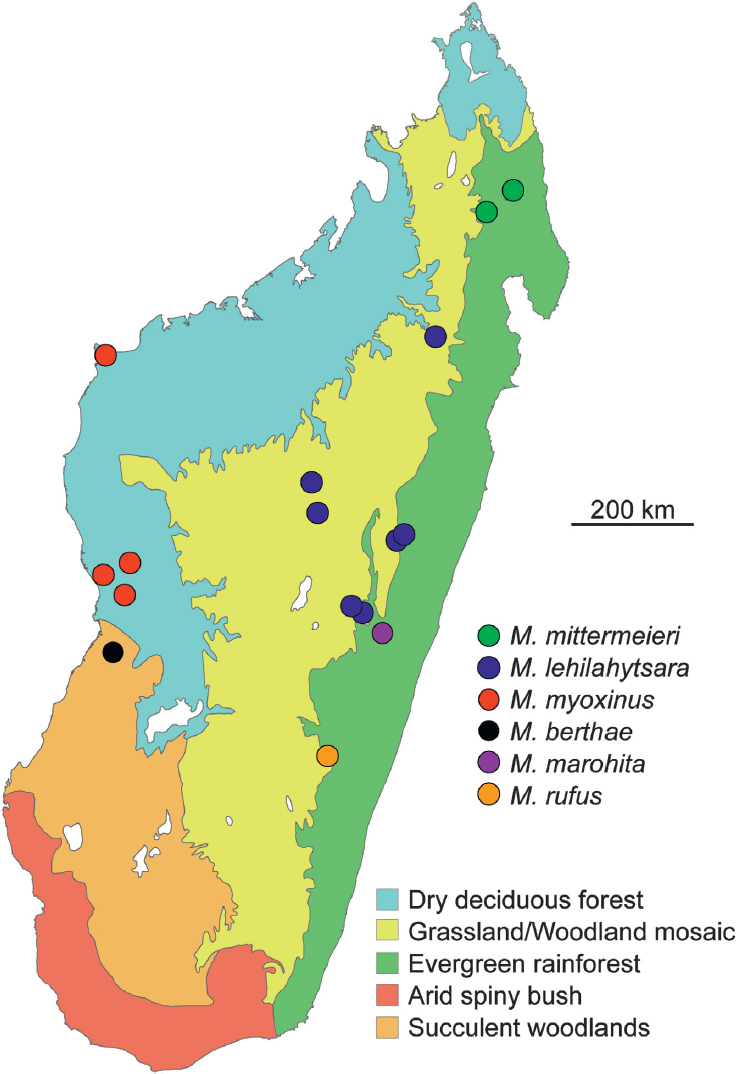
The eastern humid forest, western dry deciduous forest, and the Central Highlands zones are now covered in part with what have been referred to as “secondary grasslands” or savanna composed primarily of Poaceae dominated by the subfamily Gramineae and subject to frequent burning. Today, the Central Highlands forms a stark habitat separation between the mesic zones of the east and the arid habitats of the west and south (Fig. 12.1). It has been the subject of ongoing debate whether this grassland formation is entirely the result of human-mediated transformation or whether it is better viewed as a landscape that has been modified from the original native wooded savanna interspersed with areas of forest (Bond et al., 2008; Goodman and Jungers, 2014). Our definition of “wooded savanna” is structurally very similar to the Miombo woodlands of southern Africa, which has irregular canopy cover and contains herbaceous plants, including grasses. The classic view of Madagascar’s natural vegetation (hereafter referred to as the “forest hypothesis”) holds that Madagascar was blanketed by closed-canopy forest across its entirety before the arrival of humans and that a 90% reduction in forest cover occurred primarily through human agency. Supporting this hypothesis, a recent stable isotope analysis from calcium carbonate cave deposits from Anjohibe Cave in the northwest found evidence for a rapid and complete transformation from a flora dominated by C3 plants to a C4 grassland system over the course of a single century, coincident with early human habitation of this portion of the island (Burns et al., 2016). This view, however, leaves unanswered the degree to which intermediate habitats already might have been subject to Quaternary climatic cycles, including the impacts of natural fires, before the arrival of humans as recently as 2,000–4,000 y BP (Dewar and Wright, 1993; Dewar et al., 2013).
Alternatively, a global analysis of the species richness, levels of endemism, and phylogenetic placement of Malagasy grasses indicates that naturally occurring grass formations have long been a feature of Madagascar’s prehuman vegetation, existing extensively throughout the landscape from the Neogene (Vorontsova et al., 2016). An extension of these findings suggests that the grassland savanna that presently characterizes the Central Highlands is thus a remnant of the former naturally occurring
graminae vegetation, a hypothesis hereafter referred to as the “grassland hypothesis.” An intermediate and more nuanced view of prehuman vegetation in Madagascar, hereafter referred to as the “mosaic hypothesis,” holds that the Central Highlands were characterized by a mixture of closed-canopy forest and wooded savanna, with some regions being open and others closed with dense tree growth, and with marshlands presumably being partially dominated by Poaceae (Goodman and Jungers, 2014). The most detailed available palenological record in support of the mosaic hypothesis comes from a 40-m core of lake sediment collected from Lake Tritrivakely near Antsirabe in the center of the island (Gasse and Van Campo, 2001). The core spans ~150,000 years and shows that six cycles of warming and cooling occurred during this period. Coincident with these cycles was a progressive shift from heathland, to grassland, to grassland–forest mosaic, with a return to ericaceous heath in the coldest periods (Dewar, 2014). This view of Madagascar’s prehuman vegetation has been developed over years of study focusing on the analysis of pollen spectra and charcoal influx from lake sediments across the Central Highlands (Burney, 1987, 1997; Gasse et al., 1994; Burney et al., 1997) and holds that this mosaic environment would have become fully established in the Quaternary, with grass formations being a far more recent feature of the Malagasy landscape than is proposed in the grassland hypothesis.
THE CENTRAL HIGHLANDS RUBICON
Our study aims to examine the relationship of the western and eastern zones and the extent to which the hypothesized Central Highland habitat matrix between these zones provided conduits for the dispersal of forest-dwelling mammals. There are a number of questions to be tested: Is the contemporary sharp habitat divide between the wet east and dry west biomes natural, or is it the remnant of a transitional east–west cline? If the latter, what would have been the ecological characteristics of the intervening Central Highlands? What effects have ecological separations and/or corridors had on the distribution and evolution of Madagascar’s biota? Most importantly, when and how might forest-dwelling terrestrial vertebrates have dispersed between eastern and western habitats?
To address these questions, we examine phylogenetic and geogenetic (Bradburd et al., 2016) patterns in mouse lemurs (genus Microcebus) to determine both the timing and directionality of dispersal events between eastern and western Madagascar. We also investigate patterns of genetic structure within two broadly distributed species, one from western Madagascar and one from the Central Highlands, to determine if there are differential signatures of continuous versus discontinuous habitat in the two species. Such differential patterns will have potential consequences for the
interpretation of the prehuman landscape and its impact on mouse lemur evolution. If the forest hypothesis applies, and the grassland savannas of the Central Highlands are an entirely recent phenomenon, we would expect to see extensive and recent patterns of connectivity among populations that presently are distributed in eastern and western biomes. Alternatively, if the grassland hypothesis holds, we should observe a strong and ancient separation between the species distributed in the eastern and western biomes. If, however, the mosaic hypothesis applies, we would expect to see a fairly rapid and relatively recent (i.e., Quaternary-age) diversification of lineages. Moreover, in the mosaic scenario, it is likely that the pulsing cycles of temperature and humidity characteristic of the Quaternary would have left genetic signatures of population isolation and reconnection among contemporary populations (Wilmé et al., 2006).
WHY MOUSE LEMURS?
Mouse lemurs are the world’s smallest living primates, ranging in average adult body weight from 30 g in Microcebus berthae to ~80 g in Microcebus marohita (Rasoloarison et al., 2013). They are found in virtually every forested habitat in Madagascar and are known to have the highest reproductive rate, and thus the “fastest” life history, of all primates (Dewar and Richard, 2007). Martin (1972) reported that in natural populations mouse lemurs may give birth for the first time at the age of 12 mo. This finding has been confirmed in other natural populations (Eberle and Kappeler, 2004) and also in the captive colony of Microcebus murinus housed at the Duke Lemur Center (Zehr et al., 2014). Field studies of various species within the genus have further verified that they are highly seasonal breeders, with female estrous showing a periodicity close to 365 days (Blanco, 2011). Thus, mouse lemurs are likely to track environmental variation with fine temporal resolution, with the added benefit of relatively precise generation times that can readily be translated parametrically in coalescent-based modeling methods. Some of these advantages for phylogeographic study in Madagascar have been noted by others (Schneider et al., 2010). Notably, some species of mouse lemur can occur in high densities in degraded forests and along forest ecotones and can thrive in areas with invasive fruiting trees. Thus, of all of the endemic Malagasy primates, they are perhaps most likely to be robust to human-mediated landscape modification (Gerard et al., 2015), although this ecological flexibility appears to be true for some, but not all, species (Schäffler et al., 2015). Despite their diminutive size, they have been observed to use terrestrial means for dispersal between trees.
Ongoing work from the past two decades has shown conclusively that although the morphological differences among species of mouse lemur can
be subtle, their genetic and ecological differences are consistent with an evolutionary radiation that presently contains 24 described species (Schmid and Kappeler, 1994; Thalmann and Rakotoarison, 1994; Ganzhorn and Schmid, 1998; Zimmermann et al., 1998; Rasoloarison et al., 2000; Yoder et al., 2000; Lahann et al., 2006; Louis et al., 2006; Craul et al., 2007; Heckman et al., 2007; Weisrock et al., 2010; Rakotondranary and Ganzhorn, 2011; Rasoloarison et al., 2013; Hotaling et al., 2016), with the basal diversification occurring as long ago as 9–10 Ma (Yang and Yoder, 2003; Yoder and Yang, 2004). Several studies have shown strong support for three deep lineages, one that contains M. murinus plus Microcebus griseorufus, another deeply diverged lineage represented by Microcebus ravelobensis, Microcebus danfossi, and Microcebus bongolavensis, and a third lineage that comprises all other mouse lemur species, including strong support for a distal subclade containing M. berthae, Microcebus rufus, and Microcebus myoxinus (Yoder et al., 2000; Heckman et al., 2007; Weisrock et al., 2010, 2012). This latter subclade is especially intriguing, given that M. rufus, an eastern humid-forest animal, is markedly divergent both ecologically and geographically from M. berthae and M. myoxinus, both of which occur in western dry deciduous forests. The observation that this relatively recently diverged clade contains both eastern and western representatives has prompted speculation about the existence of former forested corridors between eastern and the western Madagascar (Yoder et al., 2000).
Our study aims to examine the fit of mouse lemur phylogeography to hypotheses regarding the natural plant community composition of Madagascar’s Central Highlands. To test the fit to the three paleoenvironmental hypotheses described above, we focus on phylogenetic and geogenetic patterns in five species of mouse lemur: two with eastern distributions (Microcebus mittermeieri and M. rufus), two with western distributions (M. myoxinus and M. berthae), and one that has been proposed to be limited to the Central Highlands (M. lehilahytsara) (Radespiel et al., 2012). Phylogenetic analysis of two mtDNA loci, cytochrome b (cytb) and cytochrome oxidase II (cox2), was conducted to place the five targeted species within the larger evolutionary framework of the mouse lemur radiation. A genomewide restriction site-associated DNA sequencing (RADseq) approach was used to assess genetic diversity among and within the five targeted species and to test the fit of these data to both spatial and historical predictions associated with the forest, grassland, and mosaic hypotheses. The genomewide SNP data were analyzed with coalescent methods to estimate the species tree structure and its congruence with the mtDNA gene tree and to estimate divergence times for the five targeted species.
RESULTS AND DISCUSSION
mtDNA Tree
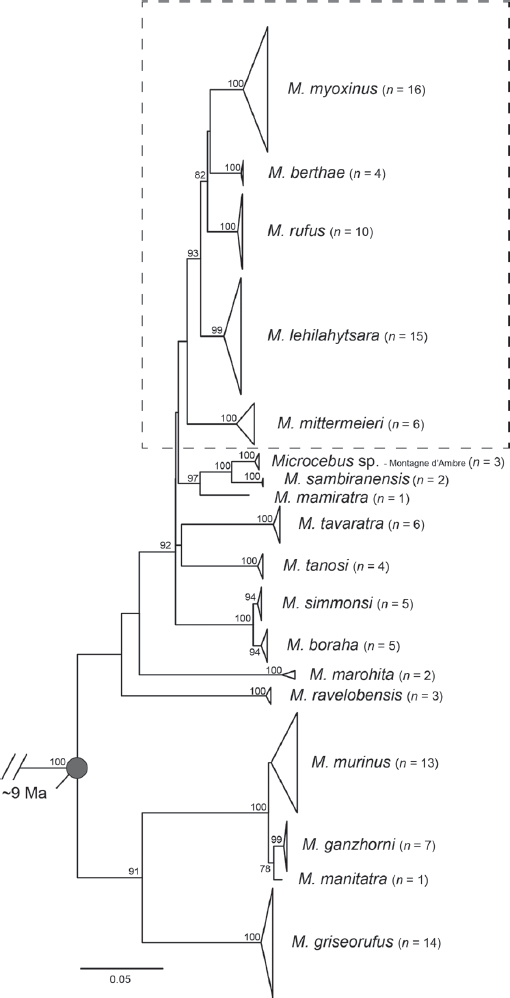
Maximum likelihood trees for concatenated cytb and cox2 loci largely agree with previous analyses (Weisrock et al., 2010; Hotaling et al., 2016). Although the mtDNA analysis sampled only 17 of the 24 currently described mouse lemur species, the fundamental pattern found in previous studies is repeated here: Described species are resolved as reciprocally monophyletic, and the phylogeny shows a basal split between a clade formed by M. murinus plus M. griseorufus and all other species. Within the much more taxonomically diverse sister lineage, two species (M. marohita and M. ravelobensis) show long branches radiating from their shared ancestral node, suggesting that these species have long been diverged from other species within the sister lineage. The very short internal branches that separate the remaining 11 species within this lineage suggest that they experienced rapid radiation, making phylogenetic resolution highly problematic. The mtDNA gene tree illustrates the depth and diversity of the mouse lemur radiation through time and across the geographic expanse of Madagascar (Fig. 12.2). The clade containing the eastern M. rufus plus western M. myoxinus and M. berthae continues to receive robust support with the Central Highlands species M. lehilahytsara as its sister lineage, also in agreement with previous studies (Weisrock et al., 2010; Hotaling et al., 2016).
Species Tree Estimation and Divergence Times
The species tree was generated from double digest restriction site-associated DNA (ddRAD) libraries from 30 individuals across the five target species and a single outgroup, M. marohita. Paired-end 150-bp sequencing on two Illumina NextSeq runs yielded 557.3 million reads. After several quality-filtering steps (Methods) the dataset was trimmed to a total of 340.5 million reads across 29 samples for analysis with the software pyRAD (Eaton, 2014). pyRAD yielded 124,916 total loci after the removal of putative paralogs and implementation of filtering criteria. The 29 samples averaged 57,845 ± 13,901 loci. Among the four taxa with two or more sequenced samples, the average number of loci was 60,076 ± 10,387.
The species tree estimated with BPP (Yang, 2015) resulted in a posterior distribution with perfect (100%) statistical support for all nodes (Fig. 12.3). The tree is largely congruent with the mtDNA gene tree for the five targeted species (shown by a dashed box in Fig. 12.2), with a critical difference: M. rnfus, endemic to southeastern rainforest, is found to be the sister species to M. berthae from the western regions of Madagascar, south of the Tsiribihina River (node B in Fig. 12.3). M. myoxinus, also from
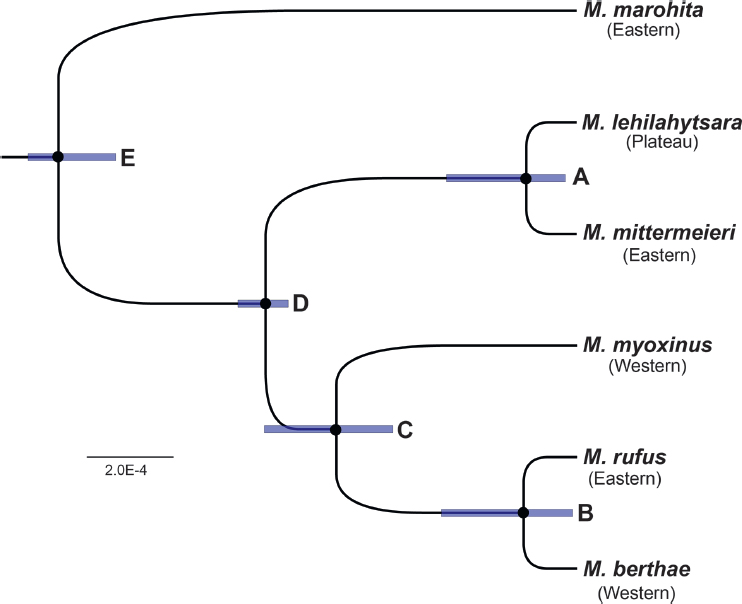
western Madagascar, is placed as the sister lineage to the M. berthae plus M. rufus clade (node C in Fig. 12.3). The species trees inferred with SVDQuartets and SNAPP (SI Methods1) are identical to the BPP tree, with both also yielding maximum support for all nodes. Using BPP, posterior branch lengths (τ) and nucleotide diversity (θ = 4Nµ) were converted to geological times of divergence and effective population sizes by using priors on the
__________________
1 Supporting information for this chapter, which includes additional Methods text, Figures S1 through S3, and Dataset SI, is available online at www.pnas.org/lookup/suppl/doi:10.1073/pnas.1601081113/-/DCSupplemental. Reference numbers in the SI Methods text refer to the original PNAS article.
TABLE 12.1 Ancestral Effective Population Size (Ne) and Estimated Divergence Times
| Node | N (× 103) | 95% CI | Divergence Time, ka | 95% CI |
|---|---|---|---|---|
| E | 308 | 211, 450 | 539 | 346, 822 |
| D | 19.7 | 11.2, 31.2 | 324 | 207, 495 |
| A | 82.7 | 39.1, 13.3 | 52.5 | 10.6, 159 |
| C | 13.8 | 2.13, 34.7 | 250 | 147, 403 |
| B | 65 | 18.1, 11.9 | 55.4 | 4.56, 153 |
NOTE: Node labels correspond to those identified in Fig. 12.3. Results were derived using BPP (Yang, 2015).
per-generation mutation rate and the generation time. This analysis indicates that the ancestral node for the targeted species has a posterior mean age of ~540 ka (Table 12.1). The divergence times between M. lehilahytsara and M. mittermeieri (node A in Fig. 12.3) and between M. berthae plus M. rufus (node B in Fig. 12.3) are much more recent, with both divergences occurring ~55 ka [although note the considerable uncertainty represented by the 95% credible intervals (CIs)].
The age of the basal radiation of these five species is placed well within the Quaternary when climatic changes associated with glacial and interglacial periods would have radically and episodically desiccated much of the Central Highlands (Burney, 1986, 1987, 1988, 1997; Gasse et al., 1994). Thus, the results of our study would appear to agree with other work in which Quaternary climatic and vegetation changes have been invoked to explain patterns of diversity and speciation in different groups of lemurs (Wilmé et al., 2006) and in mouse lemurs in particular (Olivieri et al., 2008; Schneider et al., 2010).
Geogenetic Analysis
One of the intriguing results of this study was the discovery of a population of M. lehilahytsara from a tiny (<2 km2) forest patch known as “Ankafobe,” in close proximity to a series of fragmented forest parcels within the Ambohitantely protected area (Fig. 12.4). Although only three individuals from this locality were sampled, the level of genetic diversity among these animals at the mtDNA locus is greater than 1% and exceeds that of any other single locality from which this species has been sampled. Although geographic sampling is far too limited for definitive conclusions, such a pattern would be consistent with the hypothesis that remnant forest patches such as Ankafobe and Ambohitantely, although clearly impacted
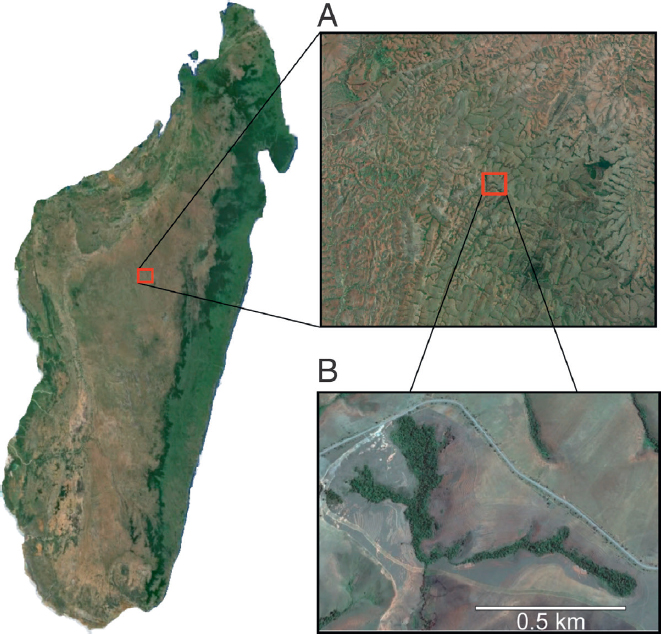
by recent degradation caused by anthropogenic agency, may have experienced alternating episodes of connection, isolation, and reconnection with similar relict forests across the Central Highlands. Taking this hypothesis to its logical extreme, patterns of genetic diversity within and among these relictual habitats thus might share a signature of genetic diversification driven by long-term isolation but punctuated by periods of gene flow. These fragments thus might be described as “museums” of genetic diversity within an otherwise desolated grassland savanna.
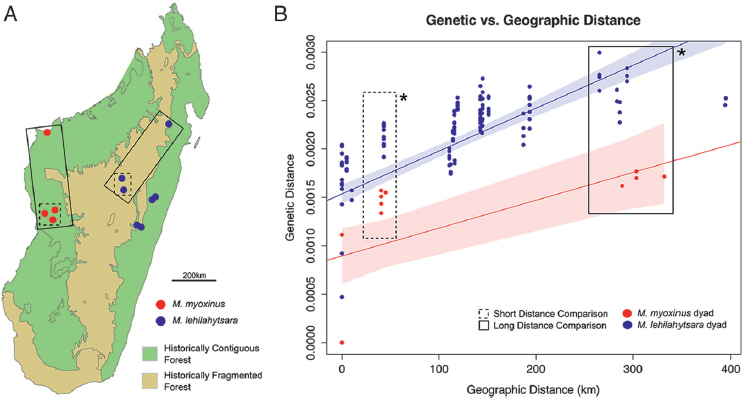
Only unlinked SNPs with no missing data were used for geogenetic analysis using the software package SpaceMix (Bradburd et al., 2016). There were 1,583 SNPs without any missing data across the four taxa (M. lehilahytsara, M. rufus, M. myoxinus, and M. mittermeieri). However, when individuals from the same sampling location were consolidated and analyzed together, this number increased to 7,303. We used this latter dataset for all final SpaceMix analyses. As a potential means for testing the punctuated gene flow hypothesis, we compared patterns of genetic diversity within M. lehilahytsara to those within M. myoxinus. The two species have inferred ranges that are equivalent in geographic area (as measured in square kilometers), although in the case of M. myoxinus, there is the null expectation that ancestral habitat would have been largely continuous before anthropogenic fragmentation. The ancestral habitat for M. lehilahytsara, on the other hand, is unknown and dependent on the inferred conditions consequent to the forest, grassland, and mosaic hypotheses. By comparing genetic structure in a geographic range among contiguous forests (M. myoxinus) equivalent in area (as measured by square kilometers) with a geographic range among mosaic forests within the Central Highland species (M. lehilahytsara), we see that the two species show significantly different patterns of genetic distance relative to geographic distance (Fig. 12.5). The t-tests yielded statistically significant differences in genetic distance in paired long-distance dyads (average P = 9.80 × 10⁻⁴ across the 1,000 randomly sampled t-tests), paired short-distance dyads (average P = 8.59 × 10⁻³), and when considering long and short dyads together (average P = 1.34 × 10⁻⁴) (Figs. S1–S3). At both short and long geographic distances, the intraspecific genetic distance within M. myoxinus was significantly lower than that of the closely related M. lehilahytsara. Given that M. myoxinus and M. lehilahytsara presumably inhabited their respective habitats for millennia before the arrival of humans, the starkly higher genetic distances relative to geographic distances in M. lehilahytsara suggests that this species has long lived in a mosaic environment.
The geogenetic analysis yields robust support for both the phylogenetic and the genetic distance analyses (Fig. 12.6). SpaceMix represents the geogenetic locations of the samples (the colored haloes) relative to their true geographic location (the solid dots), with arrows pointing in the direction of hypothesized genetic history and admixture. Each pair of sampling and geogenetic locations represents a population, summarized by allele count, and the halo corresponds to a 95% confidence interval of the spatial location of the SNP profile. The size of the halo decreases with the number of individuals in the population.
There are notable patterns regarding ancestral connections between the east and the west. The first, and probably most obvious, pattern is
the common geogenetic space shared by M. rufus (from the east) and M. berthae (from the west), consistent with the species tree in which they are shown to be sister lineages. Although the actual geographic coordinates of M. rufus fall well into the southeastern forests of Madagascar, the genomic signature recovered from the ddRAD data place this species squarely in the center of the island, forming a genetic “bridge” between M. lehilahytsara and M. myoxinus. This result is in contradiction to the expectation that western neighbors M. myoxinus and M. berthae should share a more recent ancestry, given their proximity relative to the geographically distant M. rufus. Instead, there is a strong separation of M. myoxinus and M. berthae, consistent with the biogeographic separation of these species by the Tsiribihina River, suggesting that the river is a significant barrier
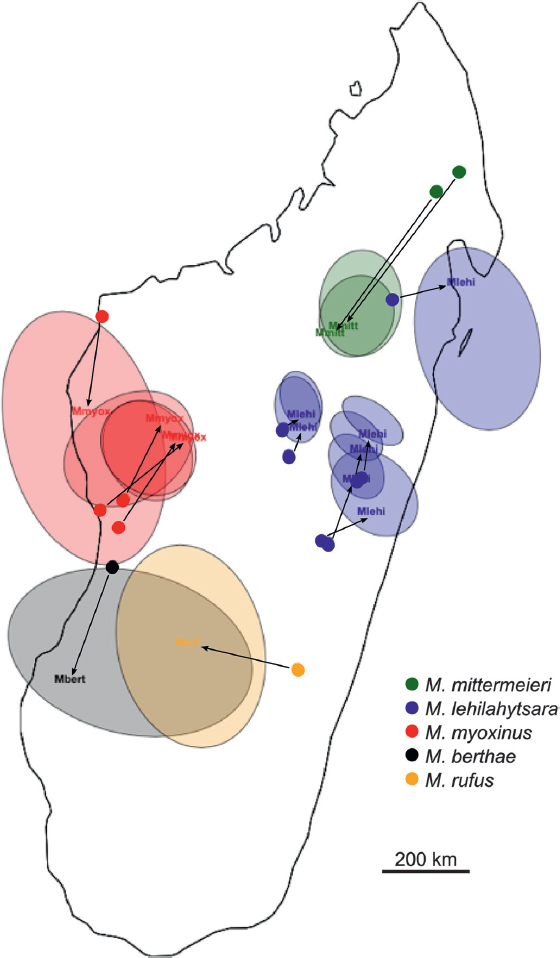
to gene flow. This biogeographic barrier is further emphasized given that the M. myoxinus dots are pulled northward and M. berthae dots pushed southward, opposite of what would be expected in the presence of gene flow between these two species.
There is also a strong geogenetic signal regarding the inference of ancestral habitat type in the Central Highlands. Although the full set of M. myoxinus samples (four populations) are all pulled to a central location, and all four geogenetic confidence intervals overlap, the opposite is true for M. lehilahytsara. In that species, measured over a similar geographic range, the populations do not share any common geogenetic space. Even when the northern M. lehilahytsara population is excluded, the six southernmost populations occupy two distinct geogenetic spaces. This finding is in robust agreement with the results of the genetic vs. geographic distance plots, indicating that a substantial intraspecific genetic structure is built up in M. lehilahytsara relative to M. myoxinus. Moreover, the shift of M. mittermeieri from the northeastern corner of the island toward the south and into the geographic range of M. lehilahytsara is a further indication that this putative plateau specialist displays remarkable levels of genetic diversity, despite its fragmented distribution.
CONCLUSIONS
The results of this study have specific implications regarding the timing and geographic patterns of divergence events among the five species of Microcebus targeted for phylogeographic analysis, as well as more general implications for the inferred habitat of the Central Highlands during the period of their diversification. Species-tree analysis of a robust genomewide SNP dataset, using three independent analytic toolkits (BPP, SNAPP, and SVDQuartets) shows unequivocal support for a rapid radiation of a large ancestral population (node E in Table 12.1 and Fig. 12.3) into five geographically separated species. This diversification is estimated to have commenced at ~540 ka, with the two most terminal divergence events occurring at ~55 ka (see nodes A and B in Fig. 12.3). The hypothesized timing of these events is coincident with paleoclimatological patterns in the African and Indian Ocean regions that suggest tremendous climatological variation (Cannon et al., 2009; Scholz et al., 2011; Blome et al., 2012). Even so, the inferred ages are more recent than might have been predicted, given previous analyses of divergence times that used phylogenetic methods (Yang and Yoder, 2003; Yoder and Yang, 2004).
What could not have been predicted is the inferred paleogeographic positioning of these five species, closely related in geological time but broadly dispersed geographically. The most surprising pattern is the close phylogenetic relationship between M. rufus and M. berthae (node B in
Fig. 12.3). M. rufus is native to the humid forests of the southeast, whereas M. berthae occupies a restricted range within the dry forests of western Madagascar. Thus, these species are presently separated by the Rubicon of the Central Highlands, yielding the preconception that longitudinal dispersal should have been impossible. It is here that a consideration of the phylogenetic and geogenetic patterns among the targeted species allows for discrimination among the forest, grassland, and mosaic hypotheses. If the forest hypothesis is applicable, we would not expect to see a divergence that is tens of thousands of years old. Rather, the forest hypothesis would predict ease of geographic dispersal until historic times. Conversely, although the grassland hypothesis would predict the separation of eastern and western species, it should do so uniformly across all species and with the expectation of divergence ages on the order of millions of years old rather than the tens of thousands of years found in this study.
The totality of evidence instead points to the mosaic hypothesis, with M. lehilahytsara as something of a telltale species, retaining the signal of a mixed environment of forests and grasslands, perhaps experiencing cyclic episodes of isolation and reconnection. The timescaled phylogeny indicates that although longitudinal dispersal would have been relatively uncomplicated throughout the Pleistocene, ease of dispersal was apparently arrested around 53–55 ka, a time of climate change in the African region (Scholz et al., 2011). In all likelihood, Holocene aridification and rewarming would have promoted natural fragmentation into a mosaic of grasslands and interconnecting woodlands. In fact, the results of this study are congruent, both temporally and geogenetically, with those of Quéméré et al. (2012), who observed similar genetic symptoms of long-term habitat fragmentation in the golden-crowned sifaka (Propithecus tattersalli) in northern Madagascar. We therefore conclude that although the longitudinal dispersal of mouse lemurs across Madagascar was achieved with relative ease throughout the Pleistocene, habitat fragmentation via natural processes was established in the Holocene, yielding the contemporary distribution of Madagascar’s mouse lemurs.
METHODS
Sample Collection
Samples analyzed in this study consisted of 318 samples from previous studies and 22 samples from previously unsampled populations of M. lehilahytsara and M. mittermeieri collected by M.B.B. (Dataset S1). Mitochondrial DNA sequencing was conducted to compare newly collected samples with existing data. The targeted species analysis consisted of ddRAD sequencing of 30 wild-caught mouse lemurs from 15 study sites
and are largely from five closely related species (M. berthae, M. myoxinus, M. rufus, M. lehilahytsara, and M. mittermeieri) and one outgroup (M. marohita). Nine of the ddRAD-sequenced samples were newly collected; the remaining 21 samples were analyzed, in part, in previous work (Yoder et al., 2000; Weisrock et al., 2010).
mtDNA Sequencing
Sequence data were collected from 18 newly collected samples and four previously unsequenced samples for both the cytb and cox2 genes. Approximately 1,140 bp of cytb were amplified using the following primers: TGA-YTA-ATG-AYA-TGA-AAA-AYC-ATC-GTT-G and TCT-CCA-TTT-CTG-GTT-TAC-AAG-ACC-A. Approximately 684 bp of cox2 were amplified using primers L7553 and H8320 (Adkins and Honeycutt, 1994). Cycle sequencing reactions were performed using BigDye Terminator V1.1 following standard conditions, and all samples were sequenced using an Applied Biosystems 3730xl at the Duke Sequencing Core resource. Sequences have been submitted to the National Center for Biotechnology Information (NCBI) under Accession Nos. KX070700–KX070743.
mtDNA Analyses
The full dataset consists of cytb and cox2 sequences for 332 individuals from 26 described species and three undescribed putative species within Cheirogaleidae. These sequences include 318 individuals from previous studies and new data from 14 individuals sequenced for this study. Analyses were conducted using PAUP* version 4.0a149 except where otherwise indicated. Models chosen by corrected Akaike information criteria (AICc) (Burnham and Anderson, 2002) for the three codon positions were SYM+I+G, HKY+I+G, and TrN+I+G, respectively. All selected models include an invariable-sites category with variable sites drawn from a γ distribution (+I+G). Bootstrapping was performed using RAxMLversion 8.2.4 (Stamatakis, 2014) using the closest available model (GTR+I+G, with partitioning by codon position). Bootstrap results were transferred to the optimal PAUP* trees using the SumTrees command available in DendroPy version 4.1.0 (Sukumaran and Holder, 2010). (Additional details are given in SI Methods.)
RAD Genotyping
ddRAD libraries were generated from whole genomic DNA and whole genome amplified DNA following the protocol of Peterson et al. (2012) and Blair et al. (2015). The double digest was completed with the
enzymes SphI and MluCI, and IDT primers were used to barcode uniquely the first paired end of all 30 samples. We used Stacks (Catchen et al., 2013) to demultiplex reads by unique barcode. Given the overall poor quality of the second paired-end read, we dropped those reads from the analysis and used only the first read. We used the program pyRAD (Eaton, 2014) to cluster, align, and call SNPs within the curated ddRAD dataset. All sequence reads used for analysis are available at the NCBI Short Read Archive (study Accession No. SRP073945). (Additional details are given in SI Methods.)
RAD Data Analyses
For the assessment of genetic distances, the R package APE (Paradis et al., 2004) was used, taking as input the concatenated, aligned ddRAD loci. The R package SpaceMix (Bradburd et al., 2016) was run to determine the samples’ geogenetic positions with 95% confidence intervals. SpaceMix was run both for all 29 individuals, yielding 1,583 SNPs, and for all 15 sample sites separately, in which we collapsed the locality data to a single entry in the SpaceMix input matrix, yielding 7,303 SNPs. All SpaceMix analyses were run without any missing data.
Species Tree and Divergence Time Analyses
The program BPP (Yang, 2015), which implements the multispecies coalescent, was used to estimate the species tree topology, branch lengths (τ), and nucleotide diversity (θ = 4Nµ) using whole ddRAD loci (as opposed to SNP data). The posterior of τ and θ can be converted to geological times of divergence and effective population sizes by using priors on the per-generation mutation rate and the generation time (Angelis and dos Reis, 2015). Bayesian analysis using the multispecies coalescent is computationally expensive, so here we used a small dataset to estimate the tree topology and a large dataset to estimate τ and θ values more precisely by fixing the topology to that obtained with the small dataset. Tree topology is identical to that derived using SNAPP and SVDQuartets (SI Methods).
Small Dataset Analysis
The ddRAD loci (82 loci; 11,624 bp) with data for all 30 individuals were analyzed with BPP to obtain the tree topology (BPP’s A01 analysis). The species tree prior was set to uniform rooted trees. The prior for τ is Gamma (2, 250) and for θ is Gamma (2, 1,000). The posterior species tree obtained was identical to that estimated with SNAPP.
Large Dataset Analysis
The RAD-seq fragments (80,662 fragments; 11,247,917 bp) were analyzed for a subset of one individual from each species from our focal ingroup. The use of many sites leads to narrower (more precise) posterior estimates of τ and θ, whereas the use of few individuals reduces the amount of time needed for Bayesian Markov chain Monte Carlo computation. The priors on τ and θ were as for the small dataset. To convert τ and θ values to divergence times (t) and population sizes (N), we sampled values for the mutation rate (µ) and generation time (g) from priors and used these values to calculate posterior estimates of t and N [see Angelis and dos Reis (2015) for details]. The prior on µ was Gamma (27.80, 31.96), which roughly has a 95% prior credible interval (CI) between 0.5 and 1.2 × 10⁻⁸ substitutions per site per generation. This result matches NextGen estimates of the per-generation mutation rate in the laboratory mouse (Uchimura et al., 2015) and human (Scally and Durbin, 2012). The prior on g was Gamma (100, 26.6), which roughly has a 95% prior CI between 3 and 4.5 years.
Estimation of Average Generation Time for Genus Microcebus
We estimated an average generation time for all species of mouse lemurs using a combination of data from both wild and captive populations, yielding an informed estimate of 3.0–4.5 years. Field observations indicate that for eastern humid-forest species, age at first reproduction in wild populations is 10–12 months, with females undergoing estrus and reproduction annually thereafter. Two litters per year can be common for some species and wild populations but is rare in other species and localities (Lahann et al., 2006; Blanco et al., 2015). Captive data for M. murinus at the Duke Lemur Center show that two litters in a single year has occurred only once in 101 litters. Extrapolating from figure 2A in Zohdy et al. (2014), we calculated a survival probability of 0.879–0.0714 * (age in years) that, when extrapolated to 12 years of age, yields 17% for 10 years, 9% for 11 years, 2% for 12 years, and 0% above 12 years. These figures are consistent with observations from animals bred in captivity. Survival probabilities are considerably lower for wild populations, however. In the dry forests of western Madagascar, individuals appear to live only 2–3 years on average (Hämälainen et al., 2014). Based on capture/recaptures at more resource-rich habitats, such as the eastern humid forests, indications are that lifespans are likely longer, with 4 years being a conservative average lifespan. Information from both captive and wild populations indicates that reproductive senescence does not show major effects until 5 years of age in females; thus, it is likely that the period of reproductive fitness exceeds lifespan in natural populations.
Comparison of Genetic and Geographic Distance
The genetic distance (RAD Data Analyses) was compared between populations of similar geographic distances in M. myoxinus and M. lehilahytsara. Individuals were assessed at every possible within-species dyad, and the resulting genetic and geographic distances were plotted to inspect visually for isolation by distance (IBD). Given the relatively low sample count of M. myoxinus compared with M. lehilahytsara, the latter was randomly sampled to conduct a paired, one-sided t-test. Paired short- and long-distance comparisons were tested individually and together for a total of three separate t-tests, each sampling 1,000 times from the measured M. lehilahytsara dyads (Figs. S1–S3).
ACKNOWLEDGMENTS
We thank the Organizers of the Symposium, Francisco Ayala and John Avise, and the invited speakers for an inspiring synthesis of ideas and methods. This paper is very much a reflection of their contributions to the field of phylogeography. We thank the Malagasy authorities for permission to conduct this research and Chris Birkinshaw for suggesting the importance of Ankafobe as an ecological isolate to M.B.B. This study was funded by a grant from the Duke Tropical Conservation Initiative (to A.D.Y.) and by National Science Foundation Grant DEB-1354610 (to D.W.W. and A.D.Y.). This is Duke Lemur Center Publication No. 1322.
All sequence reads used for analysis are available at the National Center for Biotechnology Information (NCBI) Short Read Archive (Study Accession No. SRP073945). Sequences have been submitted to NCBI (Accession Nos. KX070700–KX070743).


