
The committee estimated that the fuel consumption reduction effectiveness for a 24 bar BMEP, 50 percent downsized, turbocharged engine could be approximately 2 percentage points lower than NHTSA’s estimates for the following reasons:
Reason 1: Compression ratio is likely to be reduced to accommodate 91 RON gasoline (87 AKI) in the U.S. instead of European 95 RON gasoline used in the Mahle and Ricardo analyses.
- Compression ratios of engines cited by EPA/NHTSA:
EPA/Ricardo Report (EPA/Ricardo 2011, p. 19): CR = 10.5:1 for full system simulation
Research engines cited in EPA/Ricardo Report (p. 19): Sabre engine, Lotus Engineering, UK (Coltman 2008)
“Operating on regular 95 RON”
CR = 10.2:1Mahle 30 bar BMEP engine (Lumsden 2009)
CR = 9.75
Engine was not tested on 91 RON gasoline, Mahle presentation to NRC committee (Blaxill 2012) - Compression ratios of U.S. turbocharged downsized engines (Mahle Wards Light Duty Engine Chart 2014):
Ford: 2.0L EcoBoost CR = 9.3:1
GM: 2.0L Turbo CR = 9.2:1
1.4L Turbo CR = 9.5:1 - Conclusion 1: U.S. turbocharged engines operating on 91 RON gasoline compared to European engines operating on 95 RON gasoline have approximately a 1.0 lower compression ratio.
- Effect of lower compression ratio on fuel consumption 1.0 CR results in approximately 1.5 percent FC increase (Chapter 2, High Compression Ratio with High Octane Gasoline section)
- Conclusion 2: The 1.0 lower compression ratio of turbocharged engines in the U.S. will have approximately a 1.5 percent increase in fuel consumption relative to the cited European research engines.
Reason 2: Spark retard is likely to be required in some higher load regions encountered in the CAFE drive cycles.
- Apply the criteria from “A review of the Effect of Engine Operating Conditions on Borderline Knock”(Russ 1996) to provide an estimate of the spark retard required for the boost pressures encountered in the CAFE drive cycles.
Criterion for RON change due with a change in compression ratio: 5 RON / 1 CR (This criterion illustrates the reduction in CR required in the U.S. for engines operating on gasoline with 91 RON instead of 95 RON.)
Criterion for RON change with a change in intake pressure: 3-4 RON / 10 kPa (100 kPa = 14.5 psi)
Criterion for RON change with spark retard: 1 RON/1 degree
The pressure ratio at higher speed/load conditions in the CAFE drive cycles was estimated to be 1.5:1. The increase in pressure of 50 kPa (above 100 kPa atmospheric pressure) would result in the need for a
-
15 RON increase by applying the RON/kPa criteria shown above.
With the assumed 91 RON gasoline at these conditions, spark must be retarded, according to the RON/spark retard criteria shown above:
Spark Retard = 15 degrees from MBT (minimum spark advance for best torque)
- Apply the guideline in “Study of the effects of ignition timing on gasoline engine performance and emissions” (Zareei 2013):
15 degrees spark retard: BSFC increases by 6% (at some conditions)
- Conclusion: Spark retard to avoid knock at some conditions on the CAFE drive cycles will result in approximately 6 percent increase in fuel consumption at those conditions and an estimated 0.25 percent increase in fuel consumption on the CAFE drive cycles.
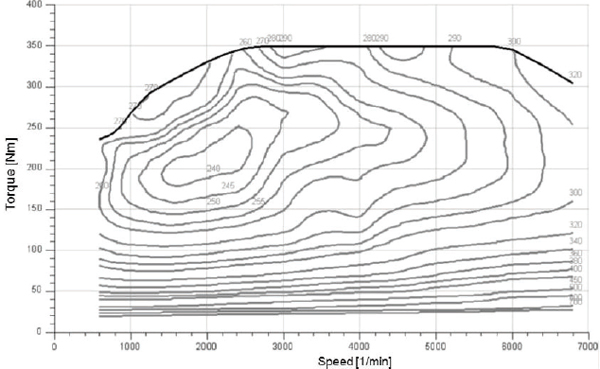
FIGURE J.1 Generic fuel island map for a 3.3L V6 gasoline engine with brake specific fuel consumption in g/kWh.
SOURCE: Dick (2013). Reprinted with permission from SAE paper 2013-01-1272 Copyright © 2013 SAE International.
Reason 3: Wider transmission spans, or modified torque converters, may be used to overcome turbocharged lag during launch (higher engine speeds at launch)
| RPM | Torque lbs-ft (Nm) | Transmission 1st Gear Ratio | Driveshaft Torque (lbs-ft) | BSFC | |
| 3.3L NA Engine: | 1500 | 133 (181) | 4.0:1 | 532 | 240 g/kWh |
| 1.65L TC Engine:a | 1500 | 133 (181) | Torque not achievable at same engine speed due to turbocharger lag | ||
| 1.65L TC Engine:a | 2000 | 100 (136) | 5.3:1 | 530 | 255 g/kWh |
a For the 50 percent downsized engine, torque must be multiplied by 2 to enter Figure J.1.
- The following example is based on the fuel island map shown in Figure J.1. This example is for a
-
moderate launch acceleration rate with a 3.3L naturally aspirated engine and a 50 percent downsized, turbocharged 1.65L engine.
- At launch, the 1.65L turbocharged (TC) engine cannot develop the torque of the 3.3L naturally aspirated (NA) engine due to turbocharger lag.
- - Higher transmission ratio is provided to TC engine for higher torque multiplication.
- - As a result, the same driveshaft torque can be provided.
- - This results in a higher engine speed for the same vehicle speed.
- - Fuel consumption will be increased by 6 percent during these periods (BSFC of 255 g/kWh for the turbocharged, downsized engine compared to 240 g/kWh for the naturally aspirated engine).
- Conclusion: During launch from idle, which occurs 18 times during the FTP-75 drive cycle, fuel consumption of the turbocharged engine will be lower by up to approximately 6 percent and an estimated 0.25 percent increase in fuel consumption on the CAFE drive cycles.
Overall Conclusion: Fuel consumption reduction effectiveness for turbocharged, downsized engines could be approximately 2 percentage points lower than NHTSA’s estimates due to 1) lower compression ratio, 2) the effects of spark retard to avoid knock at higher speed/load conditions, and 3) higher transmission ratios during launch to provide driveshaft torque comparable to the naturally aspirated engine.
REFERENCES
Blaxill, H. 2012. MAHLE Downsizing Demonstrator. Presentation to the National Research Council Committee on Assessment of Technologies for Improving Fuel Economy of Light-Duty Vehicles, Phase 2. Dearborn, Michigan, September 27.
Coltman, D., J.W.G. Turner, R. Curtis, D. Blake, B. Holland, R.J. Pearson, A. Arden and H. Nuglisch. 2008. Project Sabre: A Close-Spaced Direct Injection 3-Cylinder Engine with Synergistic Technologies to Achieve Low CO2 Output. SAE Technical Paper 2008-01-0138.
Dick, A., J. Greiner, A. Locher, and F. Jauch. 2013. Optimization Potential for a State of the Art 8-Speed AT. SAE 2013-01-1272.
EPA/Ricardo. 2010. Computer Simulation of Light-Duty Vehicle Technologies for Greenhouse Gas Emission Reduction in the 2020-2025 Timeframe. EPA-420-R-11-020, December.
Lumsden, G., D. OudeNijeweme, N. Fraser and H. Blaxill. 2009. Development of a Turbocharged Direct Injection Downsizing Demonstrator Engine. SAE Technical Paper 2009-01-1503.
Russ, S. 1996. A review of the effect of engine operating conditions on borderline knock. SAE Technical Paper 960497. doi:10.4271/960497.
Zareei, J., and A.H. Kakaee. 2013. Study of the effects of ignition timing on gasoline engine performance and emissions. Eur. Transp. Res. Rev. 5:109-116.


