
The light-duty vehicle fleet is expected to undergo substantial technological changes in the coming decades. New powertrain designs, alternative fuels, advanced materials and significant changes to the vehicle body are being driven by increasingly stringent fuel economy and greenhouse gas emission standards. By the end of the next decade, new vehicles will be more fuel efficient, lighter, emitting less air pollutants, safer, and more expensive to purchase relative to current vehicles. Given their increased efficiency, these vehicles will be less expensive to fuel than in the absence of such standards. Though the gasoline-fueled spark ignition (SI) engine will continue to be the dominant powertrain configuration even through 2030, such vehicles will be equipped with advanced technologies, materials, electronics and controls, and aerodynamics. And by 2030, the deployment of alternative methods to propel and fuel vehicles and alternative modes of transportation, including autonomous vehicles, will be well underway. In this context, the US Department of Transportation’s National Highway Traffic Safety Administration (NHTSA) requested that the National Research Council (NRC) study the costs, benefits, and issues related to the implementation of new light-duty vehicle technologies.
NHTSA is responsible for fuel economy standards and, together with the US Environmental Protection Agency (EPA), has been progressively tightening Corporate Average Fuel Economy (CAFE) and greenhouse gas (GHG) emission standards. The most recent set of CAFE/GHG standards, termed the National Program,1 cover model years (MY) 2017-2025 and call for an average light-duty vehicle fleet fuel economy of 40.3-41.0 miles per gallon (mpg) by 2021 and 48.7-49.7 mpg by 2025.2 The carbon dioxide (CO2) emission standard by 2025 is 163 grams/mile, which is equivalent to 54.5 mpg if vehicles were to meet this CO2 level entirely through fuel economy improvements.3
Recognizing the uncertainties for setting standards out to 2025, NHTSA is committed to a mid-term review to evaluate progress. Furthermore, under the provisions set out by the Energy Independence and Security Act of 2007, NHTSA does not have the statutory authority for setting CAFE standards for greater than five years at a time; thus, only the MY 2017-2021 CAFE standards can be considered final. Therefore, beginning in 2016, NHTSA and EPA will coordinate a mid-term review that must be finalized by April 2018. In conjunction with EPA and the California Air Resources Board, NHTSA will perform a joint technical analysis as part of its rulemaking for the MY 2022-2025 standards. This NRC study is designed to feed into the mid-term review and provide an independent review of technologies and the CAFE program more generally. The full task statement is in Appendix A.
TECHNOLOGIES FOR REDUCING FUEL CONSUMPTION
The committee’s report discusses a wide range of technologies and opportunities for reducing fuel consumption in light-duty vehicles. Figure S.1 demonstrates some of the progress to date and remaining needs for meeting these stan-
_____________
1 The National Program is the combination of NHTSA’s CAFE program and EPA’s light-duty vehicle GHG emissions program. The first phase of the National Program covered MY 2012-2016 vehicles.
2 As discussed later in the summary and in the body of the report, the National Program uses a footprint-based standard that means that compliance for each manufacturer is not a pre-determined target but dependent on the mix of vehicles sold each year. For these purposes, vehicle footprint is defined as the average track width of a vehicle multiplied by its wheelbase. The higher mpg values are based on the agencies’ projections using a MY 2008 baseline; the lower mpg values are projections using a MY 2010 baseline.
3 Reducing air conditioning leakage and deploying low greenhouse warming potential refrigerants are included as compliance options in the GHG standards but not the CAFE program, since they reduce GHGs but not fuel consumption.
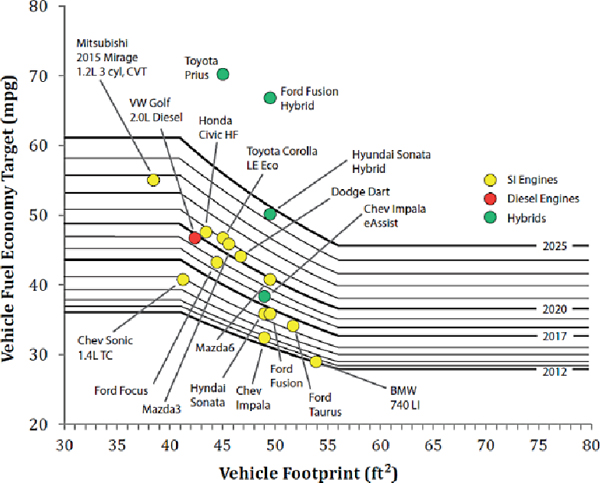
dards. It shows the official EPA certification fuel economy values compared to CAFE targets for particular vehicles given their respective footprints. These vehicles have already incorporated some of the technologies identified by NHTSA and represent a range of technologies and powertrains in the passenger car segment. It includes many high volume models. Most of the vehicles use spark-ignition gasoline engines and demonstrate the potential for conventional technologies to meet these standards. This figure shows fuel economy values for SI engines clustered around the 2016 MY targets and between the 2019 and 2021 MY targets. The outliers on this figure are also significant. The hybrids high fuel economy show why auto manufacturers might pursue these technologies as part of a strategy to meet the new standards. Also notable is the largest footprint vehicle on this figure that has many of the technologies for improving fuel economy but only meets the 2012-2013 targets. It demonstrates that implementing these technologies can be used to improve performance rather than fuel economy.
ESTIMATED FUEL CONSUMPTION REDUCTIONS AND COST
A central task for the committee was to develop estimates of the cost and potential fuel consumption reductions for technologies that might be employed from 2020 to 2030. This is a challenging task given the inherent difficulty in projecting technology outcomes so far into the future. In order to accomplish this task, the committee focused its efforts on projecting technology effectiveness and costs in years 2017, 2020, and 2025. The committee found the analysis conducted by NHTSA and EPA in their development of the 2017-2025 standards to be thorough and of high caliber on the whole. In particular, the committee notes that the use of full vehicle simulation modeling in combination with lumped parameter modeling has improved the Agencies’ estimation of fuel economy impacts. Increased vehicle testing has also provided input and calibration data for these models. Similarly, the use of teardown studies has improved the Agencies’ estimates of costs. The committee assessed the methodologies and assumptions used to develop these estimates and then conducted its own evaluation, giving greatest attention
to those technologies that have large potential benefits. This work relied on committee expertise and analysis; presentations from and discussions with agency experts, auto manufacturers, suppliers, and others; and information contained in regulatory documents, academic literature, and press accounts. Using these same sources, the committee also considered technologies not included in the Agencies’ analysis but in many cases had difficulty obtaining sufficient information, especially on costs. Therefore, in some cases specific conclusions especially on costs cannot be made for technologies not considered by the Agencies.
Tables S.1 and S.2 show the committee’s estimates of fuel consumption benefits and direct manufacturing costs for technologies. The committee provides the benefit estimates for the individual technologies in Table S.1, which remain constant through the time frame, and the costs for 2025 in Table S.2. The committee focused on estimates of direct costs rather than total costs due to the uncertainties around mark-up factors discussed in Chapter 7. Chapter 8 and its appendices contain the complete tabulation of the committee’s cost and benefit estimates and the comparison to the Agency estimates. The estimates are based on the technological assessments in Chapters 2-6.
Based on its analysis, the committee concurred with the Agencies’ costs and effectiveness values for many technologies. In other cases the committee developed estimates that differed from the Agencies’ values. For some technologies, committee members held different views on the best estimate of cost and effectiveness; these are represented in the different values in Tables S.1 and S.2. In such cases, the committee feels that both values are supported by the available data and analysis. It is important to note that these values are not meant to represent the full range of possible values for technology cost and effectiveness, but rather the different possible most likely values based on expert views represented on the committee.
Although the focus of the committee was individual technologies, it is valuable to consider vehicles of the future and the technology packages they might include. In doing selected technology pathway analyses, the committee considered how the order of technology application might impact the effectiveness of an individual technology; how the application of multiple technologies in a pathway prioritized by cost effectiveness might produce overall cost and fuel consumption reductions; and how alternative approaches and technologies could provide additional reductions in fuel consumption at lower cost increments. The committee found that understanding the base or null vehicle, the order of technology application, and the interactions among technologies are critical for assessing the costs and effectiveness for meeting the standards. It also noted that flexibilities contained within the standards in the form of air conditioning efficiency credits and off-cycle credits can reduce compliance costs.
Due to the committee’s limited ability to model fleet and vehicle models in a more detailed manner, it did not estimate compliance costs for the MY2017- 2025 standards. Furthermore, the committee notes that a simple “roll up” of the its cost and effectiveness estimates, examples of which are provided in Chapters 2 and 8 for a specific example vehicle, cannot be used to estimate future compliance costs without similar roll-ups for all representative vehicles together with the consideration of compliance flexibilities discussed in Chapter 10.
Recommendations: While the committee concurred with the Agencies’ costs and effectiveness values for a wide array of technologies, in some cases the committee developed estimates that significantly differed from the Agencies’ values. Therefore, the committee recommends that the Agencies pay particular attention to the reanalysis of these technologies in the mid-term review (Recommendation 8.2). The committee also recommends that the Agencies establish a new definition of a “null” vehicle, representative of the most basic vehicle in the 2016 MY time frame as well as a baseline 2016 MY fleet reflecting actual technology penetration rates (Recommendation 8.1). This will assist in distinguishing between technologies available for the MY 2017-2025 CAFE targets and technologies that have already been applied to reach the MY 2016 CAFE targets. Further, the committee notes that the use of full vehicle simulation modeling in combination with lumped parameter modeling and teardown studies contributed substantially to the value of the Agencies’ estimates of fuel consumption and costs, and it recommends they continue to increase the use of these methods to improve their analysis. The committee recognizes that such methods are expensive but believes that the added cost is well justified because it produces more reliable assessments (Recommendation 8.3).
SPARK-IGNITION ENGINES
The spark-ignition (SI) engine fueled with gasoline is by far the primary powertrain configuration in the United States for light-duty vehicles and will continue this dominance through the 2025 timeframe and likely beyond. The committee applied technologies in the order of cost effectiveness and engineering requirements to estimate the effectiveness and costs of the technologies in the 2017 to 2025 time frame. The committee focused on turbocharged, downsized engines in conjunction with other SI technologies to replace larger displacement, naturally aspirated engines. This is the pathway considered by the Agencies in the NHTSA/EPA compliance demonstration path4 to be a major option for reducing fuel consumption to meet the standards. The committee estimated
_____________
4 The Agencies developed what the committee termed the “compliance demonstration path” representing a cost effective set of model-specific technology packages that auto manufacturers could adopt to meet the standards. Although the Agencies’ analysis demonstrates a possible technology path to compliance, auto manufacturers will plot their own future course to compliance.
TABLE S.1 NRC Committee’s Estimated Fuel Consumption Reduction Effectiveness of Technologies
| Percent Incremental Fuel Consumption Reductions: NRC Estimates | |||||||||||||||||||
| Midsize Car I4 DOHC | Large Car V6 DOHC | Large Light Truck V8 OHV | |||||||||||||||||
| Spark Ignition Engine Technologies | Abbreviation | Most Likely | Most Likely | Most Likely | Relative To | ||||||||||||||
| NHTSA Technologies | |||||||||||||||||||
| Low Friction Lubricants - Level 1 | LUB1 | 0.7 | 0.8 | 0.7 | Baseline | ||||||||||||||
| Engine Friction Reduction - Level 1 | EFR1 | 2.6 | 2.7 | 2.4 | Baseline | ||||||||||||||
| Low Friction Lubricants and Engine Friction Reduction - Level 2 | LUB2_EFR2 | 1.3 | 1.4 | 1.2 | Previous Tech | ||||||||||||||
| VVT- Intake Cam Phasing (CCP - Coupled Cam Phasing - OHV) | ICP | 2.6 | 2.7 | 2.5 | Baseline for DOHC | ||||||||||||||
| VVT- Dual Cam Phasing | DCP | 2.5 | 2.7 | 2.4 | Previous Tech | ||||||||||||||
| Discrete Variable Valve Lift | DVVL | 3.6 | 3.9 | 3.4 | Previous Tech | ||||||||||||||
| Continuously Variable Valve Lift | CVVL | 1.0 | 1.0 | 0.9 | Previous Tech | ||||||||||||||
| Cylinder Deactivation | DEACD | N/A | 0.7 | 5.5 | Previous Tech | ||||||||||||||
| Variable Valve Actuation (CCP + DVVL) | VVA | N/A | N/A | 3.2 | Baseline for OHV | ||||||||||||||
| Stoichiometric Gasoline Direct Injection | SGDI | 1.5 | 1.5 | 1.5 | Previous Tech | ||||||||||||||
| Turbocharging and Downsizing Level 1 - 18 bar BMEP 33%DS | TRBDS1 | 7.7 - 8.3 | 7.3 - 7.8 | 6.8 - 7.3 | Previous Tech | ||||||||||||||
| Turbocharging and Downsizing Level 2 - 24 bar BMEP 50%DS | TRBDS2 | 3.2 - 3.5 | 3.3 - 3.7 | 3.1 - 3.4 | Previous Tech | ||||||||||||||
| Cooled EGR Level 1 - 24 bar BMEP, 50% DS | CEGR1 | 3.0 - 3.5 | 3.1 - 3.5 | 3.1 - 3.6 | Previous Tech | ||||||||||||||
| Cooled EGR Level 2 - 27 bar BMEP, 56% DS | CEGR2 | 1.4 | 1.4 | 1.2 | Previous Tech | ||||||||||||||
| Other Technologies | |||||||||||||||||||
| By 2025: | |||||||||||||||||||
| Compression Ratio Increase (with regular fuel) | CRI-REG | 3.0 | 3.0 | 3.0 | Baseline | ||||||||||||||
| Compression Ratio Increase (with higher octane regular fuel) | CRI-HO | 5.0 | 5.0 | 5.0 | Baseline | ||||||||||||||
| Compression Ratio Increase (CR~13:1, exh. scavenging, DI (aka Skyactiv, Atkinson Cycle)) | CRI-EXS | 10.0 | 10.0 | 10.0 | Baseline | ||||||||||||||
| Electrically Assisted Variable Speed Superchargera | EAVS-SC | 26.0 | 26.0 | 26.0 | Baseline | ||||||||||||||
| Lean Burn (with low sulfur fuel) | LBRN | 5.0 | 5.0 | 5.0 | Baseline | ||||||||||||||
| After 2025: | |||||||||||||||||||
| Variable Compression Ratio | VCR | Up to 5.0 | Up to 5.0 | Up to 5.0 | Baseline | ||||||||||||||
| D-EGR | DEGR | 10.0 | 10.0 | 10.0 | TRBDS1 | ||||||||||||||
| Homogeneous Charge Compression Ignition (HCCI) + Spark Assisted CIb | SA-HCCI | Up to 5.0 | Up to 5.0 | Up to 5.0 | TRBDS1 | ||||||||||||||
| Gasoline Direct Injection Compression Ignition (GDCI) | GDCI | Up to 5.0 | Up to 5.0 | Up to 5.0 | TRBDS1 | ||||||||||||||
| Waste Heat Recovery | WHR | Up to 3.0 | Up to 3.0 | Up to 3.0 | Baseline | ||||||||||||||
| Alternative Fuelsc: | |||||||||||||||||||
| CNG-Gasoline Bi-Fuel Vehicle (default UF = 0.5) | BCNG | Up to 5 Incr [42] | Up to 5 Incr [42] | Up to 5 Incr [42] | Baseline | ||||||||||||||
| Flexible Fuel Vehicle (UF dependent, UF = 0.5 thru 2019) | FFV | 0 [40 thru 2019, then UF TBD] | 0 [40 thru 2019, then UF TBD] | 0 [40 thru 2019, then UF TBD] | Baseline | ||||||||||||||
| Ethanol Boosted Direct Injection (CR = 14:1, 43% downsizing) (UF~0.05) | EBDI | 20 [24] | 20 [24] | 20 [24] | Baseline | ||||||||||||||
| Percent Incremental Fuel Consumption Reductions: NRC Estimates | |||||||||||||||||||
| Midsize Car I4 DOHC | Large Car V6 DOHC | Large Light Truck V8 OHV | |||||||||||||||||
| Diesel Engine Technologies | Abbreviation | Most Likely | Most Likely | Most Likely | Relative To | ||||||||||||||
| NHTSA Technologies | |||||||||||||||||||
| Advanced Diesel | ADSL | 29.4 | 30.5 | 29.0 | Baseline | ||||||||||||||
| Other Technologies | |||||||||||||||||||
| Low Pressure EGR | LPEGR | 3.5 | 3.5 | 3.5 | ADSL | ||||||||||||||
| Closed Loop Combustion Control | CLCC | 2.5 | 2.5 | 2.5 | ADSL | ||||||||||||||
| Injection Pressures Increased to 2,500 to 3,000 bar | INJ | 2.5 | 2.5 | 2.5 | ADSL | ||||||||||||||
| Downspeeding with Increased Boost Pressure | DS | 2.5 | 2.5 | 2.5 | ADSL | ||||||||||||||
| Friction Reduction | FR | 2.5 | 2.5 | 2.5 | ADSL | ||||||||||||||
| Waste Heat Recovery | WHR | 2.5 | 2.5 | 2.5 | ADSL | ||||||||||||||
| Transmission Technologies | Abbreviation | Most Likely | Most Likely | Most Likely | Relative To | ||||||||||||||
| NHTSA Technologies | |||||||||||||||||||
| Improved Auto. Trans. Controls/Externals (ASL-1 & Early TC Lockup) | IATC | 2.5 - 3.0 | 2.5 - 3.0 | 2.5 - 3.0 | 4 sp AT | ||||||||||||||
| 6-speed AT with Improved Internals - Lepelletier (Rel to 4 sp AT) | NUATO-L | 2.0 - 2.5 | 2.0 - 2.5 | 2.0 - 2.5 | IATC | ||||||||||||||
| 6-speed AT with Improved Internals - Non-Lepelletier (Rel to 4 sp AT) | NUATO-NL | 2.0 - 2.5 | 2.0 - 2.5 | 2.0 - 2.5 | IATC | ||||||||||||||
| 6-speed Dry DCT (Rel to 6 sp AT - Lepelletier) | 6DCT-D | 3.5 - 4.5 | 3.5 - 4.5 | N/A | 6 sp AT | ||||||||||||||
| 6-speed Wet DCT (Rel to 6 sp AT - Lepelletier) (0.5% less than Dry Clutch) | 6DCT-W | 3.0 - 4.0 | 3.0 - 4.0 | 3.0 - 4.0 | 6 sp AT | ||||||||||||||
| 8-speed AT (Rel to 6 sp AT - Lepelletier) | 8AT | 1.5 - 2.0 | 1.5 - 2.0 | 1.5 - 2.0 | Previous Tech | ||||||||||||||
| 8-speed DCT (Rel to 6 sp DCT) | 8DCT | 1.5 - 2.0 | 1.5 - 2.0 | 1.5 - 2.0 | Previous Tech | ||||||||||||||
| High Efficiency Gearbox Level 1 (Auto) (HETRANS) | HEG1 | 2.3 - 2.7 | 2.3 - 2.7 | 2.3 - 2.7 | Previous Tech | ||||||||||||||
| High Efficiency Gearbox Level 2 (Auto, 2017 and Beyond) | HEG2 | 2.6 - 2.7 | 2.6 - 2.7 | 2.6 - 2.7 | Previous Tech | ||||||||||||||
| Shift Optimizer (ASL-2) | SHFTOPT | 0.5 - 1.0 | 0.5 - 1.0 | 0.5 - 1.0 | Previous Tech | ||||||||||||||
| Secondary Axle Disconnect | SAX | 1.4 - 3.0 | 1.4 - 3.0 | 1.4 - 3.0 | Baseline | ||||||||||||||
| Other Technologies | |||||||||||||||||||
| Continuously Variable Transmission with Improved internals (Rel to 6 sp AT) | CVT | 3.5 - 4.5 | 3.5 - 4.5 | N/A | Previous Tech | ||||||||||||||
| High Efficiency Gearbox (CVT) | CVT-HEG | 3.0 | 3.0 | N/A | Previous Tech | ||||||||||||||
| High Efficiency Gearbox (DCT) | DCT-HEG | 2.0 | 2.0 | 2.0 | Previous Tech | ||||||||||||||
| High Efficiency Gearbox Level 3 (Auto, 2020 and beyond) | HEG3 | 1.6 | 1.6 | 1.6 | Previous Tech | ||||||||||||||
| 9-10 speed Transmission (Auto, Rel to 8 sp AT) | 10SPD | 0.3 | 0.3 | 0.3 | Previous Tech | ||||||||||||||
| Electrified Accessories Technologies | Abbreviation | Most Likely | Most Likely | Most Likely | Relative To | ||||||||||||||
| NHTSA Technologies | |||||||||||||||||||
| Electric Power Steering | EPS | 1.3 | 1.1 | 0.8 | Baseline | ||||||||||||||
| Improved Accessories - Level 1 (70% Eff Alt, Elec. Water Pump and Fan) | IACC1 | 1.2 | 1.0 | 1.6 | Baseline | ||||||||||||||
| Improved Accessories - Level 2 (Mild regen alt strategy, Intelligent cooling) | IACC2 | 2.4 | 2.6 | 2.2 | Previous Tech | ||||||||||||||
| Hybrid Technologies | Abbreviation | Most Likely | Most Likely | Most Likely | Relative To | ||||||||||||||
| NHTSA Technologies | |||||||||||||||||||
| Stop-Start (12V Micro-Hybrid) (Retain NHTSA Estimates) | SS | 2.1 | 2.2 | 2.1 | Baseline | ||||||||||||||
| Integrated Starter Generator | MHEV | 6.5 | 6.4 | 3.0 | Previous Tech | ||||||||||||||
| Strong Hybrid - P2 - Level 2 (Parallel 2 Clutch System) | SHEV2-P2 | 28.9 - 33.6 | 29.4 - 34.5 | 26.9 - 30.1 | Baseline | ||||||||||||||
| Percent Incremental Fuel Consumption Reductions: NRC Estimates | |||||||||||||||||||
| Midsize Car I4 DOHC | Large Car V6 DOHC | Large Light Truck V8 OHV | |||||||||||||||||
| Strong Hybrid - PS - Level 2 (Power Split System) | SHEV2-PS | 33.0 - 33.5 | 32.0 - 34.1 | N/A | Baseline | ||||||||||||||
| Plug-in Hybrid - 40 mile range | PHEV40 | N/A | N/A | N/A | Baseline | ||||||||||||||
| Electric Vehicle - 75 mile | EV75 | N/A | N/A | N/A | Baseline | ||||||||||||||
| Electric Vehicle - 100 mile | EV100 | N/A | N/A | N/a | Baseline | ||||||||||||||
| Electric Vehicle - 150 mile | EV150 | N/A | N/A | N/A | Baseline | ||||||||||||||
| Other Technologies | |||||||||||||||||||
| Fuel Cell Electric Vehicle | FCEV | N/A | N/A | N/A | Baseline | ||||||||||||||
| Vehicle Technologies | Abbreviation | Most Likely | Most Likely | Most Likely | Relative To | ||||||||||||||
| NHTSA Technologies | |||||||||||||||||||
| Without Engine Downsizingd | |||||||||||||||||||
| 0 - 2.5% Mass Reduction (Design Optimization) | MR2.5 | 0.80 | 0.80 | 0.85 | Baseline | ||||||||||||||
| 2.5 - 5% Mass Reduction | 0.81 | 0.81 | 0.85 | Previous MR | |||||||||||||||
| 0 - 5% Mass Reduction (Material Substitution) With Engine Downsizing (Same Architecture)d | MR5 | 1.60 | 1.60 | 1.69 | Baseline | ||||||||||||||
| 5 - 10% Mass Reduction | 4.57 | 4.57 | 2.85 | Previous MR | |||||||||||||||
| 0 - 10% Mass Reduction (HSLA Steel and Aluminum Closures) | MR10 | 6.10 | 6.10 | 4.49 | Baseline | ||||||||||||||
| 10 - 15% Mass Reduction (Aluminum Body) | 3.25 | 3.25 | 2.35 | Previous MR | |||||||||||||||
| 0 - 15% Mass Reduction (Aluminum Body) | MR15 | 9.15 | 9.15 | 6.73 | Baseline | ||||||||||||||
| 15 - 20% Mass Reduction | 3.37 | 3.37 | 2.41 | Previous MR | |||||||||||||||
| 0 - 20% Mass Reduction (Aluminum Body, Magnesium, | MR20 | 12.21 | 12.21 | 8.98 | Baseline | ||||||||||||||
| Composites) | |||||||||||||||||||
| 20 - 25% Mass Reduction | 3.47 | 3.47 | 2.46 | Previous MR | |||||||||||||||
| 0 - 25% Mass Reduction (Carbon Fiber Composite Body) | MR25 | 15.26 | 15.26 | 11.22 | Baseline | ||||||||||||||
| Summary - Mass Reduction Relative to Baseline | |||||||||||||||||||
| 0 - 2.5% Mass Reduction | MR2.5 | 0.80 | 0.80 | 0.85 | Baseline | ||||||||||||||
| 0 - 5% Mass Reduction | MR5 | 1.60 | 1.60 | 1.69 | Baseline | ||||||||||||||
| 0 - 10% Mass Reduction | MR10 | 6.10 | 6.10 | 4.49 | Baseline | ||||||||||||||
| 0 - 15% Mass Reduction | MR15 | 9.15 | 9.15 | 6.73 | Baseline | ||||||||||||||
| 0 - 20% Mass Reduction | MR20 | 12.21 | 12.21 | 8.98 | Baseline | ||||||||||||||
| 0 - 25% Mass Reduction | MR25 | 15.26 | 15.26 | 11.22 | Baseline | ||||||||||||||
| Low Rolling Resistance Tires - Level 1 (10% Reduction) | ROLL1 | 1.9 | 1.9 | 1.9 | Baseline | ||||||||||||||
| Low Rolling Resistance Tires - Level 2 (20% Reduction) | ROLL2 | 2.0 | 2.0 | 2.0 | Previous Tech | ||||||||||||||
| Low Drag Brakes | LDB | 0.8 | 0.8 | 0.8 | Baseline | ||||||||||||||
| Aerodynamic Drag Reduction - Level 1 (10% Reduction) | AERO1 | 2.3 | 2.3 | 2.3 | Baseline | ||||||||||||||
| Aerodynamic Drag Reduction - Level 2 (20% Reduction) | AERO2 | 2.5 | 2.5 | 2.5 | Previous Tech | ||||||||||||||
a Comparable to TRBDS1, TRBDS2, SS, MHEV, IACC1, IACC2.
b With TWC aftertreatment. Costs will increase with lean NOx aftertreatment.
c Fuel consumption reduction in gge (gasoline gallons equivalent) [CAFE fuel consumption reduction].
d FC Reductions – Ricardo 2007. Car without engine downsizing: +3.3% mpg/10% MR = -3.2% FC/10% MR. Car with engine downsizing (for MR > 10%): +6.5% mpg/10%MR = -6.1% FC/10% MR. Truck without engine downsizing: +3.5% mpg/10% MR = -3.4% FC/10% MR. Truck with engine downsizing (for MR > 10%): +4.7% mpg/10%MR = 4.5% FC/10% MR.
NOTE: Midsize car: 3,500 lbs, large car: 4,500 lbs, large light truck: 5,500 lbs.
TABLE S.2 NRC Committee’s Estimated 2025 Direct Manufacturing Costs of Technologies
| 2025 MY Incremental Direct Manufacturing Costs (2010$): NRC Estimates | |||||||||||||||||||
| Midsize Car I4 DOHC | Large Car V6 DOHC | Large Light Truck V8 OHV | |||||||||||||||||
| Spark Ignition Engine Technologies | Abbreviation | Most Likely | Most Likely | Most Likely | Relative To | ||||||||||||||
| NHTSA Technologies | |||||||||||||||||||
| Low Friction Lubricants - Level 1 | LUB1 | 3 | 3 | 3 | Baseline | ||||||||||||||
| Engine Friction Reduction - Level 1 | EFR1 | 48 | 71 | 95 | Baseline | ||||||||||||||
| Low Friction Lubricants and Engine Friction Reduction - | LUB2_EFR2 | 51 | 75 | 99 | Previous Tech | ||||||||||||||
| Level 2 | |||||||||||||||||||
| VVT- Intake Cam Phasing (CCP - Coupled Cam Phasing - OHV) | ICP | 31 - 36 | 63 - 73 | 31 - 36 | Baseline for DOHC | ||||||||||||||
| VVT- Dual Cam Phasing | DCP | 27 - 31 | 61 - 69 | 31 - 36 | Previous Tech | ||||||||||||||
| Discrete Variable Valve Lift | DVVL | 99 - 114 | 143 - 164 | N/A | Previous Tech | ||||||||||||||
| Continuously Variable Valve Lift | CVVL | 49 - 56 | 128 - 147 | N/A | Previous Tech | ||||||||||||||
| Cylinder Deactivation | DEACD | N/A | 118 | 133 | Previous Tech | ||||||||||||||
| Variable Valve Actuation (CCP + DVVL) | VVA | N/A | N/A | 235 - 271 | Baseline for OHV | ||||||||||||||
| Stoichiometric Gasoline Direct Injection | SGDI | 164 | 246 | 296 | Previous Tech | ||||||||||||||
| Turbocharging and Downsizing Level 1 - 18 bar BMEP 33%DS | TRBDS1 | 245 - 282 | -110 to -73 | 788 - 862 | Previous Tech | ||||||||||||||
| V6 to I4 and V8 to V6 | -396* to -316* | 700* - 800* | |||||||||||||||||
| Turbocharging and Downsizing Level 2 - 24 bar BMEP 50%DS | TRBDS2 | 155 | 155 | 261 | Previous Tech | ||||||||||||||
| I4 to I3 | -82* to -86* | ||||||||||||||||||
| Cooled EGR Level 1 - 24 bar BMEP, 50% DS | CEGR1 | 180 | 180 | 180 | Previous Tech | ||||||||||||||
| Cooled EGR Level 2 - 27 bar BMEP, 56% DS | CEGR2 | 310 | 310 | 523 | Previous Tech | ||||||||||||||
| V6 to I4 | -453* to -469* | ||||||||||||||||||
| Other Technologies | |||||||||||||||||||
| By 2025: | |||||||||||||||||||
| Compression Ratio Increase (with regular fuel) | CRI-REG | 50 | 75 | 100 | Baseline | ||||||||||||||
| Compression Ratio Increase (with higher octane regular fuel) | CRI-HO | 75 | 113 | 150 | Baseline | ||||||||||||||
| Compression Ratio Increase (CR~13:1, exh. scavenging, DI (aka Skyactiv, Atkinson Cycle)) | CRI-EXS | 250 | 375 | 500 | Baseline | ||||||||||||||
| Electrically Assisted Variable Speed Supercharger | EAVS-SC | 1,302 | 998 | N/A | Baseline | ||||||||||||||
| Lean Burn (with low sulfur fuel) | LBRN | 800 | 920 | 1,040 | Baseline | ||||||||||||||
| After 2025: | |||||||||||||||||||
| Variable Compression Ratio | VCR | 597 | 687 | 896 | Baseline | ||||||||||||||
| D-EGR | DEGR | 667 | 667 | 667 | TRBDS1 | ||||||||||||||
| Homogeneous Charge Compression Ignition (HCCI) + Spark Assisted CIa | SA-HCCI | 450 | 500 | 550 | TRBDS1 | ||||||||||||||
| Gasoline Direct Injection Compression Ignition | GDCI | 2,500 | 2,875 | 3,750 | Baseline | ||||||||||||||
| Waste Heat Recovery | WHR | 700 | 805 | 1,050 | Baseline | ||||||||||||||
| Alternative Fuels: | |||||||||||||||||||
| CNG-Gasoline Bi-Fuel Vehicle | BCNG | 6,000 | 6,900 | 7,800 | Baseline | ||||||||||||||
| Flexible Fuel Vehicle | FFV | 75 | 100 | 125 | Baseline | ||||||||||||||
| Ethanol Boosted Direct Injection (incr CR to 14:1, 43% downsizing) | EBDI | 740 | 870 | 1,000 | Baseline | ||||||||||||||
| 2025 MY Incremental Direct Manufacturing Costs (2010$): NRC Estimates | |||||||||||||||||||
| Midsize Car I4 DOHC | Large Car V6 DOHC | Large Light Truck V8 OHV | |||||||||||||||||
| Diesel Engine Technologies | Abbreviation | Most Likely | Most Likely | Most Likely | Relative To | ||||||||||||||
| NHTSA Technologies | |||||||||||||||||||
| Advanced Diesel | ADSL | 2,572 | 3,034 | 3,228 | Baseline | ||||||||||||||
| Other Technologies | |||||||||||||||||||
| Low Pressure EGR | LPEGR | 113 | 141 | 141 | ADSL | ||||||||||||||
| Closed Loop Combustion Control | CLCC | 58 | 87 | 87 | ADSL | ||||||||||||||
| Injection Pressures Increased to 2,500 to 3,000 bar | INJ | 20 | 22 | 22 | ADSL | ||||||||||||||
| Downspeeding with Increased Boost Pressure | DS | 24 | 24 | 24 | ADSL | ||||||||||||||
| Friction Reduction | FR | 54 | 82 | 82 | ADSL | ||||||||||||||
| Waste Heat Recovery | WHR | 700 | 805 | 1,050 | ADSL | ||||||||||||||
| Transmission Technologies | Abbreviation | Most Likely | Most Likely | Most Likely | Relative To | ||||||||||||||
| NHTSA Technologies | |||||||||||||||||||
| Improved Auto. Trans. Controls/Externals (ASL-1 & Early TC Lockup) | IATC | 42 | 42 | 42 | Baseline 4 sp AT | ||||||||||||||
| 6-speed AT with Improved Internals - Lepelletier (Rel to 4 sp AT) | NUATO-L | -11 | -11 | -11 | IATC | ||||||||||||||
| 6-speed AT with Improved Internals - Non-Lepelletier (Rel to 4 sp AT) | NUATO-NL | 165 | 165 | 165 | IATC | ||||||||||||||
| 6-speed Dry DCT (Rel to 6 sp AT - Lepelletier) | 6DCT-D | -127 to 26 | -127 to 26 | N/A | 6 sp AT | ||||||||||||||
| 6-speed Wet DCT (Rel to 6 sp AT - Lepelletier) | 6DCT-W | -75 to 75 | -75 to 75 | -75 to 75 | 6 sp AT | ||||||||||||||
| 8-speed AT (Rel to 6 sp AT - Lepelletier) | 8AT | 47 - 115 | 47 - 115 | 47 - 115 | Previous Tech | ||||||||||||||
| 8-speed DCT (Rel to 6 sp DCT) | 8DCT | 152 | 152 | 152 | Previous Tech | ||||||||||||||
| High Efficiency Gearbox Level 1 (Auto) (HETRANS) | HEG1 | 102 | 102 | 102 | Previous Tech | ||||||||||||||
| High Efficiency Gearbox Level 2 (Auto, 2017 and Beyond) | HEG2 | 165 | 165 | 165 | Previous Tech | ||||||||||||||
| Shift Optimizer (ASL-2) | SHFTOPT | 22 | 22 | 22 | Previous Tech | ||||||||||||||
| Secondary Axle Disconnect | SAX | 86 | 86 | 86 | Baseline | ||||||||||||||
| Other Technologies | |||||||||||||||||||
| Continuously Variable Transmission with Improved internals (Rel to 6 sp AT) | CVT | 154 | 154 | NA | Baseline | ||||||||||||||
| High Efficiency Gearbox (CVT) | CVT-HEG | 107 | 107 | NA | Baseline | ||||||||||||||
| High Efficiency Gearbox (DCT) | DCT-HEG | 127 | 127 | 127 | Baseline | ||||||||||||||
| High Efficiency Gearbox Level 3 (Auto, 2020 and beyond) | HEG3 | 128 | 128 | 128 | Baseline | ||||||||||||||
| 9-10 speed Transmission (Auto, Rel to 8 sp AT) | 10SPD | 65 | 65 | 65 | Baseline | ||||||||||||||
| Electrified Accessories Technologies | Abbreviation | Most Likely | Most Likely | Most Likely | Relative To | ||||||||||||||
| NHTSA Technologies | |||||||||||||||||||
| Electric Power Steering | EPS | 74 | 74 | 74 | Baseline | ||||||||||||||
| Improved Accessories - Level 1 (70% Eff Alt, Elec. Water Pump and Fan) | IACC1 | 60 | 60 | 60 | Baseline | ||||||||||||||
| Improved Accessories - Level 2 (Mild regen alt strategy, Intelligent cooling) | IACC2 | 37 | 37 | 37 | Previous Tech | ||||||||||||||
| Hybrid Technologies | Abbreviation | Most Likely | Most Likely | Most Likely | Relative To | ||||||||||||||
| NHTSA Technologies | |||||||||||||||||||
| Stop-Start (12V Micro-Hybrid) | SS | 225 - 275 | 255 - 305 | 279 - 329 | Baseline | ||||||||||||||
| Integrated Starter Generator | MHEV | 888 - 1,018 | 888 - 1,115 | 888 - 1,164 | Previous Tech | ||||||||||||||
| Strong Hybrid - P2 - Level 2 (Parallel 2 Clutch System) | SHEV2-P2 | 2,041 - 2,588 | 2,410 - 3,086 | 2,438 - 3,111 | Baseline | ||||||||||||||
| 2025 MY Incremental Direct Manufacturing Costs (2010$): NRC Estimates | |||||||||||||||||||
| Midsize Car I4 DOHC | Large Car V6 DOHC | Large Light Truck V8 OHV | |||||||||||||||||
| Strong Hybrid - PS - Level 2 (Power Split System) | SHEV2-PS | 2,671 | 2,889 | N/A | Baseline | ||||||||||||||
| Plug-in Hybrid - 40 mile range | PHEV40 | 8,325 - 9,672 | 11,189 - 13,135 | N/A | Baseline | ||||||||||||||
| Electric Vehicle - 75 mile | EV75 | 8,451 - 8,963 | 11,025 - 11,929 | N/A | Baseline | ||||||||||||||
| Electric Vehicle - 100 mile | EV100 | 9,486 | 11,971 | N/A | Baseline | ||||||||||||||
| Electric Vehicle - 150 mile | EV150 | 12,264 | 14,567 | N/A | Baseline | ||||||||||||||
| Other Technologies | |||||||||||||||||||
| Fuel Cell Electric Vehicle | FCEV | N/A | N/A | N/A | |||||||||||||||
| Vehicle Technologies | Abbreviation | Most Likely | Most Likely | Most Likely | Relative To | ||||||||||||||
| NHTSA Technologies | |||||||||||||||||||
| Without Engine Downsizing | |||||||||||||||||||
| 0 - 2.5% Mass Reduction (Design Optimization) | MR2.5 | 0 - 22 | 0 - 28 | 0 - 39 | Baseline | ||||||||||||||
| 2.5 - 5% Mass Reduction | 0 - 66 | 0 - 85 | 0 - 112 | Previous MR | |||||||||||||||
| 0 - 5% Mass Reduction (Material Substitution) | MR5 | 0 - 88 | 0 - 113 | 0 - 151 | Baseline | ||||||||||||||
| With Engine Downsizing (Same Architecture)b | |||||||||||||||||||
| 5 - 10% Mass Reduction | 151 - 315 | 194 - 405 | 264 - 558 | Previous MR | |||||||||||||||
| 0 - 10% Mass Reduction (HSLA Steel and Aluminum Closures) | MR10 | 151 - 403 | 194 - 518 | 264 - 710 | Baseline | ||||||||||||||
| 10 - 15% Mass Reduction (Aluminum Body) | 431 - 730 | 554 - 938 | 751 - 1,279 | Baseline | |||||||||||||||
| 0 - 15% Mass Reduction (Aluminum Body) | MR15 | 431 - 730 | 554 - 938 | 751 - 1,279 | Baseline | ||||||||||||||
| 15 - 20% Mass Reduction | 486 - 600 | 626 - 772 | 866 - 1,064 | Previous MR | |||||||||||||||
| 0 - 20% Mass Reduction (Aluminum Body, Magnesium, Composites) | MR20 | 917 - 1,330 | 1,179 - 1,710 | 1,617 - 2,343 | Baseline | ||||||||||||||
| 20 - 25% Mass Reduction | 1,026 - 1,260 | 1,319 - 1,620 | 1,807 - 1,947 | Previous MR | |||||||||||||||
| 0 - 25% Mass Reduction (Carbon Fiber Composite Body) | MR25 | 1,943 - 2,590 | 2,498 - 3,330 | 3,424 - 4,290 | Baseline | ||||||||||||||
| Mass Reduction Cost ($ per lb.) | |||||||||||||||||||
| 0 - 2.5% Mass Reduction | MR2.5 | 0.00 - 0.25 | 0.00 - 0.25 | 0.00 - 0.28 | Baseline | ||||||||||||||
| 0 - 5% Mass Reduction | MR5 | 0.00 - 0.49 | 0.00 - 0.49 | 0.00 - 0.55 | Baseline | ||||||||||||||
| 0 - 10% Mass Reduction | MR10 | 0.43 - 1.15 | 0.43 - 1.15 | 0.48 - 1.29 | Baseline | ||||||||||||||
| 0 - 15% Mass Reduction | MR15 | 0.82 - 1.39 | 0.82 - 1.39 | 0.91 - 1.55 | Baseline | ||||||||||||||
| 0 - 20% Mass Reduction | MR20 | 1.31 - 1.90 | 1.31 - 1.90 | 1.47 - 2.13 | Baseline | ||||||||||||||
| 0 - 25% Mass Reduction | MR25 | 2.22 - 2.96 | 2.22 - 2.96 | 2.49 - 3.12 | Baseline | ||||||||||||||
| Low Rolling Resistance Tires - Level 1 (10% reduction in rolling resistance) | ROLL1 | 5 | 5 | 5 | Baseline | ||||||||||||||
| Low Rolling Resistance Tires - Level 2 (20% reduction in rolling resistance) | ROLL2 | 31 | 31 | 31 | Previous Tech | ||||||||||||||
| Low Drag Brakes | LDB | 59 | 59 | 59 | Baseline | ||||||||||||||
| Aerodynamic Drag Reduction - Level 1 | AERO1 | 33 | 33 | 33 | Baseline | ||||||||||||||
| Aerodynamic Drag Reduction - Level 2 | AERO2 | 100 | 100 | 100 | Previous Tech | ||||||||||||||
* Costs with reduced number of cylinders, adjusted for previously added technologies – see Appendix T for the derivation of the turbocharged, downsized engine costs.
a With TWC aftertreatment. Costs will increase with lean NOx aftertreatment.
b Includes mass decompounding: 40% for cars, 25% for trucks.
NOTE: Midsize car: 3 500 lbs large car: 4 500 lbs large light truck: 5 500 lbs.
that the combined SI engine technologies would provide overall fuel consumption reduction close to that estimated by NHTSA but with as much as 15 percent higher direct manufacturing costs for several of the technologies. The committee notes that the cost and effectiveness of SI engine technologies are complicated by several factors: the limitations on compression ratio due to currently available octane levels; the tradeoffs between drivability and fuel economy; and the impact of power-to-weight ratio on effectiveness. A separate concern is the degree to which the technologies used to meet the fuel economy standards will increase the relative deviation of real-world fuel economy from CAFE compliance values.
There are also new technologies not considered by EPA and NHTSA that might provide additional fuel consumption reductions for SI engines, or provide alternative approaches by 2025 and beyond. These technologies include higher compression ratio, exhaust scavenging, lean burn, and electrically assisted supercharger approaches and alternative fuels such as compressed natural gas-gasoline bi-fuel engines and ethanol-boosted direct injection engines.
Recommendations: Since spark-ignition engines are expected to be dominant beyond 2025, updated effectiveness and cost estimates of the most effective spark-ignition engine technologies should be developed for the mid-term review of the CAFE standards. Updated effectiveness estimates should be derived from full system simulations using engine maps based on measured data or generated engine model maps derived from validated baselines and include models for fuel octane requirements and drivability. Updated cost estimates using teardown cost studies of recently introduced spark-ignition engine technologies, including all vehicle integration costs, should be developed to support the mid-term review (Recommendation 2.1; Recommendation 2.2).
COMPRESSION-IGNITION ENGINES
Compression-ignition (CI) engines fueled by diesel have the highest thermodynamic efficiency of all internal combustion engine types. Compared to SI engines, CI engines possess three major benefits: lean-burn fuel mixtures, lack of air intake throttling, and higher compression ratios. In addition, diesel fuel has a higher energy content, due to a higher carbon content, than comparable volumes of gasoline so fewer gallons of fuel are used to provide identical work. Diesel’s higher carbon content results in 15 percent more CO2 per gallon burned than gasoline. This relative carbon emissions increase is one reason why manufacturers might not invest significantly in diesel technologies to comply with the National Program standards. The EPA/NHTSA compliance demonstration path included a vehicle fleet that had less than one percent diesel vehicles in 2025. The committee notes, however, that diesel vehicle product offerings and sales have increased recently.
CI engines provide large reductions in fuel consumption relative to baseline naturally aspirated SI engines with a higher cost and price, but with a lower total cost of ownership. While the committee agreed with the Agencies’ fuel consumption reduction estimates, it found that the current EPA fuel economy certification data did not bear this out. However, in the future, CI engines will have even lower fuel consumption, most likely from applying higher levels of turbocharging with downsizing-downspeeding, improvements in closed-loop combustion control, and higher fuel injection pressures. Challenges for diesel vehicles to meet new emission standards for particulate matter, nitrogen oxides, and volatile organic compounds have prompted the development of improved aftertreatment systems that may reduce both the costs and size of the systems.
Recommendation: EPA and NHTSA should expand their full system simulations supported by mapping the latest diesel engines that incorporates as many of the latest technologies discussed in Chapter 3 as possible. EPA and NHTSA should conduct a teardown cost study of a modern diesel engine with the latest technologies to provide an up-to-date estimate of diesel engine costs. The teardown study should evaluate all costs, including vehicle integration, which includes the cooling system; torsional vibration damper; electrical systems, which include starter motors, batteries, and alternators; noise, vibration, and harshness control technologies; and vehicle costs resulting from the increased weight of the diesel engine. The study should also include an analysis of the increased residual value of a diesel-powered vehicle (Recommendation 3.1).
HYBRID AND ELECTRIFIED POWERTRAINS
Electrification of the powertrain is a powerful method to reduce fuel consumption and GHG emissions. Electrification ranges from hybrid electric vehicles (HEVs) to plug-in electric vehicles (PEVs)5 to fuel cell electric vehicles (FCEVs). Fully realizing the GHG emission benefits from increased electrification in PEVs or FCEVs requires concomitant changes in the fuel mix for electricity generation or a low carbon source for hydrogen. The committee generally agrees with the Agencies’ estimates of fuel consumption benefits for HEVs, but has concerns about the regulatory treatment of the GHG emissions from the generation of electricity for BEVs and PHEVs.
The committee finds that the battery cost estimates used by the Agencies are broadly accurate while the cost of the non-battery elements may be too low. The Agencies determined that an emerging HEV design, the P2, is likely to be the dominant strong hybrid technology based on projected cost and effectiveness versus the currently-dominant
_____________
5 PEVs include both plug-in hybrid vehicles (PHEVs) and pure battery electric vehicles (BEVs).
power split design.6 However, the committee found that the Agencies made critical assumptions about implementation of the P2 design that need to be revised, particularly the size of the motor and technologies required for launch performance and consumer comfort.
Battery cost is the dominant cost for PEVs and is a function of energy and power requirements, battery chemistry and required battery life. The committee finds that real-world battery life validation data do not exist beyond simulations and accelerated aging tests, so the appropriate state of charge swing to meet the prevalent electric powertrain warranty of 8 years and 100,000 miles is unknown. Meeting and exceeding this battery lifetime is important because the cost for a replacement battery pack is large.
Although current penetration is low, the use of electrification is likely to increase. In the opinion of the committee, the penetration of strong HEVs, PHEVs, and BEVs by MY 2025 will be larger than the respective 5%, 0% and 2% that the Agencies included in their compliance demonstration path. California Zero Emissions Vehicle mandates may require a higher penetration of the PEVs than included in the Agencies’ compliance demonstration path. The committee believes that fuel cell electric vehicles will have minimal impact on CAFE compliance to 2025, but may play a bigger role in 2030 and beyond.
Recommendations: For their mid-term review, the Agencies should examine auto manufacturers’ experiences of battery life to determine the appropriate state of charge swing for PHEVs and BEVs so that they can assign costs appropriately (Recommendation 4.2). The Agencies should undertake a teardown study of the next generation PS and P2 architectures to update cost and full system simulation of P2 and PS architectures to update effectiveness (Recommendation 4.3). Further, at the time of the mid-term review, there will be several vehicles with electrified powertrains in the market. The Agencies should commission teardown studies of the most successful examples of (1) stop-start, (2) strong hybrids (PS, P2, and two motor architectures), (3) PHEV20 and PHEV40, and (4) BEV100. At that time there will be better estimates of volumes for each type in the 2020 to 2025 time frame so that a better estimate of cost can be calculated (Recommendation 4.4).
TRANSMISSIONS
Transmission design reduces fuel consumption through increasing the number of gears, allowing the engine to operate closer to its best efficiency condition, and by minimizing parasitic losses within transmission architecture. Some technologies, such as turbocharged, downsized engines, require transmission design changes to maintain launch behavior and overcome the acceleration lag that accompanies such engines. The most popular transmission design is the planetary automatic transmission (AT), which is expected to remain the dominant architecture in the US in the 2025 timeframe; however, the market will transition from today’s typical 6-speed AT to 8- to 10-speed AT designs. Dual-clutch transmissions (DCTs) can reduce parasitic losses by 40 to 60 percent relative to current automatic transmissions, but may have a lower market penetration than estimated by the Agencies’ compliance demonstration path. Continuously variable transmissions (CVTs) provide continuously variable gear ratios to improve efficiency. The committee believes CVTs will experience higher market penetration than assumed in the Agencies’ compliance demonstration path.
Negative synergies7 between engine and transmission technologies could reduce the expected effectiveness of certain transmission technologies. For example, the efficiency gains from turbocharged and downsized engines reduce some efficiency gains from increased transmission gears since both technologies focus on reducing engine pumping and friction losses. The committee finds that achieving the fuel consumption reduction the Agencies attribute to moving to 8- and 9-speed transmissions would require a combination of high efficiency gearbox technologies, torque converter lockup, and aggressive shift logic. Current analyses of increasing the number of gear ratios have found minimal gains beyond 7 gear ratios; however, reducing parasitic losses within a transmission can offer an approximate 5 percent reduction in fuel consumption in the 2025 timeframe.
Recommendations: NHTSA and EPA should add the CVT to the list of technologies applicable for the 2017-2025 CAFE standards. (Recommendation 5.2). NHTSA and EPA should update the analyses of technology penetration rates for the midterm review to reflect the anticipated low DCT penetration rate in the U.S. market (Recommendation 5.1).
NON-POWERTRAIN TECHNOLOGIES
There are many opportunities outside of the vehicle’s powertrain to adopt fuel-saving technologies. The committee considered mass reduction, aerodynamics, tires, vehicle accessories (such as power steering and heating/air conditioning systems) and the rapidly developing area of vehicle automation systems.
_____________
6 The P2 hybrid uses a clutch connecting a single electrical machine and engine crankshaft, and incorporates a conventional transmission. As discussed in Chapter 4, the P2 architecture has an inherent design advantage over the power split in that there is no double energy conversion during certain operating conditions that occurs in the power split design.
7 The committee uses synergies to mean that the effect of two or more technologies applied together may produce a result not obtainable by simply adding the effect of the individual technologies. Thus, the combination of technologies may produce either negative synergies, meaning the sum of the effects of the technologies is less than the impact of the individual technologies, or positive synergies, meaning the sum of the effects of the technologies is greater than the impact of the individual technologies.
The committee finds the levels of mass reduction assumptions identified in the EPA/NHTSA compliance demonstration path to be overly conservative for midsize and large cars. Even with additional mass required for safety improvements, the industry is likely to implement mass reduction of 10 to 20 percent in passenger vehicles, which is higher than what is in the Agencies’ compliance demonstration path. In a few cases with specialty vehicles, greater than 20 percent could be achieved using advanced materials and new design strategies. For light-trucks, 15 to 20 percent reductions are expected. By taking mass reduction into account early in vehicle design, even more benefits can be achieved by drivetrain optimization and decompounding.8 The committee found that the costs of mass reduction range from the Agencies estimates to much higher costs, and it concurs with the Agencies’ assertion that incremental costs are likely to increase as more mass is removed from a vehicle design.
There have been several excellent teardown studies to help assess the opportunities and cost for reducing mass in vehicles, but there has been little attention given to interpreting how best to use the results. The committee feels that these studies are hard to generalize and future teardowns would benefit from careful selection of vehicles that are representative of their class.
It is the committee’s view that mass will be reduced across all vehicle sizes with proportionately more mass removed from heavier vehicles. The most current studies that analyze the relationships among vehicle footprint, mass, and safety support the argument that removing mass across the fleet in this manner while keeping vehicle footprints constant will have a beneficial effect on safety for society as a whole.9 Additionally, with the introduction of improved crash simulation and vehicle design techniques, new materials, and crash avoidance technology (such as lane change warning and autonomous frontal braking), crashworthiness and crash avoidance should be improved. During the transition period when vehicle masses are being reduced, there could be a negative impact on safety due to variance in the distribution of the mass across the vehicle fleet.
Recommendation: The committee recommends that the Agencies augment their current work with a materials-based approach that looks across the fleet to better define opportunities and costs for implementing lightweighting techniques, especially in the area of decompounding. A characterization of current vehicles in terms of materials content is a prerequisite for such a materials-based approach and for quantifying the opportunities to incorporate different lightweighting materials in the fleet (Recommendation 6.3).
COST AND MANUFACTURING CONSIDERATIONS
The committee notes that technology and design changes will impact the indirect costs of firms. In theory, the committee agrees with the Indirect Cost Multiplier (ICM) method as it attempts to assign indirect costs to products based on the activities they require, as opposed to assuming identical indirect cost multipliers for all technologies as with the Retail Price Equivalent. However, attribution for these indirect costs can be ambiguous, especially for future costs, and it was not possible for this committee to validate the Agencies’ ICMs. The committee also notes that the method used by the agencies to estimate how costs change with increasing production volume is unconventional in that it is strictly a function of time rather than cumulative production. Such an approach allows a technology to accomplish significant cost reductions even if its production volumes remain very low.
The product development process of auto manufacturers is accelerating for several reasons, including the need to implement new technologies faster to meet the steadily increasing CAFE/GHG standards. More rapid deployment, although better for meeting regulations and responding to consumer demands, will increase stranded capital and incur higher product deployment costs. Further complicating the deployment of new technologies is the growth of global platforms. The movement by manufacturers towards global platforms can be considered a constraint, especially in the short term where supply chains are not fully developed, as well as an opportunity, especially in the long term where scale economies can provide cost reductions.
Recommendation: The Agencies should continue research on indirect cost multipliers with the goal of developing a sound empirical basis for their estimation (Recommendation 7.1). The committee also recommends that the Agencies continue to conduct and review empirical evidence for the cost reductions that occur in the automobile industry with volume, especially for large volume technologies that will be relied on to meet the CAFE/GHG standards (Recommendation 7.2).
CONSUMER IMPACTS AND ACCEPTANCE ISSUES
A critical element for the success of the National Program is how consumers respond to the more fuel efficient vehicles of the future. This requires understanding trends in the new vehicle market as well as consumer reaction to new technology for fuel economy. There have been substantial improvements in vehicle technology over time, with increases in mass, horsepower, and acceleration during the period of flat fuel economy standards from 1985 to 2005, and increases
_____________
8 Mass decompounding is the opportunity for additional, or secondary, mass reduction in a vehicle’s design based on the new specifications of the newly designed vehicle following the initial, or primary, implemented mass reductions.
9 In this report, societal risk is used to describe the statistical probability of a fatality occurring for the occupants of the subject vehicle, the occupants of any involved vehicle(s), and any pedestrians or cyclists involved in a given crash. Personal risk, or occupant risk, is the statistical probability of a fatality occurring for only the occupants of the subject vehicle.
in average fuel economy and performance since 2006. The committee noted that vehicle segments are changing in response to consumer preferences, such as a shift away from truck-based sport utility vehicles towards more fuel-efficient car-based crossover utility vehicles. Other changes may be more driven by regulations to improve fuel economy. There is evidence that consumers will not widely adopt technologies that interfere with driver experience, comfort or perceived utility even for large improvements in fuel economy.
Regulatory efficiency and consumer benefit are further related to how consumers value fuel economy and other vehicle attributes. The extent to which consumers undervalue fuel economy (the energy paradox) in new car purchases remains a subject of debate with empirical evidence mixed on the overall magnitude of consumers’ unwillingness to make energy-efficient investments even when those investments appear to have short payback periods. Consumer response is likely diverse, but the committee finds that manufacturers perceive that consumers require relatively short payback periods of one to four years for fuel economy improvements.
Recommendations: The committee recommends that the Agencies do more research on the existence and extent of the energy paradox in fuel economy, the reasons for consumers’ undervaluation of fuel economy relative to its discounted expected present value, and differences in consumers’ perceptions across the population (Recommendation 9.1). The Agencies should study the value of vehicle attributes to consumers, consumer willingness to trade off other attributes for fuel economy, and the likelihood of consumer adoption of new, unfamiliar technologies in the vehicle market (Recommendation 9.3). The Agencies should also conduct more research on the existence and extent of supply-side barriers to long-term investments in fuel economy technologies (Recommendation 9.2).
ASSESSMENT OF CAFE PROGRAM METHODOLOGY AND DESIGN
The committee found that the National Program standards adopted for the MY 2017-2021 and proposed through 2025 are different from the earlier CAFE standards in a number of important ways, including the development of combined fuel economy and GHG standards and added flexibility for manufacturer compliance through credit markets. These standards also continue the use of the footprint-based metric that began with the MY 2008-2011 fuel economy standards for light trucks. The committee appreciates the difficulty of developing a single national program for reducing LDV petroleum consumption and GHG emissions and commends the Agencies for their combined efforts. An important motivation for adopting a standard based on vehicle footprint (the vehicle’s wheelbase times the average track width) is to be safety-neutral. The committee found the empirical evidence from historical data appears to support the argument that the new footprint-based standards are likely to have little effect on vehicle and overall highway safety.
There has long been recognition that the existing two-cycle certification tests used for fuel economy compliance and GHG emissions are not accurate representations of real-world driving behavior. The 5-cycle test procedure appears to provide a better representation of the range of real-world driving conditions. Additionally, there is no comprehensive source of information on the real-world fuel economy of light-duty vehicles to assess the gap between real-world fuel economy and the certification values, and this relationship may change in the future as vehicle technologies change.
Other important elements of the current standards are the treatment of alternative fuel vehicles and assessment of technology improvements that would occur in the absence of the standards. The 2017-2025 CAFE/GHG standards use a variety of incentives to spur production of alternative fuel vehicles including natural gas and electric vehicles, which have potential for greatly reduced oil use. These incentives include the CAFE program use of a 0.15 divisor for the fuel economy of alternative fuel vehicles and the GHG program use of sales multipliers and temporary zero emissions treatment. These incentives are more consistent with the reduced petroleum use of alternative fuel vehicles and less consistent with GHG benefits of all alternative fuels. Additionally, the Agencies’ analyses assume a reference case for which no fuel economy is added after the 2016 MY. Assuming there is continued technology improvement after 2016, and it does not go to fuel economy in the reference (no-additional standards) case, then the improvements would go to enhance other vehicle attributes.
Recommendations: The Agencies should monitor the effects of the CAFE/GHG standards by collecting data on fuel efficiency, vehicle footprint, fleet size mix, and price of new vehicles to understand the impact of the rules on consumers’ choices and manufacturers’ products offered (Recommendation 10.1). The Agencies, perhaps in collaboration with other federal agencies, should conduct an on-going, scientifically-designed survey of the real-world fuel economy of light-duty vehicles. The survey should also collect information on real-world driving behavior and driving cycles. This information will be useful in determining the adequacy of the current test cycle and could inform the establishment of improved, future (post 2025) test cycles, if necessary (Recommendation 10.2). The Agencies should consider how to develop a reference case for the analysis of societal costs and benefits that includes accounting for the potential opportunity costs of the standards in terms of alternative vehicle attributes forgone (Recommendation 10.7). The midterm review is also a time when the Agencies should consider how the credit markets are different between the CAFE and GHG rules, and what the implications of these differences are for the auto manufacturers (Recommendation 10.8).
Further, the committee recommends that the Agencies study the potential benefits, costs and risks of establishing a standard based on a single metric that achieves both GHG and petroleum reductions in addition to continued efforts to harmonize the two regulations (Recommendation 10.12). Permanent regulatory treatment of alternative fuel vehicles should be commensurate with their well-to-wheels GHG and petroleum reduction benefits (Recommendation 10.6).


